Article

Identification and Characterization of GYS and GSK3β Provides Insights into the Regulation of Glycogen Synthesis in Jinjiang Oyster Crassostrea ariakensis

1
Key Laboratory of Sustainable Development of Marine Fisheries, Ministry of Agriculture and Rural Affairs, Yellow Sea Fisheries Research Institute, Chinese Academy of Fishery Sciences, Qingdao 266071, China
2
Laboratory for Marine Fisheries Science and Food Production Processes, Qingdao National Laboratory for Marine Science and Technology, Qingdao 266071, China
3
Changdao Enhancement and Experiment Station, Chinese Academy of Fishery Sciences, Yantai 265800, China
*
Author to whom correspondence should be addressed.
Fishes 2023, 8(2), 65; https://doi.org/10.3390/fishes8020065
Submission received: 24 November 2022 / Revised: 12 January 2023 / Accepted: 19 January 2023 / Published: 21 January 2023
(This article belongs to the Special Issue Mollusk Genetic Diversity and Breeding Technology)

Abstract

:
Glycogen, a stored form of glucose, is an important form of energy for aquatic shellfish, contributing to the flavor and quality of the oyster. The glycogen synthase (GYS) and glycogen synthase kinase 3β (GSK3β) are two major enzymes in the glycogenesis. However, the information of the two genes in the Jinjiang oyster Crassostrea ariakensis remains limited. In this study, we identified the genes of GYS and GSK3β and further explored their function in the glycogen synthesis of C. ariakensis. The GYS and GSK3β were distributed in all tested tissues, and high expression of GYS and glycogen content were detected in the gonad, labial palp, hepatopancreas, and mantle, while the high expression of GSK3β was observed in the gill and adductor muscle. The expression of GYS was positively correlated with the glycogen content, while GSK3β was negatively correlated. Additionally, knockdown of GSK3β using RNAi decreased the GYS expression, revealing the negative regulatory effect of GSK3β on GYS. These findings enrich the research data of GSK3β and GYS involved in glycogen synthesis, providing valuable information for further research on the function of GSK3β and GYS in the glycogen synthesis process of oyster.

1. Introduction

The Jinjiang oyster, Crassostrea ariakensis, is a marine bivalve that is widely distributed in the estuarine areas of along the coast of China, ranging from the Lizijiang to Beihai [1]. Due to its high adaptability to changes in salinity and temperature [1,2], C. ariakensis is a suitable species for the aquaculture industry. As seafood, oysters are popular in the market because of their delicious taste and rich nutrition. Previous studies have shown that oysters contain high levels of protein, glycogen, and lipids [3]. Among them, the glycogen content is an important quality trait, accounting for 20–40% of the dry weight of oysters, which directly affects the flavor of oysters [4].
Glycogen, a stored form of glucose, is an important form of energy for almost all organisms from yeast to primates, storing and supplying energy for life [5]. In most shellfish, glycogen is also the most direct and effective energy reserve for the metabolism [6,7,8]. In addition, glycogen not only affects the taste of oyster but is also involved in many biological processes including reproduction, stress response, and gonadal development [9,10,11,12]. As an important quality trait, glycogen has received more and more attention in the field of aquatic animal genetics and breeding. Glycogen metabolism is highly conserved across species and it contains two major metabolic pathways, namely glycogenesis and glycogenolysis [13,14]. The two processes are efficiently regulated by multiple key enzymes such as glycogen phosphorylase (GP), glycogen synthase (GYS), glycogen synthase kinase 3β (GSK3β), the glycogen debranching enzyme (GD), and the glycogen branching enzyme (GB). Of them, GYS and GSK3β are the two major enzymes in the glycogenesis. As the critical enzymes regulating glycogenesis, GYS mainly synthesizes the α-1,4-glycosidic in glycogen linkages with UDP-glucose, while the glycogen branching enzyme forms α-1,6-glycosidic branchpoints. It exists in organisms in two forms, including the active nonphosphorylated form (D type) and the inactive phosphorylated form (I type), which can be converted into each other. Moreover, GSK3β, a threonine/serine protein kinase, can inactivate GYS by the phosphorylation of serine residues [15], thereby participating in metabolic reactions [16,17,18].
The rapid development of molecular biology technology makes the study of important functional genes more in-depth. In vertebrates, studies regarding glycogen metabolism related genes have been widely carried out in humans, mice, sheep, chickens, fish, etc [9,10,11,12]. More and more studies on the genes involved in glycogen metabolism in oysters have been conducted. Bacca et al. cloned the GP and GYS genes in C.gigas and found their expression changed in a pattern correlated with seasonal variation in glycogen content [19]. Additionally, the genes glycogenin and protein phosphatase 1 regulatory subunit 3B (PPP1R3B) are newly reported to be involved in glycogen metabolism in C. gigas, and their expression also shows seasonal variations in the gonad [20,21]. The GYS and its regulator GSK3β in C. angulate were also found to express closely related to the reproductive cycle [22]. Coincidentally, the glycogen content of oysters is strongly correlated with the reproductive cycle [23]. All of this suggests that the GYS and GSK3β play important roles in glycogen metabolism.
Recently, the glycogen content of C. ariakensis from different locations and developmental stages were detected, and many genes were also well-annotated in the C. ariakensis chromosome-level genome [24,25]. However, the genetic characteristics of GYS and GSK3β and their regulatory roles in glycogen metabolism are poorly understood. Therefore, in this study, we identified the GYS and GSK3β, examined their spatiotemporal expression model, analyzed the relationship between mRNA expression and glycogen content, and explored the regulatory effect of GSK3β on GYS by RNA interference (RNAi). These results provide valuable information for us to better understand the role of GSK3β and GYS in the glycogen metabolism of shellfish.

2. Materials and Methods

2.1. Oyster Collection and Sampling

The oysters C. ariakensis used in the experiment were collected monthly for one year (August 2019 to August 2020) from the Dongying sea area of Shandong Province, with 20–30 individuals (average shell height = 213.8 ± 50.5 mm; average wet weight = 737.1 ± 325.3 g) each time. The oysters obtained from the sea were transported to the laboratory for cleaning, and the phenotypic traits, including shell height, shell length, shell width, body weight, and meat weight, were measured. Six tissues, including the mantle, gill, lip, gonad, hepatopancreas, and adductor muscle, were dissected with two repetitions from each individual, quickly frozen in liquid nitrogen, and stored at −80 °C for subsequent RNA extraction and glycogen content determination. The partial gonad tissues with a size of 1 cm3 were collected and fixed in Bouin’s solution for subsequent tissue sections to judge the developmental stage of the gonad. In addition, tissue blocks with a thickness of about 2 mm were also taken from the six tissues of oyster at the proliferative stage and mature stage, and then treated with the 4% paraformaldehyde (PFA) in 0.1 M phosphate-buffered saline (PBS) for 24 h for in situ hybridization [26].
The oysters used in the RNA interference experiment were collected in early January 2022. Before the experiment, the live oysters were acclimatized in aerated seawater for one week and fed with microalgae twice a day (4 × 10⁵~5 × 10⁵ cell·mL−1). A total of 36 oysters were randomly divided into three groups, while group A was injected with the synthetic dsRNA as a positive test, group B was injected with normal saline as a negative control, and group C was treated without any treatment as a blank.

2.2. Glycogen Content Determination

Prior to the determination analysis, those sampled tissues containing gonad, labial palp, hepatopancreas, gill, mantle, and adductor muscle were firstly freeze-dried for 48 h and then ground into powder under freezing conditions. Then, the glycogen contents were determined using the near-infrared reflectance spectroscopy (NIRS) method according to the NIRS model that has been established by Wang et al. [27]. Approximately 0.1 g of dried flesh was placed into a sample cup and scanned by the NIRS instrument (Antaris MX, Thermo Fisher, Carlsbad, CA, USA) to obtain a spectral curve for nutrient content analysis. According to the NIRS model, the glycogen contents of the individuals were calculated by the imported spectral data by using the analysis software (TQ Analyst).

2.3. In Situ Hybridization

The in situ hybridization technology was used to test the location of GYS and GSK3β in the tissues according to the published protocol, with some modifications [26]. The oligonucleotide probes were designed and synthesized by Wuhan Xavier Biotechnology Co., LTD (Table 1). The six tissues were fixed in 4 % paraformaldehyde buffered with 1 × phosphate saline (0.8% NaCl, 0.02% KCl, 0.02 M, Na2HPO4, pH 7.4) at 4 °C for 24 h. Paraffin-embedded tissue samples were sliced on a microtome. The sections were soaked twice in xylene for 15 min each and dehydrated though a graded series of ethyl alcohol into DEPC-treated water and digested with proteinase K (20 μg/mL) for 15 min at 37 °C. Prehybridization was performed in an incubator (LABOTERY, Tianjin, China) for 1 h at 37 °C in the hybridization buffer. The sections were subsequently hybridized with 500 nM oligonucleotide probes overnight at 42 °C and washed with a gradient concentration of SSC (Saline Sodium Citrate Buffer) at 37 °C to remove the hybridization fluid. Then, the hybridization solution containing the fluorescently labeled probe at a dilution of 1:400 was added into it for three hours at 42 °C, and the subsequent washing procedure was the same as the last step. Rabbit serum was added to the section and incubated at 25 °C for 30 min. Antibody incubation was performed at 37 °C for 40 min in an alkaline-phosphatase-conjugated IgG fraction monoclonal mouse anti-Digoxin Antibody (anti-DIG-AP), then these sections were washed in TBS four times for 5 min each. The samples were incubated with NBT/BCIP solution in darkness at 25 °C until positive expression appeared blue–purple, and then the reaction was stopped by running tap water. It was dried in natural air and mounted with Glycerol Jelly mounting medium. All images were captured using the digital camera on NIKON DS-U3.

2.4. CDS Sequence Amplification and Analyses

Total RNAs were extracted from tissues using a traditional Trizol reagent according to the manufacturer’s instructions, and then the concentration, purity, and integrity of the RNA were detected by spectrophotometry (A260/A280) and 1.5% agarose gel electrophoresis, respectively.
The cDNA was synthesized using total RNA by the Evo M-MLV Plus 1st Strand cDNA Synthesis Kit (Accurate Biotechnology, China) following the manufacturer’s protocol. Combining the transcriptome (CNP0003045) and genome annotation (GCA_020458035.1) of C. ariakensis, the sequences of GYS and GSK3β were screened, which were used for subsequently designing the primers. The coding sequence (CDS) of GYS and GSK3β was amplified by using the PCR amplification. The amplification system includes 25 μL of 2 × Taq Plus Master Mix (Vazyme, Nanjing, China), 20 μL ddH2O, 2 μL of each 10 mM gene-specific primer, and 1 μL template cDNA following the manufacturer’s protocol. All the primers used in this study are listed in Table 1.
The structure and functional domain of these two genes were predicted by the program SMART on the website (http://smart.embl-heidelberg.de/, accessed on 12 January 2023). The physicochemical properties of the encoded protein were predicted by the ExPASY website (https://www.expasy.org/, accessed on 12 January 2023). The website of the prediction method for subcellular localization of the predicted proteins is http://www.csbio.sjtu.edu.cn/bioinf/Cell-PLoc-2/( accessed on 6 March 2021). Sequence homology comparisons were carried out using the BLAST program (http://blast.ncbi.nlm.nih.gov/Blast.cgi, accessed on 10 March 2021). Multiple protein alignments were accomplished by utilizing DNAMAN (Version 8). The phylogenetic tree of the protein sequences was constructed with the neighbor-joining algorithm by MEGA (Version 7.0), tested using 1000 bootstrap resampling.
Table 1. Primers used for the experiment.
Primer NamePurposeNucleotide Sequence (5′→3′)
C-GYS-LCDS sequence verificationGGTTCTTGACCTGATCTAACTGCTGA
C-GYS-RGCACTTGCCAACACTCCAGTATTAT
C-GSK3β-LATCCGTCAGGTTTCACGAGC
C-GSK3β-RATGAATAGCTTGCAACAGCTTAGGATG
q-GYS-LqRT-PCR expression
analysis
TACTGTCTGCTGGGTCCCTATAACG
q-GYS-RCCTCATTGCCTGAAGTGTCTGTCTG
q-GSK3β-LGTCAGCCGCCTTCTGGAATATACTC
q-GSK3β-RCAACCTGGTGCTAGGATCTCTTAGTTC
β-actin-FCTGTGCTACGTTGCCCTGGACTT
β-actin-RTGGGCACCTGAATCGCTCGTT
R-GSK3β-1LRNAiGATCACTAATACGACTCACTATAGGGGAAATGGGTCTTTTGGGGTT
R-GSK3β-1RGATCACTAATACGACTCACTATAGGGGTCTCCAGGGAAAATGGGTT
R-GSK3β-2LGATCACTAATACGACTCACTATAGGGCACAAGGTGTGTGCCATAGG
R-GSK3β-2RGATCACTAATACGACTCACTATAGGGTATATTCCAGAAGGCGGCTG
R-GSK3β-3LGATCACTAATACGACTCACTATAGGGGTCTGGCTCCGACAGAACTC
R-GSK3β-3RGATCACTAATACGACTCACTATAGGGCCAACACTTTTGCACTTCCA
ISH-GYS-probeIn situ hybridizationGCGGTCGTGCCAGGGGATTCCTATGCTGCATCATCATACATCATCAT
ISH-GSK3β-probeTCTCCAGTTACTGCTCCAGGATCACTTGCGTTTCATCATCATACATCATCAT
Fluorescent labeling sequencesATGATGATGTATGATGATGT

2.5. Relative Quantification of Gene Expression

The expression of GYS and GSK3β in tissues including gonad, labial palp, gill, mantle, hepatopancreas, and adductor muscle at different reproductive stages (formative stage, proliferative stage, mature stage, proliferous stage, and inactive stage) were determined by quantitative real-time PCR (qRT-PCR). The cDNAs were synthesized using HiScript III RT Super Mix for qPCR (Vazyme, Nanjing, China) with 1 μg of total RNAs, and the cDNAs were diluted 10 times for using as amplification template. The qRT-PCR was performed on an ABI Step One Plus™ Real-Time PCR System with Tower (Applied Biosystems, Foster City, CA, USA) using a ChamQ SYBR Color qPCR Master Mix (Vazyme, Nanjing, China) following manufacturer’s instructions. Melting curve analysis was performed at the end of the cycle to confirm amplification specificity. After confirming the stability of the β-actin (AF026063) gene, it was selected as an internal control to calculate the relative expression of GYS and GSK3β. The experimental operation and analysis were carried out in three replicates. All primers used for the qRT-PCR analysis are listed in Table 1.

2.6. GSK3β RNA Interference In Vivo

To further explore the regulation of GSK3β on GYS during the glycogen metabolism process, the RNAi experiment of GSK3β was performed in January, considered as a critical period for glycogen accumulation in the oyster [12]. Based on the verified CDS sequence of the GSK3β gene, a total of three pairs of RNAi primers for GSK3β were designed by the Online Biology Software (http://www.flyrnai.org/cgi-bin/RNAi_find_primers.pl, accessed on 10 October 2021) according to the basic principles of primer design. A T7 promoter sequence was added to the 5′ end of each primer for the synthesis of double-stranded RNA (dsRNA). The primer sequences are also shown in Table 1. Using the purified cDNA as the template, a pair of primers linked with T7 were employed to amplify the dsRNA in a 20 μL system by the in vitro transcription T7 kit (TaKaRa, Japan) following the instructions. Then, about 20 μg GSK3β dsRNA was obtained, which was subsequently diluted to 1 μg/μL with saline solution for injection.
Three groups of the above-mentioned oysters were used for the RNAi experiment. Before injection, the oysters in groups A and B were anesthetized in MgCl2 solution (500 g MgCl2, 5 L seawater, 5 L freshwater) for 12 h by referring to Suquet’s method [28]. For group A and group B, 100 µL dsRNA (1 μg/μL) liquid of GSK3β and saline solution were injected into the adductor muscle of the oysters, respectively. The individuals in group C, as blank control, were not injected. After being treated, all the oysters were put back into the original water for cultivation. To analyze the expression of GYS and GSK3β by qRT-PCR, the gonad and labial palp of the oysters from each group were sampled at 0, 24, 48, and 72 h of treatment for RNA extraction.

2.7. Statistical Analysis

Glycogen content is presented as the mean ± standard error of the mean (SEM), and gene expression levels were calculated using the 2−∆∆ct method [29]. All data were tested for normality, and those did not meet the normal distribution were transformed to obtain normality. Multiple comparisons of the relative levels of mRNA among tissues and reproductive stages were performed using one-way analysis of variance (ANOVA) followed by a multiple comparison test with the Duncan test using SPSS 25.0 software. Significant differences in expressions were considered at p < 0.05.

3. Results

3.1. CDS Characterization of GYS and GSK3β

The CDS sequence length of the GYS and GSK3β were verified to be 2094 bp and1242 bp, encoding 697 amino acid (aa) and 413 aa, respectively. There was a GT3_GYS2-like conserved domain in GYS and a STKc_GSK3 conserved domain in GSK3β, and no signal peptide and no obvious transmembrane region was predicted in the two encoded proteins. Therefore, they are all speculated to be intracellular proteins.
Respectively, the results showed that the molecular formula of GYS and GSK3β were C3601H5502N984O1050S30 and C2067H3271N561O607S10, their molecular masses were 80.3 kDa and 46 kDa, and the theoretical isoelectric points (pIs) were 6.03 and 8.87. The half-life of the two gene-encoded products were all 30 h, the lipid solubility coefficients were 77.25 and 88.26, the average hydrophilicity coefficients (GRAVY) were −0.413 and −0.279, and the instability indexes were 45.60 and 28.16. Proteins with a stability coefficient greater than 40 are unstable, and those with a stability coefficient less than 40 are stable. According to this criterion, it indicated that the GYS was a hydrophilic unstable protein and GSK3β was a hydrophilic stabilized protein. By subcellular localization, the probability of the GYS protein existing in the cytoplasm was 39.1%, in the mitochondria it was 34.8%, in the nucleus it was 21.7%, and in the peroxisome it was 4.3%. For GSK3β, the probability of existing in the cytoplasm was 47.8%, in the nucleus it was 17.4%, in the mitochondria it was 17.4%, in the peroxisome it was 13.0%, and in the cytoplasmic membrane it was 4.3%. So, they were presumed to mainly exist in the cytoplasm and cytoskeleton, being consistent with the transcription factor function of this protein.
According to the results of multiple alignments of amino acid sequences, it was found that the C. ariakensis GYS had the highest homology with those of C. gigas (XP_034316496.1), followed by C. angulate (CCN27372.1) and C. virginica (XP_022340936.1), with a sequence similarity rate of 97.70%, 97.33%, and 93.98%, respectively (Figure S1). In addition, the homology with the GYS genes of Locusta migratoria (ACM78946.1), Homo sapiens (NP_002094.2), and Oreochromis mossambicus (ABU62630.1) and other species ranged from 61.09% to 68.66% (Figure S2). The phylogenetic tree showed that C. ariakensis first clustered with invertebrates such as C.gigas, C. angulate, C. virginica, and Mytilus coruscus, and was then clustered with vertebrates such as Homo sapiens and Oreochromis mossambicus (Figure 1A), with a similar clustering trend for GSK3β (Figure 1B), being consistent with the traditional classification.

3.2. Histocytology Localization of GYS and GSK3β Expression in Six Tissues

The expression and distribution of the GYS and the GSK3β in the mantle, gill, adductor muscle, hepatopancreas, labial palp, ovary, and testis of C. ariakensis were detected through in situ hybridization. The results revealed that GYS and GSK3β expression were found in all seven tissues, and their mRNAs were not cell-specific, but the expression levels varied during proliferative stages. The GYS mRNA probes produced stronger positive signals in the mantle, hepatopancreas, and testis, and were especially strongest in the testis (Figure 2). Meanwhile, there were stronger positive signals detected in the gill, ovary, adductor muscle, and testis by the GSK3β mRNA probes (Figure 3). Positive signals of GYS and GSK3β mRNAs were mostly observed in the cytoplasm of the epithelial tissue in the mantle and labial palps when compared to the negative control group (Figure 2A1–A3,E1–E3). Furthermore, the positive signals of GYS and GSK3β mRNAs were primarily expressed in the gill filament, muscle fiber, hepatic tubule, and gonadal cells (Figure 2 and Figure 3).

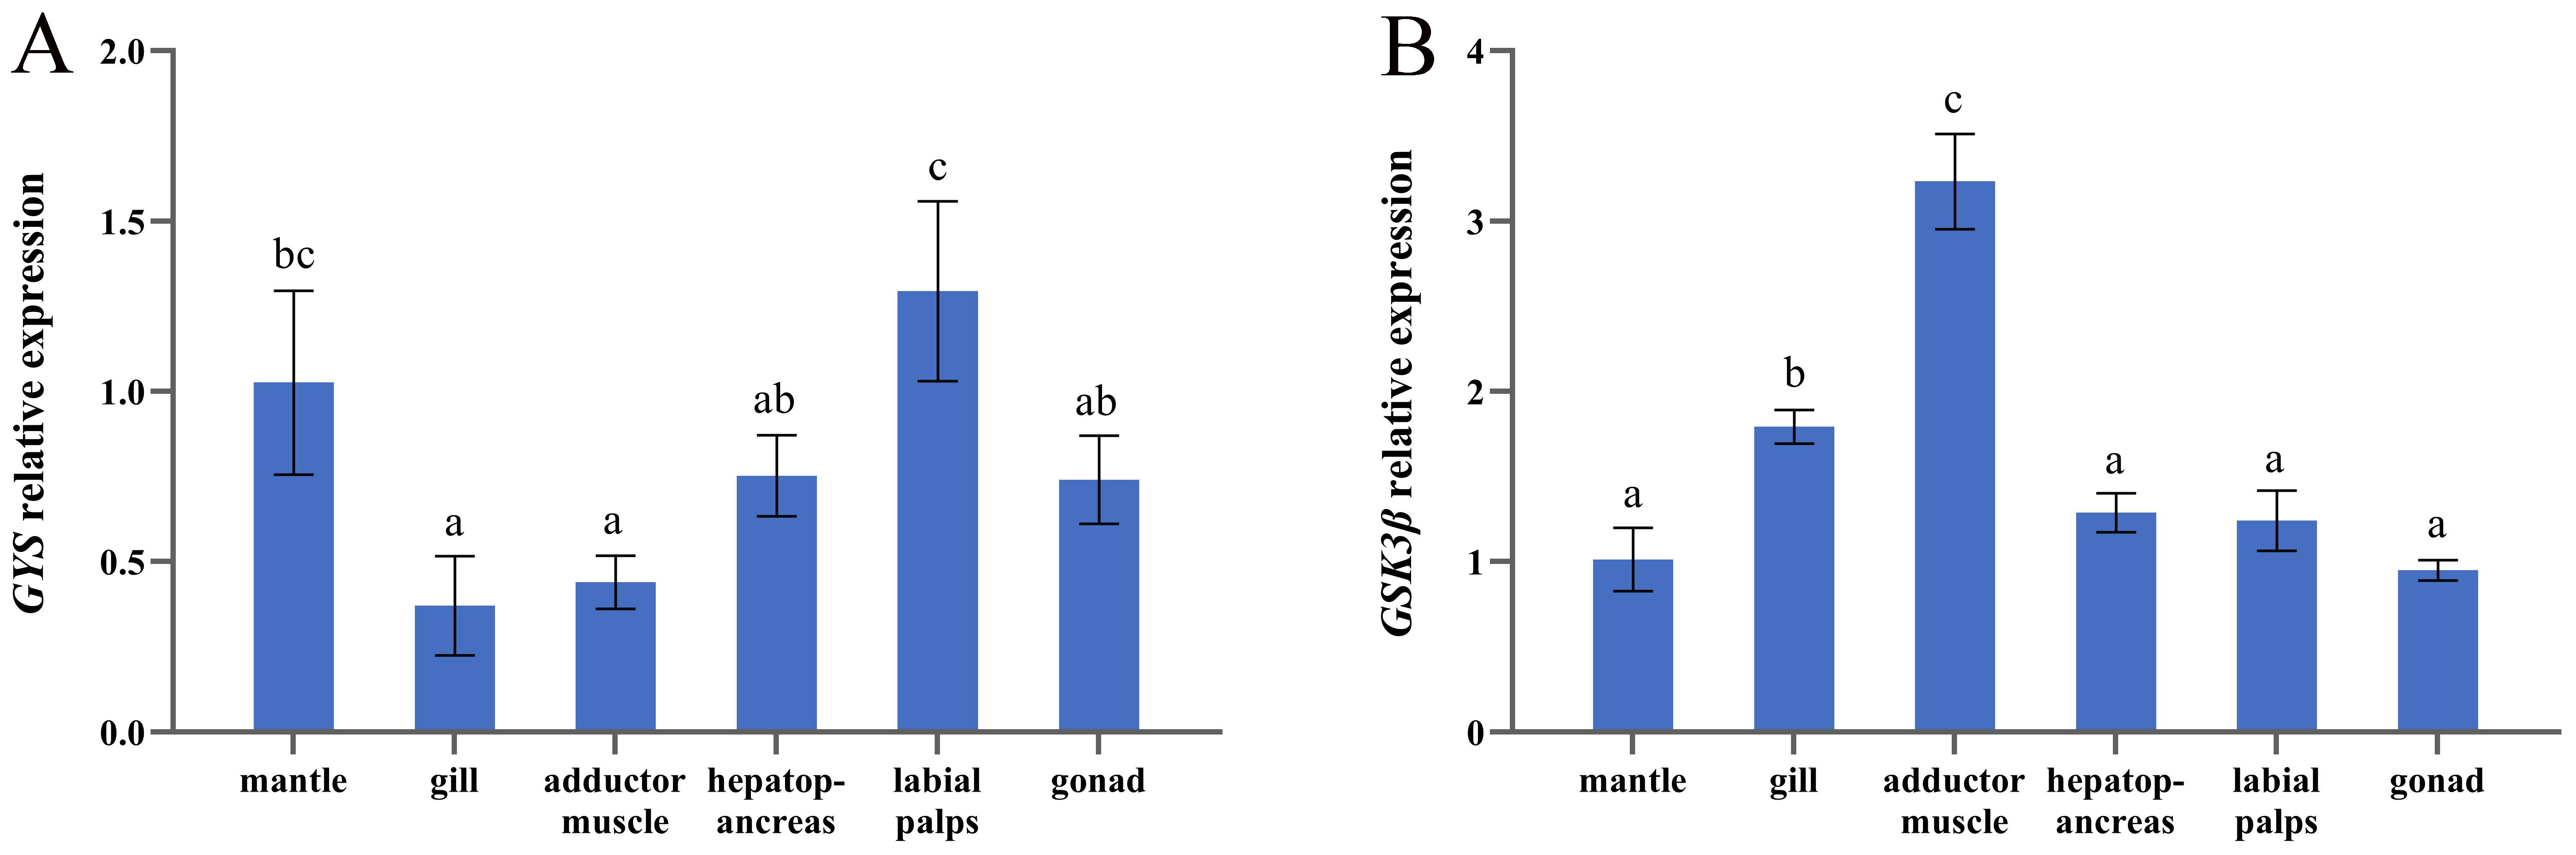
3.3. mRNA Expression of GYS and GSK3β in Six Tissues

GYS expression in different tissues at the proliferative stage showed high levels in the gonad, labial palp, mantle, and hepatopancreas, which had relatively high glycogen contents (Figure 4). In contrast, the expression of GSK3β in the gill and adductor muscle were significantly higher than those in other four tissues (p < 0.05). Among them, GYS expression was highest in the labial tissue, while GSK3β expressed highest in the adductor muscle. On the whole, the change trend of the GYS expression level of each tissue was opposite to that of the GSK3β expression level.

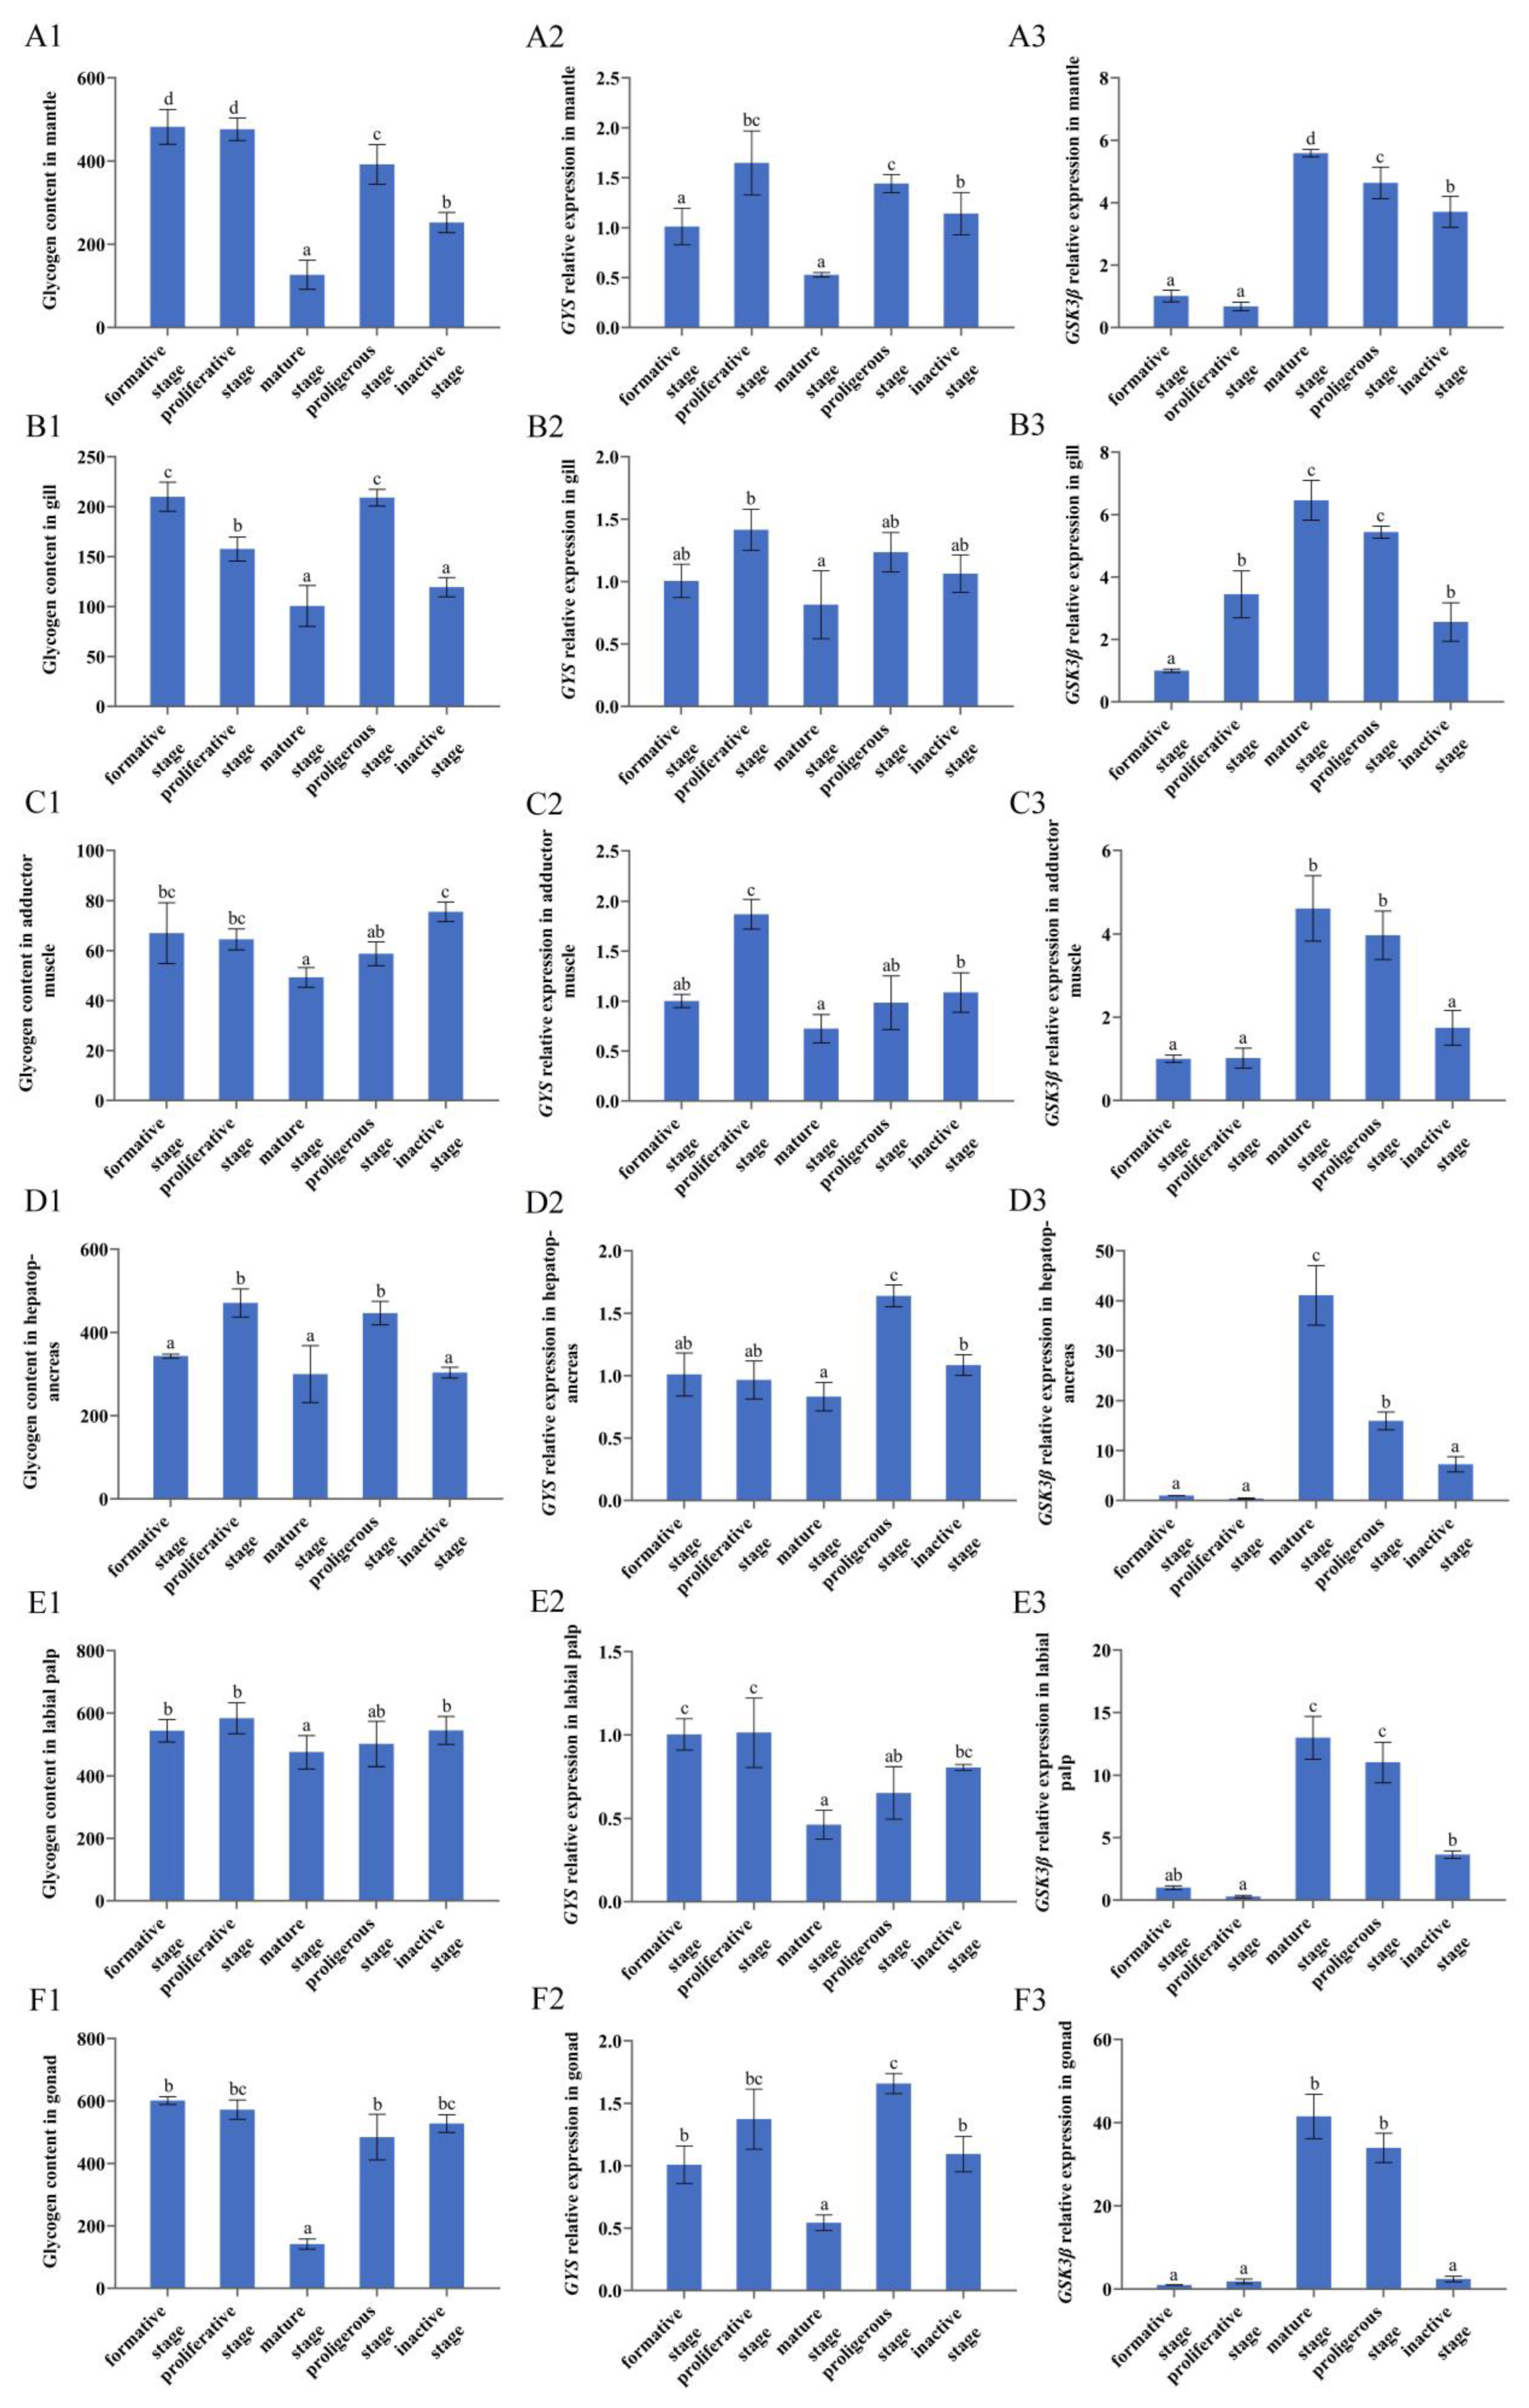
3.4. Glycogen Content in Tissues at Different Reproductive Stages

Glycogen content at different stages of the reproductive cycle of C. ariakensis indicated that the glycogen content of all the six tissues decreased continuously during the formation and proliferation of gametes (the proliferative stage to the mature stage) and reached the lowest value in the mature stage (p < 0.05) (Figure 5A1,B1,C1,D1,E1,F1). Then, during gamete release (the mature stage to the proliferous stage), we observed that the glycogen content increased continuously in the six tissues (Figure 5A1,B1,C1,D1,E1,F1).
In the mantle and gill, the glycogen contents were significantly higher in the formative and proliferative stages compared with the other three developmental stages (p < 0.05) (Figure 3A1). Additionally, the glycogen content in the adductor muscle decreased continuously from the formative stage to the mature stage, then started to increase continuously after the maturity stage, and reached the highest value in the inactive stage (Figure 3C1). The glycogen content of the labial palps tissue was consistently high in all five developmental stages, while the glycogen content of the adductor muscle tissue was much lower than that of the other tissues (Figure 3D1).
For the gonad tissue, the glycogen content was significantly higher in the other four stages compared to the mature stage (p < 0.05) (Figure 3F1). The hepatopancreas tissue had the highest glycogen content during the proliferative and proliferous stage (Figure 3E1). The proliferative phase and the discharge phase are the key periods before and after gametogenesis, and the glycogen content in the gonad and hepatopancreas was all in high level during the two periods.

3.5. GYS and GSK3β Expression in Six Tissues at Different Reproductive Stages

Through qRT-PCR, we detected the relative expression of GYS and GSK3β in the mantle, gill, adductor muscle, hepatopancreas, labial palps, and gonad of C. ariakensis at five different developmental stages. The results showed that GYS and GSK3β were expressed in all six tissues of C. ariakensis. In the mature stage, GSK3β expression reached the highest level, whereas GYS expression in the six tissues achieved the lowest level (Figure 3A2,B2,C2,D2,E2,F2). Among them, the GYS expression in the mantle, gill, and adductor muscle continued to increase from the formation stage and reached the peak in the proliferation stage. The GYS expression in the labial tissue was always at a high level in the five developmental stages (p < 0.05). GSK3β expression levels of six tissues in mature and proliferous stage were significantly higher than that at the other three developmental periods (p < 0.05), especially in the hepatopancreas, labial flap, and gonadal tissues (p < 0.01) (Figure 3A3,B3,C3,D3,E3,F3). Overall, the changes in the GYS expression levels of the six tissues at various developmental stages followed the same trends as the glycogen content and were negatively correlated with the GSK3β expression levels.

3.6. Effect of GSK3β Gene Silencing on the Relative Expression Levels of GYS

Given the correlation between GSK3β and GYS, RNAi was performed to investigate the regulatory relationship between GSK3β and GYS in C. ariakensis. As indicated, the relative expression of GSK3β was significantly inhibited in the adductor muscle at 48 h and 72 h after dsRNA injection, as well as in the hepatopancreas at 24 h, 48 h, and 72 h after dsRNA injection. That suggested dsRNA was effective for the silencing of GSK3β. After GSK3β RNAi, the GYS expression significantly increased in these two tissues under the neutral control (p < 0.05) (Figure 6 and Figure 7). Compared to adductor muscle, GYS expression was significantly higher in the hepatopancreas at 48 h postinterference, indicating a more rapid response in the hepatopancreas. These results showed that the silent expression of the GSK3β gene can upregulate GYS gene expression.

4. Discussion

The GYS and GSK3β are two important genes in the glycogen synthesis process. In the bivalve, they were firstly isolated from C. gigas (GenBank Accession no.: AY496064) in 2005 and C. angulate (GenBank Accession No.: HF544982) in 2013, respectively [19,22]. Since then, both GYS and GSK3β have been identified in more and more shellfish species [21,30]. Based on their sequence characteristics, the GYS and GSK3β, respectively, owned a conservative GT3_GSY2-like domain and STKc_GSK3 domain. In this study, the CDS sequence of the GYS gene in C. ariakensis was 2094 bp long, encoding 697 aa, with a GT3 GYS2-like conserved domain. Additionally, the GSK3β gene had a 1242 bp CDS sequence that encoded 413 aa and included an STKc GSK3 conserved domain. In addition, multiple alignments of amino sequence showed that the closer the relative, the higher the sequence similarity, suggesting a high degree of conservation throughout the evolution. Phylogenetic analysis also revealed that the clustering relationship of species according to the GYS and GSK3β amino acid sequences was consistent with that of the traditional classification. All these results indicated the sequences we isolated were indeed the GYS and GSK3β of C. ariakensis.
In the present study, using in situ hybridization, the GYS and GSK3β expression in C. ariakensis was detected in six tested tissues, including the mantle, gill, adductor muscle, hepatopancreas, labial palp, and gonad, suggesting the distribution of the two genes was not tissue-dependent. This is the same to those reported in C. gigas, C. angulate, and Sinonovacula constricta [21,22,30]. However, the positive signal strength in different tissues was different; moreover, the signal strength of the two genes in the same tissue was opposite. This result was further confirmed by qRT-PCR. For GYS, it expressed higher in the mantle, gonad, hepatopancreas, and the labial palp at the proliferative stage of C. ariakensis, coinciding with the higher glycogen content and stronger positive signal in these four tissues. The previous findings have proved that storage cells are mainly distributed in the labial palp, mantle, and gonadal area in C. gigas [12]. The hepatopancreas is also an important energy storage organ because it was involved not only in nutrient storage but also in the transfer of assimilated food to the bodily tissues [31,32]. However, in oyster, the glycogen content has been reported to be quite low in the gill and adductor muscle tissues throughout the year, which reflects that the gill and muscles are not the major storage tissues for oysters and may be related to their sessile lifestyle [19,21]. GYS was highly expressed in these four tissues, and the high glycogen content indicated that the GYS in C. ariakensis mainly participated in tissue glycogen biosynthesis, as seen in C. gigas and C. angulata [21,22]. Interestingly, the expression of GSK3β in the six tissues were opposite to that of GYS and the glycogen content in C. ariakensis at the formative stages, such as its stronger expression in the gill and adductor muscle, with a lower GYS expression and glycogen content. That further demonstrated GSK3β and GYS expression were involved in the regulation of glycogen synthesis in C. ariakensis. These results preliminarily indicated that the expression level of GYS gene was positively correlated with the glycogen content, and that the GSK3β gene was negatively correlated with the GYS and glycogen content.
In this study, the glycogen content changed obviously in the labial palp, mantle, hepatopancreas, and gonad at the different developmental stages, especially from the proliferating to the mature period, revealing its relation to gametogenesis. Moreover, previous studies showed that the glucose concentration in the hemolymph was higher in May and June (mature stage) than that of winter and spring [33], but the glycogen content in the gill and adductor muscle were relatively low year-round in oysters [19,21]. Therefore, the labial palps, mantle, hepatopancreas, and gonad tissues should be the main organs of energy storage for the reproductive activities in oysters, storing and releasing energy.
To further explore the relationship between the glycogen content, GYS, and GSK3β, changes in the six tissues at the five developmental stages were detected by qRT-PCR. Previous studies have confirmed that the mRNA expression of GYS and GSK3β in bivalves is closely related to variations in glycogen content, indicating that they are likely involved in the regulation of the glycogen metabolism [21,22,30,34]. On the whole, relatively high GYS expression was found in the degenerating gametes stage and early gametogenes, which decreased accordingly to its lowest level in mature stage, whose trend was consistent with the variation of the glycogen content. Conversely, the highest expression of GSK3β was observed at the mature stage. The relationship between the expression trend and the fluctuations of the glycogen content in the corresponding tissues showed the expression level of GYS was positively correlated with the glycogen content, and that of GSK3β was negatively correlated with the GYS and glycogen content. Additionally, in agreement with previous studies, the mRNA levels of GYS and GSK3β in the gonad tissues appeared to be seasonally regulated and correlated to the glycogen content [19,21,22]. This suggests that these two genes may be involved in the glycogen synthesis. Therefore, it showed the possible negative regulation of GSK3β on GYS, which promotes glycogen synthesis, and which was also studied in pigs [35].
The results of the RNAi of GSK3β confirmed the negative regulatory effect of GSK3β on GYS. This study suggested that once GSK3β in the adductor muscle was silenced, GYS expressed significantly higher than that of the negative control group at 72 h, and also in the hepatopancreas. So, that GSK3β negatively regulated GYS is possibly the reason why the two genes expressed reversely at different developmental stages. These results well agreed with previous reports that the GSK3β can inactivate GYS by phosphorylation to indirectly regulate glycogen content [15,19,36,37].

5. Conclusions

In conclusion, we identified the CDS of the GYS and GSK3β genes in C. ariakensis and analyzed their characteristics. The in situ hybridization and qRT-PCR confirmed that the distribution GYS and GSK3β was not tissue-dependent, and the expression of the GYS gene was positively correlated with the glycogen content, while GSK3β was negatively correlated. Furthermore, the RNAi experiment proved the negative regulatory effect of GSK3β on GYS. These findings can provide valuable information for further research on the function of GSK3β and GYS in the glycogen synthesis process of oysters.

Supplementary Materials

The following supporting information can be downloaded at: https://www.mdpi.com/article/10.3390/fishes8020065/s1, Figure S1: Comparison of homology sequences between GYS transcript of Crassostrea ariakensis and other species; Figure S2: Comparison of homology sequences between GSK3β transcript of Crassostrea ariakensis and other species.

Author Contributions

B.W.: conceptualization, supervision, writing—review and editing, and funding acquisition. Y.W.: formal analysis, visualization, conceptualization, software, data curation, writing—original draft; Z.L. and X.C.: validation, resources, and writing—review and editing; L.Z. and X.S.; resources and visualization; T.Y., X.W. and Y.Z.: resources and supervision. All authors have read and agreed to the published version of the manuscript.

Funding

This research was funded by the National Key R&D Program of China, 2018YFD0900104; Central Public-interest Scientific Institution Basal Research Fund, CAFS 2021XT0102; Key Research and Development Project of Shandong Province, 2021LZGC028 and Marine S&T Fund of Shandong Province for Pilot National Laboratory for Marine Science and Technology (Qingdao), 2021QNLM050103.

Institutional Review Board Statement

The animal study was reviewed and approved by the Experimental Animal Care, Ethics and Safety Inspection Form Yellow Sea Fisheries Research Institute, CAFS (approval code YSFRI-2022036, approved on 2021.3.12).

Data Availability Statement

Not applicable.

Acknowledgments

We would like to thank the National Key R&D Program of China (2018YFD0900104), Central Public-interest Scientific Institution Basal Research Fund, CAFS (2021XT0102), Key Research and Development Project of Shandong Province (2021LZGC028), and Marine S&T Fund of Shandong Province for Pilot National Laboratory for Marine Science and Technology (Qingdao)(2021QNLM050103) for their financial support.

Conflicts of Interest

The authors declare no conflict of interest.

References

  1. Zhou, M.; Allen, S.K., Jr. A review of published work on Crassostrea ariakensis. J. Shellfish. Res. 2003, 22, 1–20. [Google Scholar]
  2. Ren, J.; Hou, Z.; Wang, H.; Sun, M.-A.; Liu, X.; Liu, B.; Guo, X. Intraspecific Variation in Mitogenomes of Five Crassostrea Species Provides Insight into Oyster Diversification and Speciation. Mar. Biotechnol. 2016, 18, 242–254. [Google Scholar] [CrossRef] [PubMed]
  3. Zhu, Y.; Li, Q.; Yu, H.; Kong, L. Biochemical Composition and Nutritional Value of Different Shell Color Strains of Pacific Oyster Crassostrea gigas. J. Ocean Univ. China 2018, 17, 897–904. [Google Scholar] [CrossRef]
  4. Bartlett, J.K.; Maher, W.A.; Purss, M.B. Near infra-red spectroscopy quantitative modelling of bivalve protein, lipid and glycogen composition using single-species versus multi-species calibration and validation sets. Spectrochim. Acta Part A Mol. Biomol. Spectrosc. 2018, 193, 537–557. [Google Scholar] [CrossRef] [PubMed]
  5. Greenberg, C.C.; Jurczak, M.J.; Danos, A.M.; Brady, M.J. Glycogen branches out: New perspectives on the role of glycogen metabolism in the integration of metabolic pathways. Am. J. Physiol. Metab. 2006, 291, E1–E8. [Google Scholar] [CrossRef] [PubMed] [Green Version]
  6. Ojea, J.; Pazos, A.J.; Martínez, D.; Novoa, S.; Sánchez, J.L.; Abad, M. Seasonal variation in weight and biochemical composition of the tissues of Ruditapes decussatus in relation to the gametogenic cycle. Aquaculture 2004, 238, 451–468. [Google Scholar] [CrossRef]
  7. Liu, S.; Li, L.; Wang, W.; Li, B.; Zhang, G. Characterization, fluctuation and tissue differences in nutrient content in the Pacific oyster (Crassostrea gigas) in Qingdao, northern China. Aquac. Res. 2020, 51, 1353–1364. [Google Scholar] [CrossRef]
  8. Smolders, R.; Bervoets, L.; De Coen, W.; Blust, R. Cellular energy allocation in zebra mussels exposed along a pollution gradient: Linking cellular effects to higher levels of biological organization. Environ. Pollut. 2004, 129, 99–112. [Google Scholar] [CrossRef]
  9. Maguire, G.B.; Gardner, N.; Nell, J.A.; Kent, G.N.; Kent, A.S. Studies on triploid oysters in Australia. 2. Growth, condition index gonad area, and glycogen content of triploid and diploid Pacific oysters, Crassostrea gigas, from oyster leases in Tasmania, Australia. Aquaculture 1995, 137, 357. [Google Scholar] [CrossRef]
  10. Samain, J.F. Review and perspectives of physiological mechanisms underlying genetically-based resistance of the Pacific oyster Crassostrea gigas to summer mortality. Aquat. Living Resour. 2011, 24, 227–236. [Google Scholar] [CrossRef] [Green Version]
  11. Cao, C.; Wang, W.-X. Copper-induced metabolic variation of oysters overwhelmed by salinity effects. Chemosphere 2017, 174, 331–341. [Google Scholar] [CrossRef] [PubMed]
  12. Berthelin, C.; Kellner, K.; Mathieu, M. Storage metabolism in the Pacific oyster (Crassostrea gigas) in relation to summer mortalities and reproductive cycle (West Coast of France). Comp. Biochem. Physiol. Part B Biochem. Mol. Biol. 2000, 125, 359–369. [Google Scholar] [CrossRef] [PubMed]
  13. Wood, E.J. Textbook of Biochemistry with Clinical Correlations, 2nd ed.; Devlin, T.M., Ed.; John Wiley & Sons: New York, NY, USA, 1987; Volume 15, p. 47. [Google Scholar] [CrossRef]
  14. Stalmans, W.; Bollen, M.; Mvumbi, L. Control of glycogen synthesis in health and disease. Diabetes/Metab. Res. Rev. 1987, 3, 127–161. [Google Scholar] [CrossRef] [PubMed]
  15. Frame, S.; Cohen, P. GSK3 takes centre stage more than 20 years after its discovery. Biochem. J. 2001, 359, 1–16. [Google Scholar] [CrossRef] [PubMed]
  16. Wang, L.; Zuo, B.; Xu, D.; Ren, Z.; Zhang, H.; Li, X.; Lei, M.; Xiong, Y. Alternative Splicing of the Porcine Glycogen Synthase Kinase 3β (GSK-3β) Gene with Differential Expression Patterns and Regulatory Functions. PLoS ONE 2012, 7, e40250. [Google Scholar] [CrossRef] [Green Version]
  17. Cohen, P.I.; Frame, S. The renaissance of GSK3. Nat. Rev. Mol. Cell Biol. 2001, 2, 769–776. [Google Scholar] [CrossRef]
  18. Rommel, C.; Bodine, S.; Clarke, B.A.; Rossman, R.; Nunez, L.; Stitt, T.N.; Yancopoulos, G.D.; Glass, D.J. Mediation of IGF-1-induced skeletal myotube hypertrophy by PI(3)K/Akt/mTOR and PI(3)K/Akt/GSK3 pathways. Nat. Cell Biol. 2001, 3, 1009–1013. [Google Scholar] [CrossRef]
  19. Bacca, H.; Huvet, A.; Fabioux, C.; Daniel, J.-Y.; Delaporte, M.; Pouvreau, S.; Van Wormhoudt, A.; Moal, J. Molecular cloning and seasonal expression of oyster glycogen phosphorylase and glycogen synthase genes. Comp. Biochem. Physiol. Part B Biochem. Mol. Biol. 2005, 140, 635–646. [Google Scholar] [CrossRef] [Green Version]
  20. Li, B.; Meng, J.; Li, L.; Liu, S.; Wang, T.; Zhang, G. Identification and Functional Characterization of the Glycogen Synthesis Related Gene Glycogenin in Pacific Oysters (Crassostrea gigas). J. Agric. Food Chem. 2017, 65, 7764–7773. [Google Scholar] [CrossRef]
  21. Liu, S.; Li, L.; Meng, J.; Song, K.; Huang, B.; Wang, W.; Zhang, G. Association and Functional Analyses Revealed That PPP1R3B Plays an Important Role in the Regulation of Glycogen Content in the Pacific Oyster Crassostrea gigas. Front. Genet. 2019, 10, 106. [Google Scholar] [CrossRef]
  22. Zeng, Z.; Ni, J.; Ke, C. Expression of glycogen synthase (GYS) and glycogen synthase kinase 3β (GSK3β) of the Fujian oyster, Crassostrea angulata, in relation to glycogen content in gonad development. Comp. Biochem. Physiol. Part B Biochem. Mol. Biol. 2013, 166, 203–214. [Google Scholar] [CrossRef] [PubMed]
  23. Qin, Y.; Li, X.; Li, J.; Zhou, Y.; Xiang, Z.; Ma, H.; Noor, Z.; Mo, R.; Zhang, Y.; Yu, Z. Seasonal variations in biochemical composition and nutritional quality of Crassostrea hongkongensis, in relation to the gametogenic cycle. Food Chem. 2021, 356, 129736. [Google Scholar] [CrossRef] [PubMed]
  24. Wu, B.; Chen, X.; Yu, M.; Ren, J.; Hu, J.; Shao, C.; Zhou, L.; Sun, X.; Yu, T.; Zheng, Y.; et al. Chromosome-level genome and population genomic analysis provide insights into the evolution and environmental adaptation of Jinjiang oyster Crassostrea ariakensis. Mol. Ecol. Resour. 2022, 22, 1529–1544. [Google Scholar] [CrossRef] [PubMed]
  25. Chen, X. Establish a Method for Determination of Oyster Glycogen Content and Study on the Characteristics of Jinjiang Oyster Glycogen Changes; Shanghai Ocean University: Shanghai, China, 2021. [Google Scholar] [CrossRef]
  26. Xu, R.; Li, Q.; Yu, H.; Kong, L. Oocyte maturation and origin of the germline as revealed by the expression of Nanos-like in the Pacific oyster Crassostrea gigas. Gene 2018, 663, 41–50. [Google Scholar] [CrossRef] [PubMed]
  27. Wang, Y.; Wu, B.; Liu, Z.; Chen, X.; Yu, T.; Wang, Z.; Sun, X.; Zhou, L.; Zheng, Y. Establishment of near-infrared model for glycogen content in freeze-dried tissues of Jinjiang oyster Crassostrea ariakensis. Prog. Fish. Sci. 2023, 44, 210–218. [Google Scholar] [CrossRef]
  28. Swift, M.L.; Thomas, T.P.; Humphrey, C.L. Characteristics of glycogen synthase activity in the oyster, Crassostrea virginica Gmelin. Comp. Biochem. Physiol. Part B Comp. Biochem. 1988, 90, 361–365. [Google Scholar] [CrossRef]
  29. Livak, K.J.; Schmittgen, T.D. Analysis of relative gene expression data using real-time quantitative PCR and the 2−ΔΔCT Method. Methods 2001, 25, 402–408. [Google Scholar] [CrossRef]
  30. Chen, Y.; Liu, S.; He, J.; Yao, H.; Lin, Z.; Dong, Y. Glycogen content fluctuation and association analysis with polymorphism of gys gene of Sinonovacula constricta in the Zhejiang population. J. Fish. China 2021, 45, 415–423. [Google Scholar] [CrossRef]
  31. Sastry, A.N.; Blake, N.J. Regulation of gonad development in the bay scallop, Aequipecten irradians Lamarck. Biol. Bull. 1971, 140, 274–283. [Google Scholar] [CrossRef]
  32. Vassalo, M.T. Lipid storage and transfer in the scallop Chlamys Hericia Gould. Comp. Biochem. Physiol. 1973, 44, 1169–1175. [Google Scholar]
  33. Hamano, K.; Awaji, M.; Usuki, H. cDNA structure of an insulin-related peptide in the Pacific oyster and seasonal changes in the gene expression. J. Endocrinol. 2005, 187, 55–67. [Google Scholar] [CrossRef] [PubMed] [Green Version]
  34. Li, B.; Song, K.; Meng, J.; Li, L.; Zhang, G. Integrated application of transcriptomics and metabolomics provides insights into glycogen content regulation in the Pacific oyster Crassostrea gigas. BMC Genom. 2017, 18, 713. [Google Scholar] [CrossRef] [PubMed] [Green Version]
  35. Wang, Y.; Wang, Y.; Zhong, T.; Guo, J.; Li, L.; Zhang, H.; Wang, L. Transcriptional regulation of pig GYS1 gene by glycogen synthase kinase 3β (GSK3β). Mol. Cell. Biochem. 2017, 424, 203–208. [Google Scholar] [CrossRef] [PubMed]
  36. Gabbott, P.A.; Whittle, M.A. Glycogen synthetase in the sea mussel Mytilus edulis L.—II. Seasonal changes in glycogen content and glycogen synthetase activity in the mantle tissue. Comp. Biochem. Physiol. Part B Comp. Biochem. 1986, 83, 197–207. [Google Scholar] [CrossRef]
  37. Suquet, M.; de Kermoysan, G.; Araya, R.G.; Queau, I.; Lebrun, L.; Le Souchu, P.; Mingant, C. Anesthesia in Pacific oyster, Crassostrea gigas. Aquat. Living Resour. 2009, 22, 29–34. [Google Scholar] [CrossRef]
Figure 1. Phylogenetic analysis of GYS and GSK3β in different species. GenBank IDs in (A): Crassostrea angulate (CCN27372.1); Crassostrea gigas (XP_034316496.1); Crassostrea virginica (XP_022340936.1); Mytilus coruscus (CAC5409044.1); Sinonovacula constricta (QLQ34388.1); Mizuhopecten yessoensis (XP_021358473.1); Haliotis discus hannai (BBI18978.1); Sepia pharaonis (CAE1228952.1); Capitella teleta (ELT91212.1); Apostichopus japonicus (PIK54210.1); Locusta migratoria (ACM78946.1); Homo sapiens (NP_002094.2); Oreochromis mossambicus (ABU62630.1). GenBank IDs in (B): Crassostrea gigas (XP_011452760.1); Crassostrea virginica (XP_022323945.1); Pinctada fucata (AKJ32474.1); Mytilus galloprovincialis (VDI08035.1); Mytilus coruscus (CAC5393303.1); Octopus sinensis (XP_02963674-3.1); Biomphalaria glabrata (XP_013066809.1); Saccoglossus kowalevskii (NP_001158498.1); Platynereis dumerilii (ANS60440.1); Scleropages formosus (KPP62668.1); Sus scrofa (NP_001121915.1); Hyalella azteca (XP_018012954.1); Homo sapiens (NP_002084.2); Mus pahari (XP_021065015.1).
Fishes 08 00065 g001
Figure 2. The distribution of GYS in the mantle (A1A3), gill (B1B3), adductor muscle (C1C3), hepatopancreas (D1D3), labial palp (E1E3), ovary (F1F3), and testis (G1G3) of C. ariakensis at the proliferative stages. (A1,B1,C3,D1,E1): GYS probe; (A2,B2,C2,D2,E2): negative control; (A3,B3,C3,D3,E1): hematoxylin–eosin staining. Ct: conjunctive tissues; Ep: epithelium; Gf: gill filament; Mf: muscle fiber; Ht: hepatic tubule; Og: oogonia; Spg: spermatogonia; Spc: spermatocyte.
Fishes 08 00065 g002
Figure 3. The distribution of GSK3β in the mantle (A1A3), gill (B1B3), adductor muscle (C1C3), hepatopancreas (D1D3), labial palp (E1E3), ovary (F1F3), and testis (G1G3) of C. ariakensis at the proliferative stages. (A1,B1,C3,D1,E1): GSK3β antisense probe; (A2,B2,C2,D2,E2): sense probe; (A3,B3,C3,D3,E3): hematoxylin–eosin staining. Ct: conjunctive tissues; Ep: epithelium; Gf: gill filament; Mf: muscle fiber; Ht: hepatic tubule; Og: oogonia; Spg: spermatogonia; Spc: spermatocyte.
Fishes 08 00065 g003
Figure 4. Relative expression levels of GYS (A) and GSK3β (B) in mantle, gill, adductor muscle, hepatopancreas, labial palp and gonad. Bar values represent the mean of GYS or GSK3β relative expression in three oysters, each point replicated three times. Error bars represent standard error of means.
Fishes 08 00065 g004
Figure 5. Glycogen content (mg/g dry mass), GYS relative expression levels, and GSK3β relative expression levels in mantle (A1A3), gill (B1B3), adductor muscle (C1C3), hepatopancreas (D1D3), labial palp (E1E3) and gonad (F1F3) of C. ariakensis at five developmental stages. Bar values represent the mean of glycogen content, GYS relative expression, and GSK3β relative expression in three oysters, each point replicated three times. Error bars represent standard error of means.
Fishes 08 00065 g005
Figure 6. GSK3β (A) and GYS (B) expression after dsRNA injection in adductor muscle (n = 3). The asterisk indicates significant difference (p < 0.05) between RNAi and neutral control group. The double asterisks indicates highly significant difference between RNAi and neutral controls (p < 0.01).
Fishes 08 00065 g006
Figure 7. GSK3β (A) and GYS (B) expression after dsRNA injection in hepatopancreas (n = 3). The asterisk indicates significant difference (p < 0.05) between RNAi and neutral control group. The double asterisks indicate highly significant differences between RNAi and neutral controls (p < 0.01).
Fishes 08 00065 g007
Disclaimer/Publisher’s Note: The statements, opinions and data contained in all publications are solely those of the individual author(s) and contributor(s) and not of MDPI and/or the editor(s). MDPI and/or the editor(s) disclaim responsibility for any injury to people or property resulting from any ideas, methods, instructions or products referred to in the content.

