Article

Influence of Krill Meal on the Performance of Post-Smolt Atlantic Salmon That Are Fed Plant-Based and Animal-Based Fishmeal and Fish Oil-Free Diets

by
Frederick T. Barrows
1,*,
Kelly B. Campbell
2,
T. Gibson Gaylord
3,
Rodrigo C. M. Sanchez
4,
Sergio A. Castillo
4 and
Ewen McLean
5,*
1
Aquatic Feed Technologies LLC, 48 West Plaza del Lago, Islamorada, FL 33036, USA
2
Anthropocene Institute, 855 El Camino Real, Ste 13A N399, Palo Alto, CA 94301, USA
3
United States Fish and Wildlife Service, Bozeman Fish Technology Center, 4050 Bridger Canyon Road, Bozeman, MT 59715, USA
4
Centro Experimental Acuícola of Vitapro Chile, Carretera Austral km 23.8, Quillaipe, Puerto Montt, Chile
5
Aqua Cognoscenti LLC, 479 Henslowe Lane, West Columbia, SC 29170, USA
*
Authors to whom correspondence should be addressed.
Fishes 2023, 8(12), 590; https://doi.org/10.3390/fishes8120590
Submission received: 14 August 2023 / Revised: 28 November 2023 / Accepted: 28 November 2023 / Published: 30 November 2023
(This article belongs to the Section Nutrition and Feeding)

Abstract

:
The purpose of this study was to determine the influence of krill meal (KM) inclusion at various levels (0%, 2.5%, 5%) in plant-based and animal-based feeds, that were fishmeal (FM) and fish oil (FO) free, on Atlantic salmon growth. A FM/FO feed containing 0% KM was the control. Using a 2 × 3 factorial approach, diets were randomly assigned to one of 28 0.5 m3 flow-through tanks (n = 4 tanks per diet) initially stocked with 60 fish (148.4 ± 12.9 g; 23.6 ± 0.8 cm; condition factor (K) = 1.16 ± 0.08) each. Salmon were fed for 90 days using automatic feeders ad libitum. On day 45, stocking densities were reduced to 45 fish per tank by the random removal of 15 individuals to remove any potential of density affecting growth through the trial end. Water temperature, oxygen saturation, pH, and salinity throughout the trial were 11.8 °C, 103.5%, 7.38, and 32.0 g L−1, respectively. Fish fed plant-based feed without KM were lighter (p < 0.05) than all other groups at day 45 and 90, but those fed a plant-based feed with KM had comparable growth and feed intake compared to that of fish fed the control diet. Irrespective of the presence of KM, animal-based feeds achieved comparable weight growth (p > 0.05) to the control and 5% KM plant-based groups, with KM increasing feed intake (p < 0.05). Between day 45 and 90, feed conversion ratios increased in all groups except the control and 0% KM plant-based group, while specific growth rates (SGRs) decreased for all except the 0% KM plant-based diet. Between-group differences (p < 0.05) were also noted for the thermal growth coefficient. No differences were recorded in visceral or intestinal weight, and whole-body lipid levels were identical, proportional for all groups. Although differences (p < 0.05) were apparent in the concentrations of individual fillet fatty acids between groups, a 75 g serving size of any treatment would be sufficient to exceed daily intake recommendations for EPA + DHA. This trial determined that benefit, in terms of feed intake and growth performance, was gained when KM was added to plant-based feeds. However, no such advantage was observed when KM was used with animal-based feeds.
Key Contribution: This manuscript highlights the lack of effect of krill meal (KM) when used as a supplement at 2.5–5.0% in alternative animal-based aquafeeds for Atlantic salmon. However, when used in plant-based aquafeeds, KM appears to act as a palatant, increasing salmon feed intake and growth.

1. Introduction

The most important operating variable during Atlantic salmon aquaculture, representing around 47% of the cost of production in major salmon-producing countries, is feed [1]. Traditionally, salmon feed has relied heavily on fishmeal (FM) and fish oil (FO) as major ingredients [2,3]. This is because FM has high nutrient density, is decidedly digestible and palatable, and has an outstanding profile of essential amino acids, vitamins, and minerals. Because salmon and other vertebrates lack the δ12 and δ15 desaturases needed to convert oleic acid (18:1 n-9) into linoleic (C18:2 ω-6) and α-linolenic (18:3 ω-3) acid, they are unable to synthesize essential omega-3 fatty acids (EFAs) such as eicosapentaenoic acid (EPA) and docosahexaenoic acid (DHA) de novo [4,
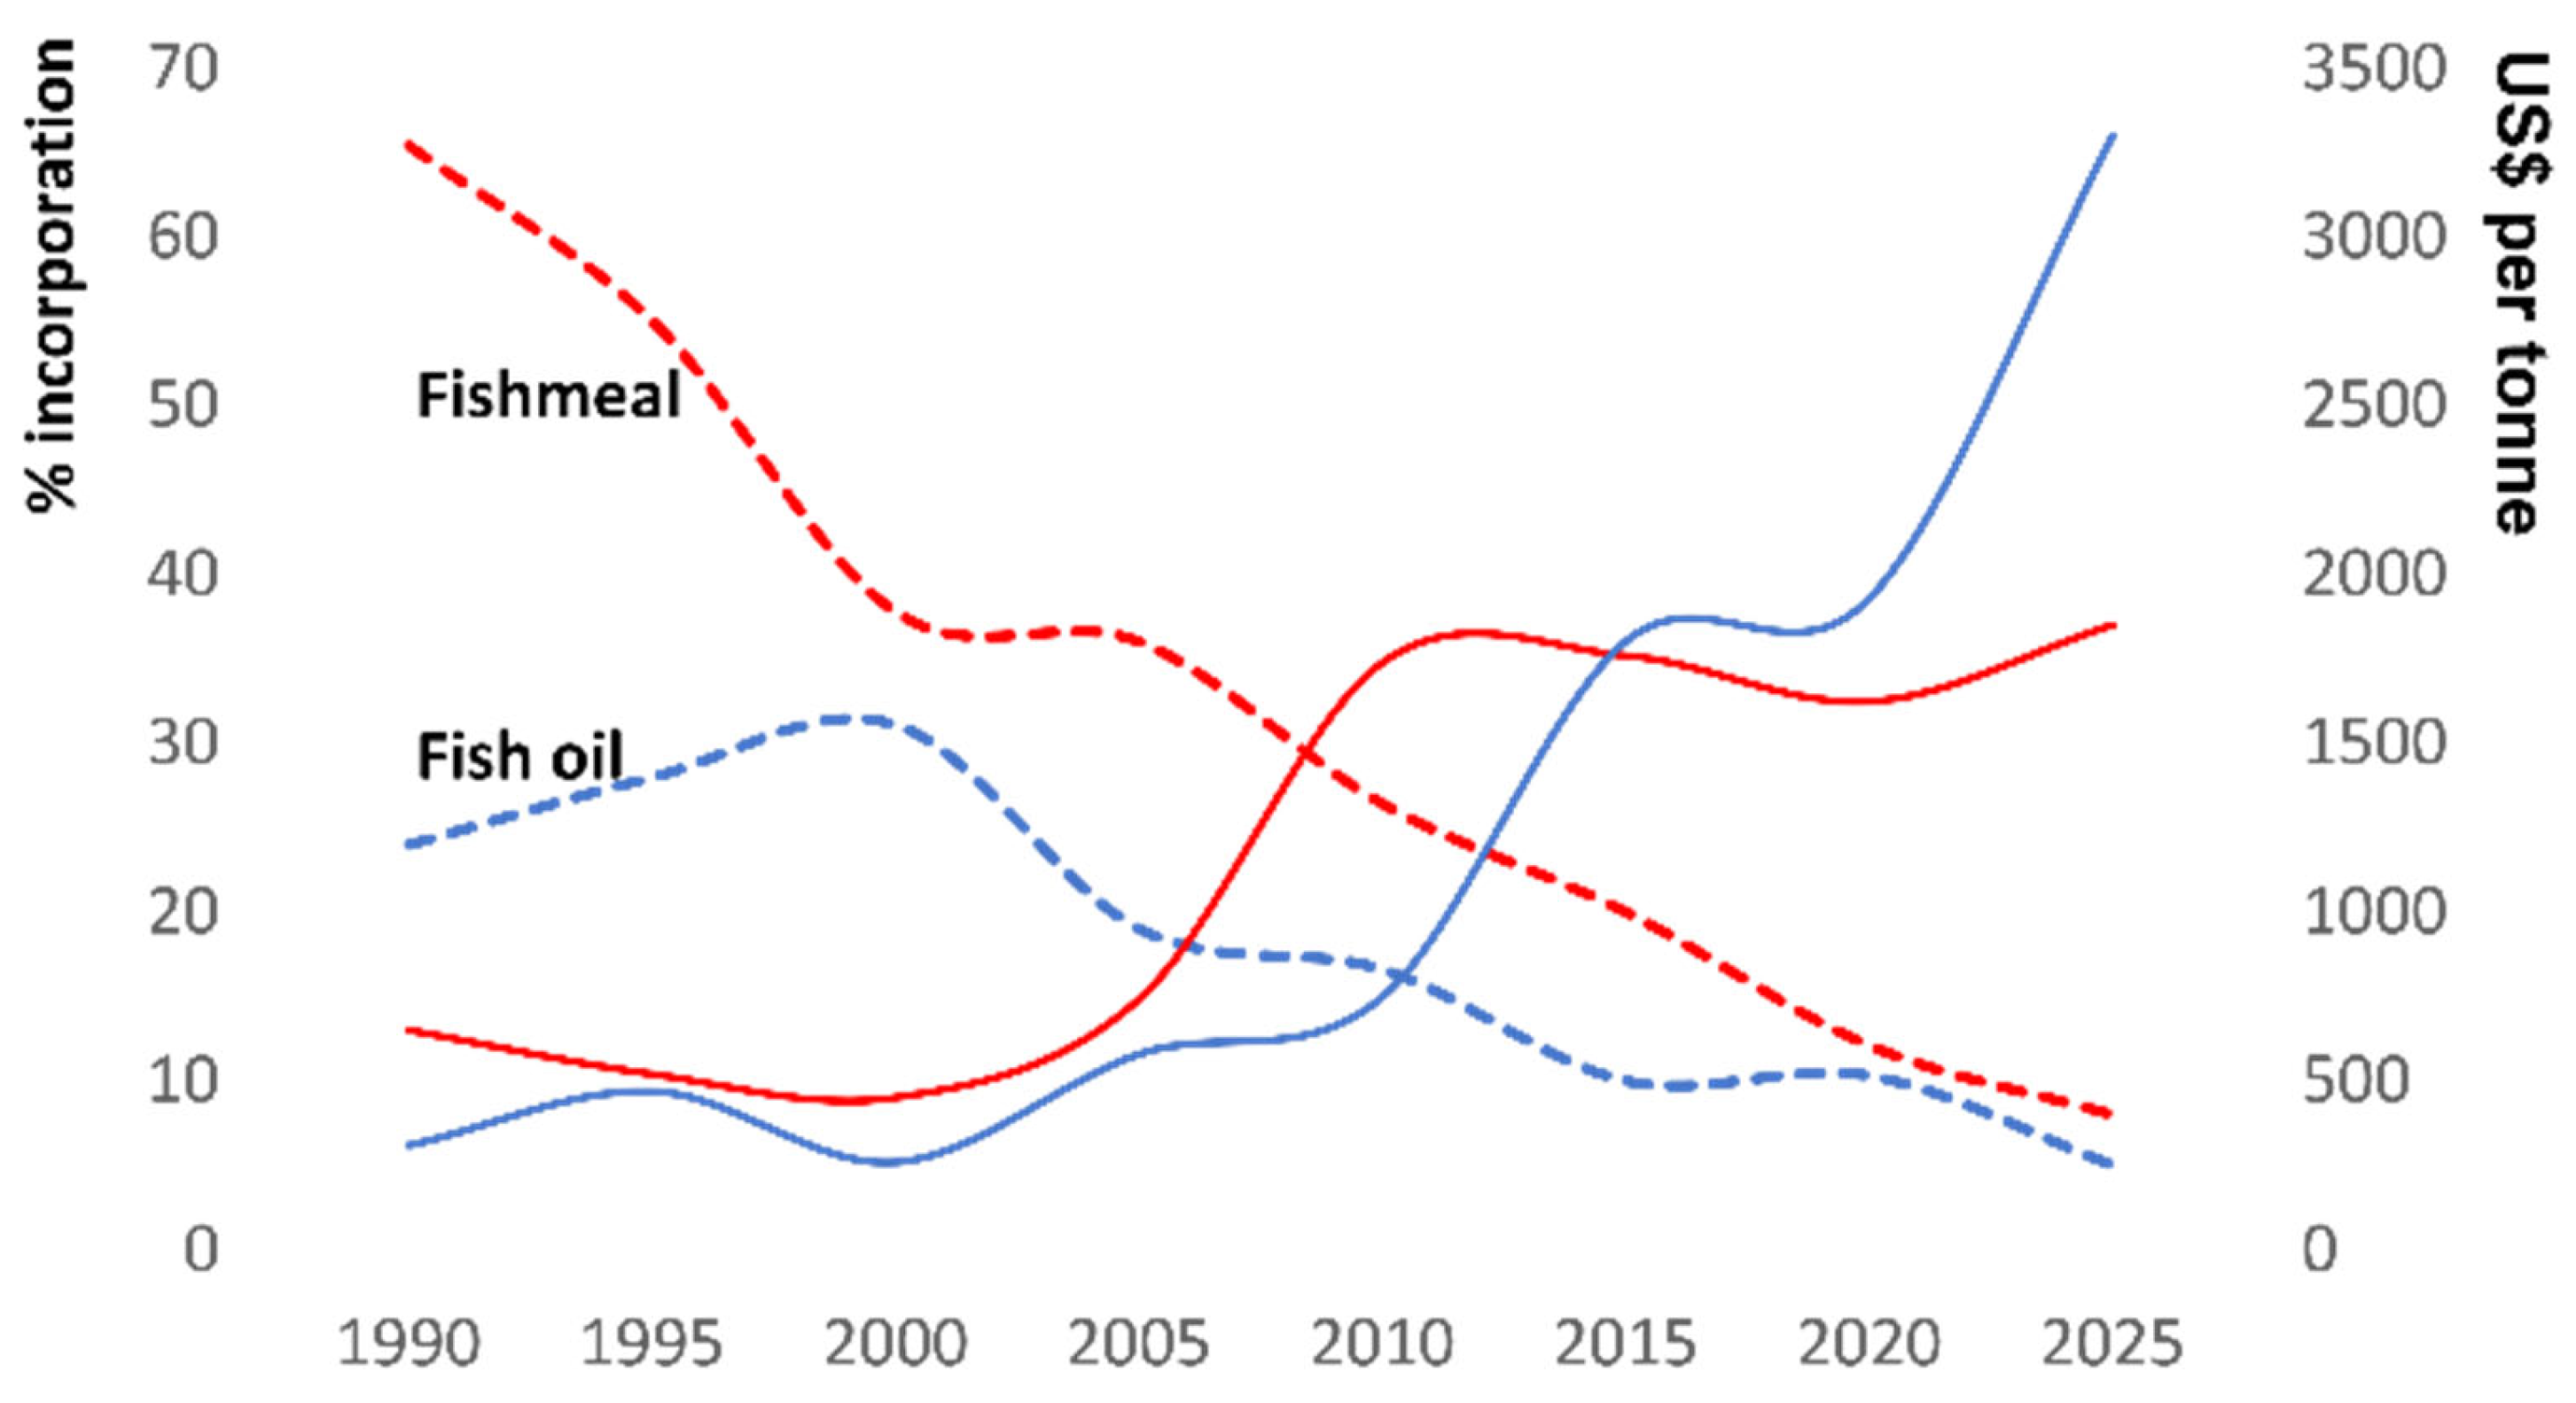
5]. For these reasons, FO, an excellent source of EPA and DHA, became the gold standard provider for farmed salmon. However, over the last few decades, there has been a steady reduction in the use of FM/FO in salmon feeds (Figure 1), and this trend is likely to continue for a variety of reasons. First, catches from industrial fisheries, which embody the key raw material for aquafeeds (i.e., forage fish), have experienced declines and fluctuations due to overfishing, natural events (e.g., El-Niño Southern Oscillation events), and climate change-induced effects [6,7]. Second, a greater proportion of forage fishes are now being used directly as human food [8,9], and third, competition for FM and marine oils has increased from the animal feeds sector, supplement, functional food, cosmetic, and pharmaceutical industries [10,11,12]. These factors have combined to raise the cost of FM and FO (Figure 1), and have spurred research into the use of alternative, more sustainable, and often cost-effective ingredients, which are now finding a more prominent place in marine carnivore feeds.
Conventionally, the replacement of FM in salmon feeds has been undertaken using both plant-derived and animal by-product ingredients [18]. Some diets, and especially those having higher levels of plant proteins, have been associated with reduced feed intake, poorer feed conversion, and corresponding growth penalties [19,20,21,22,23,24]. This diminished growth has been attributed to several factors, including imbalances in dietary essential (EAA) and dispensable (DAA) amino acids, the presence of indigestible starch/fiber, anti-nutritional factors (ANFs), and decreased feed palatability [24,25]. Similarly, while many studies have determined that Atlantic salmon can be raised using vegetable oils, disproportionate dietary levels can change gut architecture, its microbiome and gene expression, as well as impair barrier functions and absorptive processes while reducing overall vigor and growth [26,27,28,29,30]. Accordingly, while there exists an ever-growing collection of alternative proteins and oils, each has its own nutritional characteristics, technical characteristics, and constraints that may influence their suitability for producing practical salmon feed formulations.
Slower feeding and reduced feed intake are common issues observed with aquafeeds containing high levels of alternative, and usually unfamiliar ingredients. Diminished feed consumption leads to lower and slower growth, and lessens financial gain while increasing the potential for environmental degradation—and in RAS-based systems, increasing handling and solids removal combined with failing water quality. Various strategies have been employed to overcome these predicaments including, but not limited to, optimizing pellet size, shape, color, and texture, pellet resilience, and buoyancy in the water column. Fundamentally, any offered feed must, of course, be appealing to the target species to ensure optimal consumption. A frequently used tactic to attract and stimulate food consumption has been to utilize so-called feed palatants and/or attractants. A variety of studies have determined that a range of nucleotides, amino acids, and others, either alone or in combination, act as potent gustatory and olfactory stimuli that initiate arousal, searching, and consummatory behaviors in fishes [31,32,33].
Antarctic krill meal (KM) has been favored as a salmon feed additive due to several factors. For example, electrophysiological evaluations of olfactory and gustatory responses are augmented when diets are supplemented with KM and extracts thereof [34]; when added to soybean-based diets, KM has been reported to have an overall beneficial effect on growth when compared to FM-containing feed [35]. The feed stimulating activity of KM is believed to be due to synergism between amino acids and/or nucleotides [35,36,37]. Many trials, with various species of marine, diadromous, and freshwater fishes, at various points in their production cycle, have reported that KM products act as feed attractants/stimulants in non-FM-based diets and as FM replacers, providing a significant benefit [38,39,40,41,42,43,44]. These studies variously describe increased growth, feed intake, conversion efficiencies, enhanced coloration, and favorable fatty acid (FA) profiles in treated fish, including salmonids [42]. However, there are instances recorded in the literature [45,46,47,48,49] where the addition of KM to diets, or as a FM replacer at various concentrations, had variable, no beneficial, and even negative effects, and these too include studies with salmonids [50,51,52,53].
Accordingly, there remains some doubt regarding the merit of using KM and its associated products in aquafeeds. Nevertheless, most krill caught today are utilized by the aquafeed industry [54]. Moreover, an increasing number of reports point to sharp declines in regional Antarctic krill densities due to climate-induced changes in ocean temperature, currents, recruitment, acidification, overfishing, or a combination of these factors [55,56,57,58,59,60]. If krill populations experience negative consequences due to increased fishing pressures and climate change, various analyses and predictive models forecast corresponding perturbations in predator species (seabirds, seals, cetaceans) abundance [61,62,63]. Hence, it is clearly relevant to verify the value of using KM in salmon diets. Here, we examine the impact of incorporating KM into FM/FO-free diets in which animal- or plant-based proteins replace that of FM, while FO is substituted by vegetable and algal oils. KM was integrated into the experimental diets at 0, 2.5, and 5% levels. The response of post-smolt Atlantic salmon to the test diets was also assessed against a FM/FO-based feed over a period of 90 days with minimum physical disturbance to the animals.

2. Materials and Methods

This study was executed at the Centro Experimental Acuícola, Vitapro Chile, Carretera Austral km 23.8, Quillaipe, Puerto Montt, Chile. The described research complied with all relevant internal (code: CEA-1-C-0522) and international animal welfare laws, guidelines, and policies.

2.1. System

The system employed comprised twenty-eight circular 0.5 m3 fiberglass tanks with a water exchange rate of ~1.5 tank volumes h−1. The tanks were supplied with coastal seawater pumped directly from Quillaipe Bay. Incoming seawater was filtered using 60 µm rotary filters and subsequently disinfected with UV light before passing into a sump. Sump water was passed through a quartz sand filter to a degasser and then to a low head oxygenator before being delivered to experimental tanks. Water quality parameters were monitored daily throughout the trial with temperature and oxygen saturation being recorded six times daily using portable equipment (OxyGuard® Handy Polaris C, Oxyguard International A/S, Farum, Denmark). Salinity was measured using a Refractec LTech refractometer, while pH was recorded daily with an EcoSense pH10 Pen (VWR International, Radnor, PA, USA) and alkalinity recorded weekly using an EcoSense 9500 Photometer (YSI Inc., Yellows Springs, OH, USA). The average temperature was 11.8 ± 0.56 °C, oxygen saturation was 103.5 ± 5.81%, pH was 7.38 ± 0.10, and salinity was 32.0 ± 0.00.

2.2. Animals and Husbandry

Initial tank fish stocking density was ~17.88 kg m−3, comprising 60 fish of 148.4 ± 12.9 g, 23.4 ± 0.8 cm and a condition factor (K) of 1.20 ± 0.08, randomly distributed into each tank. After stocking, the 28 experimental units were randomly assigned to one of seven diets (n = 4 tanks per diet). The ingredient compositions of the diets are presented in Table 1. In short, a FM-based diet (C1) was used as a control for comparison against three plant protein-based diets (P1, P2, P3) and three animal protein-based diets (A1, A2, A3). Each of the plant- and animal protein-based diets contained algal and canola oils in place of FO, and either 0, 2.5, or 5% KM, while C1 contained fish oil and 0% KM. Dietary EAA (g 100 g−1 protein) profiles, proximate compositions, peroxide indices (meq O2 kg−1), and mercury levels are provided in Table 2, while Table 3 summarizes each diet’s FA profiles. Pellets were manufactured at the feed extrusion plant of the Centro de Estudios de la Universidad de Santiago, Llanquihue (Usach). The pellet diameter was 4 mm, and animals were fed ad libitum using VARD Fincantieri automatic feeders connected to Crouzet Millenium 3 controllers programmed for a 14-h cycle with 3 to 4 s pulses every 6 to 8 min. For the estimate of food intake, all uneaten pellets were recovered twice daily from each tank and their total wet weight recorded together with the wet weight of 30 individual pellets. For each diet correction factor, a triplicate of the weight of a total of 100 pellets was made. Halfway through the trial, fish numbers were reduced by 15 individuals per tank to adjust stocking densities and remove any potential of density affecting growth through the trial end. Prior to population thinning, animals were fasted for 2 days. Fish were subsequently left undisturbed (apart from feeding) until the end of the trial. During any manipulations, animals were anesthetized with 20% benzocaine in 80 L of water.

2.3. Fish Sampling

Fish were weighed using a Pesamatic® digital scale (Ernesto Pinto Lagarrigue No. 148, Santiago, Chile) to the nearest 0.1 g and measured to the nearest mm using an ichthyometer. Other parameters measured included:
P e r c e n t   w e i g h t   g a i n   =   f i n a l   w e i g h t   ( g )     i n i t i a l   w e i g h t   ( g )   i n i t i a l   w e i g h t   ( g )   ×   100
P e r c e n t   s u r v i v a l   =   n u m b e r   o f   i n i t i a l   f i s h n u m b e r   o f   h a r v e s t e d   f i s h n u m b e r   o f   i n i t i a l   f i s h   ×   100
S p e c i f i c   g r o w t h   r a t e   ( S G R )   = ln   f i n a l   w e i g h t   ( g )     l n   i n i t i a l   w e i g h t   ( g )   ×   100 n u m b e r   o f   d a y s
T h e r m a l   g r o w t h   c o e f f i c i e n t   ( T G C )   = [ W 2 1 3 W 1 1 3 ] o D   ×   1000
where:
  • W2 = weight (g) at time 2 (end of period), W1 = weight (g) at time 1 (beginning of period)
  • °D = Degree-days, sum of daily temperatures in °C between t1 and t2.
    C o n d i t i o n   f a c t o r   ( K )   = f i n a l   w e i g h t   ( g )   f i n a l   l e n g t h 3   ( c m )     ×   100
    H e p a t o s o m a t i c   i n d e x   ( H S I )   = l i v e r   w e i g h t   ( g )   b o d y   w e i g h t   ( g )     ×   100
    E n t e r o s o m a t i c   i n d e x   ( E S I )   =   g u t   w e i g h t   ( g )   t o t a l   w e i g h t   ( g )     × 100  
    F e e d   c o n v e r s i o n   r a t i o   ( F C R )   =   t o t a l   w e i g h t   o f   f e e d   c o n s u m e d   ( g )   t o t a l   w e i g h t   g a i n   o f   f i s h   ( g )     ×   100
    E c o n o m i c   ( e ) F C R   =   f o o d   f e d   ( k g ) b i o m a s s   g a i n   ( k g )   +   h a r v e s t e d   b i o m a s s   ( k g )   ×   100
    P r o t e i n   e f f i c i e n c y   r a t i o   ( P E R )   =   t o t a l   w e t w e i g h t   g a i n   ( g ) d r y   w e i g h t   o f   p r o t e i n   i n   d i e t   ( g )   ×   100
    P r o t e i n   p r o d u c t i v e   v a l u e   ( P P V )   =   p r o t e i n   g a i n   ( g ) p r o t e i n   f e d   ( g )   ×   100
    S p e c i f i c   f e e d i n g   r a t e   ( S F R )   =   a m o u n t   o f   f e e d   c o n s u m e d   d 1   a s   %   f i s h s   b o d y   w e i g h t

2.4. Laboratory Analyses

At trial start, 25 stock fish and 1.5 kg of each experimental diet stored in plastic containers were taken for later proximate analysis, assessment of amino acid profiles, and the determination of fatty acid contents. An additional 500 g sample of each feed was taken and maintained in a sealed bag at 4 °C to check peroxide and mercury (Hg) values at trial end, which were undertaken employing AOAC Official Method 965.33 and 971.21, respectively. Lipid analyses were undertaken according to ISO 6492:1999 (AOAC Official Method 922.06), analyses for crude protein were undertaken according to ISO 5983-2:2009 (AOAC Official Method 988.05), analyses for ash were undertaken according to ISO 5984:2002 (AOAC Official Method 923.03), and analyses for moisture were undertaken according to ISO 6496:1999 (AOAC Official Method 935.29). Fatty acid analyses were undertaken using gas chromatography-flame ionization detection according to the American Oil Chemists’ Society Official Method Ce 1i-07. Amino acids were quantified by IC-UV according to Method EU 152/2009 (acid hydrolysis), and tryptophan was quantified with LC-FLD according to Method EU 152/2009 (alkaline hydrolysis).

2.5. Statistical Analyses

All data were statistically analyzed using JASP software (JASP Team, 2020; version 0.14.1). One-way analysis of variance (ANOVA) was employed to evaluate differences after homogeneity and normality tests. Significant differences among group means were compared using Tukey’s studentized range (honestly significant difference) test at the α = 0.05 level.

3. Results

There were no differences in weight, length, or condition factor (K) between treatment groups at the start of the trial (Table 4), and test diets had no negative impact on the survival of experimental fish over the length of the study. A total of two mortalities (“jumpers”) were recorded over the 90-day trial, and these fish originated from different tanks and dietary treatments. Replacement of FO with vegetable and algal oils while altering dietary profiles of individual FAs did not affect total dietary saturated, monounsaturated, or polyunsaturated fatty acids (Table 3). Higher (p < 0.05) levels of C14:0, C15:0, C16:1 ω9, C20:1 ω9, and C22:1 ω9 were measured in the C1 feed when compared against all other diets. Unlike all other diets, the C1 feed also incorporated C18:3 ω6, C20:2 ω6, C20:3 ω3, and C20:3 ω6 (p < 0.001). Dietary ω-3: ω-6 ratios were higher (p < 0.05) for the C1 feed when compared against all other diets (Table 3).
Measurements made during tank stock reduction (day 45) revealed that fish fed the P1 diet, the plant-based feed without KM, were smaller (p < 0.02) in terms of weight and length when examined against all other groups (Table 4). K was higher in fish that were fed animal-based feeds supplemented with KM compared against all other diets (p > 0.012), and by trial end, differences in weight, length, and 
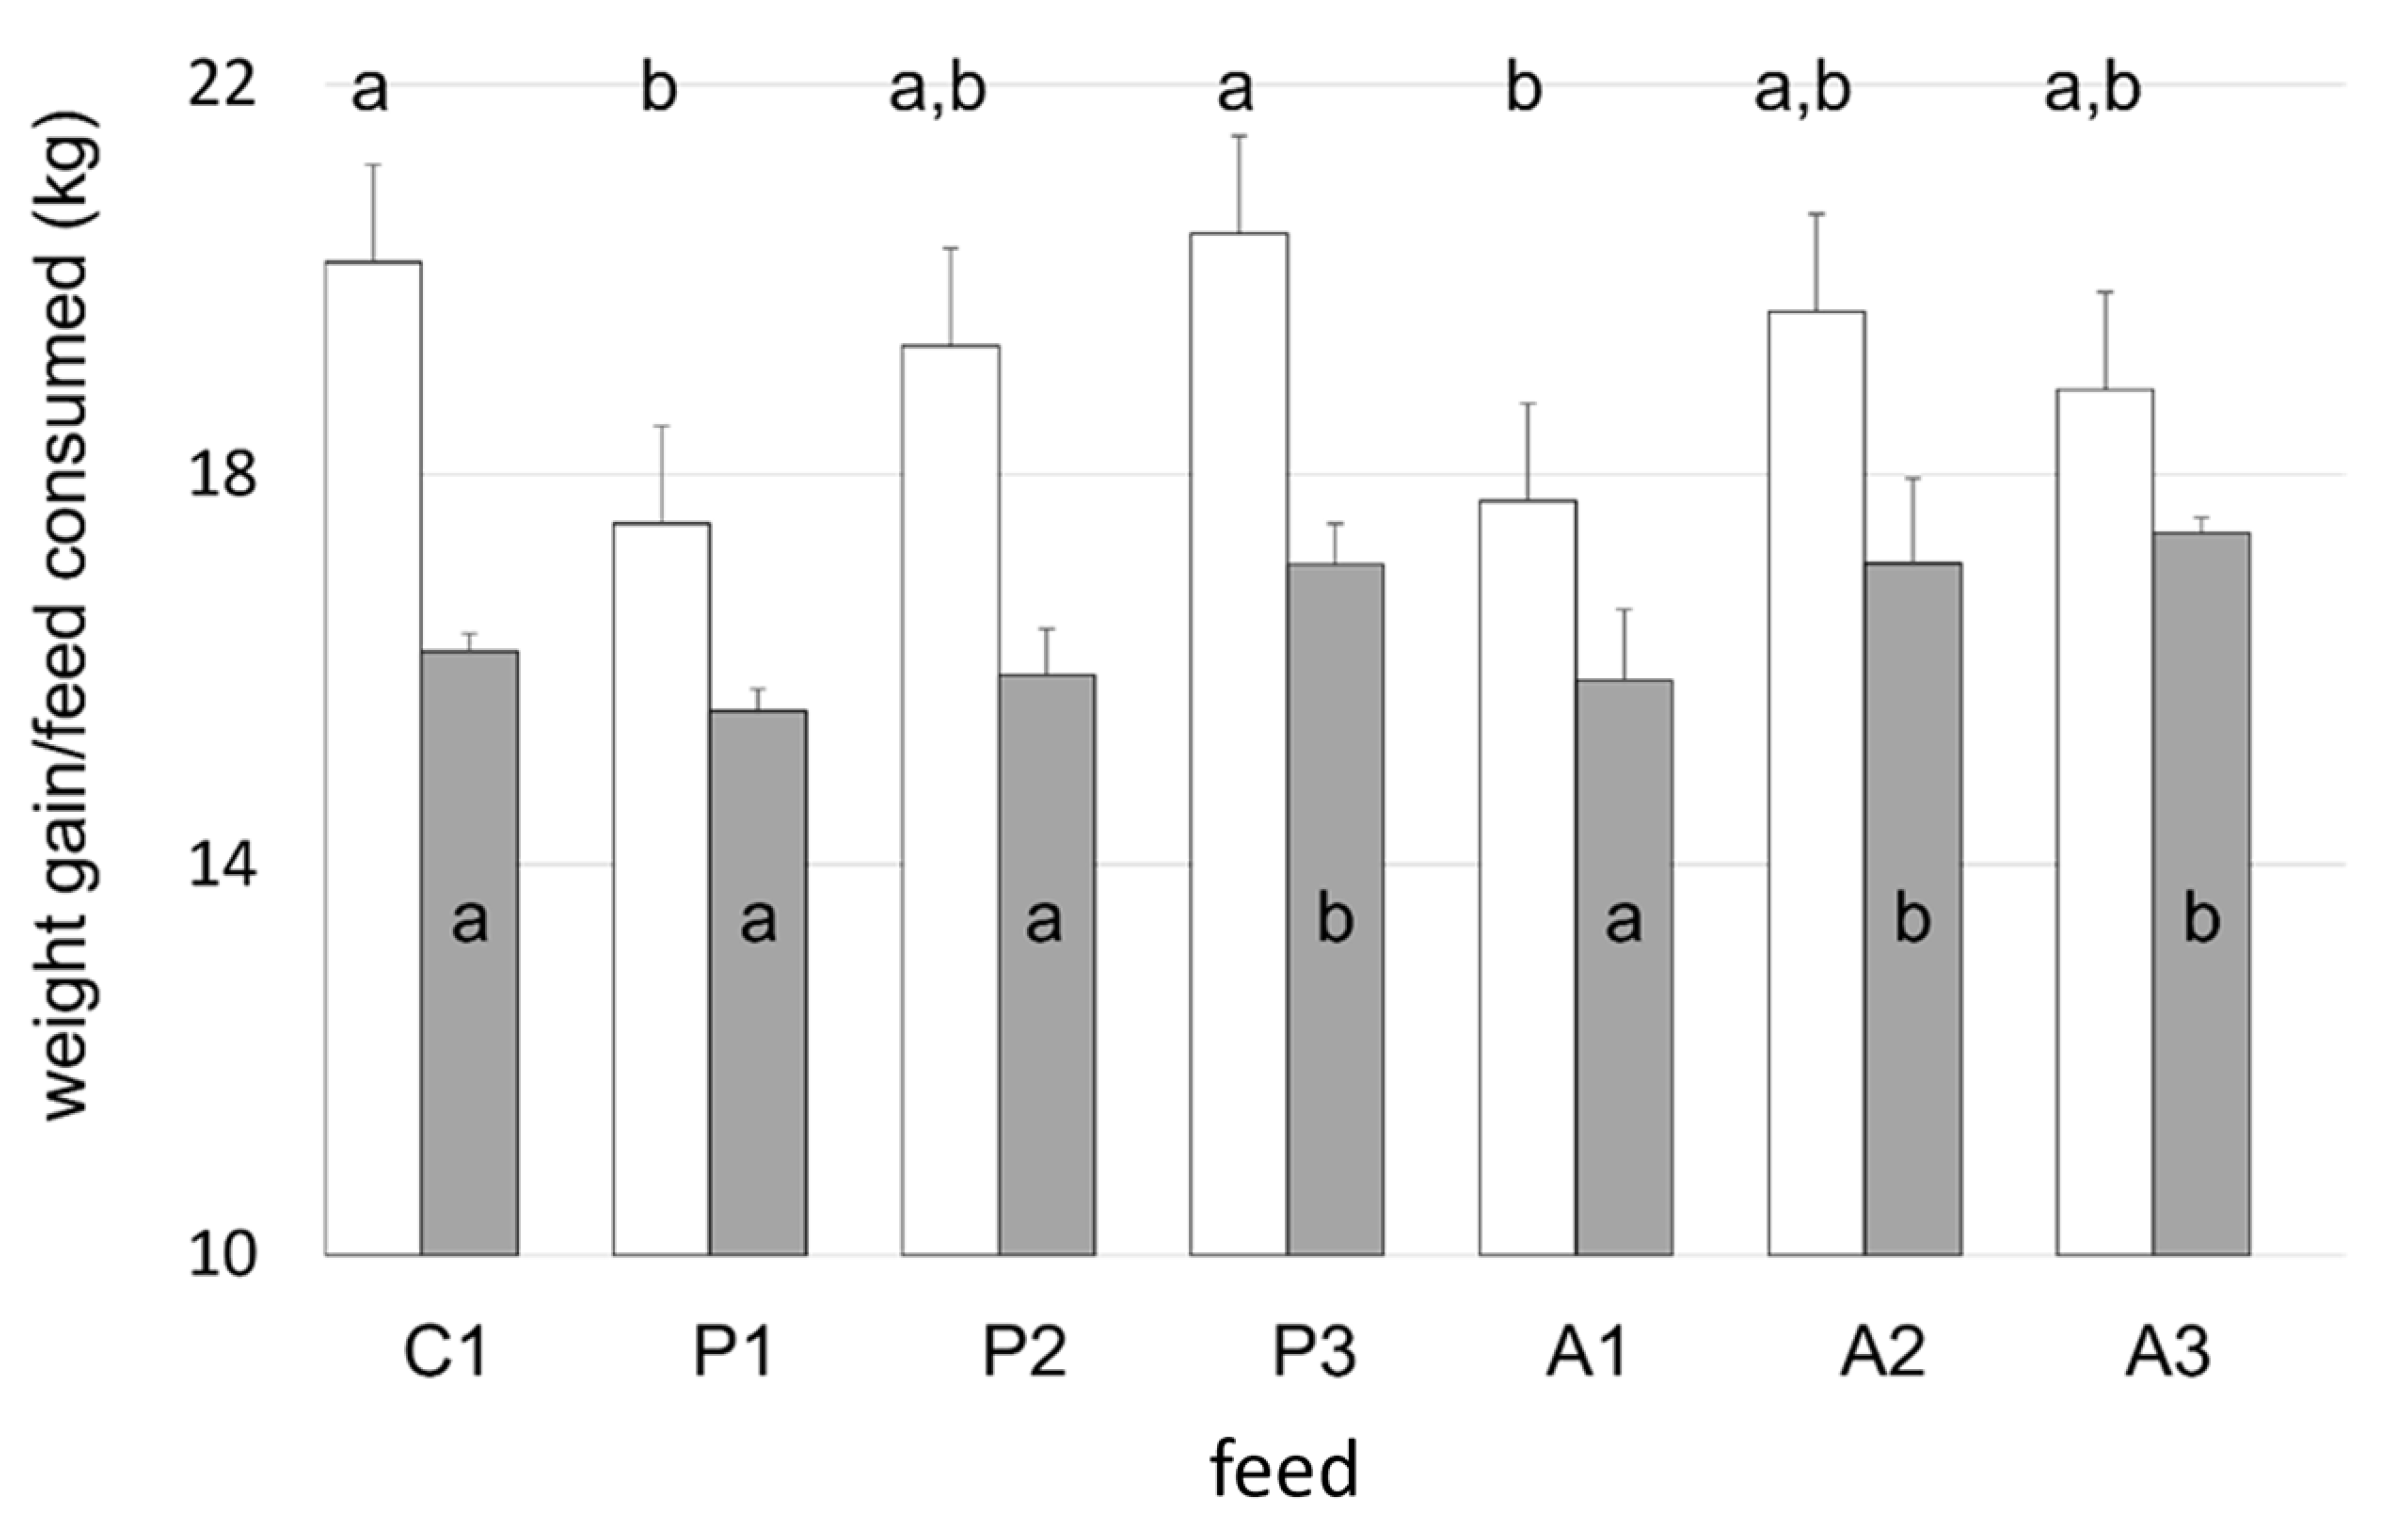
K were discerned between dietary groups. The supplementation of plant-based diets with KM resulted in a dose-dependent increase in weight gain of 6% and 10% for the 2.5% and 5% KM inclusion rates, respectively, even though dietary protein and lipid levels were equivalent to fish fed the diet devoid of krill (P1). The addition of KM to plant protein-based feeds increased total feed consumption at a 5% inclusion rate (P3) (p < 0.001) with a corresponding increase in tank biomass (Figure 2) such that overall biomass gain for P3 fish was identical to that measured in control tanks. Krill additions to salmon maintained on diets comprising mainly animal protein expressed differences in weight gain (Figure 2; Table 4), although not in a dose-dependent manner. Fish fed diets containing animal proteins (A1–A3) were shorter than control salmon, and this was reflected by differences in K (Table 4). As the duration of trial K increased, irrespective of feed type presented (p < 0.05), and by termination, all Atlantic salmon fed krill meal had the highest K, ranging from 1.37 to 1.39 and above (Table 4), which is considered a well-proportioned fish for the weight–length range [64].
The average daily group feed intake throughout the trial varied from 189.8 ± 2.7 to 212.3 ± 2.2 g per day. The greatest by the A3 group and the lowest feed consumption was exhibited by the P1 group, with the former being higher than that expressed by all other treatment groups. The lowest cumulative feed intake was recorded for the P1 group, but this did not differ from that of fish receiving the C1, P2, and A1 diets. The addition of KM increased feed ingestion by fish fed the animal protein-based diets (A2 and A3) and the plant-based feed at the 5% inclusion level (P3; Figure 2). The lower weight recorded for the P1-fed fish at day 45 was accompanied by a reduction (p < 0.004) in their SGRs relative to all other groups (Table 5). As anticipated, SGRs decreased (p < 0.05, Student’s t-test) between day 45 and 90 for all groups, reflecting the increasing fish weight. The only difference in SGR attained at trial end was observed when comparing the plant protein-based diets void of krill (P1). Mimicking the results recorded for weight gain and SGR, FCRs of salmon fed the P1 diet were higher (p < 0.007) than all other groups (range 0.78 ± 0.06 to 0.85 ± 0.07) at the trial’s mid-point (day 45; Table 5). By trial end, the highest and most comparable biological FCRs were observed for P1 and A3 fish (p < 0.04). The FM/FO-based control diet (C1) returned a biological FCR that was identical to that recorded at the mid-point, whereas all other diets tested expressed higher values, except for the P1 feed, which exhibited an improvement (Table 5). Examination of daily food intake, expressed as a percentage of body weight, viz. SFR, revealed that the highest intake was established by fish fed the P3, A2, and A3 diets, and this differed (p < 0.03) to that of the lowest intake illustrated by salmon fed the control (C1) diet (Table 5). Calculation of the thermal growth coefficient (TGC) revealed that the P3 treatment resulted in the highest value (2.66 ± 0.04), differing (p < 0.02) only to the result for fish fed the P1 feed (2.39 ± 0.09). All other treatment groups had similar values for the TGC ranging from 2.51 to 2.62.
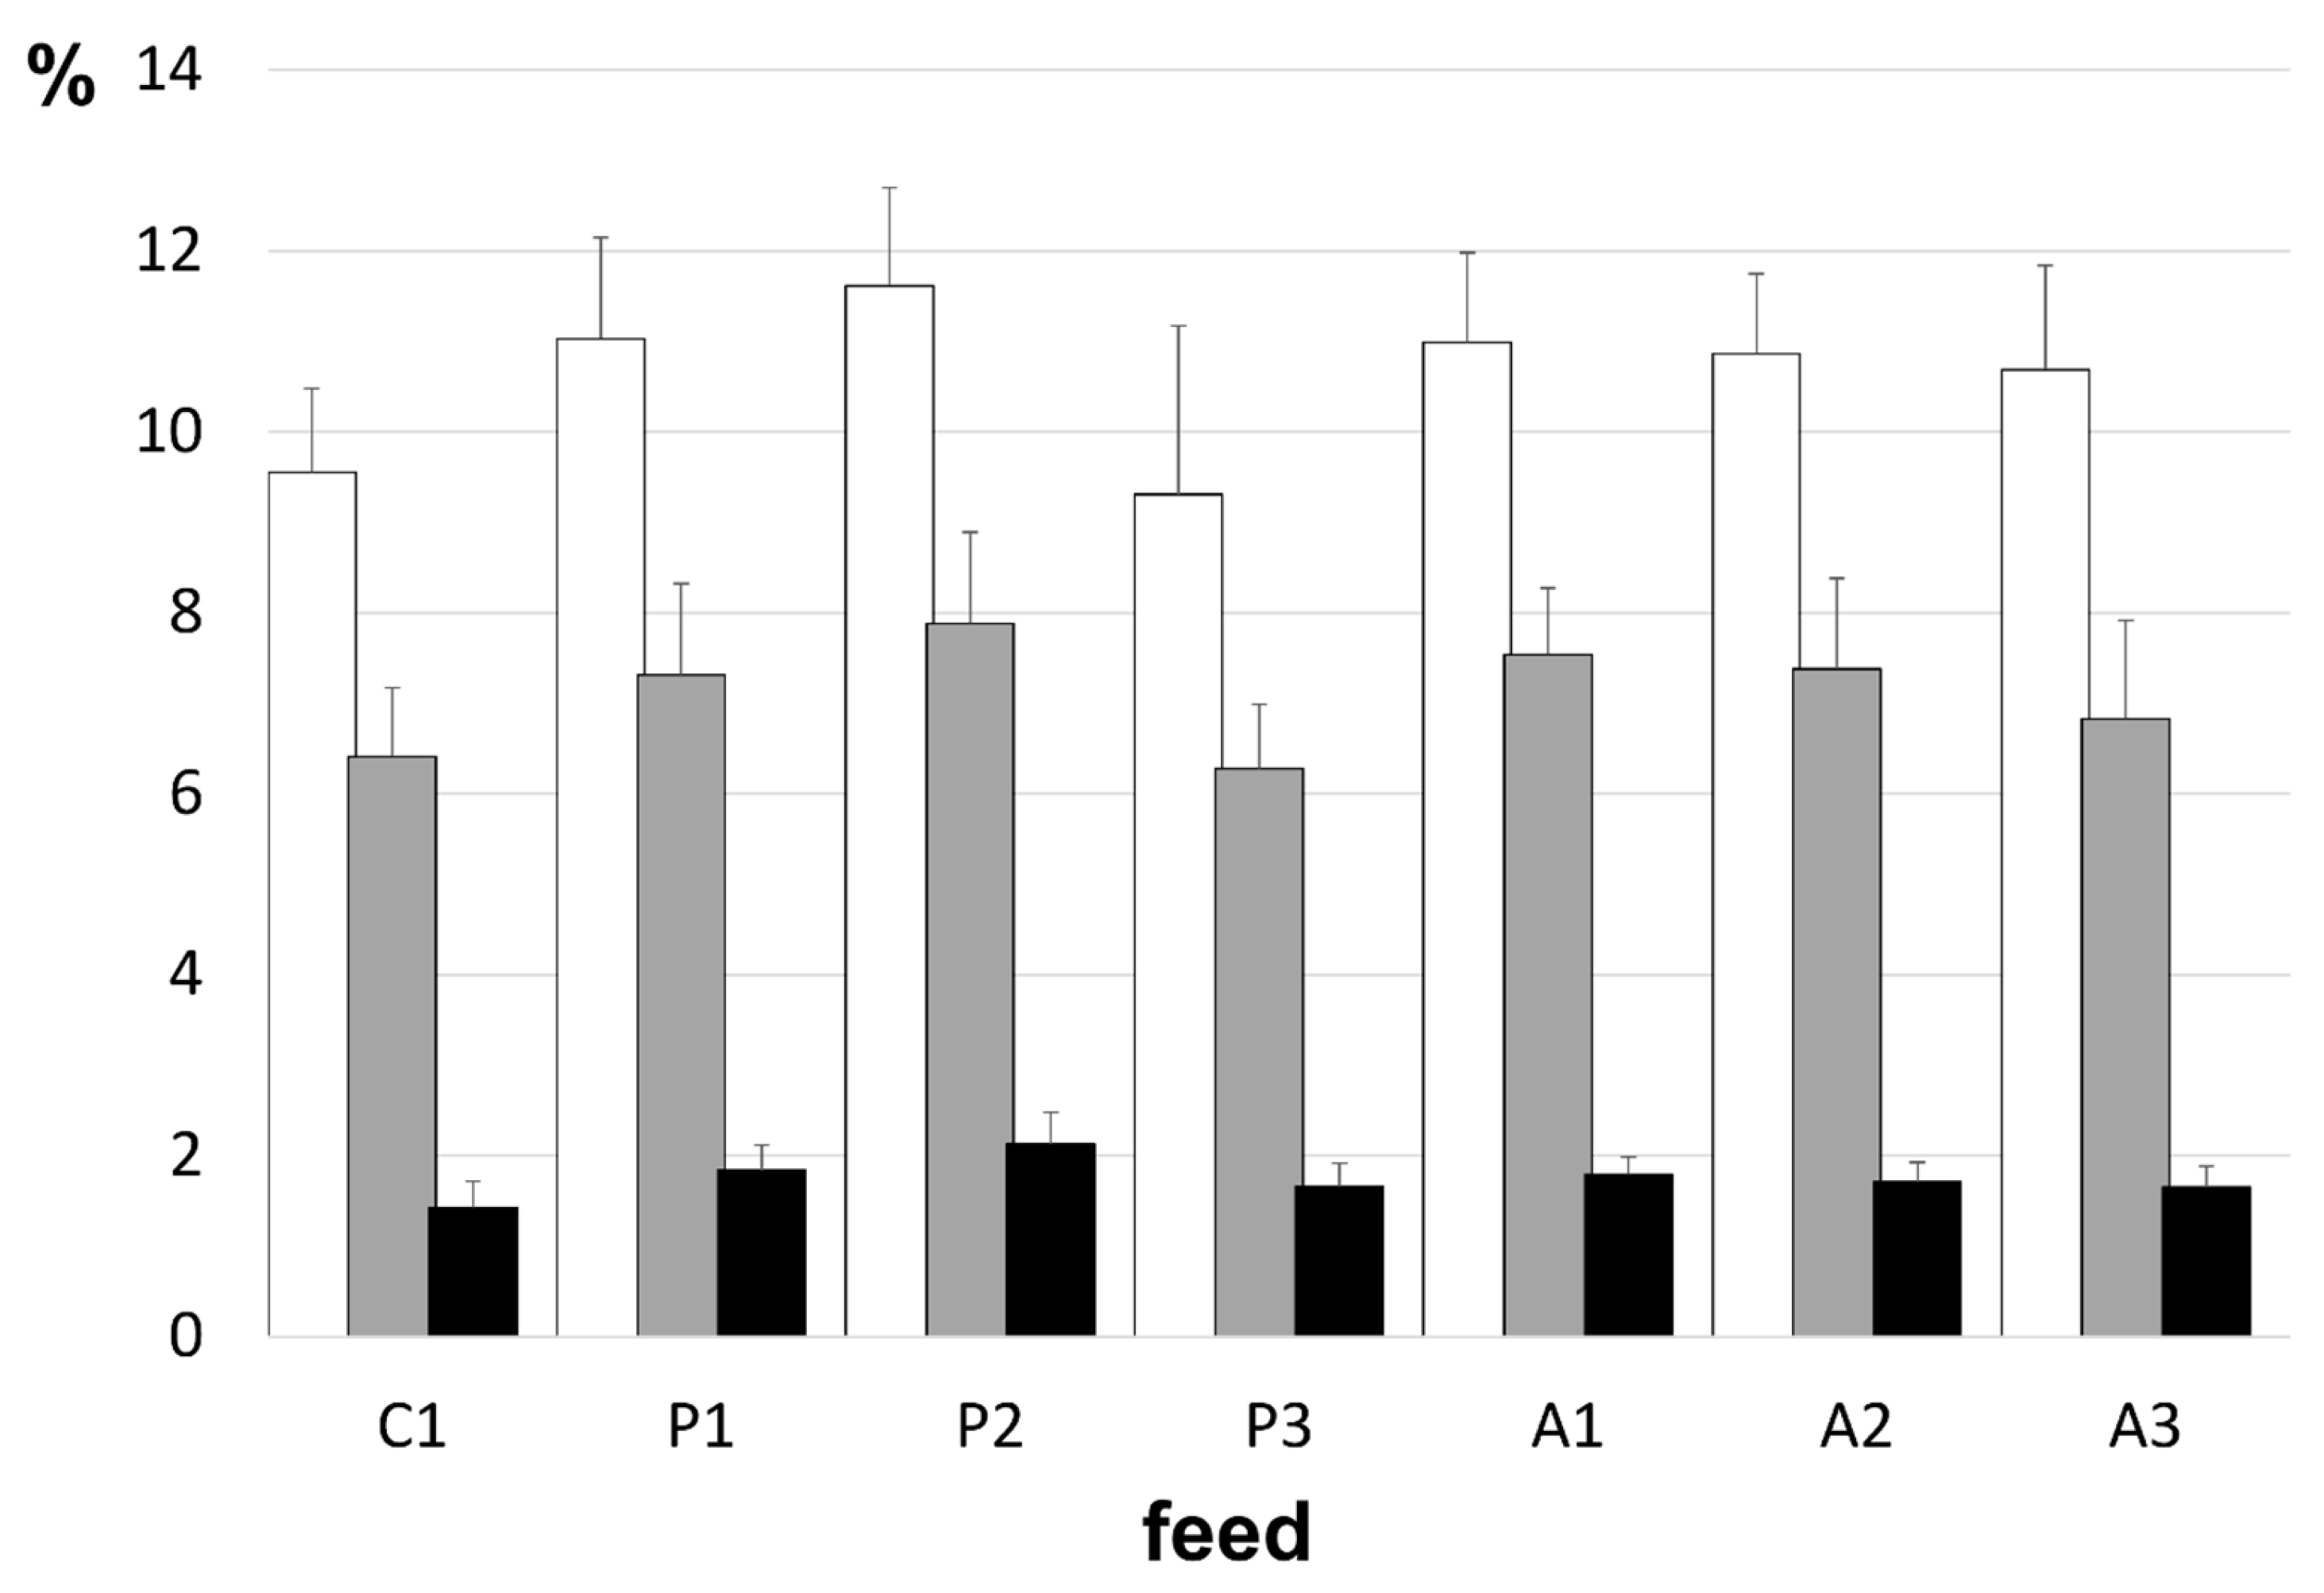
At trial termination, the examination of twelve randomly taken fish from each treatment (n = 3 per tank; 12 per treatment) revealed no between-group differences in weight, length, visceral mass, or weight of the intestine (Table 6; Figure 3). Fillet yields too, were identical. Evaluation of fillet proximate composition revealed no differences between treatments for lipid, moisture, or ash contents (Table 6). However, protein levels were affected, with salmon fed the plant-based diets expressing higher levels (p < 0.047). Irrespective of experimental diet fed, whole-body lipid levels were the same proportionately for all groups (Table 7). However, fish fed the control (C1) FM/FO-based diet expressed higher (p < 0.05) myristic (C14:0) and palmitoleic (C16:1 ω9) acid levels, as well as elevated docosapentaenoic acid levels (C22:5 ω3; Table 6). The most plentiful of the monounsaturated fatty acids, probably reflecting the use of canola oil in the feeds, was oleic acid (C18:1 ω9).

4. Discussion

Atlantic salmon fed on a primarily plant-based diet grew ~220% throughout the current trial without mortality. Moreover, values for their SFR, PPV, PER, morphological characteristics, and composition did not vary to those of control fish fed a FM/FO-based diet. Their growth rates, however, lagged behind all other treatment groups from day 45 onwards. These observations are thus generally in agreement with many other studies on Atlantic salmon where FM has been replaced with various plant proteins [20,21,22,23,65,66]. For example, in a comparable study, using fish of similar size and fed various plant concentrate-based feeds together with canola oil, the DHA-EPA rich marine algae Nannochloropsis oceanica and low levels of FO, a 123–157% increase in body weight was observed after 84-days; however, growth of the FM/FO control group was greater (p < 0.001) [67]. In the present study, feed intake and TGCs were similar to that of other experiments with plant-based feeds, whereas FCRs were higher but still well within previously recorded ranges for Atlantic salmon. As is the case with FO alternatives (op. cit.), replacement of FM with blends of plant proteins, including those that incorporate high levels of soy protein concentrate, have been reported to cause dysbiosis and influence the intestinal transcriptome of Atlantic salmon [68]. Indeed, it is well established that when fed diets containing legumes, salmon can develop enteropathy, especially in the distal intestine [27,69]. This condition is characterized by changes in the dimensions of intestinal folds, reductions in enterocytic absorptive vacuoles, and infiltration of various inflammatory cells into the lamina propria. Plant proteins may also influence the activities of digestive enzymes [70,71]. These dysfunctions, together with those that impact the expression of genes involved in enteritis, among a packet of others [72], could potentially cause changes to gut permeability and barrier function—effects that could partially explain the increased FCR and reduced fish performance noted here.
In contrast to the plant-based diets, salmon presented the KM-free animal protein-based feeds performed as well as the control group. However, similar observations to those presented here have been made previously for salmon and other fish that were fed diets high in poultry meal [73,74,75], although some contradictory studies have been presented [76]. The inconsistency in accounts may reflect the use of different quality raw materials. For example, due to the variety of generally unsegregated material used for poultry meals, together with differences in processing and equipment, their protein content and nutritional quality varies—lacking certain EAAs, being high in ash, and expressing variable digestibility [77,78]. However, the poultry meal diets employed in the present study, which included other sources of dietary protein, expressed protein, ash, and EAA profiles not dissimilar to those of FM feeds. This may explain why the addition of KM to animal protein-based diets had no positive influence on Atlantic salmon weight growth. However, KM did increase feed consumption, and when incorporated at 5%, a significant increase in FCR occurred compared to the FM/FO control. The latter observations thereby imply that no advantage was gained with the addition of up to 5% KM in animal protein-based feeds. Similar observations have been made previously, especially with higher levels of dietary KM [79,80], but the noted lack of advantage generally contrasts to those of others. Thus, increased feed intake and superior growth in various species of salmonids fed FM-based diets with up to 80% KM inclusion have been commonly reported, but beyond this level, depressed growth and lower FCRs have been reported [43]. The inconsistencies encountered with KM substitution of FM and alternative proteins in salmon diets have several potential explanations. For example, KMs are known to express seasonal, annual, and geographical variations in body composition [57,81] and hence nutritional quality, fluctuating in lipid and protein content, profile, and digestibility. Second, it has been established [79] that incorporation of whole krill into meals reduces salmon growth relative to the use of partially deshelled krill meal, which was believed due to the increased presence of chitin. Whole krill-meal-based diets have a ~2.5-fold greater level of chitin than partially deshelled krill meal. The differences in chitin presence have been considered responsible for negatively impacting trypsin activities, lipase activities, and bile acid production, leading to reduced lipid and amino acid digestibility [52,79,82]. Partially supporting these conclusions, the in vitro studies of [83] also illustrated reduced amino acid digestibility with increasing dietary whole krill meal. Dietary KM has also been associated with nephrosis in Atlantic salmon, with the severity of the pathology increasing with dose [79,84].
In contrast to the animal protein-based feeds, benefits were observed for KM supplementation in the diets containing plant proteins. Increasing inclusion of KM resulted in improved weight gain, with fish achieving growth parity to animals fed the FM/FO-based feed. Others have reported similar outcomes, with various species presented with substantially reduced dietary FM, or its complete substitution with plant proteins [39,40,49,85,86,87,88,89]. No nutritional benefit was apparent for the plant-based KM test diets since they contained similar protein levels to the FM-FO control feeds, but differed in individual EAA content and lipid content. Since the plant-5% KM diet (P3) returned identical PERs, PPVs, 90-day bFCRs, TGC, and 90-day SGRs to those of the control, the benefits garnered by the former group can be best explained by increased feed intake due to enhanced palatability. However, because there were no differences in whole-body composition or visceral indices between the two groups, protein-sparing effects [90,91] cannot be discounted. The possibility also exists that the KM itself contributed nutritional benefit by providing additional nutrients to the feed, including astaxanthin and nucleotides, both of which are known to influence salmon health and growth.
In today’s volatile FO market, dietary lipids rich in omega-3 long chain polyunsaturated fatty acids (LC-PUFAs) are becoming scarcer, and depending on the FO substitution level, the presence of EPA and DHA in commercial salmon feeds can vary greatly [92]. LC-PUFAs are engaged in a wide variety of cellular functions [93,94], and their requirements for laboratory-reared post-smolt Atlantic salmon range from 5 to 8% of the total pool of fatty acids (TFAs) [95], or 10–15 g kg−1 of the diet [96,97]. However, this requirement may be higher (>10% TFAs) when fish are maintained under more demanding conditions [29] as might be experienced, for example, under net pen operations. Based on fish growth performance, the diets used in the present trial evidently attained or exceeded recommended requirements for LC-PUFAs. These observations ratify earlier experiments that determined no effect of replacing FO with plant oils on Atlantic salmon growth [98,99]. An important consequence of FO replacement has been the disruption of EPA:DHA ratios, with some suggesting that this may even result in essential FA deficiency in farmed salmon [97]. Changes in EPA:DHA ratios, as noted in the present trial, can influence the expression of genes involved in the regulation of FA biosynthesis and metabolism in the mid- and hindgut and liver, as well as influencing immune function [30,95,100,101]. When vegetable oil replaces a large percentage of dietary FO, significant reductions in fillet 20:5ω3 (EPA) and 22:6ω3 (DHA) may also occur [102,103]. However, while the current study registered reduced fillet 20:5ω3, levels of 22:6ω3 remained unchanged, and this likely reflected higher dietary α-linolenic acid (18:3 ω-3), probably derived from canola oil, which salmon can bioconvert into 20:5ω3 and 22:6ω3 [103]. The lack of effect of the non-FO diets on DHA presence apparently reflects the dietary incorporation of algal oil as an integral component. The production of heterotrophic microalgae—such as certain Schizochytrium sp. strains—using fermentation technologies has provided the means to produce large quantities of biomass and processed oil yielding DHA and EPA. These yields are safe to use at 5% body weight [104], and previous studies with Atlantic salmon have demonstrated the utility of Schizochytrium biomass as a FO replacer, especially for DHA [105,106,107,108,109]. While early studies noted the paucity of EPA in Schizochytrium biomass, extracted oils from novel strains express EPA levels that support growth equivalent to fish fed conventional diets [110,111,112]. Indeed, the same algal oil as used in the present study is now incorporated into commercial salmon diets. Nevertheless, differences were uncovered in ω3: ω6 ratios between the control and experimental diets used herein. Disturbances in omega-3 FA profiles, which provide known health benefits to consumers [75], may reduce buyer incentive during purchasing decisions. Because of the wide-ranging health benefits of omega-3 fatty acids [113], international, national, and non-governmental organizations suggest that the daily intake of EPA + DHA should be between 200–500 mg [114,115,116]. Accordingly, a 75 g (2.8 oz.) serving of Atlantic salmon from the present trial, irrespective of dietary treatment, would exceed recommended daily intake levels (~590–745 mg).
Aquafeeds must be formulated to meet the biological requirements of the animal while being eaten in sufficient amounts to ensure survival and growth. Feed intake is reliant on various chemical, physical, and nutritional attributes that can each be modified by the ingredient selection and the processing technology used during pellet manufacture. While the present study employed a blend of seven alternative proteins and KM as a putative palatant, protein fractions from a wider variety of sources will undoubtedly become increasingly important as supply chains fluctuate and popular seafood species must be fed on cost-effective blended feeds. It is inevitable that new plant-based protein blends will be identified that more resemble the nutritional qualities of FM while reducing the potential for nutrient deficiencies [24,25,117]. As pressure increases for the inclusion of alternative proteins to replace FM, the incorporation of rendered products too will inevitably expand [118,119]. For example, global production of chickens is estimated to be 33 billion individuals, equivalent to 102 million tons for 2023 [120]. Raw materials left over from slaughterhouses and processing facilities represents about 30% of liveweight [121], or around 30 million tons, which simply cannot be ignored as a potentially valuable aquafeed ingredient [76,119,122]. Extensive incorporation of alternative animal proteins may lead to growth penalties, higher FCRs, and changes in body composition in salmonids [73,123,124,125,126]. However, these ingredients appear to express a nutritional profile that more closely mimics that of FM, and lack the ANFs associated with plant products. This may provide an explanation for the growth equivalence observed for the animal protein-based diets and that of the FM/FO control group. Inexorably, these novel formulations will require the inclusion of natural feeding stimulants [127]; as established herein, for plant-based diets, KM clearly offers potential. More extended feed trials are nonetheless warranted, since some reports indicate that the benefits of KM on feed intake may only be transitory [43]. Moreover, partially deshelled KM can significantly decrease the stability of feed pellets in the water column when compared to traditional pellets [84], which may be a function of the higher levels of soluble proteins in KM compared to FM [52]. Certainly, many issues involving the use of KM as a feed palatant remain unresolved.

Industry Application

As in the case of FM/FO, it would be prudent for feed formulators to utilize several more reliable (consistent quality and cost effective) products rather than limiting themselves to a single unpredictable wild-caught ingredient. Thus, the F3 Future of Fish Feed (F3challenge.Org (accessed on 12 January 2023)) launched the F3 Krill Replacement Challenge, utilizing a close variation of the P3 feed formula and experimental protocols described herein to identify potential krill replacements for aquafeeds. The challenge will wrap up in 2024, and results of this trial will be made available at that time, with the hope that the industry may adopt some of the tested market-ready krill replacements.

Author Contributions

Conceptualization, F.T.B.; draft manuscript preparation, E.M.; Resources, F.T.B., T.G.G., K.B.C. and E.M.; Writing—review and editing, F.T.B., T.G.G., R.C.M.S., S.A.C. and K.B.C.; Project administration, K.B.C. and R.C.M.S. All authors have read and agreed to the published version of the manuscript.

Funding

This research received funding through the Anthropocene Institute, 855 El Camino Real, Ste 13A N399, Palo Alto, CA 94301, USA.

Institutional Review Board Statement

This study was executed at the Centro Experimental Acuícola, Vitapro Chile, Carretera Austral km 23.8, Quillaipe, Puerto Montt, Chile. The described research complied with all relevant internal (code: CEA-1-C-0522) and international animal welfare laws, guidelines, and policies.

Data Availability Statement

All author-owned experimental data are available on request.

Acknowledgments

The authors express gratitude to the staff of the Centro Experimental Acuícola, Chile for assistance in executing the trial, and the Anthropocene Institute for its unwavering support throughout.

Conflicts of Interest

Frederick T. Barrows was employed by the company Aquatic Feed Technologies LLC. Ewen McLean was employed by the company Aqua Cognoscenti LLC. The remaining authors declare that the research was conducted in the absence of any commercial or financial relationships that could be construed as a potential conflict of interest.

References

  1. Iversen, A.; Asche, F.; Hermansen, Ø.; Nystøyl, R. Production cost and competitiveness in major salmon farming countries 2003–2018. Aquaculture 2020, 522, 735089. [Google Scholar] [CrossRef]
  2. Hardy, R. Alternate protein sources for salmon and trout diets. Anim. Feed. Sci. Technol. 1996, 59, 71–80. [Google Scholar] [CrossRef]
  3. Shepherd, C.J.; Jackson, A.J. Global fishmeal and fish-oil supply: Inputs, outputs and markets. J. Fish. Biol. 2013, 83, 1046–1066. [Google Scholar] [CrossRef] [PubMed]
  4. Monroig, Ó.; Kabeya, N. Desaturases and elongases involved in polyunsaturated fatty acid biosynthesis in aquatic invertebrates: A comprehensive review. Fish. Sci. 2018, 84, 911–928. [Google Scholar] [CrossRef]
  5. Tocher, D.R.; Betancor, M.B.; Sprague, M.; Olsen, R.E.; Napier, J.A. Omega-3 long-chain polyunsaturated fatty acids, EPA and DHA: Bridging the gap between supply and demand. Nutrients 2019, 11, 89. [Google Scholar] [CrossRef] [PubMed]
  6. Palomares, M.L.D.; Froese, R.; Derrick, B.; Meeuwig, J.J.; Nöel, S.-L.; Tsui, G.; Woroniak, J.; Zeller, D.; Pauly, D. Fishery biomass trends of exploited fish populations in marine ecoregions, climatic zones and ocean basins. Estuar. Coast. Shelf Sci. 2020, 243, 106896. [Google Scholar] [CrossRef]
  7. Vianna, G.M.S.; Zeller, D.; Pauly, D. Fisheries and policy implications for human nutrition. Curr. Environ. Health Rep. 2020, 7, 161–169. [Google Scholar] [CrossRef]
  8. Alder, J.; Campbell, B.; Karpouzi, V.; Kaschner, K.; Pauly, D. Forage fish: From ecosystems to markets. Ann. Rev. Environ. Res. 2008, 33, 153–166. [Google Scholar] [CrossRef]
  9. Hilborn, R.; Buratti, C.C.; Acuña, E.D.; Hively, D.; Kolding, J.; Kurota, H.; Baker, N.; Mace, P.M.; de Moor, C.L.; Muko, S.; et al. Recent trends in abundance and fishing pressure of agency-assessed small pelagic fish stocks. Fish Fish. 2022, 23, 12690. [Google Scholar] [CrossRef]
  10. Huang, T.-H.; Wang, P.-W.; Yang, S.-C.; Chou, W.-L.; Fang, J.-Y. Cosmetic and therapeutic applications of fish oil’s fatty acids on the skin. Mar. Drugs 2018, 16, 256. [Google Scholar] [CrossRef]
  11. D’angelo, S.; Motti, M.L.; Meccariello, R. ω-3 and ω-6 polyunsaturated fatty acids, obesity and cancer. Nutrients 2020, 12, 2751. [Google Scholar] [CrossRef] [PubMed]
  12. Johnson, K.A.; Lee, A.H.; Swanson, K.S. Nutrition and nutraceuticals in the changing management of osteoarthritis for dogs and cats. J. Am. Vet. Med. Assoc. 2020, 256, 1335. [Google Scholar] [CrossRef]
  13. O’Higgins, L. Use of Algal and Other Non-Fish Oils in Refined Edible Products; Scottish Aquaculture Research Forum Tech Rep 091; Scottish Aquaculture Research Forum: Pitlochry, UK, 2014. [Google Scholar]
  14. Gibson, D. Salmonids Now Consuming Majority of Fish Oil in Aquaculture. Undercurrent News, 19 October 2021. Available online: https://www.undercurrentnews.com(accessed on 28 November 2023).
  15. Global Salmon Initiative. Innovation in Feed Ingredients. 2022. Available online: https://globalsalmoninitiative.org/en/our-work/sustainable-feed/ (accessed on 12 January 2023).
  16. Jia, S.; Li, X.; He, W.; Wu, G. Protein-sourced feedstuffs for aquatic animals in nutrition research and aquaculture. In Recent Advances in Animal Nutrition and Metabolism; Advances in Experimental Medicine and Biology 1354; Wu, G., Ed.; Springer Nature: Cham, Switzerland, 2022; pp. 237–261. [Google Scholar]
  17. Aas, T.S.; Åsgård, T.; Ytrestøyl, T. Utilization of feed resources in the production of Atlantic salmon (Salmo salar) in Norway: An update for 2020. Aquac. Rep. 2022, 26, 101316. [Google Scholar] [CrossRef]
  18. Aas, T.S.; Ytrestøyl, T.; Åsgård, T. Utilization of feed resources in the production of Atlantic salmon (Salmo salar) in Norway: An update for 2016. Aquac. Rep. 2019, 15, 100216. [Google Scholar] [CrossRef]
  19. Aksnes, A.; Hope, B.; Jönsson, E.; Björnsson, B.T.; Albrektsen, S. Size fractionated fish hydrolysate as feed ingredient for rainbow trout (Oncorhynchus mykiss) fed high plant protein diets. I: Growth, growth regulation and feed utilization. Aquaculture 2006, 261, 305–317. [Google Scholar] [CrossRef]
  20. Espe, M.; Lemme, A.; Petri, A.; El-Mowafi, A. Can Atlantic salmon (Salmo salar) grow on diets devoid of fish meal? Aquaculture 2006, 255, 255–262. [Google Scholar] [CrossRef]
  21. Hevrøy, E.M.; El-Mowafi, A.; Taylor, R.; Norberg, B.; Espe, M. Effects of a high plant protein diet on the somatotropic system and cholecystokinin in Atlantic salmon (Salmo salar L.). Comp. Biochem. Physiol. Part A 2008, 151, 621–627. [Google Scholar] [CrossRef]
  22. Clarkson, M.; Migaud, H.; Metochis, C.; Vera, L.M.; Leeming, D.; Tocher, D.R.; Taylor, J.F. Early nutritional intervention can improve utilisation of vegetable-based diets in diploid and triploid Atlantic salmon (Salmo salar L.). Br. J. Nutr. 2017, 118, 17–29. [Google Scholar] [CrossRef]
  23. Pratoomyot, J.; Bendiksen, E.Å.; Bell, J.G.; Tocher, D.R. Effects of increasing replacement of dietary fishmeal with plant protein sources on growth performance and body lipid composition of Atlantic salmon (Salmo salar L.). Aquaculture 2010, 305, 124–132. [Google Scholar] [CrossRef]
  24. McLean, E. Feed ingredients for sustainable aquaculture. In Sustainable Food Science: A Comprehensive Approach; Ferranti, P., Ed.; Elsevier Inc.: Amsterdam, The Netherlands, 2023; Volume 4, pp. 392–423. 1414p. [Google Scholar]
  25. Gatlin, D.M.; Barrows, F.T.; Brown, P.; Dabrowski, K.; Gaylord, T.G.; Hardy, R.W.; Herman, E.; Hu, G.; Krogdahl, A.; Nelson, R.; et al. Expanding the utilization of sustainable plant products in aquafeeds: A review. Aquac. Res. 2007, 38, 551–579. [Google Scholar] [CrossRef]
  26. Moldal, T.; Løkka, G.; Wiik-Nielsen, J.; Austbø, L.; Torstensen, E.B.; Rosenlund, G.; Dale, O.B.; Kaldhusdal, M.; Koppang, E.O. Substitution of dietary fish oil with plant oils is associated with shortened mid intestinal folds in Atlantic salmon (Salmo salar). BMC Vet. Res. 2014, 10, 60. [Google Scholar] [CrossRef]
  27. Merrifield, D.L.; Olsen, R.E.; Myklebust, R.; Ringø, E. Dietary effect of soybean (Glycine max) products on gut histology and microbiota of fish. In Soybean and Nutrition; El-Shemy, H., Ed.; In Tech Europe: Rijeka, Croatia, 2011; pp. 231–250. [Google Scholar]
  28. Sørensen, S.L.; Park, Y.; Gong, Y.; Vasanth, G.K.; Dahle, D.; Korsnes, K.; Phuong, T.H.; Kiron, V.; Øyen, S.; Pittman, K.; et al. Nutrient digestibility, growth, mucosal barrier status, and activity of leucocytes from head kidney of Atlantic salmon fed marine- or plant-derived protein and lipid sources. Front. Immunol. 2021, 11, 623726. [Google Scholar] [CrossRef] [PubMed]
  29. Lutfi, E.; Berge, G.M.; Bæverfjord, G.; Sigholt, T.; Bou, M.; Larsson, T.; Mørkøre, T.; Evensen, Ø.; Sissener, N.H.; Rosenlund, G.; et al. Increasing dietary levels of the n-3 long-chain PUFA, EPA and DHA, improves the growth, welfare, robustness and fillet quality of Atlantic salmon in sea cages. Br. J. Nutr. 2022, 129, 10–28. [Google Scholar] [CrossRef] [PubMed]
  30. Løvmo, S.D.; Whatmore, P.; Sundh, H.; Sigholt, T.; Madaro, A.; Bardal, T.; Olsen, R.E. Effects of Atlantic salmon (Salmo salar) fed low- and high HUFA diets on growth and midgut intestinal health. Aquaculture 2021, 539, 736653. [Google Scholar] [CrossRef]
  31. Hara, T.J. Gustation. In Fish Physiology; Sensory Systems Neuroscience; Hara, T.J., Zielinski, B.S., Eds.; Academic Press: London, UK, 2006; Volume 25, pp. 45–96. [Google Scholar]
  32. Lamb, C.F. Gustation and feeding behaviour. In Food Intake in Fish; Houlihan, D., Boujard, T., Jobling, M., Eds.; Blackwell Science: Oxney Mead, UK, 2001; pp. 108–130. [Google Scholar]
  33. Zielinski, B.S.; Hara, T.J. Olfaction. In Fish Physiology; Sensory Systems Neuroscience; Hara, T.J., Zielinski, B.S., Eds.; Academic Press: London, UK, 2006; Volume 25, pp. 1–43. [Google Scholar]
  34. Shimizu, C.; Ibrahim, A.; Tokoro, T.; Shirakawa, Y. Feeding stimulation in sea bream, Pagrus major, fed diets supplemented with Antarctic krill meals. Aquaculture 1990, 89, 43–53. [Google Scholar] [CrossRef]
  35. Kousoulaki, K.; Rønnestad, I.; Rathore, R.; Sixten, H.J.; Campbell, P.; Nordrum, S.; Berge, R.K.; Albrektsen, S. Physiological responses of Atlantic salmon (Salmo salar L.) fed very low (3%) fishmeal diets supplemented with feeding-modulating crystalline amino acid mixes as identified in krill hydrolysate. Aquaculture 2018, 486, 184–196. [Google Scholar] [CrossRef]
  36. Kolkovski, S.; Czesny, S.; Dabrowski, K. Use of krill hydrolysate as feed attractant for fish larvae and juveniles. J. World Aquac. Soc. 2000, 31, 81–88. [Google Scholar] [CrossRef]
  37. Kousoulaki, K.; Rønnestad, I.; Olsen, H.J.; Rathore, R.; Campbell, P.; Nordrum, S.; Berge, R.K.; Mjøs, S.A.; Kalananthan, T.; Albrektsen, S. Krill hydrolysate free amino acids responsible for feed intake stimulation in Atlantic salmon (Salmo salar). Aquac. Nutr. 2013, 19, 47–61. [Google Scholar] [CrossRef]
  38. Torrecillas, S.; Montero, D.; Carvalho, M.; Benitez-Santana, T.; Izquierdo, M. Replacement of fish meal by Antarctic krill meal in diets for European sea bass Dicentrarchus labrax: Growth performance, feed utilization and liver lipid metabolism. Aquaculture 2021, 545, 737166. [Google Scholar] [CrossRef]
  39. Saleh, R.; Burri, L.; Benitez-Santana, T.; Turkmen, S.; Castro, P.; Izquierdo, M. Dietary krill meal inclusion contributes to better growth performance of gilthead seabream juveniles. Aquac. Res. 2018, 49, 3289–3295. [Google Scholar] [CrossRef]
  40. Gaber, M.M.A. The effect of different levels of krill meal supplementation of soybean-based diets on feed intake, digestibility, and chemical composition of juvenile Nile tilapia Oreochromis niloticus, L. J. World Aquac. Soc. 2005, 36, 346–353. [Google Scholar] [CrossRef]
  41. Choi, J.; Lee, K.W.; Han, G.S.; Byun, S.-G.; Lim, H.J.; Kim, H.S. Dietary inclusion effect of krill meal and various fish meal sources on growth performance, feed utilization, and plasma chemistry of grower walleye pollock (Gadus chalcogrammus, Pallas 1811). Aquac. Rep. 2020, 17, 100331. [Google Scholar] [CrossRef]
  42. Hatlen, B.; Berge, K.; Nordrum, S.; Johnsen, K.; Kolstad, K.; Mørkøre, T. The effect of low inclusion levels of Antarctic krill (Euphausia superba) meal on growth performance, apparent digestibility and slaughter quality of Atlantic salmon (Salmo salar). Aquac. Nutr. 2017, 23, 721–729. [Google Scholar] [CrossRef]
  43. Kaur, K.; Kortner, T.M.; Benitez-Santana, T.; Burri, L. Effects of Antarctic krill products on feed intake, growth performance, fillet quality, and health in salmonids. Aquac. Nutr. 2022, 2022, 3170854. [Google Scholar] [CrossRef]
  44. Wei, Y.; Shen, H.; Xu, W.; Pan, Y.; Chen, J.; Zhang, W.; Mai, K. Replacement of dietary fishmeal by Antarctic krill meal on growth performance, intestinal morphology, body composition and organoleptic quality of large yellow croaker Larimichthys crocea. Aquaculture 2019, 512, 734281. [Google Scholar] [CrossRef]
  45. Weirich, C.R.; O’Neal, C.C.; Belhadjali, K. Growth, body composition, and survival of channel catfish, Ictalurus punctatus fry fed hatchery diets supplemented with krill meal. J. Appl. Aquac. 2005, 17, 21–25. [Google Scholar] [CrossRef]
  46. Tang, B.; Zheng, H.; Wang, S.; Qin, G.; Huang, Y.; Wang, L. Effects of Antarctic krill Euphausia superba meal inclusion on growth, body color, and composition of large yellow croaker Larimichthys crocea. N. Am. J. Aquac. 2021, 83, 255–266. [Google Scholar] [CrossRef]
  47. Yoshitomi, B.; Aoki, M.; Oshima, S.-I. Effect of total replacement of dietary fish meal by low fluoride krill (Euphausia superba) meal on growth performance of rainbow trout (Oncorhynchus mykiss) in fresh water. Aquaculture 2007, 266, 219–225. [Google Scholar] [CrossRef]
  48. Beck, H.; Koops, H.; Tiews, K.; Gropp, J. Further possibilities for replacing fish meal in rainbow trout feeds: Replacement of fish meal by alkane yeast and krillmeal. Arch. Fisch. 1977, 28, 1–17. [Google Scholar]
  49. Alam, M.S.; Watanabe, W.O.; Sullivan, K.B.; Rezek, T.C.; Seaton, P.J. Replacement of menhaden fish meal protein by solvent-extracted soybean meal protein in the diet of juvenile black sea bass supplemented with or without squid meal, krill meal, methionine, and lysine. N. Am. J. Aquac. 2012, 74, 251–265. [Google Scholar] [CrossRef]
  50. Gaygin, E.A.; Podoskin, A.G.; Kanid’ev, A.N. Obezzhirennaya krilevaya muka i krilevojzhir v sostave korma dlya foreli. Rybn. Khoz. 1978, 12, 27–28. [Google Scholar]
  51. Koops, H.; Tiews, K.; Gropp, J.; Beck, H. Krill in trout diets. In Proceedings of the World Symposium Finfish Nutrition and Fishfeed Technology, Hamburg, Germany, 20–23 June 1978; Heenemann: Berlin, Germany, 1979; Volume II, pp. 281–292. [Google Scholar]
  52. Olsen, R.E.; Suontama, J.; Langmyhr, E.; Mundheim, H.; Ringø, E.; Melle, W.; Malde, M.K.; Hemre, G.-I. The replacement of fish meal with Antarctic krill, Euphausia superba in diets for Atlantic salmon, Salmo salar. Aquac. Nutr. 2006, 12, 280–290. [Google Scholar] [CrossRef]
  53. Suontama, J.; Karlsen, Ø.; Moren, M.; Hemre, G.-I.; Melle, W.; Langmyhr, E.; Mundheim, H.; Ringø, E.; Olsen, R. Growth, feed conversion and chemical composition of Atlantic salmon (Salmo salar L.) and Atlantic halibut (Hippoglossus hippoglossus L.) fed diets supplemented with krill or amphipods. Aquac. Nutr. 2007, 13, 241–255. [Google Scholar] [CrossRef]
  54. Nicol, S.; Foster, J. The Fishery for Antarctic Krill: Its Current Status and Management Regime. In Biology and Ecology of Antarctic Krill; Siegel, V., Ed.; Advances in Polar Ecology; Springer: Cham, Switzerland, 2016. [Google Scholar] [CrossRef]
  55. McBride, M.M.; Stokke, O.S.; Renner, A.H.H.; Krafft, B.A.; Bergstad, O.A.; Biuw, M.; Lowther, A.D.; Stiansen, J.E. Antarctic krill Euphausia superba: Spatial distribution, abundance, and management of fisheries in a changing climate. Mar. Ecol. Prog. Ser. 2021, 668, 185–214. [Google Scholar] [CrossRef]
  56. Kawaguchi, S.; Ishida, A.; King, R.; Raymond, B.; Waller, N.; Constable, A.; Nicol, S.; Wakita, M.; Ishimatsu, A. Risk maps for Antarctic krill under projected Southern Ocean acidification. Nat. Clim. Change 2013, 3, 843–847. [Google Scholar] [CrossRef]
  57. Hellessey, N.; Ericson, J.; Nichols, P.D.; Kawaguchi, S.; Nicol, S.; Hoem, N.; Virtue, P. Seasonal and interannual variation in the lipid content and composition of Euphausia superba Dana, 1850 (Euphausiacea) samples derived from the Scotia Sea fishery. J. Crustac. Biol. 2018, 38, 673–681. [Google Scholar] [CrossRef]
  58. Lin, S.; Zhao, L.; Feng, J. Predicted changes in the distribution of Antarctic krill in the Cosmonaut Sea under future climate change scenarios. Ecol. Indic. 2022, 142, 109234. [Google Scholar] [CrossRef]
  59. Atkinson, A.; Hill, S.L.; Pakhomov, E.A.; Siegel, V.; Reiss, C.S.; Loeb, V.J.; Steinberg, D.K.; Schmidt, K.; Tarling, G.A.; Gerrish, L.; et al. Krill (Euphausia superba) distribution contracts southward during rapid regional warming. Nat. Clim. Change 2019, 9, 142–147. [Google Scholar] [CrossRef]
  60. Klein, E.S.; Hill, S.L.; Hinke, J.T.; Phillips, T.; Watters, G.M. Impacts of rising sea temperature on krill increase risks for predators in the Scotia Sea. PLoS ONE 2018, 13, e0191011. [Google Scholar] [CrossRef]
  61. Putman, N.F.; Hawkins, J.; Gallaway, B.J. Managing fisheries in a world with more sea turtles. Proc. R. Soc. B. Biol. Sci. 2020, 287, 20200220. [Google Scholar] [CrossRef]
  62. Ramos, J.A.; Pereira, L. (Eds.) Seabird Biodiversity and Human Activities; CRC Press: Boca Raton, FL, USA, 2022; 270p. [Google Scholar]
  63. Descamps, S.; Tarroux, A.; Cherel, Y.; Delord, K.; Godø, O.R.; Kato, A.; Krafft, B.A.; Lorentsen, S.-H.; Ropert-Coudert, Y.; Skaret, G.; et al. At-sea distribution and prey selection of Antarctic petrels and commercial krill fisheries. PLoS ONE 2016, 11, e0156968. [Google Scholar] [CrossRef] [PubMed]
  64. Barnham, C.; Baxter, A. Condition Factor, K, for Salmonid Fish; Fish Notes 0005, 1–3; State of Victoria, Department of Primary Industries: Kerang, Australia, 1998.
  65. Carter, C.; Hauler, R. Fish meal replacement by plant meals in extruded feeds for Atlantic salmon, Salmo salar L. Aquaculture 2000, 185, 299–311. [Google Scholar] [CrossRef]
  66. Espe, M.; Lemme, A.; Petri, A.; El-Mowafi, A. Assesment of lysine requirement for maximal protein accretion in Atlantic salmon using plant protein diets. Aquaculture 2007, 263, 168–178. [Google Scholar] [CrossRef]
  67. Liu, C.; Palihawadana, A.M.; Nadanasabesan, N.; Vasanth, G.K.; Vatsos, I.N.; Dias, J.; Valente, L.M.P.; Micallef, G.; Sørensen, M.; Kiron, V. Utilization of Nannochloropsis oceanica in plant-based feeds by Atlantic salmon (Salmo salar). Aquaculture 2022, 561, 738651. [Google Scholar] [CrossRef]
  68. Król, E.; Douglas, A.; Tocher, D.R.; Crampton, V.O.; Speakman, J.R.; Secombes, C.J.; Martin, S.A.M. Differential responses of the gut transcriptome to plant protein diets in farmed Atlantic salmon. BMC Genom. 2016, 17, 156. [Google Scholar] [CrossRef] [PubMed]
  69. Penn, M.H.; Bendiksen, E.; Campbell, P.; Krogdahl, Å. High level of dietary pea protein concentrate induces enteropathy in Atlantic salmon (Salmo salar L.). Aquaculture 2011, 310, 267–273. [Google Scholar] [CrossRef]
  70. Hartviksen, M.; Bakke, A.M.; Vecino, J.G.; Ringø, E.; Krogdahl, Å. Evaluation of the effect of commercially available plant and animal protein sources in diets for Atlantic salmon (Salmo salar L.): Digestive and metabolic investigations. Fish Physiol. Biochem. 2014, 40, 1621–1637. [Google Scholar] [CrossRef]
  71. Krogdahl, Å.; Bakke-McKellep, A.M.; Baeverfjord, G. Effects of graded levels of standard soybean meal on intestinal structure, mucosal enzyme activities, and pancreatic response in Atlantic salmon (Salmo salar L.). Aquac. Nutr. 2003, 9, 361–371. [Google Scholar] [CrossRef]
  72. Tacchi, L.; Secombes, C.J.; Bikerdike, R.; Adler, M.A.; Venegas, C.; Talke, H.; Martin, S.A.M. Transcriptomic and physiological responses to fishmeal substitution with plant proteins in formulated feed in farmed Atlantic salmon (Salmo salar). BMC Genom. 2012, 13, 363. [Google Scholar] [CrossRef]
  73. Hatlen, B.; Jakobsen, J.-V.; Crampton, V.; Alm, M.; Langmyhr, E.; Espe, M.; Hevrøy, E.M.; Torstensen, B.E.; Liland, N.; Waagbø, R. Growth, feed utilization and endocrine responses in Atlantic salmon (Salmo salar) fed diets added poultry by-product meal and blood meal in combination with poultry oil. Aquac. Nutr. 2015, 21, 714–725. [Google Scholar] [CrossRef]
  74. Hectoamp, J.W.; Piedad-Pascual, F. Poultry By-Product Meal. In Handbook on Ingredients for Aquaculture Feeds; Springer: Dordrecht, The Netherlands, 2000. [Google Scholar] [CrossRef]
  75. Rocker, M.M.; Lewis, M.J.; Mock, T.S.; Francis, D.S.; Bellagamba, F.; Moretti, V.M.; Quinn, J.P.; Smullen, R.P.; Turchini, G.M. Poultry offal meal production conditions impact meal quality and digestibility in Atlantic salmon (Salmo salar). Aquaculture 2021, 542, 736909. [Google Scholar] [CrossRef]
  76. Galkanda-Arachchige, H.S.; Wilson, A.E.; Davis, D.A. Success of fishmeal replacement through poultry by-product meal in aquaculture feed formulations: A meta-analysis. Rev. Aquac. 2020, 12, 1624–1636. [Google Scholar] [CrossRef]
  77. Volpato, J.A.; Ribeiro, L.B.; Torezan, G.B.; da Silva, I.C.; de Oliveira Martins, I.; Genova, J.L.; de Oliveira, N.T.E.; Carvalho, S.T.; de Oliveira Carvalho, P.L.; Vasconcellos, R.S. Characterization of the variations in the industrial processing and nutritional variables of poultry by-product meal. Poult. Sci. 2022, 101, 101926. [Google Scholar] [CrossRef]
  78. Zhou, Q.; Zhao, J.; Li, P.; Wang, H.; Wang, L. Evaluation of poultry by-product meal in commercial diets for juvenile cobia (Rachycentron canadum). Aquaculture 2011, 322, 122–127. [Google Scholar] [CrossRef]
  79. Hansen, J.Ø.; Penn, M.; Øverland, M.; Shearera, K.D.; Krogdahl, Å.; Mydland, L.T.; Storebakken, T. High inclusion of partially deshelled and whole krill meals in diets for Atlantic salmon (Salmo salar). Aquaculture 2010, 310, 164–172. [Google Scholar] [CrossRef]
  80. Ringø, E.; Sperstad, S.; Myklebust, R.; Mayhew, T.M.; Mjelde, A.; Melle, W.; Olsen, R.E. The effect of dietary krill supplementation on epithelium-associated bacteria in the hindgut of Atlantic salmon (Salmo salar L.): A microbial and electron microscopical study. Aquac. Res. 2006, 37, 1644–1653. [Google Scholar] [CrossRef]
  81. Kołakowski, E. Seasonal changes in nitrogen fractions in the Antarctic krill (Euphausia superba Dana) Part 1. Basic nitrogen fractions. Polish Polar Res. 1987, 82, 159–165. [Google Scholar]
  82. Bakke-McKellep, A.M.; Refstie, S. Alternative protein sources and digestive function alterations in teleost fishes. In Feeding and Digestive Functions of Fishes; Cyrino, J.E.P., Bureau, D.P., Kapoor, D.G., Eds.; CRC Press: Boca Raton, FL, USA, 2008; pp. 444–478. [Google Scholar]
  83. Rungruangsak-Torrissen, K. Digestive efficiency, growth and qualities of muscle and oocyte in Atlantic salmon (Salmo salar L.) fed on diets with krill meal as an alternative protein source. J. Food Chem. 2007, 31, 509–540. [Google Scholar] [CrossRef]
  84. Hansen, J.Ø.; Shearer, K.D.; Øverland, M.; Penn, M.; Krogdahl, Å.; Mydland, L.T.; Storebakken, T. Replacement of LT fish meal with a mixture of partially deshelled krill meal and pea protein concentrates in diets for Atlantic salmon (Salmo salar). Aquaculture 2011, 315, 275–282. [Google Scholar] [CrossRef]
  85. Seo, J.-Y.; Kim, K.-D.; Son, M.-H.; Lee, S.-M. Growth performance, hematological parameter and fatty acid composition of growing olive flounder (Paralichthys olivaceus) to dietary inclusion of kelp meal, krill meal, garlic powder or citrus meal. Korean J. Fish. Aquat. Sci. 2010, 43, 557–561. [Google Scholar] [CrossRef]
  86. Kader, M.A.; Bulbul, M.; Koshio, S.; Ishikawa, M.; Yokoyama, S.; Nguyen, B.T.; Komilus, C.F. Effect of complete replacement of fishmeal by dehulled soybean meal with crude attractants supplementation in diets for red sea bream, Pagrus major. Aquaculture 2012, 350–353, 109–116. [Google Scholar] [CrossRef]
  87. Zhang, H.; Wang, H. Enrichment of Plant-Protein Based Diets for Nile Tilapia (Oreochromis niloticus) with Krill Protein Hydrolysate with High Concentration of Phospholipids Rich in n-3 Fatty Acids. Master’s Thesis, Department of Animal and Aquacultural Science, Norwegian University of Life Science, Ås, Norway, 2012; 35p. [Google Scholar]
  88. Tharaka, K.; Benitez-Santana, T.; Gunathilaka, B.E.; Kim, M.-G.; Lee, C.; Shin, J.; Lee, K.-J. Evaluation of Antarctic krill (Euphausia superba) meal supplementation in diets for olive flounder (Paralichthys olivaceus). Aquac. Res. 2020, 51, 2291–2302. [Google Scholar] [CrossRef]
  89. Gunathilaka, B.E.; Khosravi, S.; Shin, J.; Shin, J.; Herault, M.; Fournier, V.; Lee, K.-J. Evaluation of shrimp protein hydrolysate and krill meal supplementation in low fish meal diet for red seabream (Pagrus major). Fish. Aquat. Sci. 2021, 24, 109–120. [Google Scholar] [CrossRef]
  90. Karalazos, V.; Bendiksen, E.A.; Dick, J.R.; Bell, J.G. Effects of dietary protein and fat level and rapeseed oil on growth and tissue fatty acid composition and metabolism in Atlantic salmon (Salmo salar L.) reared at low water temperatures. Aquacult. Nutr. 2007, 13, 256–265. [Google Scholar] [CrossRef]
  91. Torstensen, B.E.; Bell, J.G.; Sargent, J.R.; Rosenlund, G.; Henderson, R.J.; Graff, I.E.; Lie, Ø.; Tocher, D.R. Tailoring of Atlantic salmon (Salmo salar L.) flesh lipid composition and sensory quality by replacing fish oil with a vegetable oil blend. J. Agric. Food Chem. 2005, 53, 10166–10178. [Google Scholar] [CrossRef]
  92. Sele, V.; Sanden, M.; Berntssen, M.; Storesund, J.; Lie, K.K.; Espe, M.; Lundebye, A.K.; Hemre, G.-I.; Waagbø, R.; Ørnsrud, R. Program for Monitoring Fish Feed—Annual Report for Samples Collected in 2018. Institute of Marine Research, Bergen, Norway Report Series NR. 30-2019. 2019. Available online: https://www.hi.no/hi/nettrapporter/rapport-fra-havforskningen-2019-30 (accessed on 24 January 2023).
  93. Turchini, G.M.; Francis, D.S.; Du, Z.-Y.; Olsen, R.E.; Ringø, E.; Tocher, D.R. The lipids. In Fish Nutrition; Hardy, R.W., Kaushik, S., Eds.; Academic Press: San Diego, CA, USA, 2022; pp. 303–467. [Google Scholar]
  94. Datsomor, A.K.; Gillard, G.; Jin, Y.; Olsen, R.E.; Sandve, S.R. Molecular regulation of biosynthesis of long chain polyunsaturated fatty acids in Atlantic salmon. Mar. Biotechnol. 2022, 24, 661–670. [Google Scholar] [CrossRef]
  95. Huyben, D.; Grobler, T.; Matthew, C.; Bou, M.; Ruyter, B.; Glencross, B. Requirement for omega-3 long-chain polyunsaturated fatty acids by Atlantic salmon is relative to the dietary lipid level. Aquaculture 2021, 531, 735805. [Google Scholar] [CrossRef]
  96. Glencross, B.D.; Tocher, D.R.; Matthew, C.; Bell, J.G. Interactions between dietary docosahexaenoic acid and other long-chain polyunsaturated fatty acids on performance and fatty acid retention in post-smolt Atlantic salmon (Salmo salar). Fish Physiol. Biochem. 2014, 40, 1213–1227. [Google Scholar] [CrossRef]
  97. Bou, M.; Berge, G.M.; Baeverfjord, G.; Sigholt, T.; Østbye, T.-K.; Ruyter, B. Low levels of very-long-chain n-3 PUFA in Atlantic salmon (Salmo salar) diet reduce fish robustness under challenging conditions in sea cages. J. Nutr. Sci. 2017, 6, e32. [Google Scholar] [CrossRef]
  98. Rosenlund, G.; Obach, A.; Sandberg, M.; Standal, H.; Tveit, K. Effect of alternative lipid sources on long-term growth performance and quality of Atlantic salmon (Salmo salar L.). Aquac. Res. 2001, 32, 323–328. [Google Scholar] [CrossRef]
  99. Liland, N.; Rosenlund, G.; Berntssen, M.; Brattelid, T.; Madsen, L.; Torstensen, B. Net production of Atlantic salmon (FIFO, fish in fish out < 1) with dietary plant proteins and vegetable oils. Aquac. Nutr. 2013, 19, 289–300. [Google Scholar]
  100. Caballero-Solares, A.; Hall, J.R.; Xue, X.; Eslamloo, K.; Taylor, R.G.; Parrish, C.C.; Rise, M.L. The dietary replacement of marine ingredients by terrestrial animal and plant alternatives modulates the antiviral immune response of Atlantic salmon (Salmo salar). Fish Shellfish Immunol. 2017, 64, 24–38. [Google Scholar] [CrossRef] [PubMed]
  101. Xue, X.; Hall, J.R.; Caballero-Solares, A.; Eslamloo, K.; Taylor, R.G.; Parrish, C.C.; Rise, M.L. Liver transcriptome profiling reveals that dietary DHA and EPA levels influence suites of genes involved in metabolism, redox homeostasis, and immune function in Atlantic salmon (Salmo salar). Mar. Biotechnol. 2020, 22, 263–284. [Google Scholar] [CrossRef] [PubMed]
  102. Bell, J.G.; Tocher, D.R.; Henderson, R.J.; Dick, J.R.; Crampton, V.O. Altered fatty acid compositions in Atlantic salmon (Salmo salar) fed diets containing linseed and rapeseed oils can be partially restored by a subsequent fish oil finishing diet. J. Nutr. 2003, 133, 2793–2801. [Google Scholar] [CrossRef] [PubMed]
  103. Mock, T.S.; Francis, D.S.; Jago, M.K.; Glencross, B.D.; Smullen, R.P.; Keast, R.S.J.; Turchini, G.M. Altered levels of shorter vs long-chain omega-3 fatty acids in commercial diets for market-sized Atlantic salmon reared in seawater—Effects on fatty acid composition, metabolism and product quality. Aquaculture 2019, 499, 167–177. [Google Scholar] [CrossRef]
  104. Fedorova-Dahms, I.; Marone, P.A.; Bailey-Hall, E.; Ryan, A.S. Safety evaluation of algal oil from Schizochytrium sp. Food Chem. Toxicol. 2010, 49, 70–77. [Google Scholar] [CrossRef] [PubMed]
  105. Carter, C.G.; Bransden, M.P.; Lewis, T.E.; Nichols, P.D. Potential of Thraustochytrids to partially replace fish oil in Atlantic salmon feeds. Mar. Biotechnol. 2003, 5, 480–492. [Google Scholar] [CrossRef]
  106. Miller, M.; Nichols, P.; Carter, C. Replacement of fish oil with thraustochytrid Schizochytrium sp. L oil in Atlantic salmon parr (Salmo salar L.) diets. Comp. Biochem. A 2007, 148, 382–392. [Google Scholar] [CrossRef]
  107. Sprague, M.; Walton, J.; Campbell, P.; Strachan, F.; Dick, J.R.; Bell, J.G. Replacement of fish oil with a DHA-rich algal meal derived from Schizochytrium sp. on the fatty acid and persistent organic pollutant levels in diets and flesh of Atlantic salmon (Salmo salar L.) post-smolts. Food Chem. 2015, 185, 413–421. [Google Scholar] [CrossRef]
  108. Kousoulaki, K.; Østbye, T.K.K.; Krasnov, A.; Torgersen, J.S.; Mørkøre, T.; Sweetman, J. Metabolism, health and fillet nutritional quality in Atlantic salmon (Salmo salar) fed diets containing n-3-rich microalgae. J. Nutr. Sci. 2015, 4, e24. [Google Scholar] [CrossRef]
  109. Kousoulaki, K.; Gerd, M.B.; Mørkøre, T.; Krasnov, A.; Baeverfjord, G.; Ytrestøyl, T.; Carlehög, M.; Sweetman, J.; Ruyter, B. Microalgal Schizochytrium limacinum biomass improves growth and filet quality when used long-term as a replacement for fish oil, in modern salmon diets. Front. Mar. Sci. 2020, 7, 57. [Google Scholar] [CrossRef]
  110. Santigosa, E.; Verlhac-Trichet, V.; Olsen, R.E.; Figuereido-Silva, C. A microalgal oil containing EPA+DHA can be an effective source of omega 3 for Atlantic salmon post-smolts. In Proceedings of the 18th International Symposium on Fish Nutrition & Feeding (ISFNF), Las Palmas de Gran Canaria, Spain, 3–7 June 2018. [Google Scholar]
  111. Tibbetts, S.M.; Scaife, M.A.; Armenta, R.E. Apparent digestibility of proximate nutrients, energy and fatty acids in nutritionally-balanced diets with partial or complete replacement of dietary fish oil with microbial oil from a novel Schizochytrium sp. (T18) by juvenile Atlantic salmon (Salmo salar L.). Aquaculture 2020, 520, 735003. [Google Scholar] [CrossRef]
  112. Wei, M.; Parrish, C.C.; Guerra, N.I.; Armenta, R.E.; Colombo, S.M. Extracted microbial oil from a novel Schizochytrium sp. (T18) as a sustainable high DHA source for Atlantic salmon feed: Impacts on growth and tissue lipids. Aquaculture 2020, 534, 736249. [Google Scholar] [CrossRef]
  113. Elgar, K. EPA/DHA: A review of clinical use and efficacy. Nutr. Med. J. 2022, 2, 97–132. [Google Scholar]
  114. Kris-Etherton, P.M.; Grieger, J.A.; Etherton, T.D. Dietary reference intakes for DHA and EPA. Prostaglandins Leukot. Essent. Fat. Acids 2009, 81, 99–104. [Google Scholar] [CrossRef]
  115. World Health Organization. Fats and Fatty Acids in Human Nutrition: Report of an Expert Consultation; FAO Food and Nutrition Paper; FAO: Geneva, Switzerland, 2008; 2p. [Google Scholar]
  116. Sprague, M.; Dick, J.R.; Tocher, D.R. Impact of sustainable feeds on omega-3 long-chain fatty acid levels in farmed Atlantic salmon, 2006–2015. Sci. Rep. 2016, 6, 21892. [Google Scholar] [CrossRef] [PubMed]
  117. Vera, L.M.; Hamre, K.; Espe, M.; Hemre, G.; Skjærven, K.; Lock, E.; Prabhu, A.J.; Leeming, D.; Migaud, H.; Tocher, D.R.; et al. Higher dietary micronutrients are required to maintain optimal performance of Atlantic salmon (Salmo salar) fed a high plant material diet during the full production cycle. Aquaculture 2020, 528, 735551. [Google Scholar] [CrossRef]
  118. Albrektsen, S.; Kortet, R.; Skov, P.V.; Ytteborg, E.; Gitlesen, S.; Kleinegris, D.; Mydland, L.; Hansen, J.; Lock, E.; Mørkøre, T.; et al. Future feed resources in sustainable salmonid production: A review. Rev. Aquac. 2022, 14, 1790–1812. [Google Scholar] [CrossRef]
  119. Woodgate, S.L.; Wan, A.H.L.; Hartnett, F.; Wilkinson, R.G.; Davies, S.J. The utilisation of European processed animal proteins as safe, sustainable and circular ingredients for global aquafeeds. Rev. Aquac. 2022, 14, 1572–1596. [Google Scholar] [CrossRef]
  120. USDA. Livestock and Poultry: World Markets and Trade. 2023. Available online: https://apps.fas.usda.gov/psdonline/circulars/livestock_poultry.pdf (accessed on 18 October 2023).
  121. Herftrampf, J.W.; Piedad-Pascual, F. Handbook of Ingredients for Aquaculture Feeds; Springer: Dordrecht, The Netherlands, 2003; 573p. [Google Scholar]
  122. Wu, D.; Zhang, Y.; Li, J.; Fan, Z.; Xu, Q.; Wang, L. Assessment of chicken intestinal hydrolysates as a new protein source to replace fishmeal on the growth performance, antioxidant capacity and intestinal health of common carp (Cyprinus carpio). Fish Shellfish Immunol. 2022, 125, 161–170. [Google Scholar] [CrossRef]
  123. Steffens, W. Replacing fish meal with poultry by-product meal in diets for rainbow trout, Oncorhynchus mykiss. Aquaculture 1994, 124, 27–34. [Google Scholar] [CrossRef]
  124. Alexis, M.N.; Papaparaskeva-Papoutsoglou, E.; Theochari, V. Formulation of practical diets for rainbow trout (Salmo gairdneri) made by partial or complete substitution of fish meal by poultry by-products and certain plant by-products. Aquaculture 1985, 50, 61–73. [Google Scholar] [CrossRef]
  125. Burr, G.S.; Wolters, W.R.; Barrows, F.T.; Hardy, R.W. Replacing fishmeal with blends of alternative proteins on growth performance of rainbow trout (Oncorhynchus mykiss), and early or late stage juvenile Atlantic salmon (Salmo salar). Aquaculture 2012, 334–337, 110–116. [Google Scholar] [CrossRef]
  126. Sealey, W.M.; Hardy, R.W.; Barrows, F.T.; Pan, Q.; Stone, D.A.J. Evaluation of 100% fish meal substitution with chicken concentrate, protein poultry by-product blend, and chicken and egg concentrate on growth and disease resistance of juvenile rainbow trout Oncorhynchus mykiss. J. World Aquac. Soc. 2011, 42, 46–55. [Google Scholar] [CrossRef]
  127. Jobling, M.; Gomes, E.; Dias, J. Feed types, manufacture and ingredients. In Food Intake in Fish; Houlihan, D., Boujard, T., Jobling, M., Eds.; Blackwell Science: Osney Mead, UK, 2001; pp. 25–48. [Google Scholar]
Figure 1. Percent incorporation (dashed lines) and price (solid lines) of fishmeal (red) and fish oil (blue) in salmon feeds between 1990 and 2025 (projected). Data points are averaged values derived from [13,14,15,16,17]. As commodity price per ton has increased, their corresponding use in salmon feeds has decreased.
Fishes 08 00590 g001
Figure 2. Increase in tank biomass (white) and feed intake (grey) of Atlantic salmon maintained on control, plant, and animal protein-based diets for 90 days. Different letters for same-colored bars indicate differences between treatments (p ≤ 0.04). Bars represent ±S.D.
Fishes 08 00590 g002
Figure 3. Viscerosomatic (white), enterosomatic (grey), and hepatosomatic (black) indices of Atlantic salmon maintained on control, plant, and animal protein-based diets for 90 days. No differences were discerned in measured values between dietary treatments. C = control, P = plant, and A = animal. All data are ±SD.
Fishes 08 00590 g003
Table 1. Ingredients of control (C), plant-based (P), and animal-based (A) experimental diets.
ControlPlant ProteinAnimal Protein
IngredientC1P1P2P3A1A2A3
%%%%%%%
Fish meal a25.27000000
Poultry meal b000026.2726.2726.27
Krill meal c002.5502.55
Menon Pro50FF13131313131313
Soy protein conc. Selecta 60 d11.8827.127.127.1107.765.42
Corn protein conc. E75 e1.8711.910.17.70.960.960.6
Blood meal f6666666
Wheat gluten meal2.152.152.152.152.152.152.15
Wheat flour g15.94410.00410.00411.13417.83417.84418.644
Fish oil h19.79000000
Canola oil i017.717.416.9514.0713.8013.30
Algae oil j04.54.54.54.54.54.5
Monoamonium Phos1.854.33.983.251.71.71.6
Vitamin mineral premix k0.70.70.70.70.70.70.7
Lysine HCL0.651.451.31.21.451.41.4
Taurine0.50.50.50.50.50.50.5
DL-methionine0.390.60.60.650.60.650.65
Threonine00.090.160.160.260.260.26
Asta, pink k0.0060.0060.0060.0060.0060.0060.006
Total100100100100100100100
a Orizon SA, Chile, 670 g/kg protein; b Seara Alimentos LTDA, Brazil, 650 g/kg protein; c Pesca Chile SA, Chile; d Kabsa, Brazil; e Cargill Andina, USA; f Sonac Bad Bramstedt GmbH, Germany; g Molino San Pablo, Chile; h Orizon SA, Chile; i Agrotop, Chile; j Veramaris, USA; k DSM, Chile.
Table 2. Essential amino acid profiles (g 100 g−1 protein), proximate compositions, peroxide indices (PI; meq O2 kg−1), and mercury levels (mg kg−1) of control and experimental diets used throughout the trial.
Essential Amino Acids (g 100 g−1 Protein)
C1P1P2P3A1A2A3
Arg2.392.072.492.052.42.372.54
His1.471.181.41.131.151.251.2
Ile1.61.321.661.391.371.391.41
Leu3.683.874.413.653.243.323.3
Lys3.673.163.593.193.743.683.81
Met1.261.211.31.261.221.441.36
Phe2.062.062.4421.841.91.86
Thr1.71.431.761.551.741.721.8
Try0.540.470.490.510.480.470.45
Val2.412.032.352.012.12.122.12
Sum20.7818.821.8918.7419.2819.6619.85
Proximate composition (%)
Moisture4.96.14.43.34.84.95.2
Lipid22.921.724.123.1242423.9
Protein4646.446.34644.144.543.8
Ash7.76.16.76.26.76.36.5
Peroxide index (meq O2 kg−1) and mercury
PI initial<2.0<2.0<2.0<2.0<2.0<2.0<2.0
PI final46.9121.9232.3323.9221.2516.5027.83
Hg (mg kg−1)<0.05<0.05<0.05<0.05<0.05<0.05<0.05
Table 3. Fatty acid profiles (g 100 g−1) of control and experimental diets used throughout the trial. All data are ±SD. Data in a row with dissimilar superscripts were different (p < 0.05).
C1P1P2P3A1A2A3
C14:04.10 ± 2.55 a0.25 ± 0.15 b0.37 ± 0.23 b0.52 ± 0.32 b0.31 ± 0.19 b0.29 ± 0.28 b0.66 ± 0.40 b
C15:00.24 ± 0.15 a0.06 ± 0.03 b0.06 ± 0.04 b0.07 ± 0.04 b0.07 ± 0.04 b0.06 ± 0.04 b0.08 ± 0.05 b
C16:012.54 ± 7.905.22 ± 3.245.32 ± 3.365.53 ± 3.356.91 ± 4.263.76 ± 4.647.50 ± 4.59
C17:00.34 ± 0.220.08 ± 0.050.09 ± 0.060.14 ± 0.080.08 ± 0.050.83 ± 1.300.09 ± 0.06
C18:02.54 ± 1.621.14 ± 0.711.15 ± 0.721.19 ± 0.721.56 ± 0.960.97 ± 0.891.61 ± 0.98
C20:00.24 ± 0.150.34 ± 0.210.33 ± 0.210.33 ± 0.190.31 ± 0.190.23 ± 0.140.29 ± 0.18
C22:00.08 ± 0.050.19 ± 0.120.19 ± 0.120.19 ± 0.110.17 ± 0.100.16 ± 0.100.16 ± 0.10
C16:1 ω94.22 ± 264 a0.19 ± 0.12 b0.26 ± 0.16 b0.34 ± 0.21 b0.71 ± 0.43 b0.85 ± 0.52 b0.97 ± 0.58 b
C18:1 ω910.73 ± 6.8133.75 ± 21.1133.23 ± 20.9332.98 ± 20.1131.18 ± 19.3830.30 ± 18.9029.74 ± 18.36
C20:1 ω92.63 ± 1.68 a0.61 ± 0.37 b0.61 ± 0.38 b0.61 ± 0.37 b0.52 ± 0.33 b0.52 ± 0.32 b0.53 ± 0.32 b
C22:1 ω90.26 ± 0.17 a0.05 ± 0.03 b0.05 ± 0.03 b0.05 ± 0.03 b0.04 ± 0.03 b0.04 ± 0.03 b0.05 ± 0.03 b
C24:10.26 ± 0.170.07 ± 0.050.07 ± 0.040.08 ± 0.050.07 ± 0.040.06 ± 0.040.07 ± 0.04
C18:2 ω63.50 ± 2.2210.66 ± 6.6610.44 ± 6.5110.56 ± 3.3710.06 ± 6.189.70 ± 5.979.65 ± 5.88
C18:3 ω60.09 ± 0.06 a0.00 ± 0.00 b0.00 ± 0.00 b0.00 ± 0.00 b0.00 ± 0.00 b0.00 ± 0.00 b0.00 ± 0.00 b
C18:3 ω31.83 ± 1.134.90 ± 3.024.77 ± 2.965.01 ± 3.004.48 ± 2.734.29 ± 2.604.30 ± 2.60
C20:2 ω60.09 ± 0.06 a0.00 ± 0.00 b0.00 ± 0.00 b0.00 ± 0.00 b0.04 ± 0.02 a0.04 ± 0.02 a0.00 ± 0.00 b
C20:3 ω30.05 ± 0.03 a0.00 ± 0.00 b0.00 ± 0.00 b0.00 ± 0.00 b0.00 ± 0.00 b0.00 ± 0.00 b0.00 ± 0.00 b
C20:3 ω60.07 ± 0.04 a0.00 ± 0.00 b0.00 ± 0.00 b0.00 ± 0.00 b0.00 ± 0.00 b0.00 ± 0.00 b0.00 ± 0.00 b
C20:4 ω60.42 ± 0.260.31 ± 0.190.31 ± 0.120.32 ± 0.190.35 ± 0.220.33 ± 0.210.34 ± 0.21
C20:5 ω33.51 ± 2.23 a1.59 ± 0.99 b1.46 ± 0.89 b1.41 ± 0.85 b1.32 ± 0.80 b1.47 ± 0.88 b1.52 ± 0.91 b
C22:5 ω31.26 ± 0.770.55 ± 0.340.55 ± 0.340.56 ± 0.330.57 ± 0.340.55 ± 0.330.57 ± 0.34
C22:6 ω36.53 ± 4.117.18 ± 4.457.28 ± 4.417.38 ± 4.436.56 ± 4.027.27 ± 4.347.28 ± 4.35
Total ω313.69 ± 8.6412.86 ± 7.9912.84 ± 7.8012.89 ± 7.7611.51 ± 7.0012.59 ± 7.5412.76 ± 7.63
Total ω66.38 ± 4.0610.91 ± 6.8410.69 ± 6.5610.53 ± 6.3910.25 ± 6.2110.24 ± 6.2010.11 ± 6.11
EPA + DHA10.05 ± 6.338.77 ± 5.448.74 ± 5.308.78 ± 5.287.88 ± 4.818.74 ± 5.228.80 ± 5.25
ω3: ω62.14 ± 0.18 a1.18 ± 0.07 b1.20 ± 0.03 b1.22 ± 0.13 b1.12 ± 0.14 b1.23 ± 0.09 b1.26 ± 0.12 b
Table 4. Weight (g), length (cm), and condition factor (K) of Atlantic salmon fed various experimental diets over a 90-day timeframe. Different superscripts in a column indicate significant differences between treatments. All data are ±SD.
Day 0 (n = 60/Tank)
DietWeightLengthK
C1148.96 ± 12.5123.32 ± 0.791.18 ± 0.08
P1148.65 ± 12.9823.40 ± 0.801.16 ± 0.07
P2148.72 ± 12.7023.43 ± 0.871.16 ± 0.08
P3148.07 ± 13.1423.34 ± 0.801.16 ± 0.08
A1147.64 ± 13.1323.29 ± 0.781.17 ± 0.08
A2148.56 ± 13.1723.37 ± 0.781.16 ± 0.07
A3147.93 ± 12.9823.34 ± 0.811.16 ± 0.08
Day 45 (n = ≥ 44/tank)
WeightLengthK
C1339.71 ± 48.41 a29.65 ± 1.52 a1.30 ± 0.11 a
P1300.99 ± 48.17 b28.49 ± 1.40 b1.29 ± 0.09 a
P2329.62 ± 46.65 a29.16 ± 1.19 a1.32 ± 0.10 a,b
P3334.19 ± 41.72 a29.20 ± 1.23 a1.34 ± 0.06 a,b
A1336.10 ± 46.66 a29.44 ± 1.25 a1.31 ± 0.08 a
A2339.13 ± 48.41 a29.27 ± 1.24 a1.35 ± 0.09 a,b
A3333.92 ± 44.70 a29.05 ± 1.28 a1.36 ± 0.08 b
Day 90 (n ≥ 44/tank)
DietWeightLengthK
C1542.06 ± 88.13 a,c34.38 ± 1.75 a1.33 ± 0.10 a
P1496.79 ± 70.93 b33.31 ± 1.46 b1.34 ± 0.09 a
P2527.67 ± 81.52 a,c33.54 ± 1.69 b1.39 ± 0.09 b
P3549.61 ± 78.20 a33.98 ± 1.52 a1.39 ± 0.09 b
A1520.52 ± 82.90 c33.63 ± 1.76 b1.36 ± 0.08 c
A2531.16 ± 87.23 a,c33.78 ± 1.72 b1.37 ± 0.10 b,c
A3543.26 ± 83.64 a,c33.92 ± 1.74 a1.38 ± 0.09 b,c
Table 5. Feed intake (n = 4 tanks) and growth characteristics of Atlantic salmon fed various experimental diets for 90 days. Different superscripts in a row indicate significant differences between treatments. All data are ±SD. SFR = specific feeding rate; PPV = protein productive vale, PER = protein efficiency ratio, bFCR = biological feed conversion ratio, eFCR = economic feed conversion ratio, TGC = thermal growth coefficient, SGR = specific growth rate.
C1P1P2P3A1A2A3
Feeding and Growth Rates (n = 4 Tanks of ≥44 Fish)
Feed intake (kg)16.19 ± 0.18 a15.57 ± 0.22 a15.95 ± 0.47 a17.08 ± 0.42 b16.64 ± 0.82 a17.09 ± 0.87 b17.41 ± 0.18 b
Weight gain (%)249.4 ± 3.04 a219.5 ± 10.87 b239.3 ± 10.75 a,b255.2 ± 6.31 a234.7 ± 4.35 b241.5 ± 17.53 b245.1 ± 20.24 b
SFR1.11 ± 0.01 a1.15 ± 0.02 a,b1.12 ± 0.02 a1.18 ± 0.03 a,b1.17 ± 0.03 a,b1.19 ± 0.05 b1.21 ± 0.03 b
PPV49.05 ± 0.6345.51 ± 1.7548.47 ± 1.0047.42 ± 1.1447.04 ± 1.1147.34 ± 2.7245.01 ± 3.56
PER2.68 ± 0.032.47 ± 0.102.62 ± 0.052.59 ± 0.062.55 ± 0.062.59 ± 0.152.46 ± 0.20
bFCR day 450.80 ± 0.03 a0.98 ± 0.08 b0.81 ± 0.04 a0.78 ± 0.06 a0.85 ± 0.07 a0.82 ± 0.03 a0.85 ± 0.08 a
bFCR day 900.80 ± 0.01 a0.89 ± 0.04 b0.83 ± 0.02 a,b0.84 ± 0.02 a,b0.87 ± 0.01 a,b0.87 ± 0.05 a,b0.89 ± 0.07 b
eFCR0.80 ± 0.01 a0.90 ± 0.04 b0.83 ± 0.01 a0.83 ± 0.02 a0.87 ± 0.01 a0.87 ± 0.05 a0.89 ± 0.06 b
TGC2.62 ± 0.02 a,b2.39 ± 0.09 a2.55 ± 0.09 a,b2.66 ± 0.04 b2.51 ± 0.11 a,b2.56 ± 0.14 a,b2.58 ± 0.14 a,b
SGR day 451.63 ± 0.04 a1.25 ± 0.07 b1.52 ± 0.07 a1.59 ± 0.91 a1.52 ± 0.13 a1.62 ± 0.04 a1.59 ± 0.12 a
SGR day 901.39 ± 0.01 a,b1.29 ± 0.04 b1.36 ± 0.04 a,b1.41 ± 0.02 a1.34 ± 0.05 a,b1.36 ± 0.06 a,b1.38 ± 0.07 a,b
Table 6. The morphological characteristics and fillet proximate composition of Atlantic salmon fed various experimental diets for 90 days (n = 12 ± S.D. for each characteristic). Different superscripts in a row indicate significant differences between treatments (p < 0.05).
C1P1P2P3A1A2A3
Morphological characteristics (n = 12)
Viscera wt (g)52.43 ± 7.2756.09 ± 8.8163.46 ± 7.0051.83 ± 9.9460.58 ± 4.5361.33 ± 6.6858.36 ± 7.80
Intestinal wt (g)36.16 ± 4.9438.43 ± 7.0444.30 ± 5.1335.95 ± 7.0342.96 ± 3.9842.86 ± 5.3138.66 ± 6.57
Liver wt (g)8.58 ± 1.84 a10.15 ± 1.64 a,b12.65 ± 2.63 b9.91 ± 2.60 a,b10.84 ± 1.09 a,b10.58 ± 2.12 a,b9.69 ± 1.36 a,b
Proximate composition (n = 12)
Protein (%)18.34 ± 0.1718.40 ± 0.3618.53 ± 0.2618.31 ± 0.3818.48 ± 0.2318.30 ± 0.3618.28 ± 0.33
Lipid (%)12.59 ± 0.76 a,b13.13 ± 1.84 a,b11.83 ± 0.26 a,b12.95 ± 1.05 a,b13.13 ± 0.62 a,b11.24 ± 0.60 b13.58 ± 0.48 a
Moisture (%)67.48 ± 0.78 a,b67.40 ± 1.76 a,b68.63 ± 0.40 a,b67.00 ± 0.81 a,b66.65 ± 0.34 a68.88 ± 1.03 b66.88 ± 0.51 a,b
Ash (%)2.24 ± 0.302.51 ± 0.362.34 ± 0.232.25 ± 0.222.03 ± 0.052.28 ± 0.332.63 ± 0.41
Table 7. Fatty acid profiles of control and experimental fish (n = 8 per treatment) after 90 days of feeding with FM/FO-centered, plant-, or animal-based feeds containing 0, 2.5 and 5.0% krill meal. Different superscripts in a row indicate significant differences between treatments (p < 0.05). C = control, P = plant, and A = animal. All data are ± SD.
C1P1P2P3A1A2A3
C14:02.58 ± 1.63 a0.66 ± 0.42 b0.76 ± 0.46 b0.83 ± 0.50 b0.63 ± 0.38 b0.76 ± 0.46 b0.86 ± 0.52 b
C15:00.19 ± 0.12 a0.09 ± 0.05 b0.09 ± 0.06 b0.09 ± 0.06 b0.09 ± 0.05 b0.09 ± 0.06 b0.10 ± 0.06 b
C16:010.53 ± 6.627.01 ± 4.367.60 ± 4.657.68 ± 4.668.14 ± 4.908.15 ± 4.928.34 ± 5.02
C17:00.24 ± 0.15 a0.12 ± 0.08 b0.12 ± 0.08 b0.12 ± 0.07 b0.11 ± 0.07 b0.12 ± 0.07 b0.12 ± 0.08 b
C18:02.81 ± 1.782.15 ± 1.322.22 ± 1.362.24 ± 1.362.39 ± 1.452.37 ± 1.442.39 ± 1.44
C20:00.16 ± 0.1000.22 ± 0.140.23 ± 0.140.23 ± 0.140.21 ± 0.130.22 ± 0.130.22 ± 0.13
C22:00.08 ± 0.050.13 ± 0.08013 ± 0.080.13 ± 0.080.12 ± 0.070.12 ± 0.080.12 ± 0.08
C16:1 ω93.25 ± 2.06 a0.82 ± 0.51 b0.92 ± 0.59 b0.93 ± 0.62 b1.11 ± 0.67 b1.10 ± 0.70 b1.17 ± 0.73 b
C18:1 ω915.11 ± 9.5926.96 ± 16.8527.76 ± 16.9327.79 ± 16.8327.73 ± 16.7927.36 ± 16.4927.03 ± 16.28
C20:1 ω91.64 ± 1.221.48 ± 0.921.49 ± 0.921.48 ± 0.911.29 ± 0.781.38 ± 0.841.35 ± 0.83
C22:1 ω90.19 ± 0.120.15 ± 0.090.15 ± 0.090.14 ± 0.090.14 ± 0.090.13 ± 0.080.14 ± 0.08
C24:10.27 ± 0.180.19 ± 0.120.18 ± 0.110.18 ± 0.110.15 ± 0.100.18 ± 0.110.17 ± 0.10
C18:2 ω69.04 ± 5.558.68 ± 5.255.26 ± 3.358.69 ± 5.278.93 ± 5.439.19 ± 5.768.60 ± 5.19
C18:3 ω60.15 ± 0.090.15 ± 0.090.15 ± 0.090.17 ± 0.100.15 ± 0.090.17 ± 0.100.14 ± 0.08
C18:3 ω33.03 ± 1.862.84 ± 1.731.88 ± 1.202.75 ± 1.673.07 ± 1.872.97 ± 1.872.91 ± 1.76
C20:2 ω60.76 ± 0.470.68 ± 0.420.41 ± 0.260.67 ± 0.410.73 ± 0.440.78 ± 0.490.67 ± 0.41
C20:3 ω30.30 ± 0.190.32 ± 0.200.21 ± 0.100.33 ± 0.200.29 ± 0.180.31 ± 0.200.26 ± 0.17
C20:3 ω60.21 ± 0.130.35 ± 0.220.33 ± 0.200.33 ± 0.200.33 ± 0.200.35 ± 0.200.30 ± 0.18
C20:4 ω60.40 ± 0.250.41 ± 0.250.38 ± 0.240.42 ± 0.260.39 ± 0.240.42 ± 0.260.41 ± 0.25
C20:5 ω31.46 ± 0.89 a1.47 ± 0.88 a3.51 ± 2.23 b1.32 ± 0.80 a1.41 ± 0.85 a1.59 ± 0.98 a1.52 ± 0.91 a
C22:20.01 ± 0.02 b0.06 ± 0.04 a0.06 ± 0.04 a0.05 ± 0.03 a0.04 ± 0.03 a0.05 ± 0.03 a0.05 ± 0.03 a
C22:5 ω30.78 ± 0.47 a0.76 ± 0.46 b1.61 ± 1.03 b0.67 ± 0.41 b0.75 ± 0.45 b0.81 ± 0.50 b0.79 ± 0.48 b
C22:6 ω37.28 ± 4.417.26 ± 4.346.54 ± 4.116.56 ± 4.027.38 ± 4.437.18 ± 4.457.28 ± 4.35
Total ω312.85 ± 2.2312.59 ± 2.2313.69 ± 1.9911.51 ± 2.0312.89 ± 2.8112.86 ± 2.1912.76 ± 2.24
Total ω610.69 ± 3.1910.24 ± 3.066.38 ± 1.8710.25 ± 3.0610.53 ± 3.1510.91 ± 3.2610.11 ± 3.03
EPA + DHA8.74 ± 5.308.74 ± 5.2210.05 ± 6.337.88 ± 4.818.78 ± 5.288.77 ± 4.818.80 ± 5.25
ω3: ω61.20 ± 0.03 ac1.23 ± 0.03 ac2.15 ± 0.19 b1.12 ± 0.08 c1.23 ± 0.03 ac1.18 ± 0.03 ac1.26 ± 0.03 ac
Disclaimer/Publisher’s Note: The statements, opinions and data contained in all publications are solely those of the individual author(s) and contributor(s) and not of MDPI and/or the editor(s). MDPI and/or the editor(s) disclaim responsibility for any injury to people or property resulting from any ideas, methods, instructions or products referred to in the content.

