Article

The bZIP Transcription Factor Family Orchestrates the Molecular Response to Nitrite Stress in the Largemouth Bass Spleen

1
College of Animal Science, Xichang University, Xichang 615000, China
2
Key Laboratory of Application of Ecology and Environmental Protection in Plateau Wetland of Sichuan, Xichang 615000, China
3
Panxi Laboratory of Animal Epidemic Disease Detection and Control of Sichuan, Xichang 615000, China
4
Xishuangbanna Hongdao Agricultural Technology Co., Ltd., Jinghong 666100, China
*
Author to whom correspondence should be addressed.
Fishes 2023, 8(11), 540; https://doi.org/10.3390/fishes8110540
Submission received: 12 September 2023 / Revised: 23 October 2023 / Accepted: 25 October 2023 / Published: 1 November 2023

Abstract

:
Nitrite toxicity poses a significant threat to aquatic organisms, including largemouth bass (LMB) and Micropterus salmoides. This study aimed to elucidate the role of bZIP transcription factors in mediating the molecular responses to nitrite stress in the LMB spleen. We identified 120 bZIP genes in the LMB genome using bioinformatics analysis and divided them into 11 subgroups based on phylogenetic relationships. Under nitrite stress, the bZIP_XI subgroup was upregulated, suggesting the activation of the stress response in the LMB spleen. Cellular pathway analysis revealed enrichment of pathways related to stress response, DNA repair, apoptosis, and autophagy. Co-expression network analysis highlighted bZIP_XI members such as msabZIP_49, msabZIP_12, msabZIP_39, and msabZIP_116 as potential key regulators. These transcription factors likely modulated the expression of stress-related genes like VCAM1, POLE3, and BMP1. Conserved binding motifs in the promoters of these genes may support regulation by bZIP_XI. Furthermore, bZIP_XI members correlated with immune cell infiltration in the spleen, potentially regulating immune-related genes like BCL2L1 and SELE. Homologs of bZIP_XI in other fish species exhibited similar expression patterns under stress. Overall, this study implicates the bZIP transcription factor family, notably the bZIP_XI subgroup, in orchestrating the molecular response of the LMB spleen to nitrite toxicity by regulating stress response pathways and immune function. These findings provide insights into nitrite stress adaptation in fish.
Key Contribution: This study elucidates a complex transcriptional network orchestrated by the bZIP family that enables the largemouth bass spleen to withstand nitrite-induced damage. It highlights the critical involvement of the bZIP_XI subgroup in regulating stress response and immune function.

1. Introduction

The basic leucine zipper (bZIP) transcription factor family plays crucial roles across a broad spectrum of biological functions, notably in directing gene expression, dictating cell proliferation, differentiation, and growth, and mediating stress responses [1]. In aquatic species, a burgeoning body of evidence indicates the pivotal role of bZIP transcription factors in responding to environmental stressors such as nitrite exposure [2,3]. The research on the role of bZIP in immunity has been more focused on C. elegans. Among the immune-related bZIP transcription factors, some are directly activated or inhibited by upstream kinases or phosphatases, such as SKN-1, CEBP-1, and ATF-7 [4,5], while some members participate in innate immune regulation through changes in expression levels, such as ZIP-2 and ATFS-1 [6,7]. However, our understanding of their specific functions and mechanisms under nitrite stress within piscine species is, to a great extent, still in its nascent stages and forms a subject of ongoing inquiry.
Largemouth bass (LMB; Micropterus salmoides), a species of international commercial significance, has been grappling with escalating challenges attributed to heightened nitrite concentrations in their natural habitats [8,9]. Nitrite (NO2−), an integral part of the nitrogen cycle, can become hazardous to aquatic fauna, including fish, upon reaching high concentrations [10]. In aquaculture systems in particular, disruptions to the delicate balance of bacterial nitrification and denitrification, often triggered by high stocking density or fertilizer use, can spur nitrite accumulation [11].
The ramifications of nitrite toxicity are wide-reaching and detrimental, potentially impinging on a range of physiological processes and posing a threat to the survival of fish. Extensive examinations have been undertaken into the physiological impacts and toxicity mechanisms of nitrite in diverse fish species and cell types. Evidence suggests that nitrite exposure provokes shifts in physiological and biochemical states, gene expression, and fish metabolism [12,13,14]. Hematological alterations, notably the oxidation of hemoglobin into methemoglobin, can disturb fish oxygen transport and induce hypoxia-like symptoms [15]. The compensatory response typically involves upregulating antioxidant-related genes such as SOD, CAT, and GPx, potentially implicating bZIP transcription factors in counteracting oxidative stress [16].
Moreover, nitrite could potentially exert effects on the nervous system, eliciting behavioral shifts and changes in gene expression related to neurotransmitter synthesis and signal transduction [17,18]. Its reach extends to vital organs like the liver and kidneys, the primary sites of detoxification and metabolic waste excretion, potentially inciting alterations in metabolic pathways and gene expression relevant to apoptosis and DNA repair [19].
The spleen, an indispensable component of the circulatory system, plays a critical role in blood cell formation, blood filtration, and immune response [20,21]. Nitrite exposure could place a heavier filtration load on the spleen and impair its functionality. Furthermore, nitrite might induce the immune response within the spleen by altering the expression of immune-related genes, potentially implicating bZIP transcription factors. However, the specific mechanisms driving nitrite-induced splenic damage in fish and the contribution of bZIP transcription factors within this context are still a topic of ongoing investigation. Therefore, in this study, we sought to identify members of the bZIP transcription factor family in LMB and nine other fish species and to conduct a comprehensive examination of their roles and target genes within the spleen. Our objective was to comprehensively characterize the critical roles played by the bZIP transcription factor family in piscine stress responses.

2. Materials and Methods

2.1. Animal Experimentation

All experimental procedures involving LMB were conducted in accordance with the animal care guidelines and were approved by Xichang University and the Key Laboratory of Application of Ecology and Environmental Protection in the Plateau Wetland of Sichuan. Approximately 1000 healthy and robust LMB (300 g ± 5 g in weight, similar in length) were obtained from Xishuangbanna Hongdao Agricultural Technology Co., Ltd. (Sipsongpanna, China). and acclimated for a two-week period prior to experimentation. The fish were housed in a circular open-top tank (diameter: 5 m, height: 1.2 m) and acclimated under the following conditions: a dissolved oxygen level of 10 mg/L, a temperature of 26 ± 2 °C, and a light/dark cycle of 13/11 h during June. The diet consisted of commercial pellets (protein 50%, crude fat 8%; Haid Group, Guangdong, China) administered three times daily. Tank maintenance included the daily removal of feed debris and feces by suction, with a 20% water replacement using fresh dechlorinated water at 10 a.m.
Following a 24 h fasting period, acclimated LMB (380 g ± 5 g, similar in length) were randomly divided into four nitrite-treatment groups. The N1 group served as the control, maintained in nitrite-free dechlorinated water. The N2 and N3 groups were exposed to nitrite concentrations of 400 mg/L and 600 mg/L for 20 min, respectively. The N4 group underwent initial exposure to 600 mg/L nitrite for 20 min, followed by transfer to nitrite-free water for 20 min of recovery. We determined through pre-experiments that at 20 min, the mortality rate of largemouth bass reached half of the total, so the exposure time for nitrite was set at 20 min. All other rearing conditions, such as temperature and feeding, were maintained during the acclimation phase. Each group contained 30 fish and was housed in smaller tanks (diameter: 1 m, height: 1.2 m). The experiment was conducted in triplicate, using sodium nitrite powder (S818033; Macklin Biochemical Technology Co., Ltd., Shanghai, China) to achieve the required nitrite concentrations per the manufacturer’s instructions. Fish were fasted for 24 h prior to sampling and anesthetized using Eugenol (1:12,000; Shanghai Experiment Reagent Co., Ltd., Shanghai, China). The spleens were extracted and preserved in formaldehyde for histological examination, with two replicates taken from each treatment. Additionally, spleen samples were collected and immediately stored at −80 °C for RNA extraction and transcriptome sequencing, with 3 replicates taken from each treatment.

2.2. H&E Staining Procedure

Following 48 h of fixation in formaldehyde, tissues (spleen, gills, intestine, heart, and liver) from each experimental group were dehydrated and embedded in paraffin. Subsequently, 5 μm sections were prepared for H&E staining (G1005-100ML; Servicebio Biotech Technology Co., Ltd., Wuhan, China). The stained tissue sections were examined using a Leica microscope (DM5000; Leica, Nussloch, Germany).

2.3. RNA Extraction and RNA-seq

Total RNA was extracted from LMB spleen tissue using TRIzol reagent (R0016; Beyotime, Shanghai, China) according to the manufacturer’s instructions. The DNase I enzyme (D7073; Beyotime, Shanghai, China) was applied to eliminate genomic DNA contamination. Finally, 2 μg of total RNA was used for cDNA synthesis with the TUREscript 1st Stand cDNA Synthesis Kit (Aidlab, Beijing, China) according to the manufacturer’s instructions. Reverse transcription was achieved at 42 °C for 40 min and 65 °C for 10 min. The obtained cDNA was used for sequencing and subsequent analysis.

2.4. Acquisition of Multi-Species Transcriptome Data for Comparison

The original transcriptome sequencing data of the species Oreochromis aureus (oau), Oreochromis niloticus (oni), and Larimichthys crocea (lcr) were obtained from publicly available data in the publications of Zhou et al. [22], Xu et al. [23], and Mu et al. [24], respectively. All data were downloaded from NCBI (https://www.ncbi.nlm.nih.gov/datasets/genome/) (accessed on 12 May 2023).

2.5. Mapping Reads to the Reference Genome

We downloaded the reference genome of LMB from NCBI with the accession number GCF_014851395.1. We also downloaded the reference genomes of Oreochromis aureus (oau), Oreochromis niloticus (oni), and Larimichthys crocea (lcr) from NCBI, with accession numbers GCF_013358895.1, GCF_001858045.2, and GCF_000972845.2, respectively. The indexing, mapping, and quantification of the largemouth bass and the other three species were conducted using the same software and version. Hisat2 (v2.1.0) [25] was used to create a reference genome index and to align paired-end clean reads to the reference genome.

2.6. Gene Expression Quantification

Stringtie (2.0.1) [26] was used to count the number of reads that were mapped to each gene. Gene expression levels were quantified as FPKM (fragments per kilobase of transcript per million mapped fragments), which was computed based on gene length and the number of reads mapped to each gene.

2.7. Differential Expression Analysis

The DESeq package (1.18.0) [27] in R was employed for differential expression analysis between two LMB treatment groups (two biological replicates per condition). DESeq uses a negative binomial distribution model to identify differential gene expression. The p-values obtained were adjusted using the Benjamini and Hochberg approaches for controlling the false discovery rate.

2.8. Functional Enrichment Analysis

The R package, clusterProfiler (4.8.2) [28], was utilized for Gene Ontology (GO) and Kyoto Encyclopedia of Genes and Genomes (KEGG) enrichment analyses. After inputting the gene list into clusterProfiler and selecting the target species, we employed the enrichGO function for GO enrichment analysis. The enrichment level of each GO term was computed using statistical methods such as the hypergeometric distribution or Fisher’s exact test, with the Benjamini and Hochberg approach applied for error-rate control. Likewise, the enrichKEGG function was used for KEGG enrichment analysis, determining the enrichment level of KEGG pathways, again utilizing the Benjamini and Hochberg approach.

2.9. Single-Sample Gene Set Enrichment Analysis (ssGSEA)

We used the GSEABase (1.58.0) [29] and GSVA (1.44.5) [30] packages in R to perform ssGSEA on the complete expression dataset with gene sets from KEGG, Reactome, and GO databases, encompassing various biological pathways and processes. Analysis was extended to 28 gene sets representative of different immune cell types to further examine immune cell infiltration in our samples. After ssGSEA, the results were normalized and assigned enrichment scores, reflecting the upregulated (positive score) or downregulated (negative score) trends of the gene set in each sample, enabling the identification and quantification of pathway activities and immune cell infiltration.

2.10. Protein-Protein Interaction Analysis

The online search tools STRING-DB (v11.0, https://string-db.org/) (accessed on 19 June 2023) [31] were used to predict the putative protein-protein interaction networks with candidate bZIP family proteins in the LMB spleen, using default settings.

2.11. Transcription Factor Family Screening

LMB proteins were subjected to transcription factor prediction on the AnimalTFDB website [32], identifying 4035 transcription factors. Differentially expressed genes (DEGs) present in groups N3 and N1 were screened to identify differential transcription factors, yielding 1437 transcription factors. Further refinement resulted in 177 transcription factors with p-values of DEGs between N3 and N1 smaller than 0.05. Utilizing the LMB gene expression profile, we examined the expression of 177 transcription factors, eliminating those without expression and leaving 120 transcription factors. Using heat maps, we screened for highly expressed transcription factors with significant differential expression, focusing on bZIP genes for subsequent analysis.

2.12. Identification of msabZIP Family Genes

We delineated members of the bZIP gene family in the LMB genome. The bZIP protein sequence was ascertained via InterPro (https://www.ebi.ac.uk/interpro/entry/InterPro/IPR043321/) (accessed on 22 May 2023). Hidden Markov model (HMM) profiles (PF00170) were secured through the Pfam database (http://pfam-legacy.xfam.org/) (accessed on 22 May 2023). Using HMMER 3.1, we determined bZIP gene family members within the genome, setting the Expect (e) cutoff at 0.00001 (http://hmmer.org/) (accessed on 22 May 2023). Further corroboration of the identification results was accomplished with NCBI-CDD (https://www.ncbi.nlm.nih.gov/Structure/bwrpsb/bwrpsb.cgi) (accessed on 22 May 2023). In total, 120 msabZIP gene family members were recognized, and their conserved domains were authenticated using MEME (https://meme-suite.org/meme/tools/meme) (accessed on 31 May 2023). These members were denoted as msabZIP1–msabZIP120. The physicochemical properties of these members, including molecular formulas and weights, isoelectric points (pI), instability and aliphatic indices, and grand averages of hydropathicity (GRAVY), were computed utilizing the ExPASy database (https://web.expasy.org/protparam/) (accessed on 19 June 2023).

2.13. Phylogenetic Analysis and Classification of msabZIP Genes

We selected LMB and nine other fish species (Oreochromis aureus, Oreochromis niloticus, Larimichthys crocea, Lates calcarifer, Cyprinus carpio, Takifugu rubripes, Cynoglossus semilaevis, Danio rerio, and Gasterosteus aculeatus) for the construction of phylogenetic trees. Genome data for LMB were procured from NCBI under project accession number GCF_014851395.1 (https://www.ncbi.nlm.nih.gov/datasets/genome/GCF_014851395.1/) (accessed on 12 May 2023). Genome data for Oreochromis aureus, Oreochromis niloticus, and Larimichthys crocea were obtained from NCBI (https://www.ncbi.nlm.nih.gov/datasets/genome/) (accessed on 12 May 2023). The bZIP sequences of the remaining six species were obtained from the AnimalTFDB v4.0 (http://bioinfo.life.hust.edu.cn/AnimalTFDB4/#/) (accessed on 12 May 2023). A multi-species phylogenetic tree was constructed employing IQ-TREE (2.1.4-beta, Vienna, Austria) [33], which utilized the maximum likelihood (ML) method with 1000 bootstraps. A visually interpretable phylogenetic tree of the msabZIP gene family was generated using the package ggtree (3.8.2) in R (www.r-project.org) (accessed on 6 June 2023).

2.14. Predicting Cis-Regulatory Elements and Building Regulatory Networks

The Python function Pearson from the stats module was utilized to calculate the Pearson correlation of gene expression between bZIP genes and essential pathways. Genes with an absolute correlation greater than 0.7 were visualized using Cytoscape (3.10.0) [34]. The MEME tool, FIMO (5.5.4), was leveraged to predict all bZIP cis-regulatory elements within 2000 bp upstream of the target genes. We then extracted the predicted binding sites from the promoter region and conducted a motif enrichment analysis using MEME (https://meme-suite.org/meme/tools/meme) (accessed on 31 May 2023). The structure map of the upstream region gene was visualized by the ‘gggenes’ package in R (4.2.0, Mac OS X GUI, written by Simon Urbanek, Hans-Jörg Bibiko, and Stefano M. Iacus).

3. Results

3.1. Identification and Analysis of the LMB bZIP Gene Family

Initially, from the LMB genome, 4034 transcription factor genes from 79 gene families were identified, and further transcriptomic analysis revealed that 2013 of these transcription factors were expressed in the spleen of LMB (Figure S1a). Subsequently, we screened for the transcription factor family, which exhibited the most drastic changes in the LMB spleen under nitrite stress. The results indicated that members of the bZIP family might be key transcription factors involved in the nitrite stress response in the LMB spleen (Figure S1b). Consequently, we examined the bZIP gene family in LMB and identified a total of 120 members (msabZIP_1~msabZIP_120). Notably, protein length (103~868), molecular weight (11.73 kDa~98.16 kDa), isoelectric point (10.32~10.45), and instability index (40.41~87.18) of the bZIP family members in LMB exhibited significant differences (Table S1). Identification of the conserved domains of the bZIP gene family led to the discovery of 10 conserved domains among the 120 proteins, and the number and types of domains showed apparent disparity among different sequences (Figure S2). Motif-1 and motif-2 were identified as the typical structural domains of the bZIP gene family in LMB, where motif-1 contained 23 amino acids and motif-2 contained 32 amino acids (Figure 1). Based on the number and type of structural domains and the structure of the bZIP family genes, the 120 bZIP genes were classified into 11 subgroups (bZIP_I~bZIP_XI). Phylogenetic analysis suggested that bZIP_XI may be the most ancient subgroup in LMB, while bZIP_I may be the most recent (Figure 2). Interestingly, the bZIP_I subgroup has experienced the most differentiation and expansion, indicating its relatively low conservation compared with other subgroups and that the bZIP_I subgroup has undergone rapid changes in LMB (Figure 2).
The four subgroups are represented by different colors, and the degree of support is represented as four levels based on different colors and circles of different sizes. The six rings outside the phylogenetic tree represent Protein Molecular Weight (PMW), Protein Isoelectric Point (PIP), Protein Humidity (PH), Protein Aliphatic Index (PAI), Protein Instability Index (PII), and protein length (PL) from the inside out, respectively.

3.2. Analysis of the bZIP Subgroup Associated with Nitrite-Induced Spleen Injury

We assessed the impact of nitrite on the LMB spleen. In the N1 (0 mg/L) group, the spleen tissue exhibited normal structure and cell arrangement, with uniform cell nucleus staining, regular cytoplasmic intercellular gaps, more blood cells, and fewer lymphocytes, while red and white pulp presented distinct boundaries (Figure 3a). In the N2 (400 mg/L) group, the spleen tissue displayed vacuolization in the nuclei, increased intercellular gaps, cell lysis started to appear, and the number of blood cells decreased (Figure 3a). In the N3 (600 mg/L) group, a substantial increase in the number of blood cells was observed, cells started to lyse extensively, and significant tissue structural damage was detected. This indicates that, with the increase in nitrite concentration, the degree of spleen tissue damage in LMB significantly increased (Figure 3a). After return to the normal nitrite-free environment (N4), the spleen exhibited a tissue structure similar to N1, indicating that nitrite-induced short-term damage to the LMB spleen was reversible to a certain extent (Figure 3a). In summary, nitrite exposure inflicted the most severe damage on the LMB spleen of the N3 group.
To explore the molecular mechanism of spleen damage, the expression patterns of all bZIP subgroups were screened. The results indicated that the genes of the bZIP_XI subgroup were almost all upregulated in N3, which might suggest their significant function in LMB spleen damage (Figure S3 and Figure 3b). To preliminarily assess the potential functions of bZIP family genes in the LMB spleen, we built an interaction network between LMB bZIP proteins and other proteins based on the STRING database. The results suggested that bZIP had close interactions with many signaling pathways and functional proteins. We identified msabZIP72, msabZIP73, and msabZIP59 as key transcription factors in the interaction network, while uba52, mapk3, rps3a, etc., might be key functional genes (Figure 3c). Further functional analysis of the genes in the interaction network indicated that the functions of these genes were related to the ribosome, MAPK signaling pathway, apoptosis, mitophagy, and autophagy pathways (Figure 3d). In summary, these results provide important suggestions for further in-depth analysis.

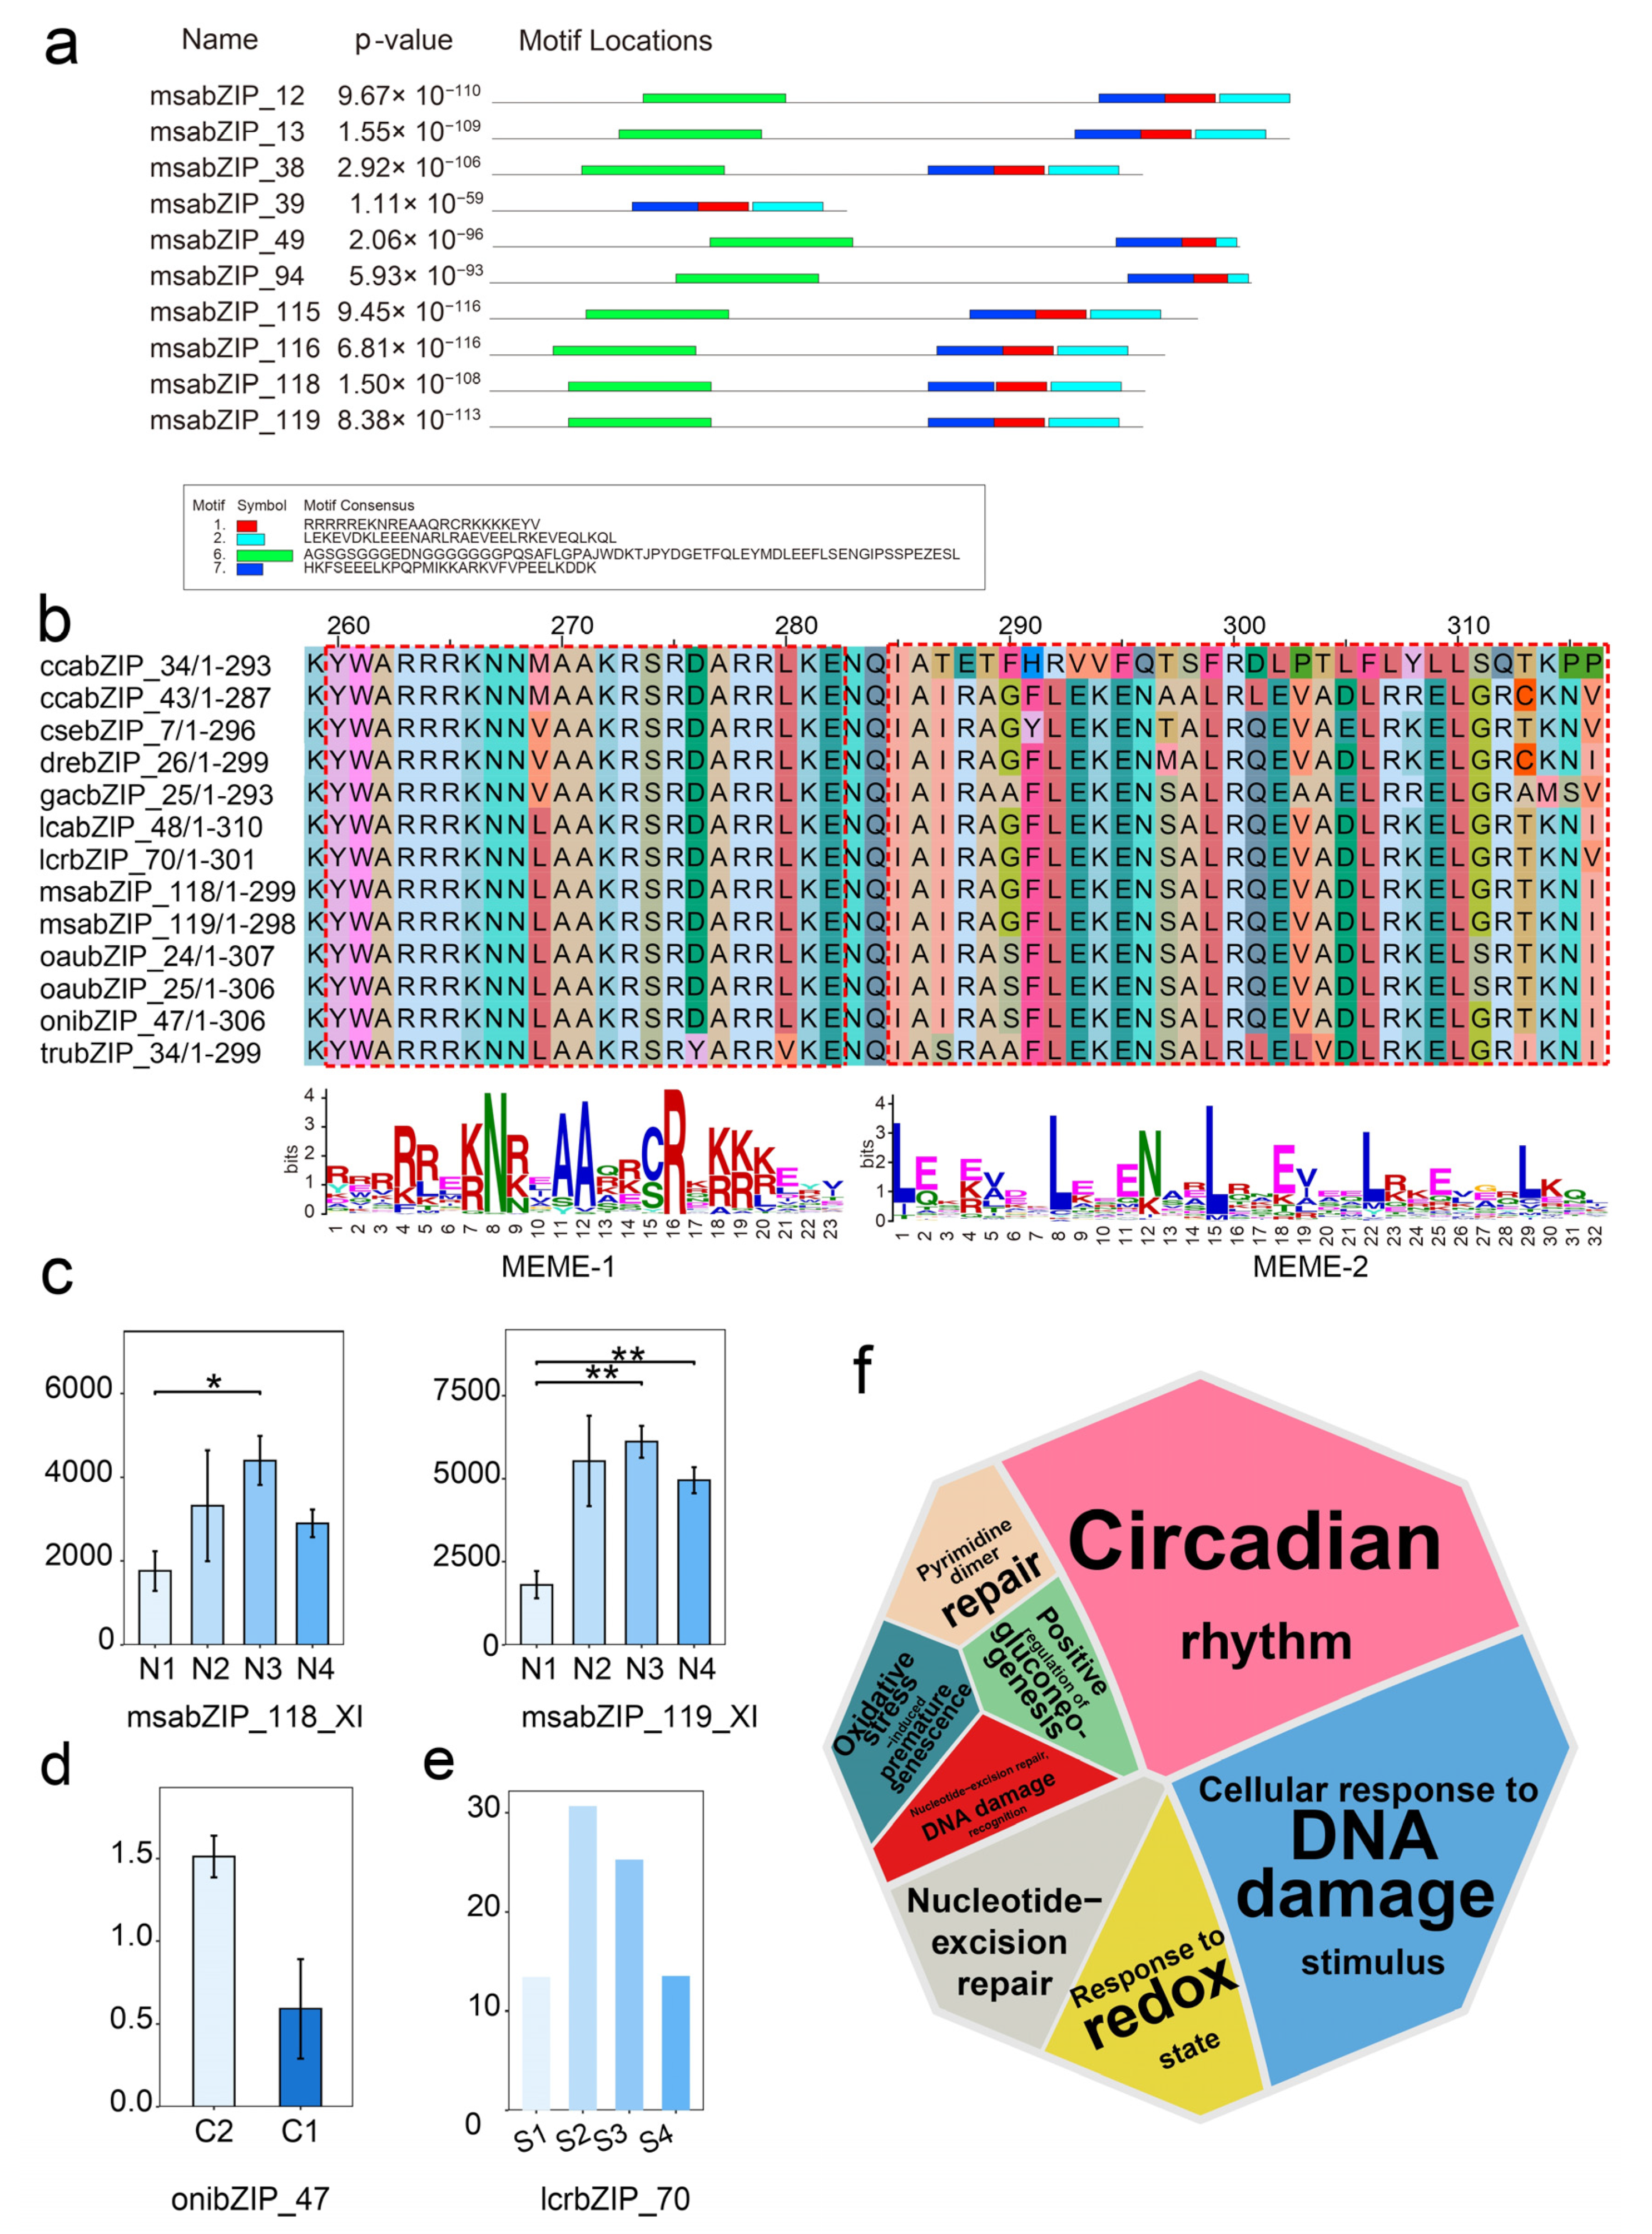
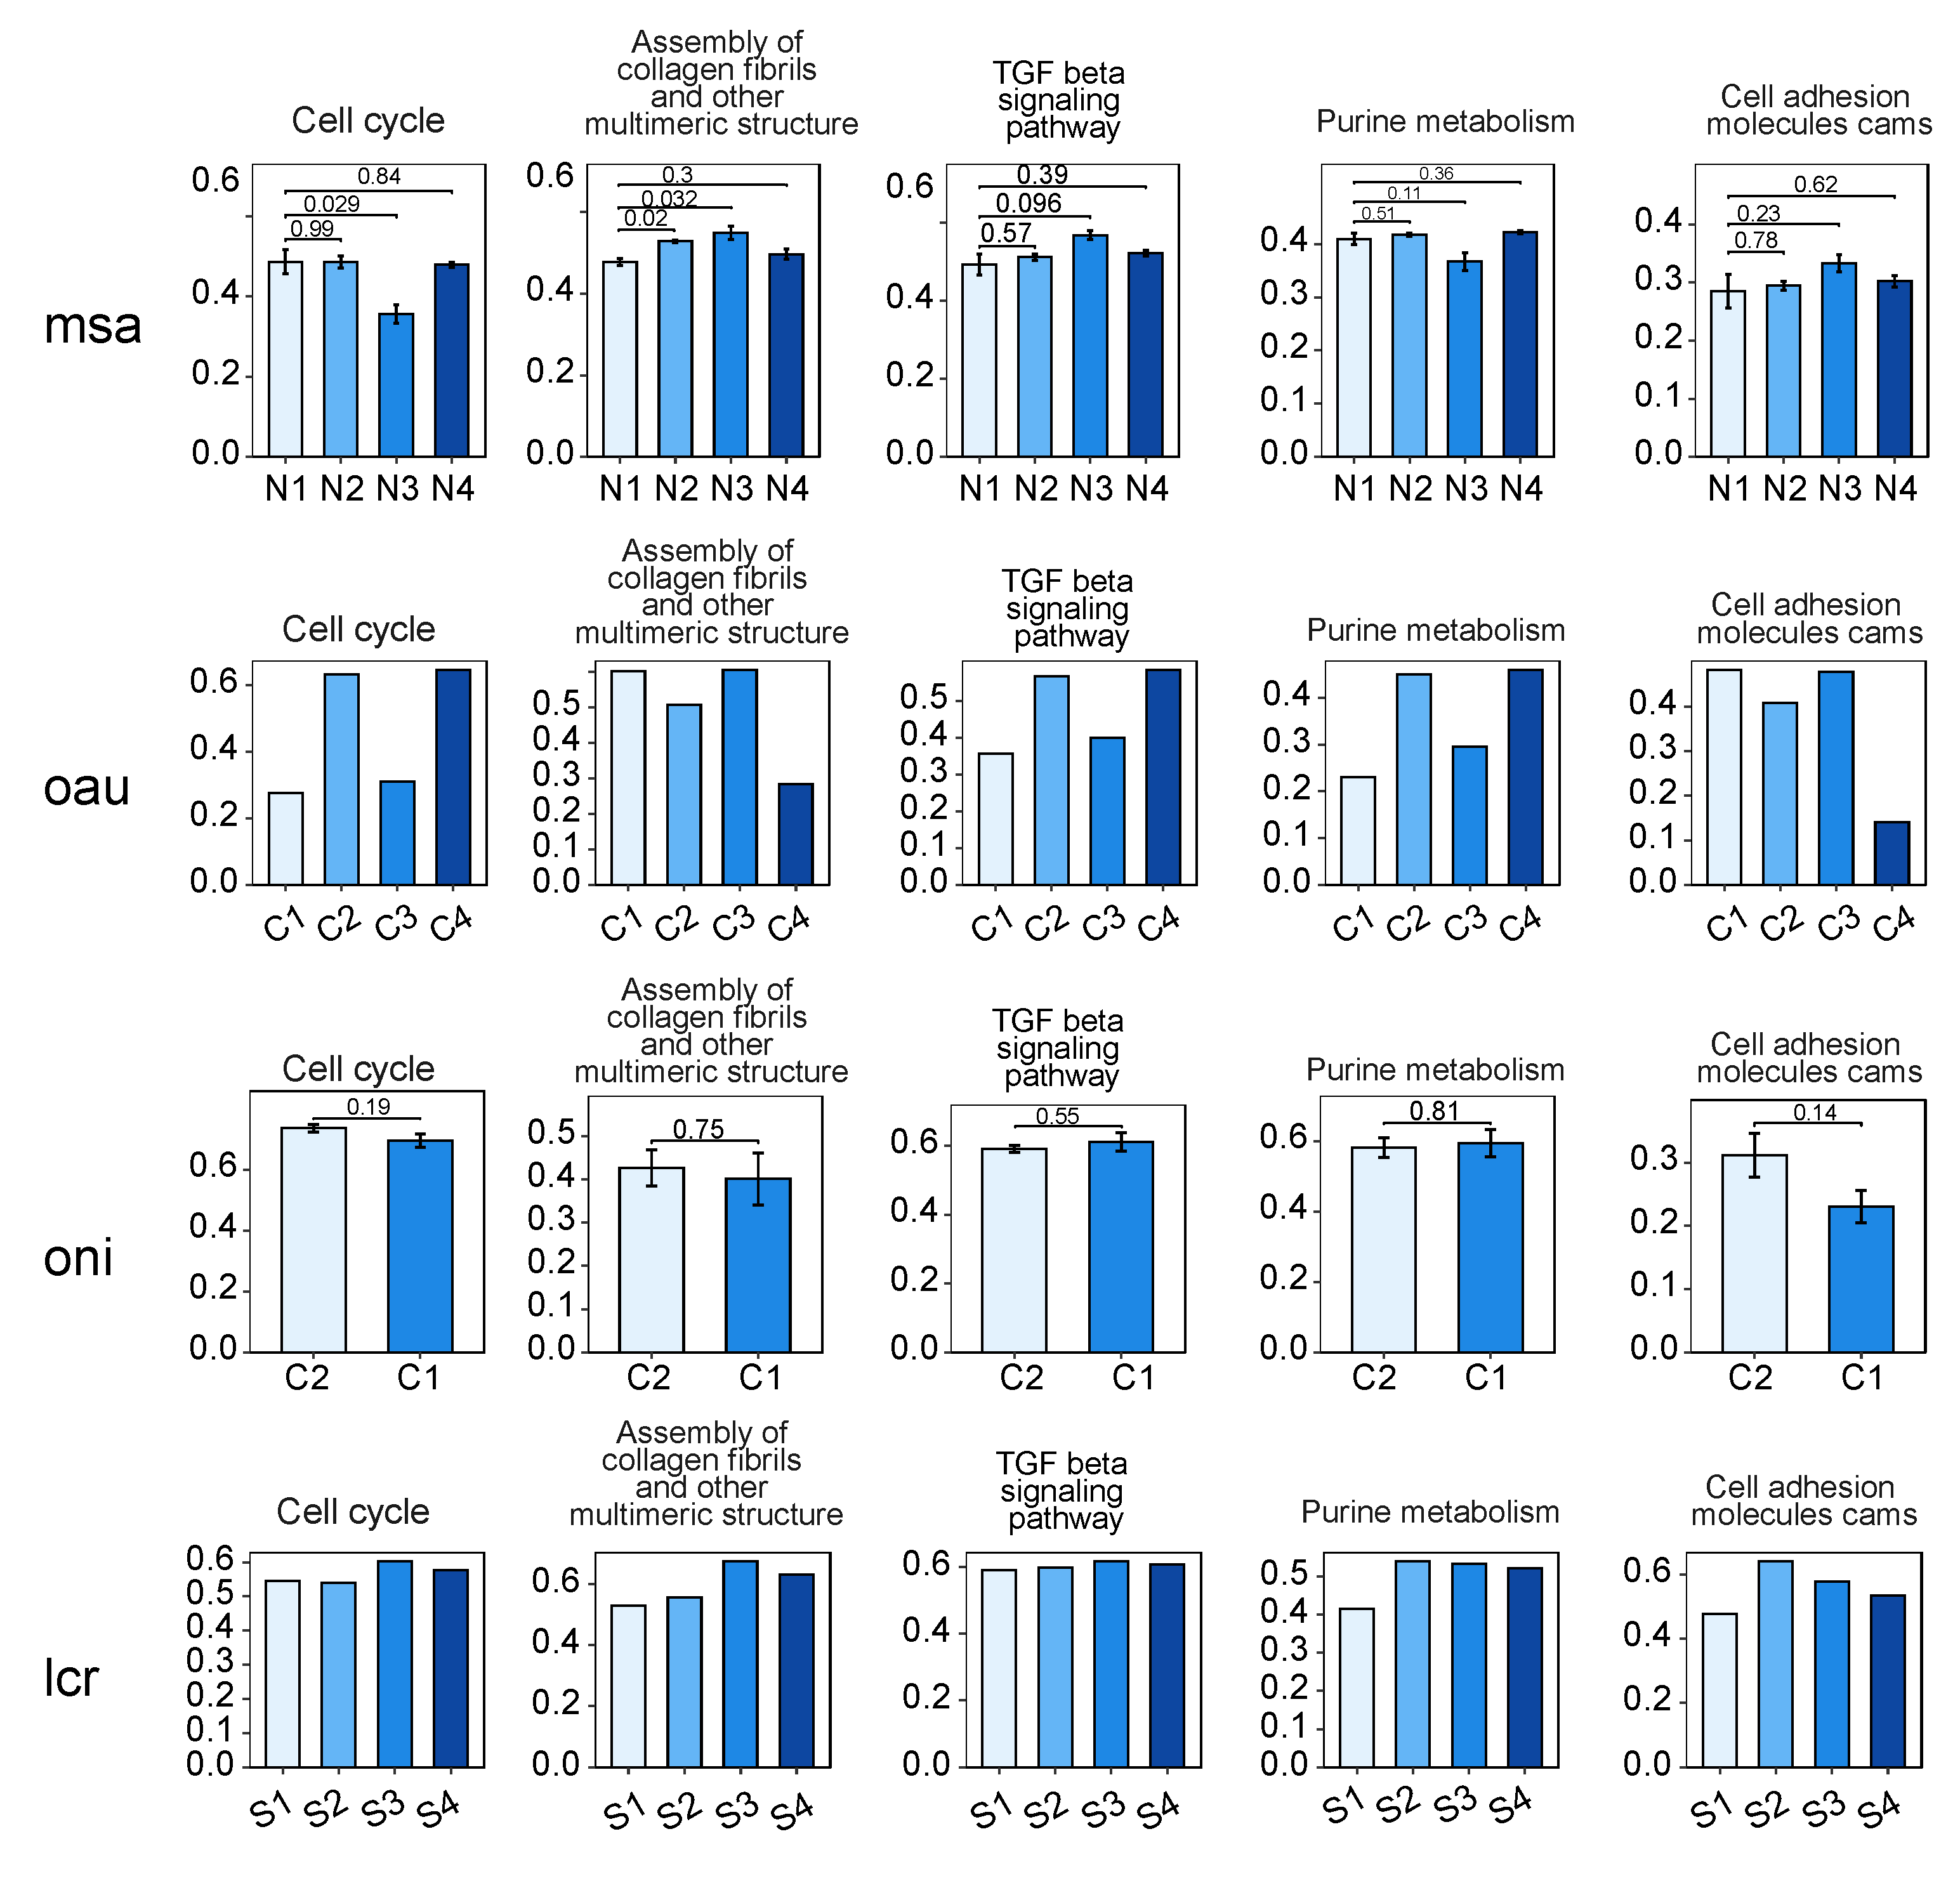
3.3. Phylogenetic and Functional Analysis of the bZIP Subgroup across Species

The aforementioned analyses indicate that the genes of the bZIP family may play a certain role in the nitrite-induced damage to the spleen in LMB. We further examined the phylogeny of the bZIP family genes of LMB (M. salmoides: Msa) and nine other fish species (O. aureus: Oau; O. niloticus: Oni; L. crocea: Lcr; L. calcarifer: Lca; C. carpio: Cca; T. rubripes: Tru; C. semilaevis: Cse; D. rerio: Dre; G. aculeatus: Gac), classifying all Bzip gene families from these species into 11 subgroups (I~XI) according to the subtypes of LMB. The results exhibited high conservation in Bzip_XI across species, implying that they may originate from orthologous genes shared by these species (Figure 4a). However, the phylogenetic relationships among subgroups like Bzip_I, Bzip_II, and Bzip_IX were relatively complex across species, possibly a result of paralogous family expansion within the respective species (Figure 4a). Further, an inter-species phylogenetic tree of the Bzip_XI subgroup was constructed based on the previous analyses (Figure 4b), revealing a highly mixed evolutionary pattern across species. High similarities were observed in protein length, molecular weight, and properties among different species (Figure 4b). Among these, msabZIP_118 and msabZIP_119 were found to be closely related to trbZIP_34 and lcrbZIP_70 in phylogeny, whereas msabZIP_38, msabZIP_39, and msabZIP_40 were closely related to lcrbZIP_53 (Figure 4b). Other msabZIP genes displayed similar trends, whose association with respective orthologous genes in L. crocea hinted at a close relationship between L. crocea and LMB and may suggest the conservation of Bzip_XI in phylogeny.
Next, we analyzed the conserved structural domains of the Bzip_XI subgroup genes and found that the Bzip_XI subgroup includes four of the ten motifs from the Bzip family. All Bzip_XI members contained motif-7, motif-1, and motif-2, with motif-1 and motif-2 being typical Bzip family structural domains. Motif-7 was highly conserved in Bzip_XI, with no variations in 19 of the 30 amino acid residues (Figure S3). Apart from msabZIP_39, all other members of Bzip_XI contain motif-6 (Figure 5a). We then performed sequence alignment of the motifs of inter-species Bzip_XI members on the same sub-branch as msabZIP_118 and msabZIP_119 (Figure 5b). The results showed that motif-1 and motif-2 were highly conserved across eight species, with variations observed in trbZIP_34, ccbZIP_34, and ccbZIP_43 in motif-2. Furthermore, we verified the expression levels of Bzip_XI genes across species (Figure 5c–e). The results showed that both msabZIP_118 and msabZIP_119 were significantly upregulated in the N2 and N3 groups of LMB, whereas oaubZIP_24 was upregulated in O. aureus under high-salt stress. Also, onibZIP_47 was upregulated in O. niloticus under high-salt stress, and lcrbZIP_70 was upregulated in L. crocea under hypoxic stress. In conclusion, these results suggest that the members of the Bzip_XI subgroup may participate extensively in the spleen damage response across different species. Functional analysis of related genes of the Bzip_XI subgroup in different species suggested that they might be associated with functions such as response to DNA damage, response to redox state, and nucleotide excision repair (Figure 5f), implying their close relationships with cellular cycles and cell damage.

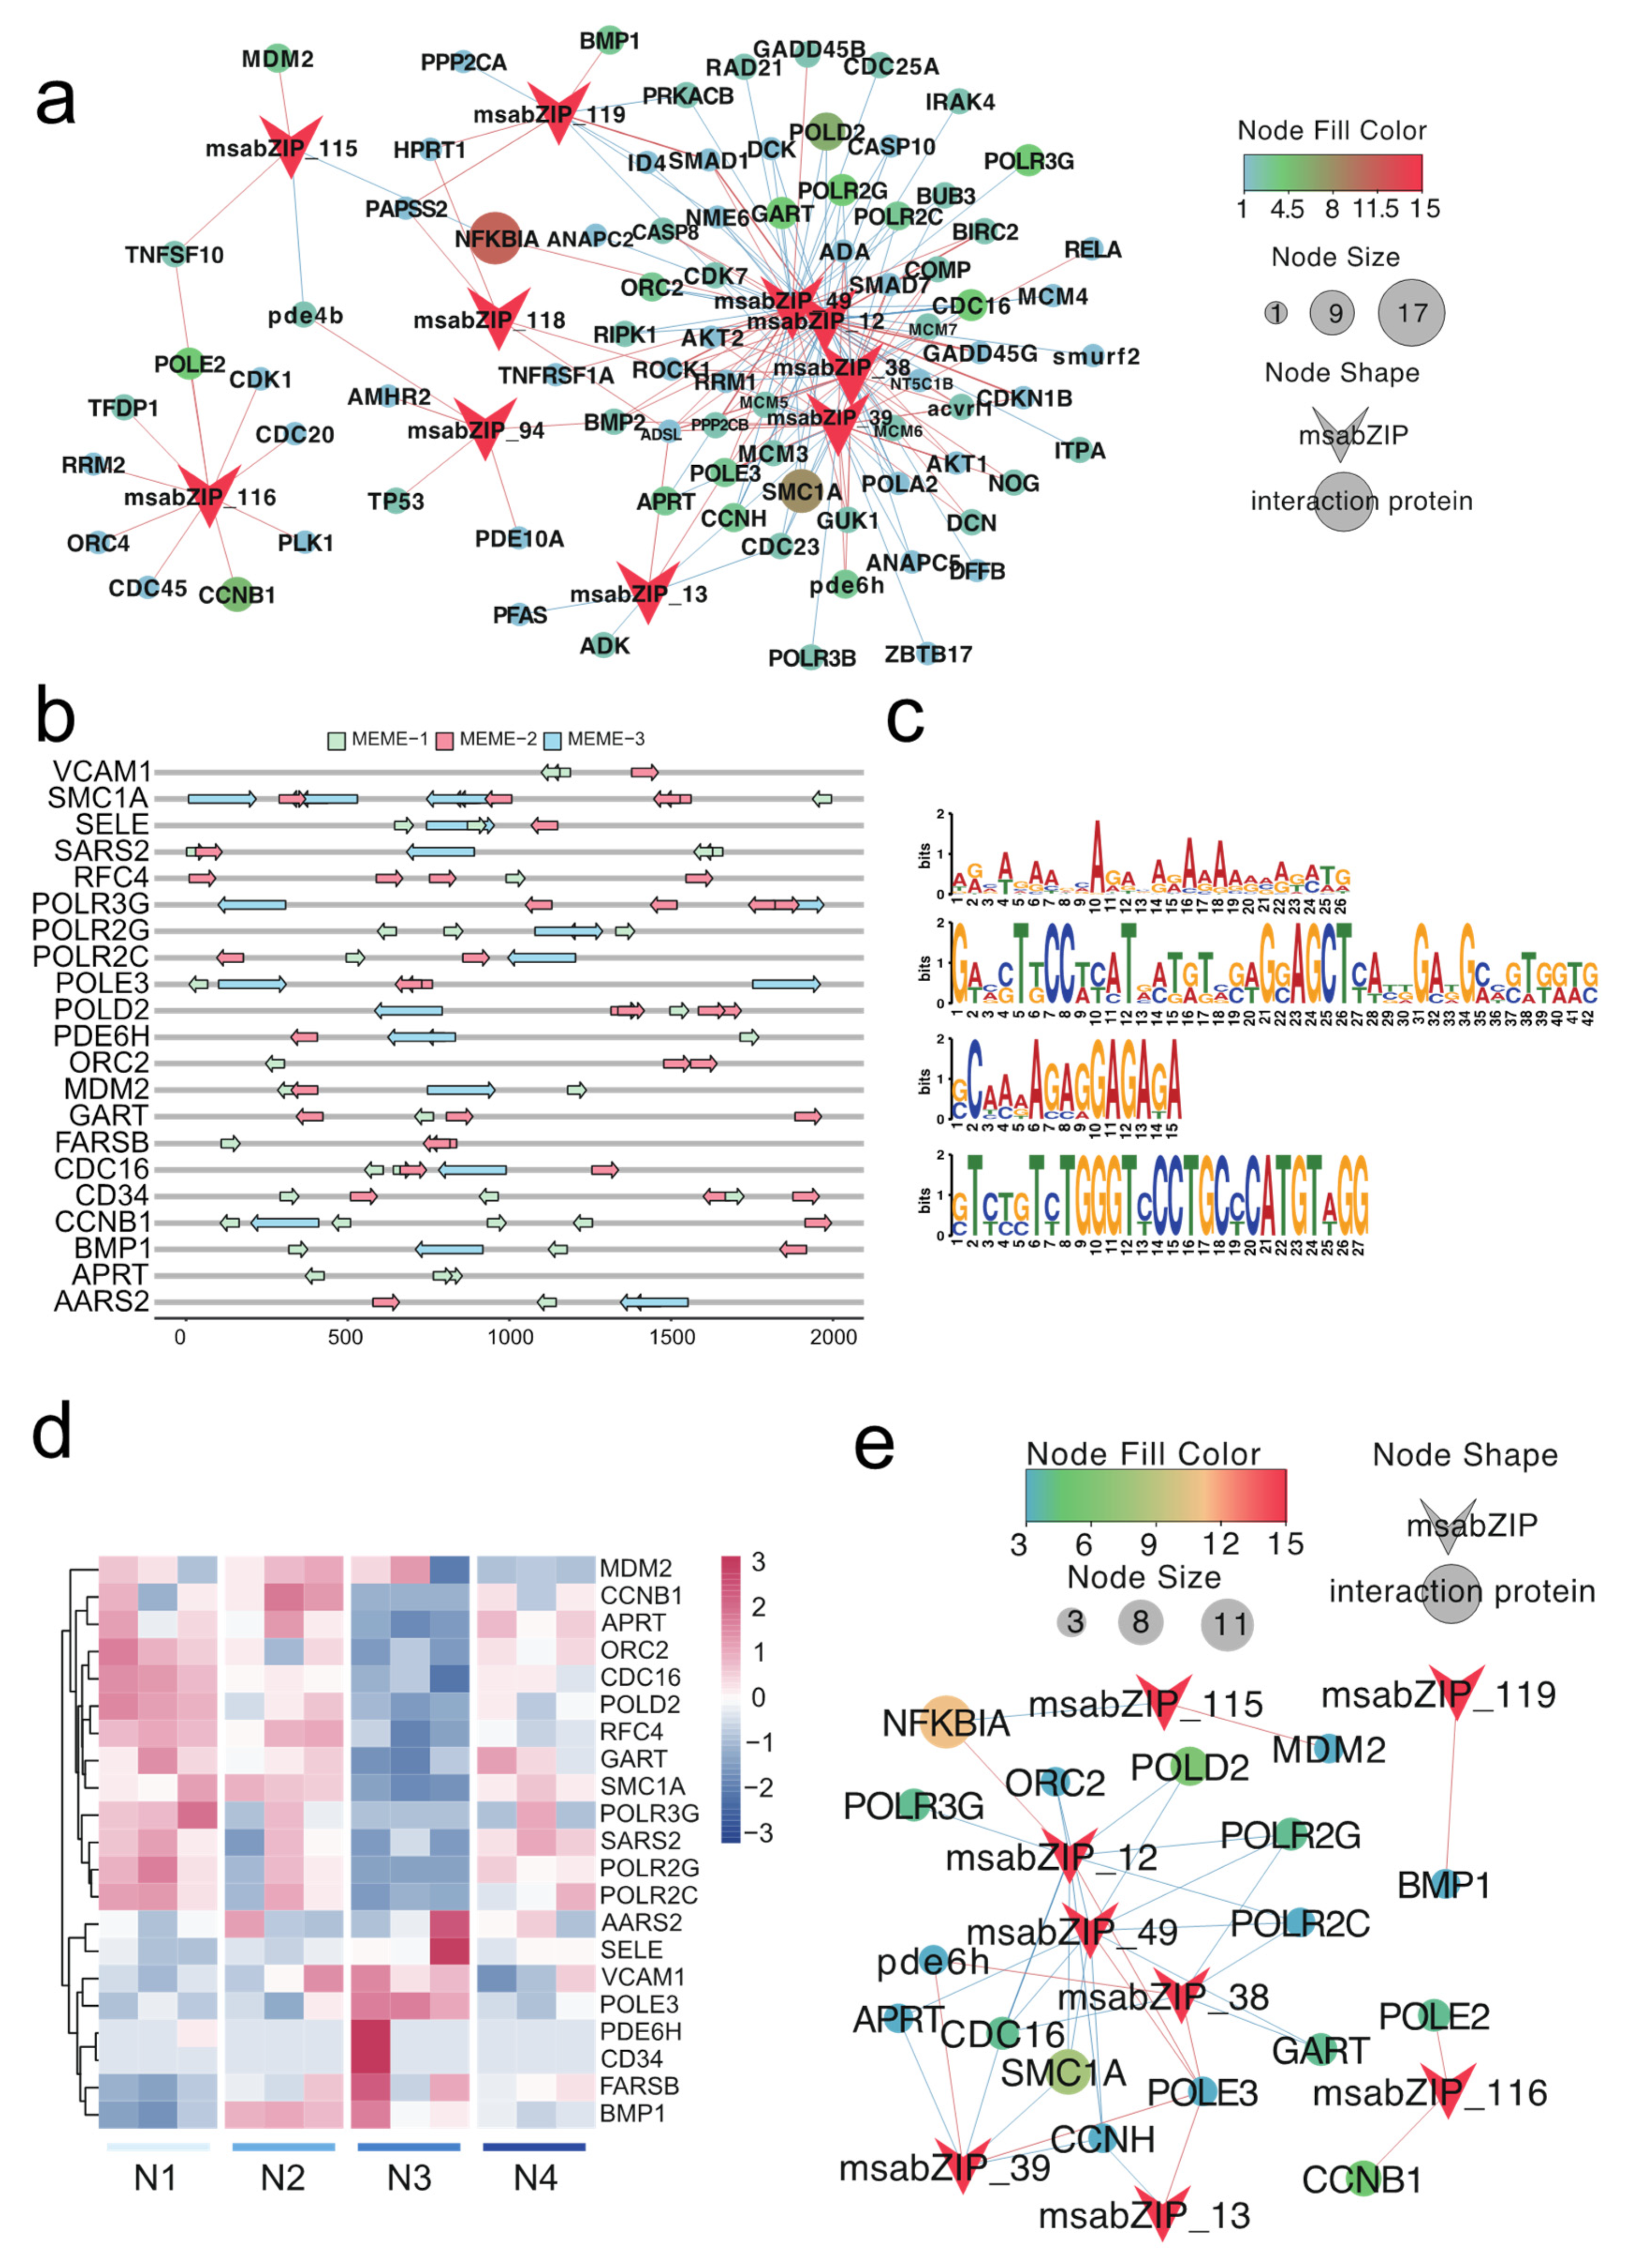
3.4. Key Pathway Screening and Regulatory Network Analysis between the bZIP Subgroup and Nitrite-Induced Splenic Damage

We calculated the ssGSEA pathway score of each sample in LMB based on the KEGG/reactome pathway gene sets of humans and zebrafish. Similarly, pathway scores were also calculated for O. niloticus (oni), O. aureus (oau), and L. crocea (lcr) (Figure 6). Firstly, we screened target genes with multiple bZIP binding sites and then identified the pathway with the highest number of target genes. Finally, by calculating the correlation between these pathways and subgroup genes, we identified the pathway with the highest correlation. Ultimately, five pathways related to nitrite stress and our previous analysis were identified in LMB: cell cycle, assembly of collagen fibrils and other multimeric structures, TGF beta signaling pathway, purine metabolism, and cell adhesion molecules (CAMs) (Figure 6). The changes in these pathways exhibit diverse trends in other species. For example, in O. aureus, the cell cycle, TGF beta signaling pathway, and purine metabolism pathway showed a similar trend of upregulation in both C2 and C4 treatments compared to C1, while in the C3 treatment, only a small upregulation was observed. The cell adhesion molecules (CAMs) and assembly of collagen fibrils and other multimeric structures were opposite, with significant downregulation in the C2 and C4 treatments compared to C1, while no significant changes were observed in the C3 treatment. The response of these pathways in O. aureus to different concentrations of salt stress was non-linear. In O. niloticu and L. crocea, the assembly of collagen fibrils and other multimeric structures, the TGF beta signaling pathway, and the cell adhesion molecules (CAMs) pathway both showed an increase in expression under stress, consistent with the trend of changes in largemouth bass, while the cell cycle pathway showed an opposite trend (Figure 6).
Overall, we identified these five pathways as key pathways involved in splenic injury in LMB and believed they might play analogous roles in other species. Next, we selected the key genes with differential expression in the N2 and N3 groups of LMB in the aforementioned pathways. Consequently, we constructed a co-expression network between members of the bZIP_XI subgroup and these DEGs. The network analysis indicated that msabZIP_49, msabZIP_12, msabZIP_39, and msabZIP_116 could be key transcription factors involved in regulating the aforementioned pathways (Figure 7a), with GADD45B, SMC1A, CDC16, SMAD1, POLD2, and others being potential key genes involved in splenic injury. To further validate potential regulatory relationships between bZIP_XI transcription factors and these DEGs, we predicted binding sites of the bZIP gene family within the 2 kb region upstream of these genes. The results indicated that 21 genes had numerous bZIP family binding sites, with the highest number of binding sites found in POLD2, POLE3, CD34, SMC1A, and RFC4 (Figure 7b). Further binding analyses revealed that these genes all contained typical bZIP transcription factor binding motifs, such as AGAGAG and GGAGCT (Figure 7c). Further analyses of the expression levels of these key genes revealed that VCAM1, POLE3, PDE6H, CD34, FARSB, BMP1, etc. were upregulated in treatment N3 of LMB, whereas the remaining genes were downregulated in N3 (Figure 7d). Combining gene expression changes and the number of binding sites in promoter regions, we further screened the interaction network between bZIP_XI and key genes and revealed the most critical regulatory transcription factors and potential downstream genes (Figure 7e). Overall, these results suggested that transcription factors in LMB such as msabZIP_49, msabZIP_12, msabZIP_39, and msabZIP_116 could influence the spleen response of LMB to nitrite stress by affecting pathways such as cell cycle, purine metabolism, and the TGF-beta signaling pathway.

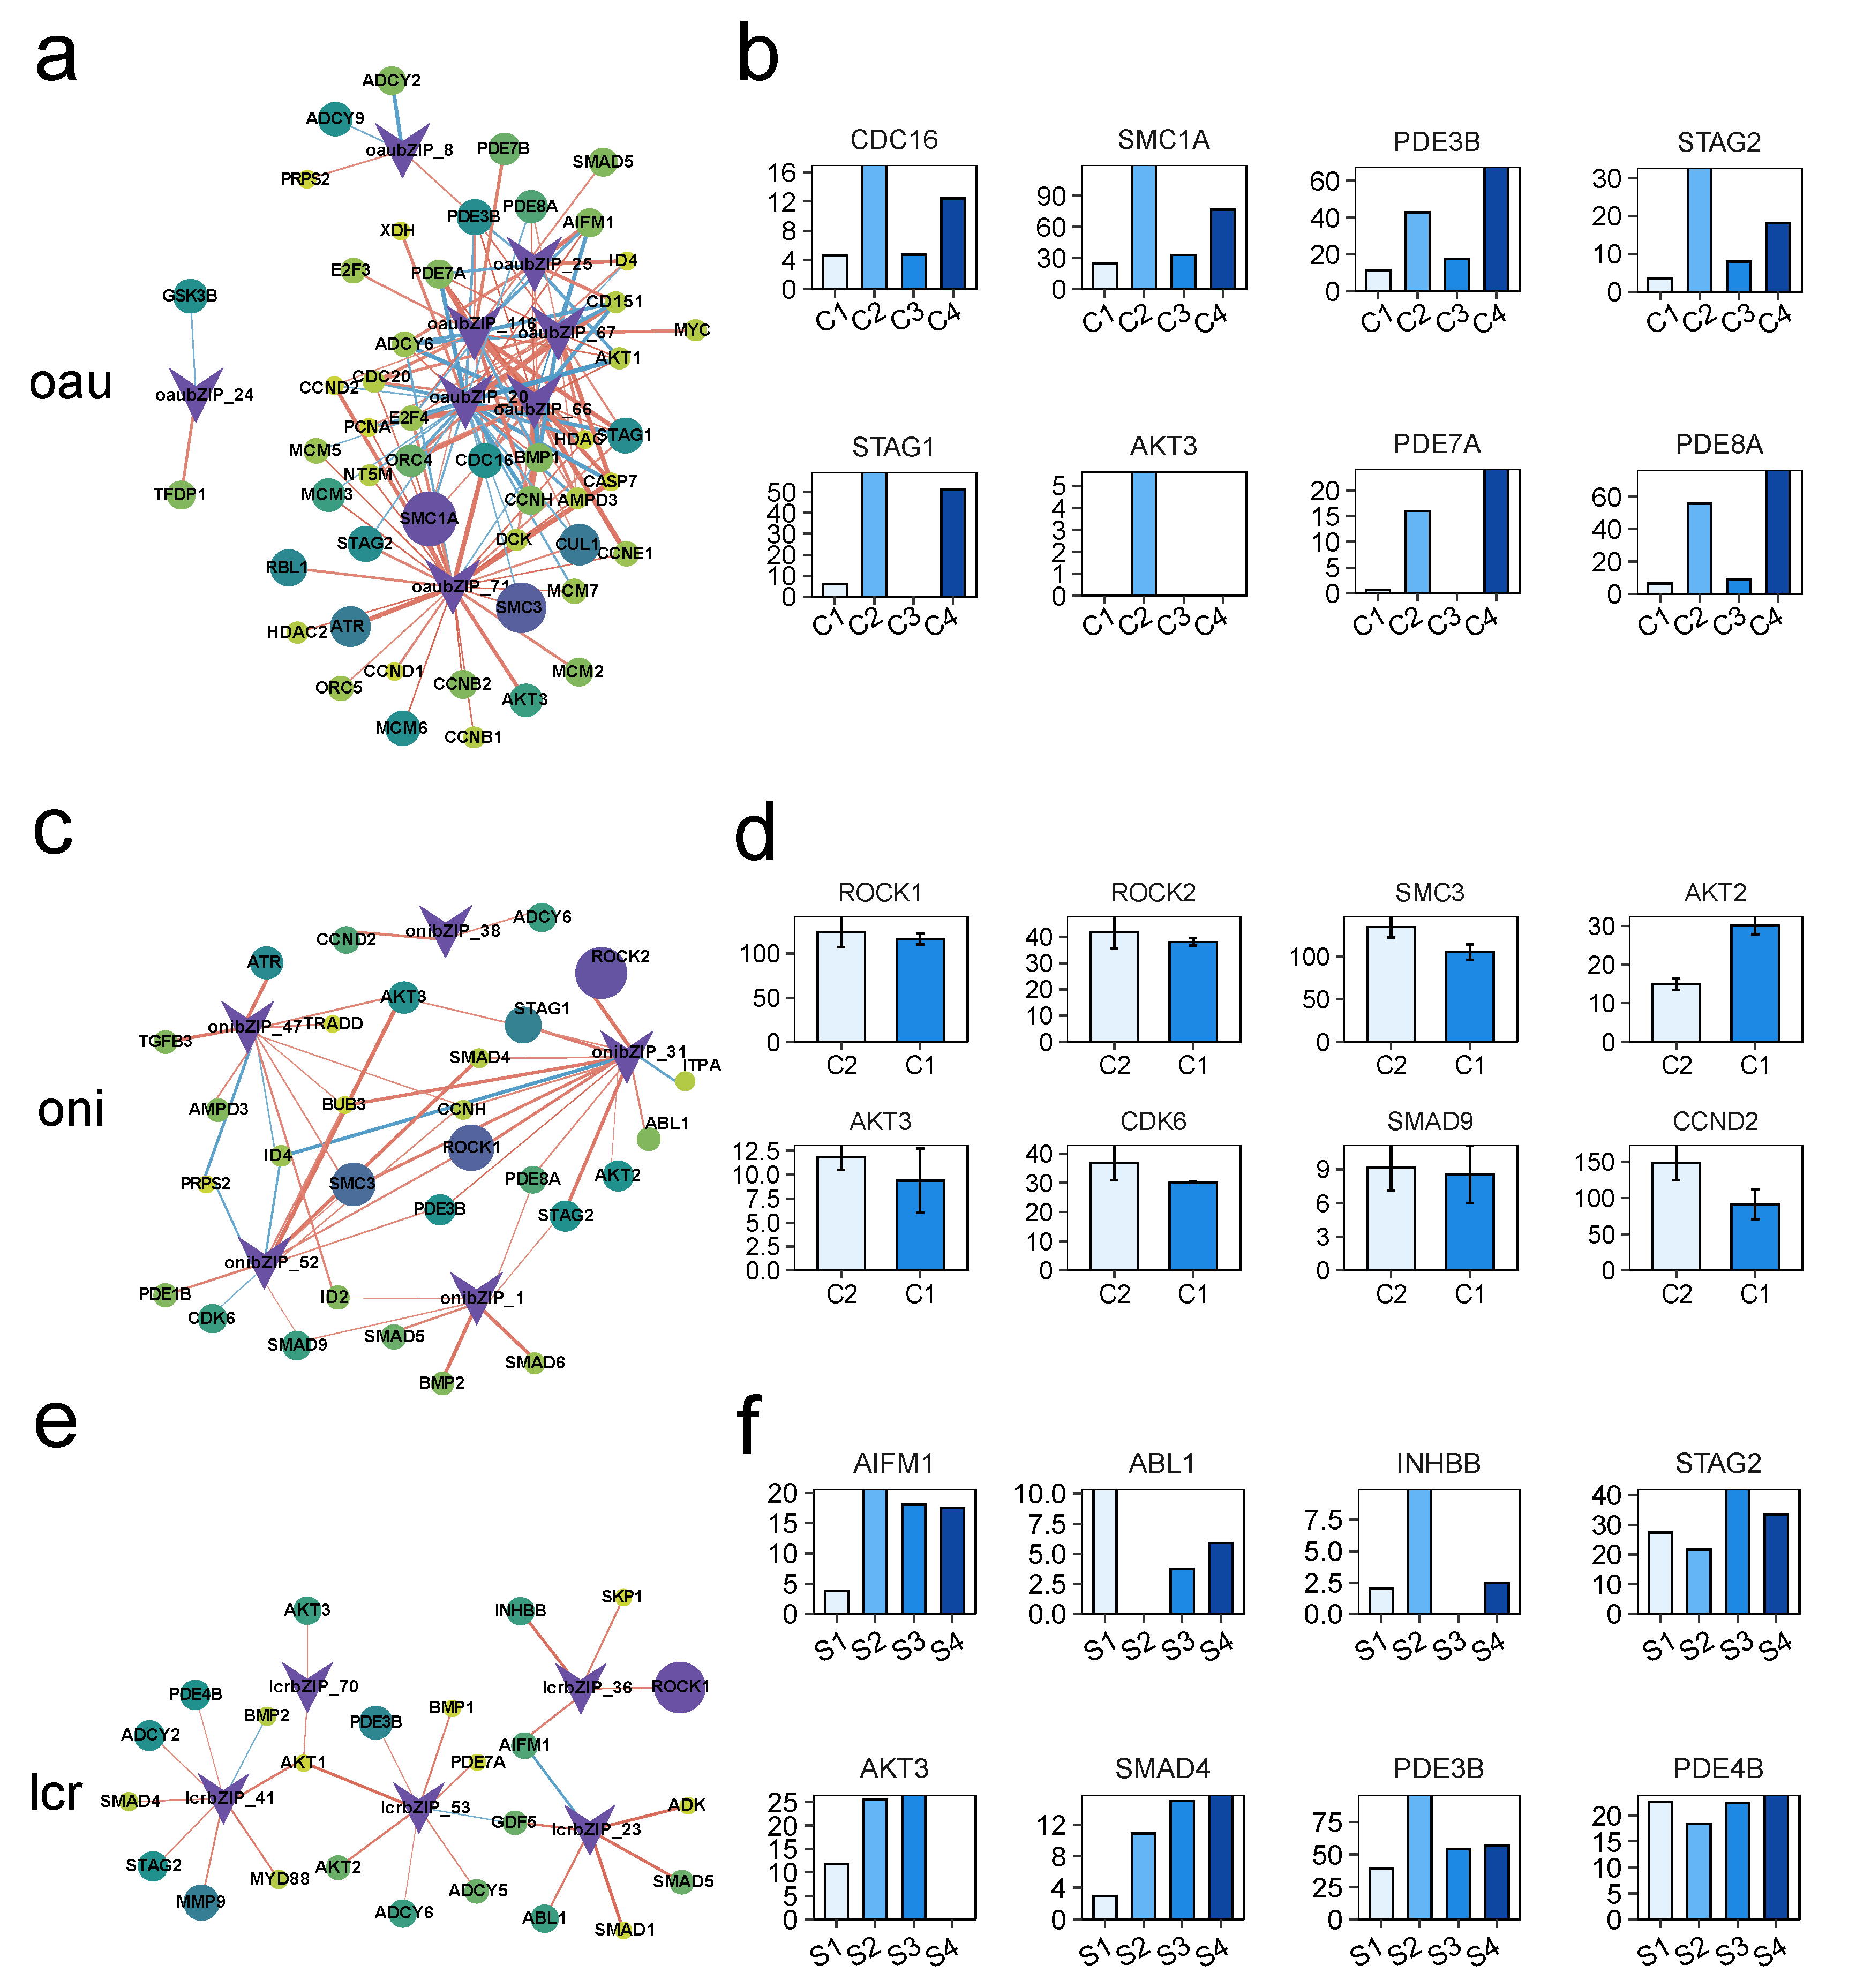
3.5. Analysis of the Regulatory Networks of the bZIP Subgroup in Other Species

To confirm whether the bZIP family plays a similar role in splenic injury in other species, we selected DEGs from the following pathways: cell adhesion molecules (CAMs), cell cycle, purine metabolism, TGF beta signaling pathway, assembly of collagen fibrils and other multimeric structures, and autophagy. A co-expression network between these DEGs and bZIP members was constructed, followed by the selection of binding sites for bZIP in these critical DEGs. Results showed that oaubZIP_66, oaubZIP_20, oaubZIP_116, oaubZIP_67, and oaubZIP_25 were key transcription factors in the splenic response of O. aureus to high salt stress (Figure 8a). CDC16, STAG1, SMC1A, AKT3, PDE3B, PDE7A, STAG2, and PDE8A were identified as the key DEGs regulated by the aforementioned transcription factors (Figure 8b). Further validation of the expression patterns of these genes found that they were upregulated in O. aureus under high salt stress, indicating that these genes could be key genes causing spleen injury. Similarly, onibZIP_38, onibZIP_47, onibZIP_52, onibZIP_1, and onibZIP_31 were found to be the key transcription factors in the splenic response of O. niloticus to high salt stress (Figure 8c). ROCK1, ROCK2, SMC3, AKT2, AKT3, CDK6, SMAD9, and CCND2 were defined as key DEGs regulated by these transcription factors (Figure 8d). Most of these genes were found to be upregulated in O. niloticus under high salt stress, suggesting these genes could be crucial to spleen injury. Lastly, lcrbZIP_41, lcrbZIP_70, lcrbZIP_53, lcrbZIP_23, and lcrbZIP_36 were key transcription factors in the splenic response of L. crocea to hypoxia (Figure 8e). AIFM1, ABL1, INHBB, STAG2, AKT3, SMAD4, PDE3B, and PDE4B were identified as key DEGs regulated by these transcription factors (Figure 8f). The majority of these genes were found to be upregulated in L. crocea under high salt stress, suggesting that these genes might be key to spleen injury (Figure 8f). In summary, these results suggest that bZIP may play a significant role in spleen injury response in different species, illustrating its functional diversity and conservation.

3.6. Relationship and Regulatory Network Analysis between the bZIP Subgroup and Splenic Immune Infiltration

The spleen is a vital immune organ in animals, and spleen injury can impact immune function, accompanied by changes in immune cell infiltration. To further analyze the relationship between bZIP and immune cell infiltration in LMB, we calculated the correlation between bZIP_XI members and the infiltration of 28 types of immune cells (Figure 9a). We found that msabZIP_115 may affect the infiltration of activated CD8 T cells, while infiltration of Type 17 T helper cells, Type 2 T helper cells, regulatory T cells, CD56dim natural killer cells, plasmacytoid dendritic cells, mast cells and other immune cells were positively correlated with the expression of most bZIP_XI genes. In contrast, amma delta T cells, activated CD4 T cells, immature dendritic cells, and other immune cell infiltrations were negatively correlated with the expression of most bZIP_XI genes. We then identified binding sites of bZIP transcription factors in these key immune cell subgroup marker genes, revealing that TBX21, SELE, RGS16, IGFBP5, CDKN3, and CCNB1 may be key genes regulated by bZIP (Figure 9b). A network was then constructed between bZIP_XI genes and these key genes, suggesting that msabZIP_116, msabZIP_115, msabZIP_49, msabZIP_118, msabZIP_38, and others could be key transcription factors involved in immune regulation (Figure 9c). Expression analysis revealed FSTL1, IGFBP5, BCL2L1, DARS, FYN, ABAT, RGS16, SELE, ZEB2, RBMS3, and NCOA4 to be upregulated in the N3 treatment for LMB, indicating that they might be key genes involved in immune regulation alongside bZIP_XI genes. In conclusion, these findings suggest that bZIP_XI may be involved in regulating the change in spleen immune cell proportions in LMB under nitrite stress.

4. Discussion

Under high levels of nitrite exposure, LMB exhibited a significant enrichment in the expression of key cellular pathways such as the ribosome, MAPK signaling pathway, apoptosis, mitophagy, and autophagy. This result indicates an intricate system of responses to nitrite toxicity. The enrichment of the ribosome pathway, which is responsible for protein synthesis, suggests an upsurge in the synthesis of new proteins. This could be a defensive response to repair the damage induced by nitrite stress by synthesizing stress-response proteins or facilitating cellular turnover [35,36]. The MAPK signaling pathway plays an instrumental role in mediating cellular responses to diverse external signals and stresses [37,38] and is associated with regulating the activity of hypoxia-inducible factors (HIF) [39]. Its upregulation under nitrite stress implies the initiation of a signaling cascade that potentially activates a set of stress-related genes to manage cellular responses to nitrite toxicity. Ossum et al. characterized the role of mitogen-activated protein kinase p44 ERK activity during hypoxia/recovery in rainbow trout (Oncorhynchus mykiss) subcutaneous fibroblasts, providing evidence of MAPK involvement in fish hypoxia adaptation [40]. Moreover, a significant rise in apoptosis may indicate that nitrite stress inflicts severe cellular damage [41,42]. Liu et al. found that exposure to bisphenol A can induce oxidative stress and induce apoptosis of common carp (Cyprinus carpio) spleen lymphocytes through the mitochondrial pathway [43]. This process of programmed cell death is a protective mechanism against dysfunctional cells, and its upregulation suggests that the body is actively working to remove cells damaged by nitrite stress [44,45]. Finally, the upregulation of mitophagy and autophagy, which are responsible for the degradation of cellular components, highlights an escalated need to eliminate damaged cellular components and recycle their constituents. This may be a direct consequence of the cellular damage inflicted by nitrite toxicity. Chen et al. reported that oxidative stress induced by atrazine (ATR) and/or chlorpyrifos (CPF) leads to autophagy disorders in the head kidney and spleen of common carp (Cyprinus carpio) [46]. A study found that RAPA treatment significantly improved the hatching and survival rates of zebrafish (Danio rerio) larvae after activating autophagy. In contrast, the combination therapy of the toxic substance TDCIPP and the autophagy inhibitor CQ can lead to the deterioration of neurodevelopmental toxicity [47]. Therefore, autophagy can serve as a protective mechanism to reduce the damage of toxic substances to fish cells. Overall, these results suggest that high nitrite concentrations may trigger an extensive, multifaceted stress response in LMB, affecting several vital cellular pathways. This intricate interplay of responses is geared towards combating the harmful effects of nitrite toxicity. These findings offer promising directions for future exploration, including the specific role of bZIP transcription factors in these pathways and in the overall nitrite stress response.
Notably, we discovered that the bZIP_XI subgroup, which includes msabZIP_49, msabZIP_12, msabZIP_39, and msabZIP_116, is characterized by highly conserved sequences and motif structures. This structural conservation underlines the potentially significant biological roles that these proteins might play within the organism. Interestingly, we found that most genes of the bZIP_XI subgroup were upregulated under severe nitrite stress conditions (as in treatment N3), suggesting a potential correlation with nitrite-induced spleen injury in LMB. Previous studies have linked the bZIP family to a variety of environmental stress responses in diverse organisms [2,48]. Considering these findings, it is plausible that the bZIP_XI subgroup in LMB, particularly msabZIP_49, msabZIP_12, msabZIP_39, and msabZIP_116, may play key roles in orchestrating responses to nitrite stress in the fish. This subgroup could potentially regulate the transcription of various stress-response and repair-related genes, helping the organism survive under adverse conditions. Therefore, the observed upregulation of these bZIP_XI genes in the N3 treatment group could be indicative of the activation of mechanisms countering nitrite-induced oxidative stress and tissue damage in the spleen. The NF-E2 p45-related factor 2NFE2 (Nrf2) belonging to the CNC-bZIP family subfamily is crucial for the development of red blood cells and platelets [49], and there is a close relationship between the Nrf2 signaling pathway and heavy metal-induced oxidative stress [50]. Studies have shown that cadmium-induced oxidative stress can lead to sustained nuclear translocation of Nrf2 in spleen cells, indicating that Nrf2 plays a core role in cell defense against oxidative stress and is closely related to cell apoptosis and autophagy [51]. There are also studies indicating that the activation of Nrf2 can protect animals from ethanol-induced damage, including fetal alcohol spectrum disorders [52,53]. These studies on the relationship between bZIP family members and cellular defense against oxidative stress suggest that they may play a certain role in protecting the spleen from damage.
The discovery of a potential correlation between the bZIP_XI subgroup members msabZIP_49, msabZIP_12, msabZIP_39, and msabZIP_116 and the upregulation of genes VCAM1, POLE3, PDE6H, CD34, FARSB, and BMP1 under severe nitrite stress (N3) in the LMB spleen provides an intriguing avenue for understanding the nitrite stress response. These genes are involved in diverse biological processes that could relate to stress responses and tissue repair mechanisms. VCAM1, a cell adhesion molecule, plays a role in leukocyte-endothelial cell adhesion, which can be crucial in inflammatory responses. Its upregulation may signal an increased inflammatory response due to nitrite stress [54]. According to reports, the immune neutralization of VCAM-1 eliminated white blood cell adhesion in the small veins of the colon, and long-term treatment with anti VCAM-1 monoclonal antibodies significantly reduced colon injury [55]. In another study, in a mouse model of lung inflammation induced by ovalbumin (OVA), the recruitment of mast cell precursors in VCAM-1 knockout mice was significantly lower than in wild-type mice [56]. POLE3, a subunit of DNA polymerase epsilon, is involved in DNA replication and repair. Its upregulation may indicate an increase in DNA damage and repair processes under nitrite stress [57]. Studies have observed the interaction between POLE3 and KU80 in CPT-induced cells; this interaction is enhanced after DNA breakage, suggesting that CHRAC complexes containing POLE3 may promote DNA repair [58]. PDE6H, involved in the phototransduction pathway [59], has weaker connections to nitrite stress. Still, its dysregulation could influence intracellular signaling, potentially affecting the overall stress response. CD34, a well-known marker of hematopoietic stem cells, might suggest an increased effort to replenish damaged blood cells from nitrite-induced oxidative stress [60]. FARSB, involved in protein synthesis, may be related to the increased demand for protein turnover under stress conditions, where damaged proteins need to be replaced [61]. Finally, BMP1 is involved in extracellular matrix organization, and its upregulation could hint at tissue remodeling after nitrite-induced injury [62]. Zhuang et al.’s study also found that BMP1 increases in damaged intestinal mucosal tissue, and overexpression of BMP1 can alleviate intestinal mucosal damage [63]. Together, these upregulated genes suggest that nitrite stress in the LMB spleen generates complex responses, including increased inflammation, DNA repair, intracellular signaling modification, hematopoietic activity, protein synthesis, and tissue remodeling. The role of the bZIP_XI subgroup, particularly msabZIP_49, msabZIP_12, msabZIP_39, and msabZIP_116, in potentially regulating these genes points to a complex transcriptional regulation mechanism. This mechanism may help the organism cope with nitrite stress. These findings provide important insights into the molecular response to nitrite stress in LMB and suggest targets for future research.
Members of the bZIP_XI subgroup in the LMB spleen, including msabZIP_116, msabZIP_115, msabZIP_49, msabZIP_118, and msabZIP_38, might regulate a series of immune-related genes. These genes exhibited upregulated expression in the N3 group under nitrite stress. They comprise the signaling proteins DARS and FYN, the anti-apoptotic protein BCL2L1, as well as FSTL1 and IGFBP5, which influence immune cell activation and inflammatory responses. We speculate that these genes may modulate the immune response and resistance of the LMB spleen to nitrite stress through the same expression changes and mitigate spleen damage by preventing further cell apoptosis. A study on Takifugu rubripes showed that nitrite stress treatment alters the expression patterns of apoptosis-related genes such as Bcl-2 and p53. Nitrite induces cell apoptosis in takifugu rubripes through mitochondrial-mediated caspase-dependent pathways and p53 Bax Bcl-2 pathways, and nitrite stress activates the antioxidant and immune defense systems to protect cells from oxidative stress and apoptosis [64]. Moreover, bZIP_XI could also influence the expression of cell adhesion molecules (like SELE) and metabolic enzymes (like ABAT), further regulating immune cell migration and cellular oxidative stress responses [65]. The expression of transcription factors ZEB2, RBMS3, and NCOA4 were also affected, which might impact immune cell development and differentiation [66,67,68]. In summary, these genes collectively constitute a complex network. Through interactions with bZIP_XI genes, they might influence the reaction of the LMB spleen to and recovery from nitrite stress.

5. Conclusions

In conclusion, this study provides novel insights into the molecular mechanisms underlying the response to nitrite toxicity in largemouth bass spleen. Through bioinformatics analysis, we identified 120 bZIP transcription factor genes in the largemouth bass genome and found the bZIP_XI subgroup to be upregulated under nitrite stress. Phylogenetic analysis revealed strong conservation of this subgroup across fish species. Further analysis suggested that bZIP_XI members, like msabZIP_49, msabZIP_12, msabZIP_39, and msabZIP_116, may act as key regulators in the spleen’s nitrite stress response by modulating the expression of genes involved in cell cycle, DNA repair, apoptosis, and immune function. The upregulation of target genes like VCAM1, POLE3, and BMP1 implies activation of inflammation, DNA repair, and tissue remodeling. Our findings also indicate potential roles for bZIP_XI in regulating immune cell infiltration and the expression of immune genes like BCL2L1 and SELE. Overall, this study elucidates a complex transcriptional network orchestrated by the bZIP family that enables the largemouth bass spleen to withstand nitrite-induced damage. It highlights the critical involvement of the bZIP_XI subgroup in regulating stress response and immune function. These findings advance our understanding of nitrite toxicity adaptation in fish and provide a foundation for further explorations into the specific mechanisms governing this intricate molecular response.

Supplementary Materials

The following supporting information can be downloaded at: https://www.mdpi.com/article/10.3390/fishes8110540/s1, Figure S1: Expression levels of all transcription factors and bZIP transcription factors (a). Heatmap of the expression levels of multi-gene families in LMB, with the bZIP family highlighted in red; (b). Heatmap of bZIP family expression levels; Figure S2: Diagram of the conserved structural domains of the bZIP family; Figure S3: Sequence logos of the conserved domains of the bZIP gene family; Table S1: Physicochemical properties of the bZIP family in largemouth bass (LMB).

Author Contributions

Z.H. and Y.S. designed the experiments and funding. Y.S., Y.H., Y.W. (Ying Wang) and C.J. conducted the animal experiments. Y.S., Y.H., Y.W. (Yanqun Wang) and G.H. worked together in statistical analysis and manuscript drafting. All authors participated in several rounds of manuscript revision. All authors have read and agreed to the published version of the manuscript.

Funding

This research was supported by the Key Laboratory of Application of Ecology and Environmental Protection in the Plateau Wetland of Sichuan in basic financial support, without receiving any specific grant from funding agencies in the public or commercial.

Institutional Review Board Statement

The animal study protocol was approved by the Experimental Animal Welfare and Ethics Committee of Asia Xichang University (protocol code xcc202022031, 10 March 2022).

Informed Consent Statement

Not applicable.

Data Availability Statement

The datasets generated and analyzed during the current study are available from the corresponding author on reasonable request. Genome and transcriptome data for Oreochromis aureus were obtained from the Sequence Read Archive (SRA) of NCBI under the BioProject accession number PRJNA631467 (https://www.ncbi.nlm.nih.gov/bioproject/PRJNA631467/) (accessed on 12 May 2023). Genome and transcriptome data for Larimichthys crocea were obtained from the Sequence Read Archive (SRA) of NCBI under the BioProject accession number PRJNA574876 (https://www.ncbi.nlm.nih.gov/bioproject/PRJNA574876) (accessed on 12 May 2023). Genome and transcriptome data for Oreochromis niloticus were obtained from the Sequence Read Archive (SRA) of NCBI under the BioProject accession number PRJNA433304 (https://www.ncbi.nlm.nih.gov/bioproject/PRJNA433304) (accessed on 12 May 2023).

Acknowledgments

The authors would like to express their sincere thanks to Xishuangbanna Hongdao Agricultural Technology Co., Ltd., which provided the site and LMB fish for the animal experiment. They would also like to thank Yunnan Pulis Biotechnology Co., Ltd. for their contribution to laboratory assays and statistical analysis.

Conflicts of Interest

The authors declare no conflict of interest.

References

  1. Xu, Y.; Wang, Y.; Zhao, H.; Wu, M.; Zhang, J.; Chen, W.; Li, G.; Yang, L. Genome-wide identification and expression analysis of the bZIP transcription factors in the Mycoparasite Coniothyrium minitans. Microorganisms 2020, 8, 1045. [Google Scholar] [CrossRef] [PubMed]
  2. Hahn, M.E.; Timme-Laragy, A.R.; Karchner, S.I.; Stegeman, J.J. Nrf2 and Nrf2-related proteins in development and developmental toxicity: Insights from studies in zebrafish (Danio rerio). Free Radic. Biol. Med. 2015, 88, 275–289. [Google Scholar] [CrossRef] [PubMed]
  3. Chen, X.; Han, K.; Zhang, T.; Qi, G.; Jiang, Z.; Hu, C. Grass carp (Ctenopharyngodon idella) NRF2 alleviates the oxidative stress and enhances cell viability through upregulating the expression of HO-1. Fish Physiol. Biochem. 2020, 46, 417–428. [Google Scholar] [CrossRef] [PubMed]
  4. van der Hoeven, R.; McCallum, K.C.; Cruz, M.R.; Garsin, D.A. Ce-Duox1/BLI-3 generated reactive oxygen species trigger protective SKN-1 activity via p38 MAPK signaling during infection in C. elegans. PLoS Pathog. 2011, 7, e1002453. [Google Scholar]
  5. McEwan, D.L.; Feinbaum, R.L.; Stroustrup, N.; Haas, W.; Conery, A.L.; Anselmo, A.; Sadreyev, R.; Ausubel, F.M. Tribbles ortholog NIPI-3 and bZIP transcription factor CEBP-1 regulate a Caenorhabditis elegans intestinal immune surveillance pathway. BMC Biol. 2016, 14, 105. [Google Scholar] [CrossRef]
  6. Dunbar, T.L.; Yan, Z.; Balla, K.M.; Smelkinson, M.G.; Troemel, E.R. C. elegans detects pathogen-induced translational inhibition to activate immune signaling. Cell Host Microbe 2012, 11, 375–386. [Google Scholar] [CrossRef]
  7. Pellegrino, M.W.; Nargund, A.M.; Kirienko, N.V.; Gillis, R.; Fiorese, C.J.; Haynes, C.M. Mitochondrial UPR-regulated innate immunity provides resistance to pathogen infection. Nature 2014, 516, 414–417. [Google Scholar] [CrossRef]
  8. Santos, I.R.; Chen, X.; Lecher, A.L.; Sawyer, A.H.; Moosdorf, N.; Rodellas, V.; Tamborski, J.; Cho, H.-M.; Dimova, N.; Sugimoto, R. Submarine groundwater discharge impacts on coastal nutrient biogeochemistry. Nat. Rev. Earth Environ. 2021, 2, 307–323. [Google Scholar]
  9. Isaza, D.F.G.; Cramp, R.L.; Franklin, C.E. Living in polluted waters: A meta-analysis of the effects of nitrate and interactions with other environmental stressors on freshwater taxa. Environ. Pollut. 2020, 261, 114091. [Google Scholar] [CrossRef]
  10. Kim, J.H.; Kang, Y.J.; Kim, K.I.; Kim, S.K.; Kim, J.H. Toxic effects of nitrogenous compounds (ammonia, nitrite, and nitrate) on acute toxicity and antioxidant responses of juvenile olive flounder, Paralichthys olivaceus. Environ. Toxicol. Pharmacol. 2019, 67, 73–78. [Google Scholar] [CrossRef]
  11. Tong, C.Y.; Honda, K.; Derek, C.J.C. A review on microalgal-bacterial co-culture: The multifaceted role of beneficial bacteria towards enhancement of microalgal metabolite production. Environ. Res. 2023, 228, 115872. [Google Scholar] [CrossRef] [PubMed]
  12. Xu, Z.; Cao, J.; Qin, X.; Qiu, W.; Mei, J.; Xie, J. Toxic effects on bioaccumulation, hematological parameters, oxidative stress, immune responses and tissue structure in fish exposed to ammonia nitrogen: A review. Animals 2021, 11, 3304. [Google Scholar] [CrossRef] [PubMed]
  13. Zhao, L.; Cui, C.; Liu, Q.; Sun, J.; He, K.; Adam, A.A.; Luo, J.; Li, Z.; Wang, Y.; Yang, S. Combined exposure to hypoxia and ammonia aggravated biological effects on glucose metabolism, oxidative stress, inflammation and apoptosis in largemouth bass (Micropterus salmoides). Aquat. Toxicol. 2020, 224, 105514. [Google Scholar] [CrossRef] [PubMed]
  14. Gao, X.Q.; Fei, F.; Huo, H.H.; Huang, B.; Meng, X.S.; Zhang, T.; Liu, B.L. Impact of nitrite exposure on plasma biochemical parameters and immune-related responses in Takifugu rubripes. Aquat. Toxicol. 2020, 218, 105362. [Google Scholar] [CrossRef] [PubMed]
  15. Singh, M.; Barman, A.S.; Devi, A.L.; Devi, A.G.; Pandey, P.K. Iron mediated hematological, oxidative and histological alterations in freshwater fish Labeo rohita. Ecotoxicol. Environ. Saf. 2019, 170, 87–97. [Google Scholar] [CrossRef]
  16. Lushchak, V.I. Environmentally induced oxidative stress in aquatic animals. Aquat. Toxicol. 2011, 101, 13–30. [Google Scholar] [CrossRef]
  17. Yang, L.; Guo, H.; Kuang, Y.; Yang, H.; Zhang, X.; Tang, R.; Li, D.; Li, L. Neurotoxicity induced by combined exposure of microcystin-LR and nitrite in male zebrafish (Danio rerio): Effects of oxidant-antioxidant system and neurotransmitter system. Comp. Biochem. Physiol. C Toxicol. Pharmacol. 2022, 253, 109248. [Google Scholar] [CrossRef]
  18. Garcia-Jaramillo, M.; Beaver, L.M.; Truong, L.; Axton, E.R.; Keller, R.M.; Prater, M.C.; Magnusson, K.R.; Tanguay, R.L.; Stevens, J.F.; Hord, N.G. Nitrate and nitrite exposure leads to mild anxiogenic-like behavior and alters brain metabolomic profile in zebrafish. PLoS ONE 2020, 15, e0240070. [Google Scholar] [CrossRef]
  19. Parvathy, A.J.; Das, B.C.; Jifiriya, M.J.; Varghese, T.; Pillai, D.; Rejish Kumar, V.J. Ammonia induced toxico-physiological responses in fish and management interventions. Rev. Aquac. 2023, 15, 452–479. [Google Scholar]
  20. Secombes, C.J.; Wang, T. 1—The innate and adaptive immune system of fish. In Infectious Disease in Aquaculture; Austin, B., Ed.; Woodhead Publishing: Sawston, UK, 2012; pp. 3–68. [Google Scholar]
  21. Bjørgen, H.; Koppang, E.O. Anatomy of Teleost Fish Immune Structures and Organs. In Principles of Fish Immunology: From Cells and Molecules to Host Protection; Buchmann, K., Secombes, C.J., Eds.; Springer International Publishing: Cham, Switzerland, 2022. [Google Scholar]
  22. Zhou, K.; Huang, Y.; Chen, Z.; Du, X.; Qin, J.; Wen, L.; Ma, H.; Pan, X.; Lin, Y. Liver and spleen transcriptome reveals that Oreochromis aureus under long-term salinity stress may cause excessive energy consumption and immune response. Fish Shellfish Immunol. 2020, 107, 469–479. [Google Scholar]
  23. Xu, C.; Li, E.; Suo, Y.; Su, Y.; Lu, M.; Zhao, Q.; Qin, J.G.; Chen, L. Histological and transcriptomic responses of two immune organs, the spleen and head kidney, in Nile tilapia (Oreochromis niloticus) to long-term hypersaline stress. Fish Shellfish Immunol. 2018, 76, 48–57. [Google Scholar] [CrossRef] [PubMed]
  24. Mu, Y.; Li, W.; Wu, B.; Chen, J.; Chen, X. Transcriptome analysis reveals new insights into immune response to hypoxia challenge of large yellow croaker (Larimichthys crocea). Fish Shellfish Immunol. 2020, 98, 738–747. [Google Scholar] [PubMed]
  25. Zhang, Y.; Park, C.; Bennett, C.; Thornton, M.; Kim, D. Rapid and accurate alignment of nucleotide conversion sequencing reads with HISAT-3N. Genome Res. 2021, 31, 1290–1295. [Google Scholar] [CrossRef] [PubMed]
  26. Shumate, A.; Wong, B.; Pertea, G.; Pertea, M. Improved transcriptome assembly using a hybrid of long and short reads with StringTie. PLoS Comput. Biol. 2022, 18, e1009730. [Google Scholar] [CrossRef] [PubMed]
  27. Love, M.; Ahlmann-Eltze, C.; Forbes, K.; Anders, S.; Huber, W. DESeq2: Differential gene expression analysis based on the negative binomial distribution. In Bioconductor Version: Release (312); Love, Heidelberg, Germany, 2021. Available online: https://github.com/mikelove/DESeq2 (accessed on 6 June 2023).
  28. Wu, T.; Hu, E.; Xu, S.; Chen, M.; Guo, P.; Dai, Z.; Feng, T.; Zhou, L.; Tang, W.; Zhan, L.; et al. clusterProfiler 4.0: A universal enrichment tool for interpreting omics data. Innovation 2021, 2, 100141. [Google Scholar] [CrossRef]
  29. Morgan, M.; Falcon, S.; Gentleman, R. GSEABase: Gene Set Enrichment Data Structures and Methods; R package version 1.58.0; 2023. Available online: https://bioconductor.org/packages/release/bioc/html/GSEABase.html (accessed on 8 June 2023).
  30. Sonja, H.; Castelo, R.; Guinney, J. GSVA: The Gene Set Variation Analysis Package for Microarray and RNA-Seq Data. 2014; pp. 1–20. Available online: Bioconductor.org (accessed on 8 June 2023).
  31. Szklarczyk, D.; Gable, A.L.; Nastou, K.C.; Lyon, D.; Kirsch, R.; Pyysalo, S.; Doncheva, N.T.; Legeay, M.; Fang, T.; Bork, P. The STRING database in 2021: Customizable protein–protein networks, and functional characterization of user-uploaded gene/measurement sets. Nucleic Acids Res. 2021, 49, D605–D612. [Google Scholar] [CrossRef]
  32. Shen, W.-K.; Chen, S.-Y.; Gan, Z.-Q.; Zhang, Y.-Z.; Yue, T.; Chen, M.-M.; Xue, Y.; Hu, H.; Guo, A.-Y. AnimalTFDB 4.0: A comprehensive animal transcription factor database updated with variation and expression annotations. Nucle Acids Res. 2022, 51, D39–D45. [Google Scholar] [CrossRef]
  33. Nguyen, L.T.; Schmidt, H.A.; von Haeseler, A.; Minh, B.Q. IQ-TREE: A fast and effective stochastic algorithm for estimating maximum-likelihood phylogenies. Mol. Biol. Evol. 2015, 32, 268–274. [Google Scholar] [CrossRef]
  34. Smoot, M.E.; Ono, K.; Ruscheinski, J.; Wang, P.L.; Ideker, T. Cytoscape 2.8: New features for data integration and network visualization. Bioinformatics 2011, 27, 431–432. [Google Scholar] [CrossRef]
  35. Evans, T.G.; Kultz, D. The cellular stress response in fish exposed to salinity fluctuations. J. Exp. Zool. A Ecol. Integr. Physiol. 2020, 333, 421–435. [Google Scholar] [CrossRef]
  36. Shcherbik, N.; Pestov, D.G. The impact of oxidative stress on ribosomes: From injury to regulation. Cells 2019, 8, 1379. [Google Scholar] [CrossRef] [PubMed]
  37. Liu, X.; Zhang, C.-S.; Lu, C.; Lin, S.-C.; Wu, J.-W.; Wang, Z.-X. A conserved motif in JNK/p38-specific MAPK phosphatases as a determinant for JNK1 recognition and inactivation. Nat. Commun. 2016, 7, 10879. [Google Scholar] [CrossRef] [PubMed]
  38. Yue, J.; Lopez, J.M. Understanding MAPK signaling pathways in apoptosis. Int. J. Mol. Sci. 2020, 21, 2346. [Google Scholar] [CrossRef] [PubMed]
  39. Bracken, C.; Whitelaw, M.; Peet, D. The hypoxia-inducible factors: Key transcriptional regulators of hypoxic responses. Cell Mol. Life Sci. 2003, 60, 1376–1393. [Google Scholar] [CrossRef] [PubMed]
  40. Ossum, C.G.; Wulff, T.; Hoffmann, E.K. Regulation of the mitogen-activated protein kinase p44 ERK activity during anoxia/recovery in rainbow trout hypodermal fibroblasts. J. Exp. Biol. 2006, 209, 1765–1776. [Google Scholar] [CrossRef]
  41. Liu, F.; Li, X.; Bello, B.K.; Zhang, T.; Yang, H.; Wang, K.; Dong, J. Difenoconazole causes spleen tissue damage and immune dysfunction of carp through oxidative stress and apoptosis. Ecotoxicol. Environ. Saf. 2022, 237, 113563. [Google Scholar] [CrossRef]
  42. El-Houseiny, W.; Mansour, M.F.; Mohamed, W.A.; Al-Gabri, N.A.; El-Sayed, A.A.; Altohamy, D.E.; Ibrahim, R.E. Silver nanoparticles mitigate Aeromonas hydrophila-induced immune suppression, oxidative stress, and apoptotic and genotoxic effects in Oreochromis niloticus. Aquaculture 2021, 535, 736430. [Google Scholar] [CrossRef]
  43. Liu, Q.; Wang, W.; Zhang, Y.; Cui, Y.; Xu, S.; Li, S. Bisphenol A regulates cytochrome P450 1B1 through miR-27b-3p and induces carp lymphocyte oxidative stress leading to apoptosis. Fish Shellfish Immunol. 2020, 102, 489–498. [Google Scholar] [CrossRef]
  44. Green, D.R.; Levine, B. To be or not to be? How selective autophagy and cell death govern cell fate. Cell 2014, 157, 65–75. [Google Scholar] [CrossRef]
  45. Dikic, I.; Johansen, T.; Kirkin, V. Selective autophagy in cancer development and therapy. Cancer Res. 2010, 70, 3431–3434. [Google Scholar] [CrossRef]
  46. Chen, D.; Zhang, Z.; Yao, H.; Liang, Y.; Xing, H.; Xu, S. Effects of atrazine and chlorpyrifos on oxidative stress-induced autophagy in the immune organs of common carp (Cyprinus carpio L.). Fish Shellfish Immunol. 2015, 44, 12–20. [Google Scholar] [CrossRef]
  47. Li, R.; Zhang, L.; Shi, Q.; Guo, Y.; Zhang, W.; Zhou, B. A protective role of autophagy in TDCIPP-induced developmental neurotoxicity in zebrafish larvae. Aquat. Toxicol. 2018, 199, 46–54. [Google Scholar] [CrossRef] [PubMed]
  48. Wang, M.; Zhu, Z. Nrf2 is involved in osmoregulation, antioxidation and immunopotentiation in Coilia nasus under salinity stress. Biotechnol. Biotechnol. Equip. 2019, 33, 1453–1463. [Google Scholar] [CrossRef]
  49. Moi, P.; Chan, K.; Asunis, I.; Cao, A.; Kan, Y.W. Isolation of NF-E2-related factor 2 (Nrf2), a NF-E2-like basic leucine zipper transcriptional activator that binds to the tandem NF-E2/AP1 repeat of the beta-globin locus control region. Proc. Natl. Acad. Sci. USA 1994, 91, 9926–9930. [Google Scholar] [CrossRef] [PubMed]
  50. Almeer, R.S.; Alarifi, S.; Alkahtani, S.; Ibrahim, S.R.; Ali, D.; Moneim, A. The potential hepatoprotective effect of royal jelly against cadmium chloride-induced hepatotoxicity in mice is mediated by suppression of oxidative stress and upregulation of Nrf2 expression. Biomed. Pharmacother. 2018, 106, 1490–1498. [Google Scholar] [CrossRef] [PubMed]
  51. Qu, K.-C.; Wang, Z.-Y.; Tang, K.-K.; Zhu, Y.-S.; Fan, R.-F. Trehalose suppresses cadmium-activated Nrf2 signaling pathway to protect against spleen injury. Ecotoxicol. Environ. Saf. 2019, 181, 224–230. [Google Scholar] [CrossRef]
  52. Dong, J.; Sulik, K.K.; Chen, S.Y. Nrf2-mediated transcriptional induction of antioxidant response in mouse embryos exposed to ethanol in vivo: Implications for the prevention of fetal alcohol spectrum disorders. Antioxid. Redox Signal. 2008, 10, 2023–2033. [Google Scholar] [CrossRef]
  53. Kumar, A.; Singh, C.K.; LaVoie, H.A.; DiPette, D.J.; Singh, U.S. Resveratrol restores Nrf2 level and prevents ethanol-induced toxic effects in the cerebellum of a rodent model of fetal alcohol spectrum disorders. Mol. Pharmacol. 2011, 80, 446–457. [Google Scholar] [CrossRef]
  54. Singh, V.; Kaur, R.; Kumari, P.; Pasricha, C.; Singh, R. ICAM-1 and VCAM-1: Gatekeepers in various inflammatory and cardiovascular disorders. Clin. Chim. Acta 2023, 548, 117487. [Google Scholar] [CrossRef]
  55. Sans, M.; Panés, J.; Ardite, E.; Elizalde, J.I.; Arce, Y.; Elena, M.; Palacín, A.; Fernández–Checa, J.C.; Anderson, D.C.; Lobb, R. VCAM-1 and ICAM-1 mediate leukocyte-endothelial cell adhesion in rat experimental colitis. Gastroenterology 1999, 116, 874–883. [Google Scholar] [CrossRef]
  56. Abonia, J.P.; Hallgren, J.; Jones, T.; Shi, T.; Xu, Y.; Koni, P.; Flavell, R.A.; Boyce, J.A.; Austen, K.F.; Gurish, M.F. Alpha-4 integrins and VCAM-1, but not MAdCAM-1, are essential for recruitment of mast cell progenitors to the inflamed lung. Blood 2006, 108, 1588–1594. [Google Scholar] [CrossRef] [PubMed]
  57. Yamaguchi, M.; Cotterill, S. Association of mutations in replicative DNA polymerase genes with human disease: Possible application of Drosophila models for studies. Int. J. Mol. Sci. 2023, 24, 8078. [Google Scholar] [CrossRef]
  58. Mao, X.; Wu, J.; Zhang, Q.; Zhang, S.; Chen, X.; Liu, X.; Wei, M.; Wan, X.; Qiu, L.; Zeng, M. Requirement of WDR70 for POLE3-mediated DNA double-strand breaks repair. Sci. Adv. 2023, 9, eadh2358. [Google Scholar] [CrossRef] [PubMed]
  59. Wei, S.; Qiu, L.; Ru, S.; Yang, Y.; Wang, J.; Zhang, X. Bisphenol S disrupts opsins gene expression and impairs the light-sensing function via antagonizing TH-TRbeta signaling pathway in zebrafish larvae. Food Chem. Toxicol. 2023, 172, 113588. [Google Scholar] [CrossRef] [PubMed]
  60. Rodrigues, C.R.; Moga, S.; Singh, B.; Aulakh, G.K. CD34 Protein: Its expression and function in inflammation. Cell Tissue Res. 2023, 393, 443–454. [Google Scholar] [CrossRef] [PubMed]
  61. Krenke, K.; Szczaluba, K.; Bielecka, T.; Rydzanicz, M.; Lange, J.; Koppolu, A.; Ploski, R. FARSA mutations mimic phenylalanyl-tRNA synthetase deficiency caused by FARSB defects. Clin. Genet. 2019, 96, 468–472. [Google Scholar] [CrossRef]
  62. Anastasi, C.; Rousselle, P.; Talantikite, M.; Tessier, A.; Cluzel, C.; Bachmann, A.; Mariano, N.; Dussoyer, M.; Alcaraz, L.B.; Fortin, L. BMP-1 disrupts cell adhesion and enhances TGF-β activation through cleavage of the matricellular protein thrombospondin-1. Sci. Signal 2020, 13, eaba3880. [Google Scholar] [CrossRef]
  63. Zhuang, M.; Deng, Y.; Zhang, W.; Zhu, B.; Yan, H.; Lou, J.; Zhang, P.; Cui, Q.; Tang, H.; Sun, H. LncRNA Bmp1 promotes the healing of intestinal mucosal lesions via the miR-128-3p/PHF6/PI3K/AKT pathway. Cell Death Dis. 2021, 12, 595. [Google Scholar] [CrossRef]
  64. Gao, X.-Q.; Fei, F.; Huo, H.H.; Huang, B.; Meng, X.S.; Zhang, T.; Liu, B.-L. Effect of acute exposure to nitrite on physiological parameters, oxidative stress, and apoptosis in Takifugu rubripes. Ecotoxicol. Environ. Saf. 2020, 188, 109878. [Google Scholar] [CrossRef]
  65. Wang, X.; Li, Z.; Yu, H.; Dong, A. The oncogenic role of γ-aminobutyrate aminotransferase in human tumor: A pan-cancer analysis. Chemotherapy 2022, 11, 1–11. [Google Scholar] [CrossRef]
  66. Dominguez, C.X.; Amezquita, R.A.; Guan, T.; Marshall, H.D.; Joshi, N.S.; Kleinstein, S.H.; Kaech, S.M. The transcription factors ZEB2 and T-bet cooperate to program cytotoxic T cell terminal differentiation in response to LCMV viral infection. J. Exp. Med. 2015, 212, 2041–2056. [Google Scholar] [CrossRef] [PubMed]
  67. Jayasena, C.S.; Bronner, M.E. Rbms3 functions in craniofacial development by posttranscriptionally modulating TGF-beta signaling. J. Cell Biol. 2012, 199, 453–466. [Google Scholar] [CrossRef] [PubMed]
  68. Gao, X.; Lee, H.Y.; Li, W.; Platt, R.J.; Barrasa, M.I.; Ma, Q.; Elmes, R.R.; Rosenfeld, M.G.; Lodish, H.F. Thyroid hormone receptor beta and NCOA4 regulate terminal erythrocyte differentiation. Proc. Natl. Acad. Sci. USA 2017, 114, 10107–10112. [Google Scholar] [CrossRef] [PubMed]
Figure 1. Amino acid sequence logos of the conserved domains of the bZIP gene family.
Fishes 08 00540 g001
Figure 2. Phylogenetic tree of the bZIP family gene in largemouth bass.
Fishes 08 00540 g002
Figure 3. Changes in the spleen tissue structure and expression changes of the bZIP gene family when largemouth bass is under nitrite stress. (a). Histological images of largemouth bass spleens under different nitrite treatments. (b). Heatmap of bZIP subgroup XI expression levels in largemouth bass under different treatments. (c). PPI interaction network diagram among largemouth bass bzip family genes. (d). Bar chart of KEGG pathway enrichment results in the network above.
Fishes 08 00540 g003
Figure 4. Interspecies Bzip phylogenetic tree and Bzip_XI phylogenetic tree. (a). Bzip phylogenetic tree of 10 fish species, with Subgroup XI highlighted in red. Species abbreviations: msa: Micropterus salmoides; oau: Oreochromis aureus; oni: Oreochromis niloticus; lcr: Larimichthys crocea; lca: Lates calcarifer; cca: Cyprinus carpio: tru: Takifugu rubripes; cse: Cynoglossus semilaevis; dre: Danio rerio; gac: Gasterosteus aculeatus. (b). Phylogenetic tree of Bzip Subgroup XI among 10 fish species. Subgroup XI is highlighted in red.
Fishes 08 00540 g004
Figure 5. Analysis of the Bzip_XI subgroup in largemouth bass and other species. Species abbreviations: msa: Micropterus salmoides; oau: Oreochromis aureus; oni: Oreochromis niloticus; lcr: Larimichthys crocea; lca: Lates calcarifer; cca: Cyprinus carpio: tru: Takifugu rubripes; cse: Cynoglossus semilaevis; dre: Danio rerio; gac: Gasterosteus aculeatus. (a). Diagram of conserved structural domains of largemouth bass Bzip subgroup XI. (b). A multi-sequence alignment diagram of the subgroup of bzip in 10 fish species. The sequence logo below the multiple sequence alignment diagram is a graphical display of a multiple sequence alignment consisting of color-coded stacks of letters representing amino acids at successive positions. The total height of a logo position depends on the degree of conservation in the corresponding multiple sequence alignment column. The height of each letter in a logo position is proportional to the observed frequency of the corresponding amino acid in the alignment column. (c). Bar chart of gene expression levels in the subgroup of largemouth bass in (b) for treatments N1 to N4. * and ** represent p < 0.05, p < 0.01, respectively. (d). Bar chart of gene expression levels in the subgroup of O. niloticus (oni) in (b) for treatments C1 and C2. The horizontal coordinates C1 and C2 represent two salt concentration treatment groups: 0‰ and 16‰, respectively. The sampling site is the spleen. (e). Bar chart of gene expression levels in the subgroup of L. crocea (lcr) in (b) for treatments S1 to S4. The horizontal coordinates S1–S4 represent the four sampling stages of the spleen after the hypoxic exposure experiment by bubbling nitrogen gas: 0, 6, 24, and 48 h, respectively. (f). GO pathway diagram enriched by largemouth bass Subgroup XI (results for other species were highly similar and therefore not shown).
Fishes 08 00540 g005
Figure 6. Bar chart of Single-Sample Gene Set Enrichment Analysis (ssGSEA) pathway scores for four species with transcriptome data, where the second column pathway is the Reactome pathway and the remaining pathways are the KEGG metabolic pathway. Species abbreviations: msa: Micropterus salmoides; oau: Oreochromis aureus; oni: Oreochromis niloticus; lcr: Larimichthys crocea. The horizontal coordinates C1–C4 in the second row of figures represent four salt concentration treatment groups: 0, 3, 7, and 11 ppt, respectively. The horizontal coordinates C1 and C2 in the third row of figures represent two salt concentration treatment groups: 0‰ and 16‰, respectively. The sampling site is the spleen. The horizontal coordinates S1–S4 in the fourth row of figures represent the four sampling stages of the spleen after a hypoxic exposure experiment by bubbling nitrogen gas: 0, 6, 24, and 48 h, respectively.
Fishes 08 00540 g006
Figure 7. Interaction analysis of bZIP_XI genes and other genes in largemouth bass. (a). Network diagram of the correlation between largemouth bass bZIP Subgroup XI and genes in five key pathways; only genes with |corr| > 0.7 are shown. The size and color intensity of the nodes represent the number of gene binding sites, and the thickness and color depth of the lines represent the strength of the correlation. Blue indicates a negative correlation, and red indicates a positive correlation. (b). Gene structure diagram of the upstream region of the key genes in largemouth bass (genes in the five key pathways, with |corr| > 0.7, and bZIP Subgroup genes binding sites ≥ 3). (c). Base sequence diagram of the binding sites of the key genes in largemouth bass. (d). Heatmap of the expression levels of the key genes in largemouth bass. (e). The interaction network between bZIP_XI and key genes.
Fishes 08 00540 g007
Figure 8. bZIP binding sites and expression levels in largemouth bass. Species abbreviations: msa: Micropterus salmoides; oau: Oreochromis aureus; oni: Oreochromis niloticus; lcr: Larimichthys crocea. (a,c,e): Network diagrams of the correlation between the bZIP Subgroup XI and genes in five key pathways in four species (msa, oni, oau, lcr) with transcriptome data. Only genes with |corr| > 0.7 and ≥3 binding sites are shown. The size and color depth of the nodes represent the number of gene binding sites, and the thickness and color depth of the lines represent the strength of the correlation. Blue indicates a negative correlation, and red indicates a positive correlation. (b,d,f): Bar charts of expression levels of key genes in four species (msa, oni, oau, lcr) with transcriptome data.
Fishes 08 00540 g008
Figure 9. Analysing the interaction of bZIP_XI genes and immune-related genes in largemouth bass. (a). Heat map of the correlation between LMB bZIP Subgroup XI and immune cell infiltration scores, where red indicates positive correlation and blue indicates negative correlation. The size of the circle represents the strength of the correlation. (b). A base sequence diagram of the binding sites of some immune-related key genes in LMB. Genes with nmotif ≥ 3, |corr| ≥ 0.7 are shown. (c). Network diagram of the correlation between LMB bZIP Subgroup XI and immune-related key genes. Genes with |corr| > 0.7 and ≥2 binding sites are shown. The size and color depth of the nodes represent the number of gene binding sites, and the thickness and color depth of the lines represent the strength of the correlation. Blue indicates a negative correlation, and red indicates a positive correlation. (d). Heat map of the expression levels of immune-related key genes in LMB. Genes with |corr| > 0.7 and ≥2 binding sites are shown.
Fishes 08 00540 g009
Disclaimer/Publisher’s Note: The statements, opinions and data contained in all publications are solely those of the individual author(s) and contributor(s) and not of MDPI and/or the editor(s). MDPI and/or the editor(s) disclaim responsibility for any injury to people or property resulting from any ideas, methods, instructions or products referred to in the content.

