
Dietary Habits of Hardhead (Ariopsis felis) and Gafftopsail (Bagre marinus) Catfish Revealed through DNA Barcoding of Stomach Contents

 , and
, and
Abstract
:1. Introduction
2. Materials and Methods
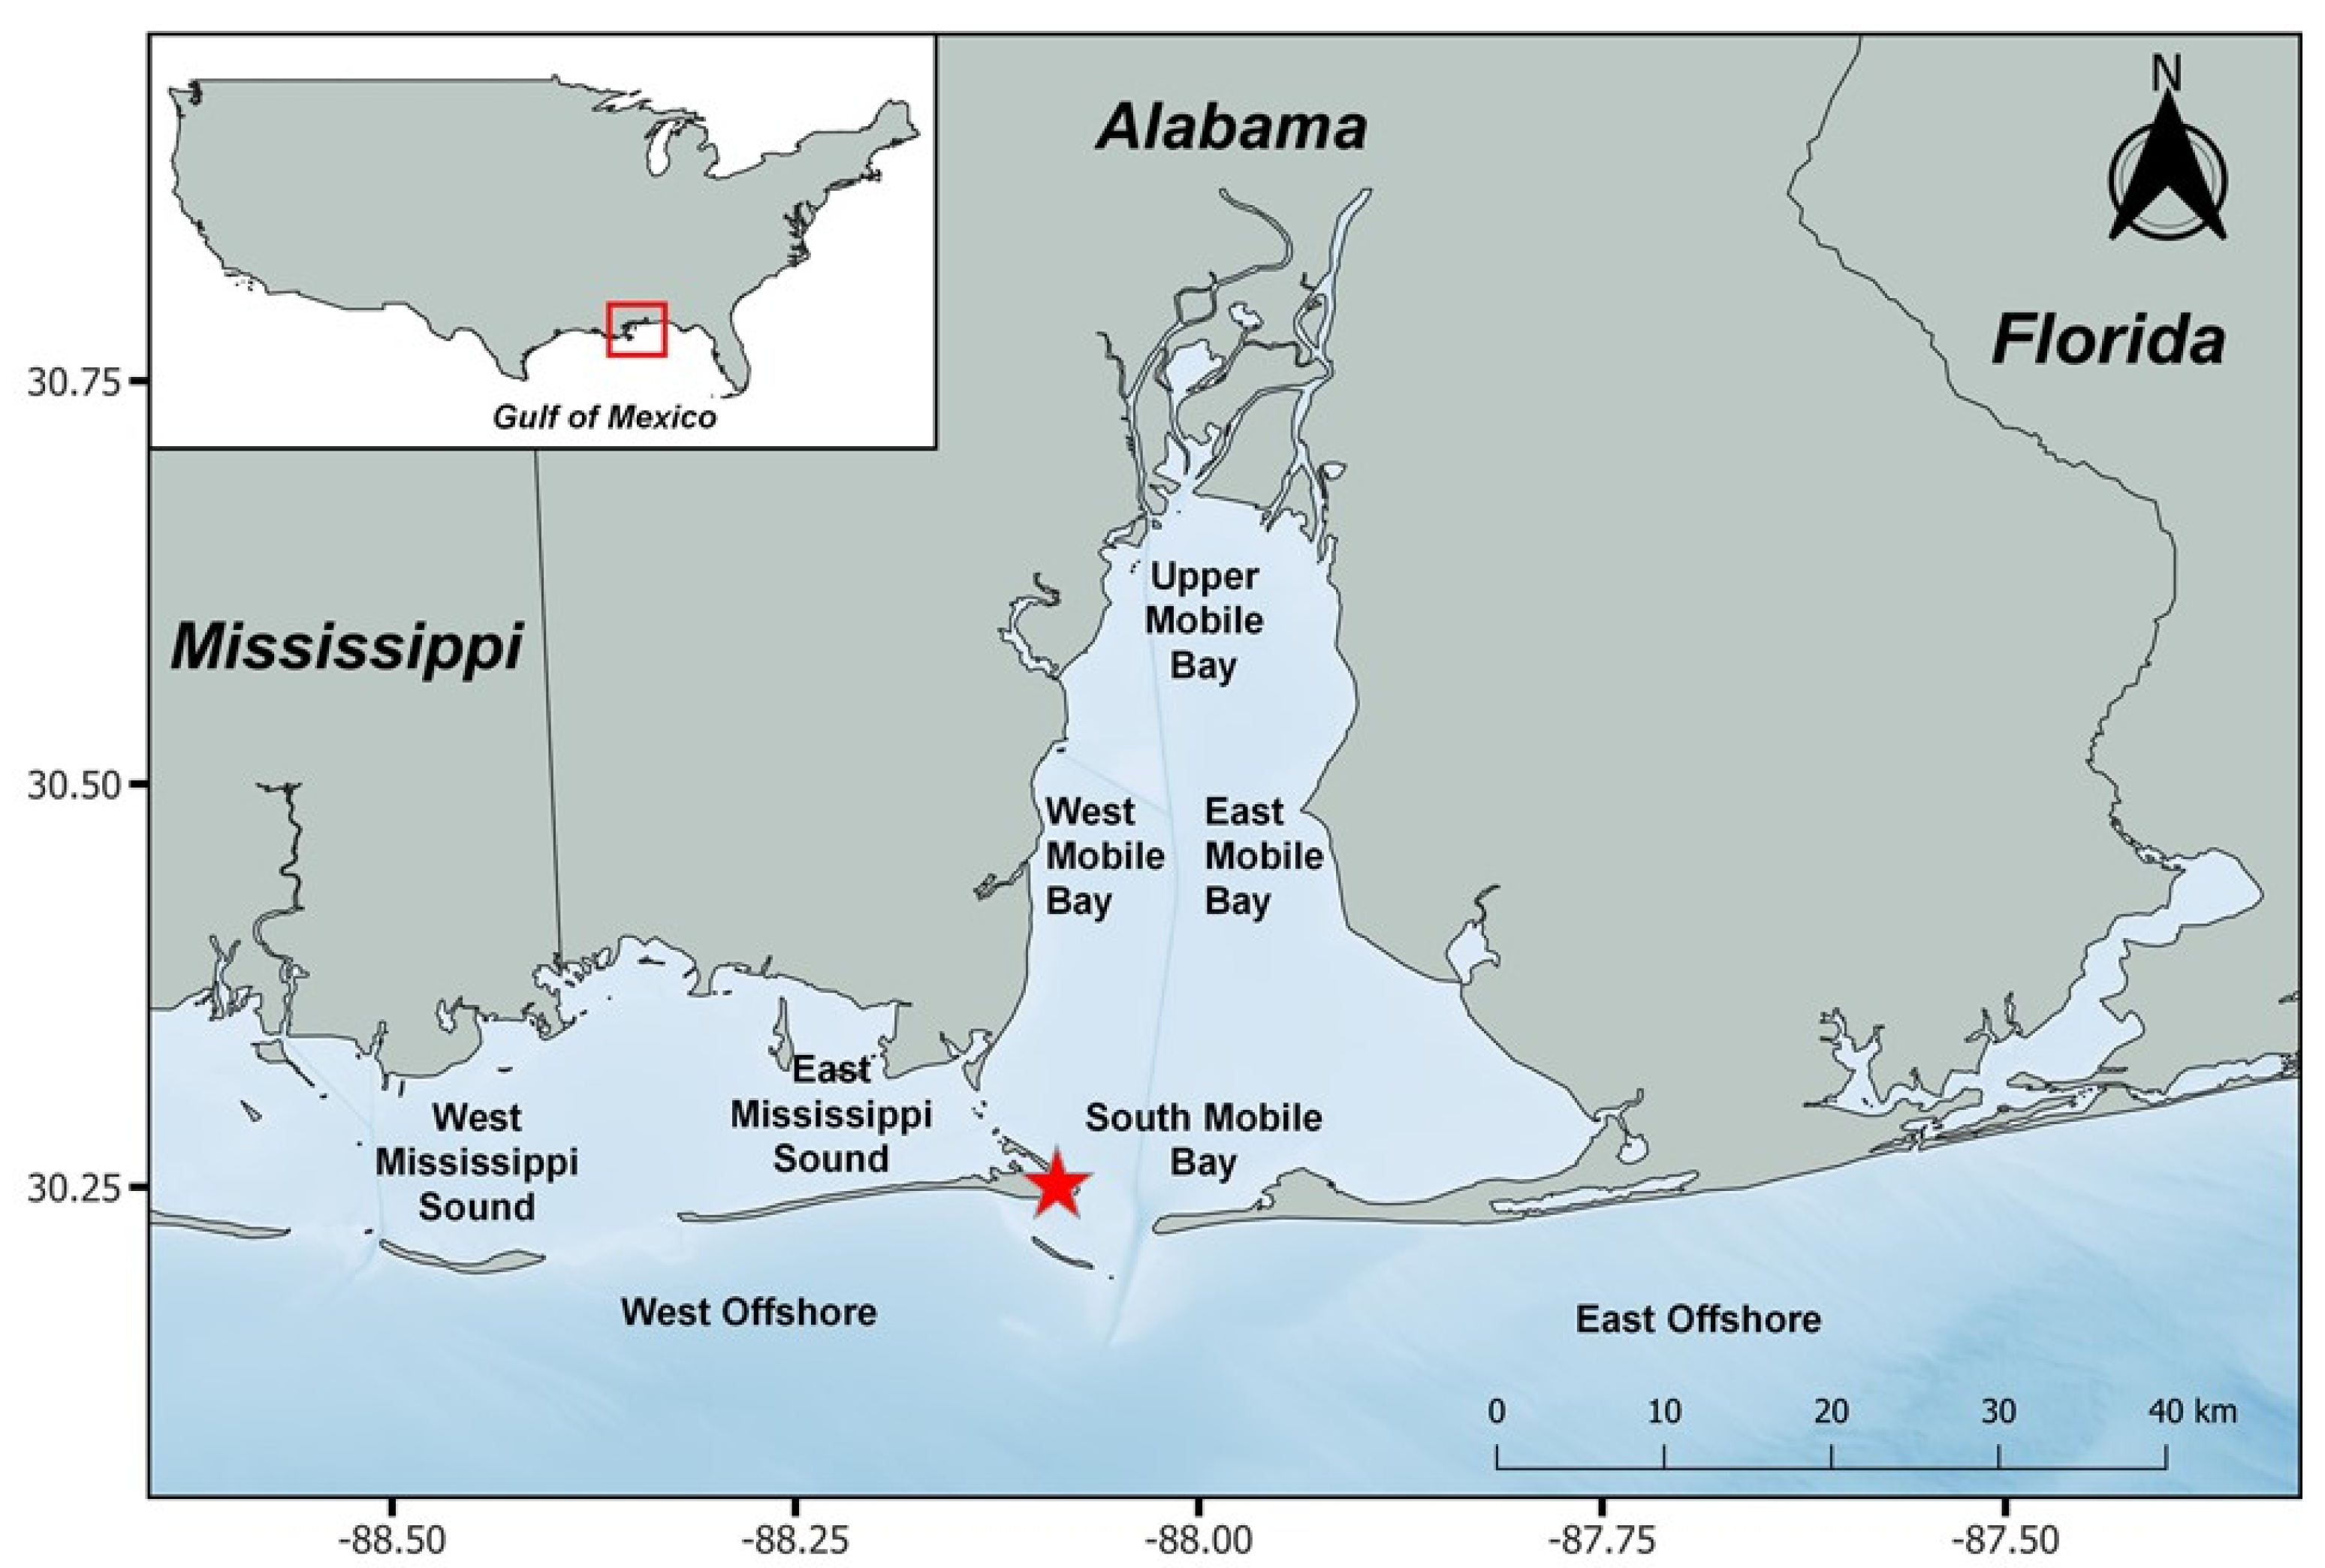
2.1. Fish Sampling
2.2. Biometrics
2.3. Morphological Examination of Prey
2.4. Molecular Identification of Prey
2.4.1. Blocking Primer Design
2.4.2. Library Preparation
2.4.3. Bioinformatics and Operational Taxonomic Unit Assignment
2.4.4. Analysis of Read Counts and Prey Assignment
2.5. Diet Quantitative Variables
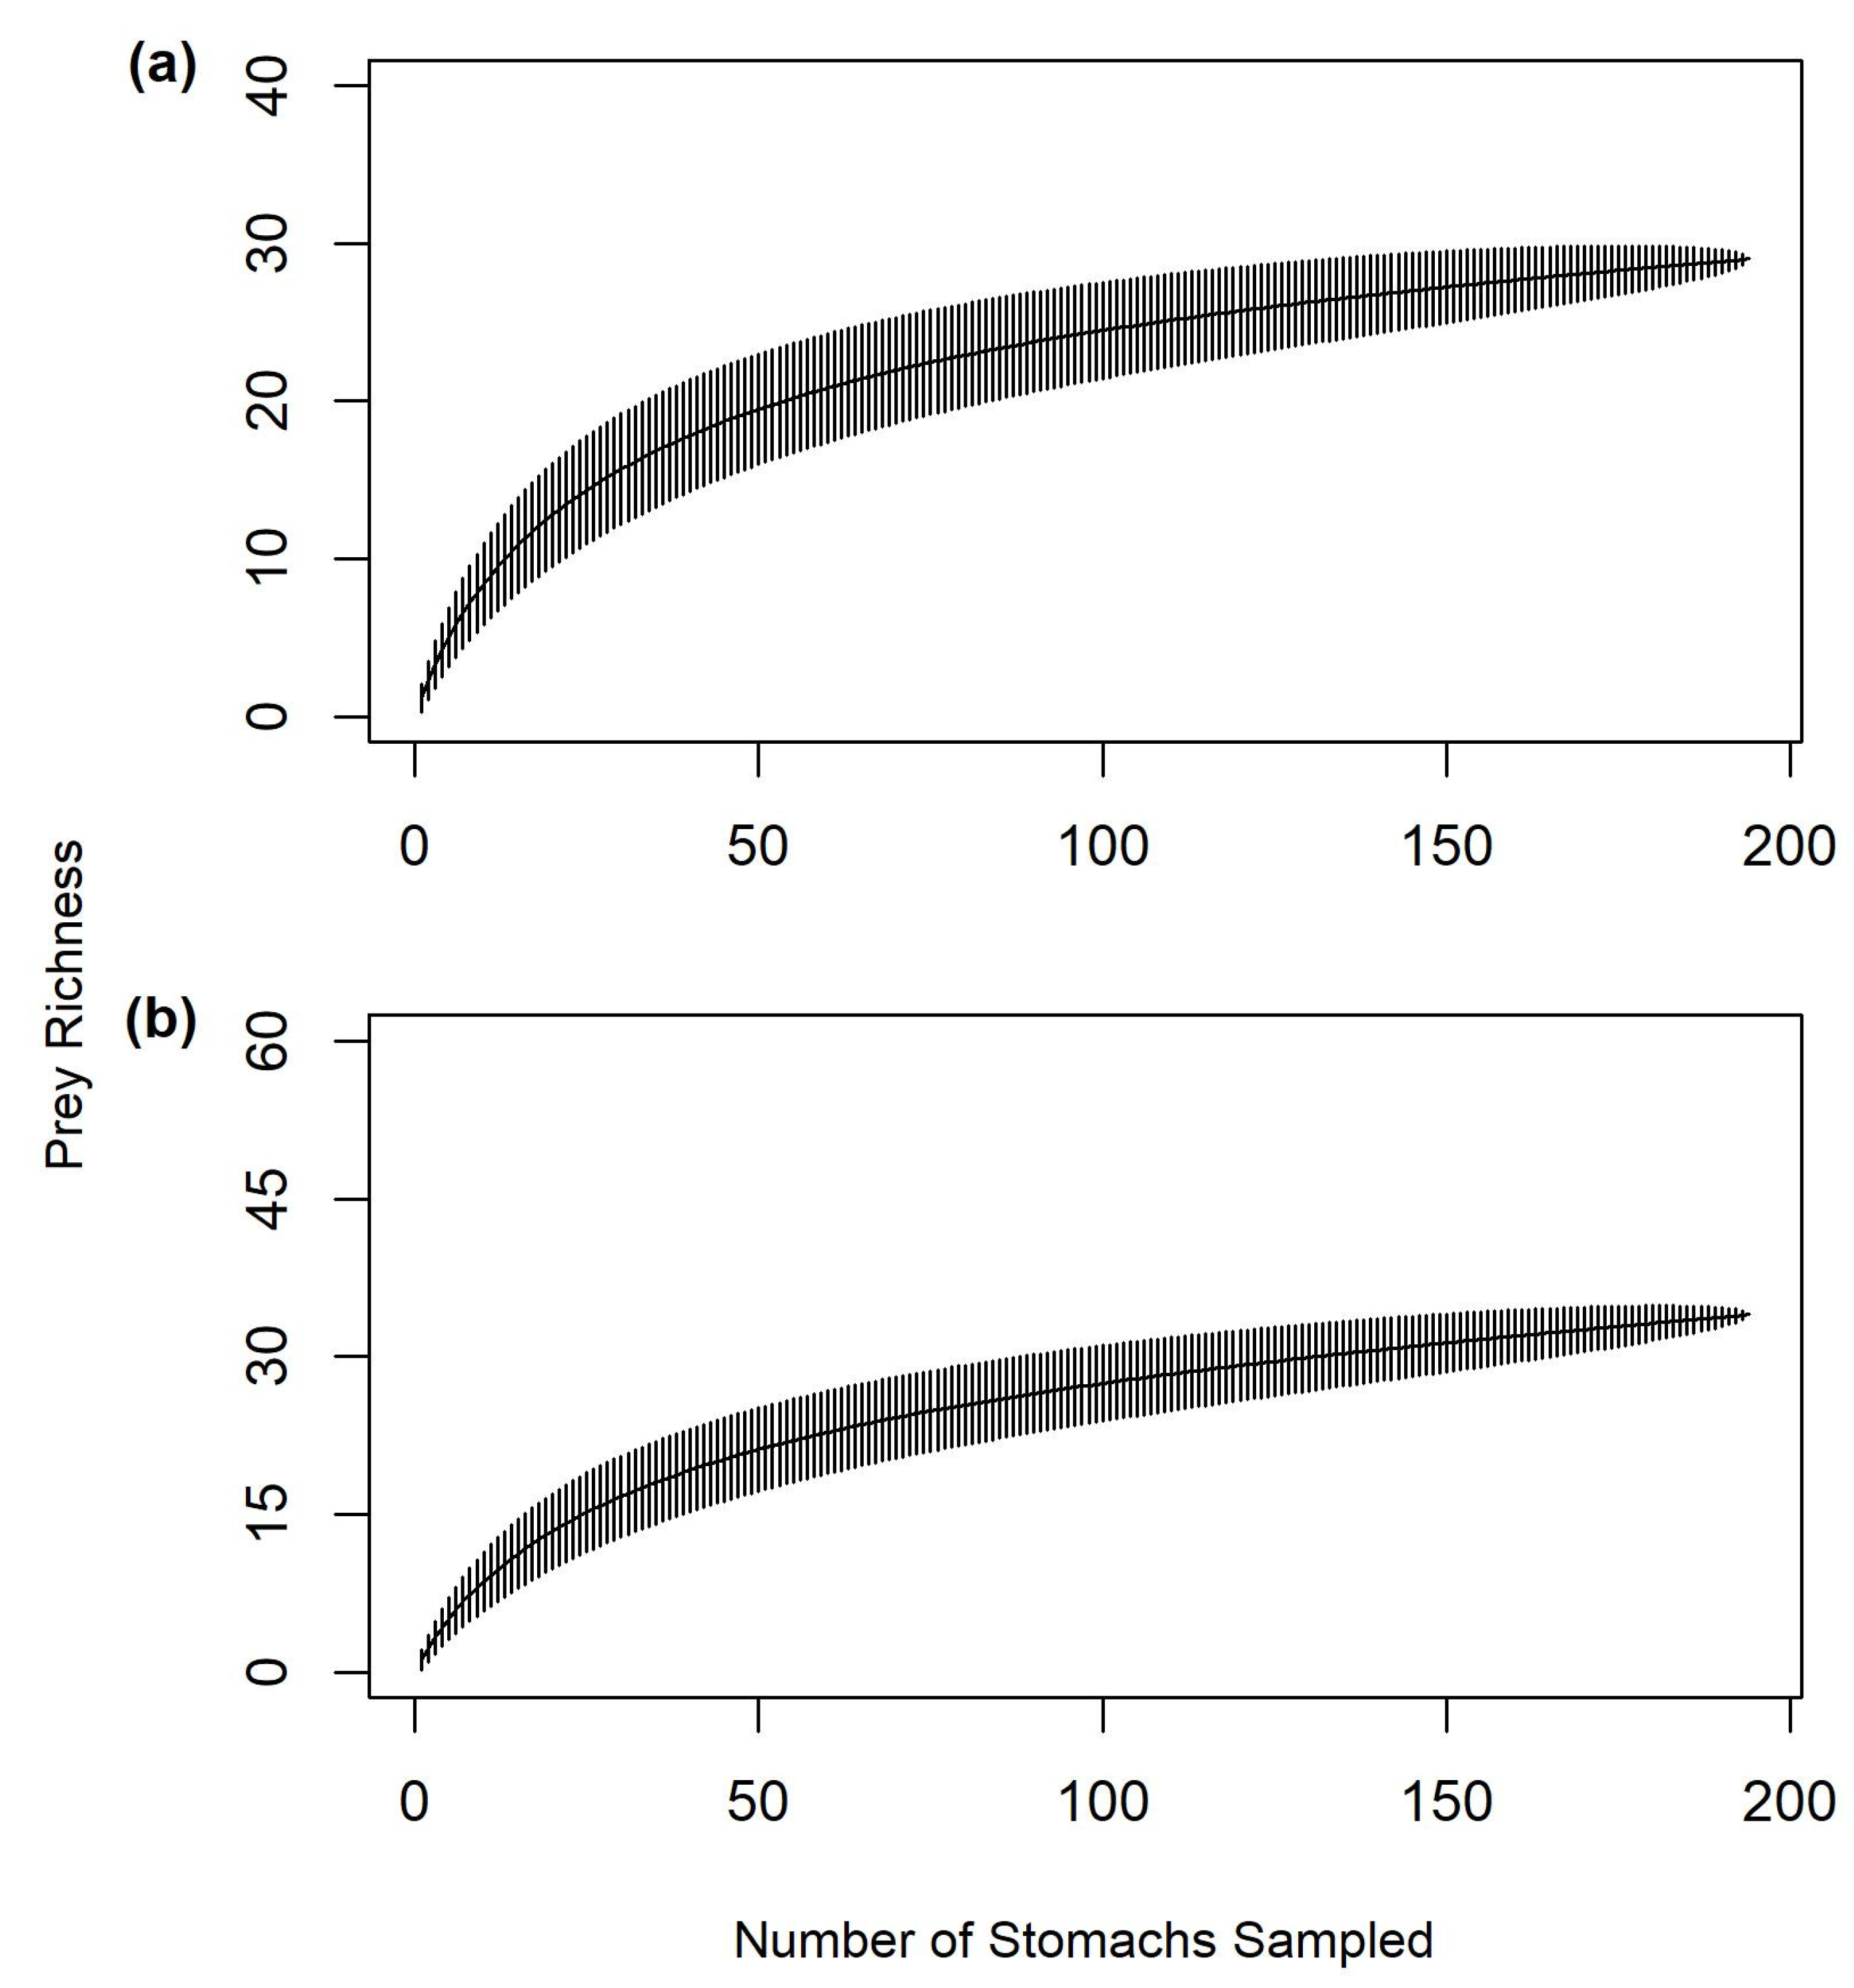
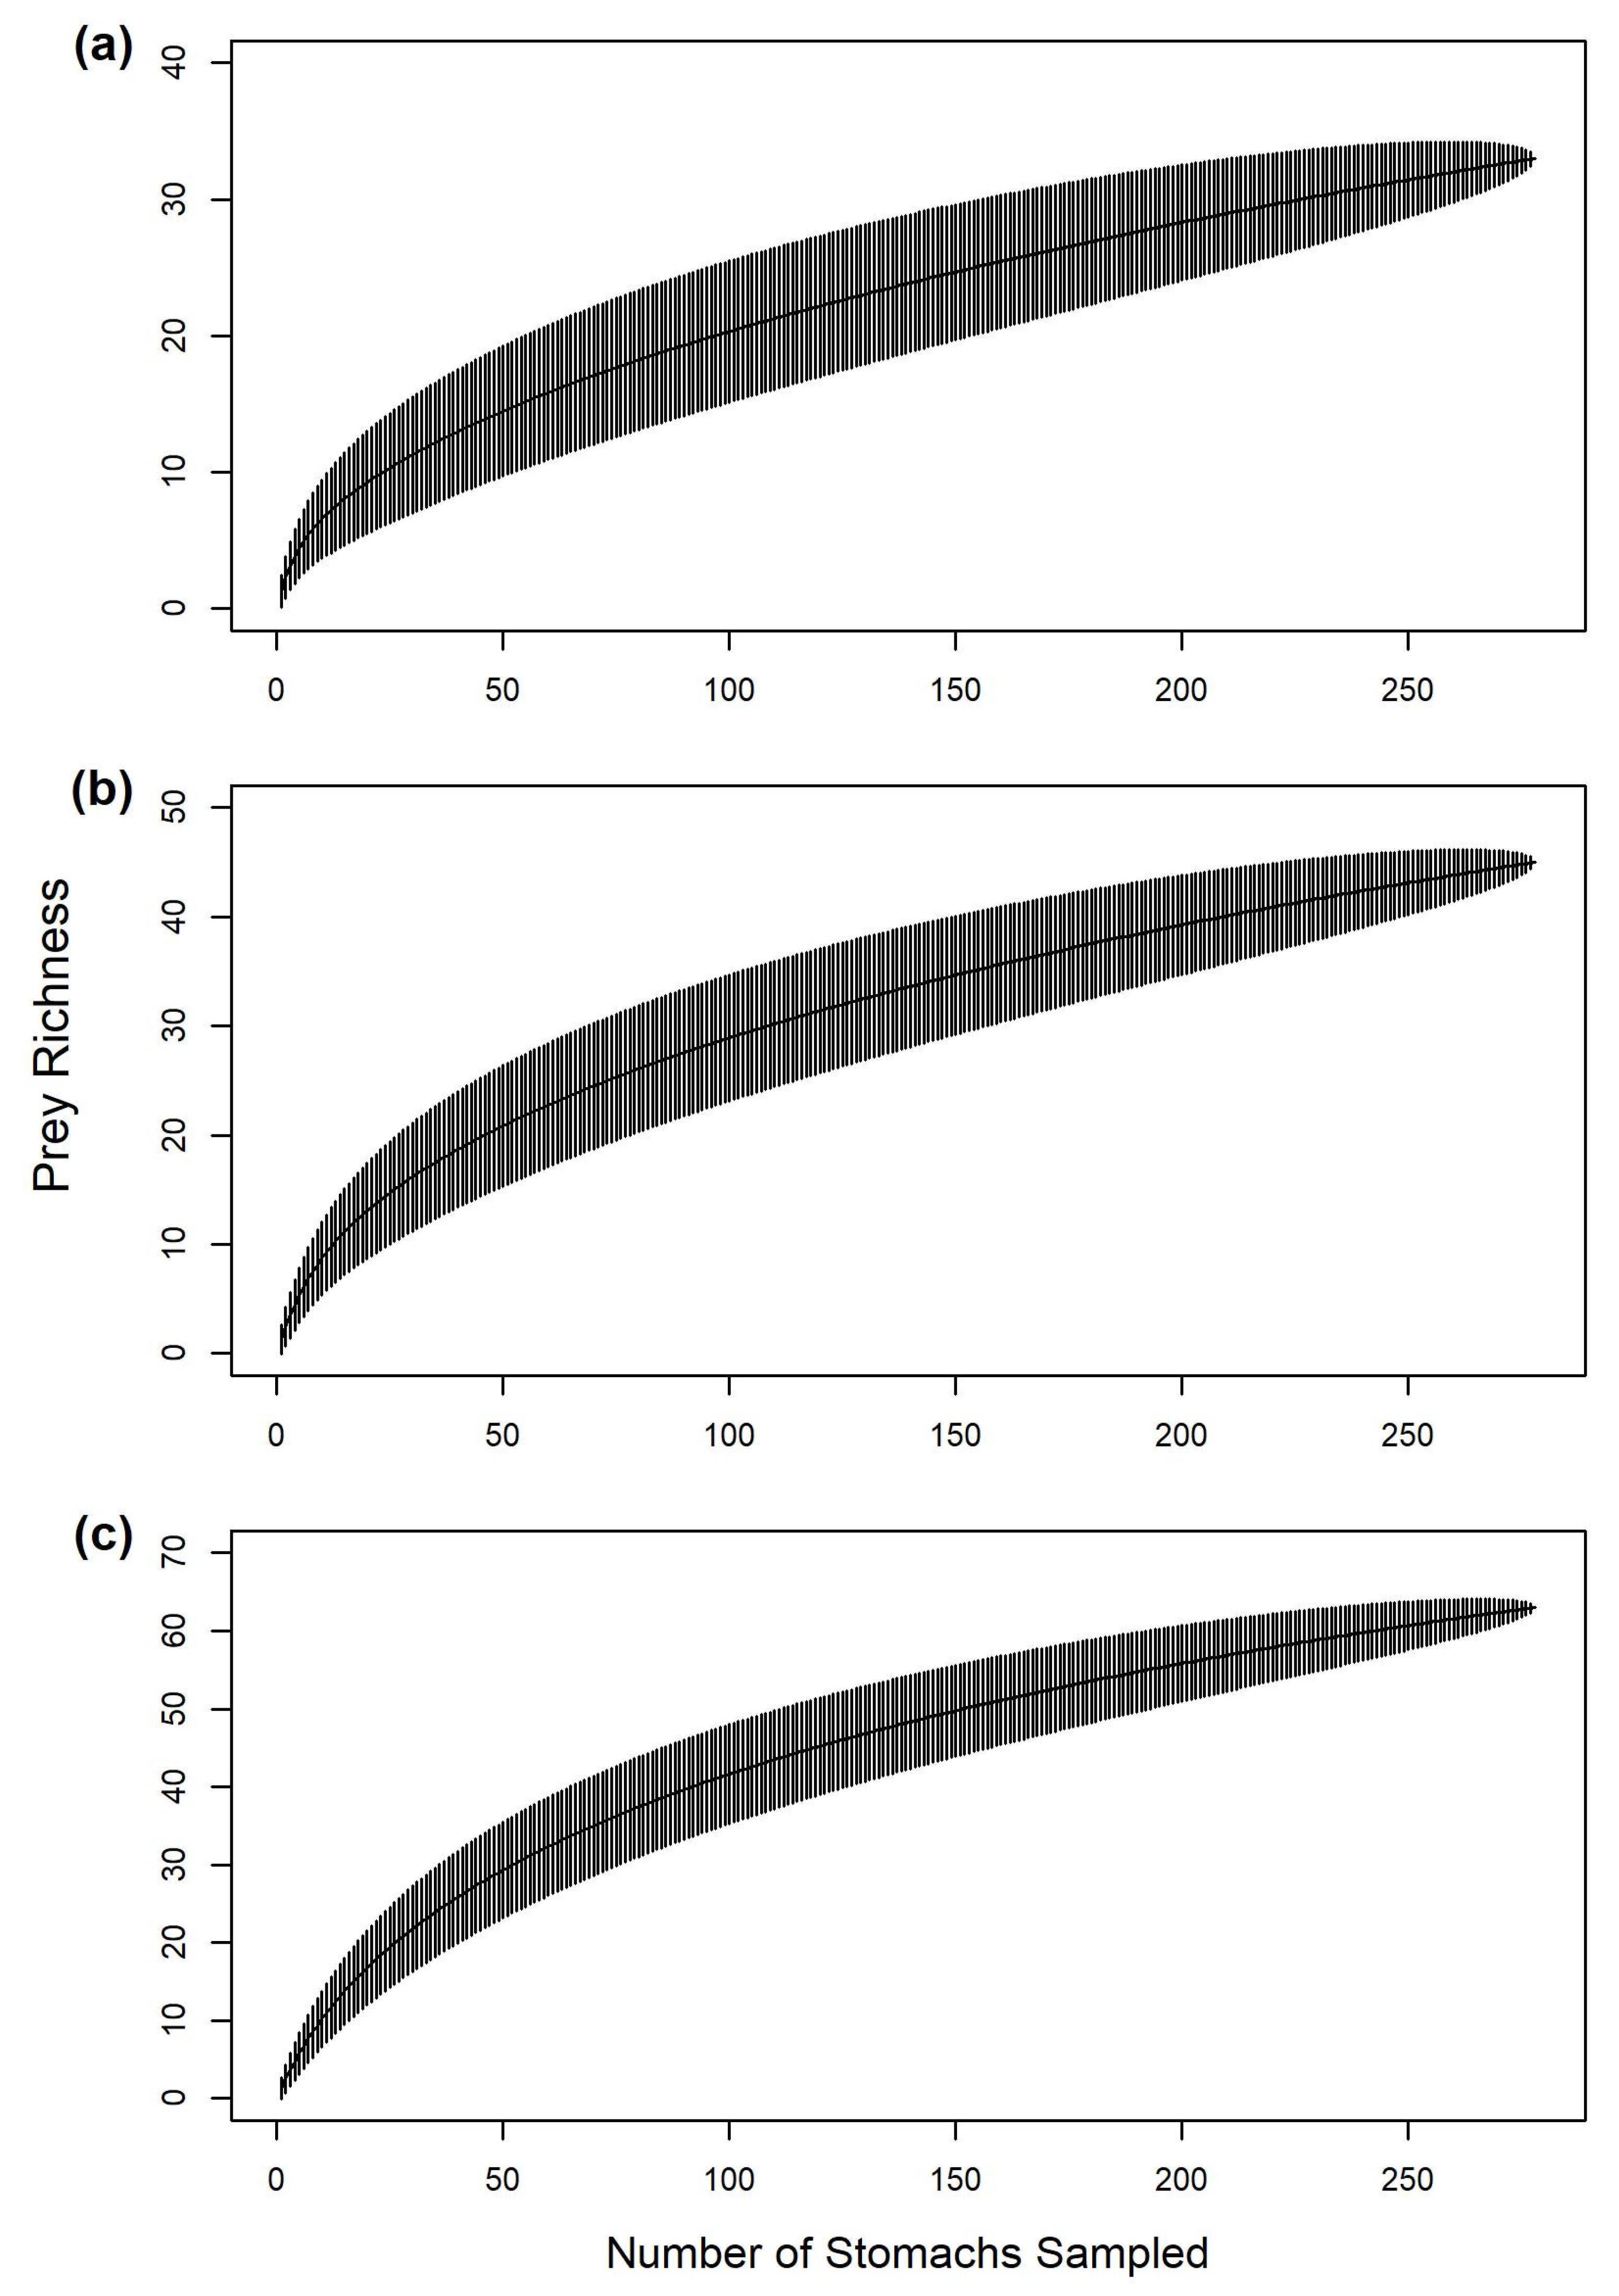
2.6. Sample Size Sufficiency
2.7. Statistical Analysis
3. Results
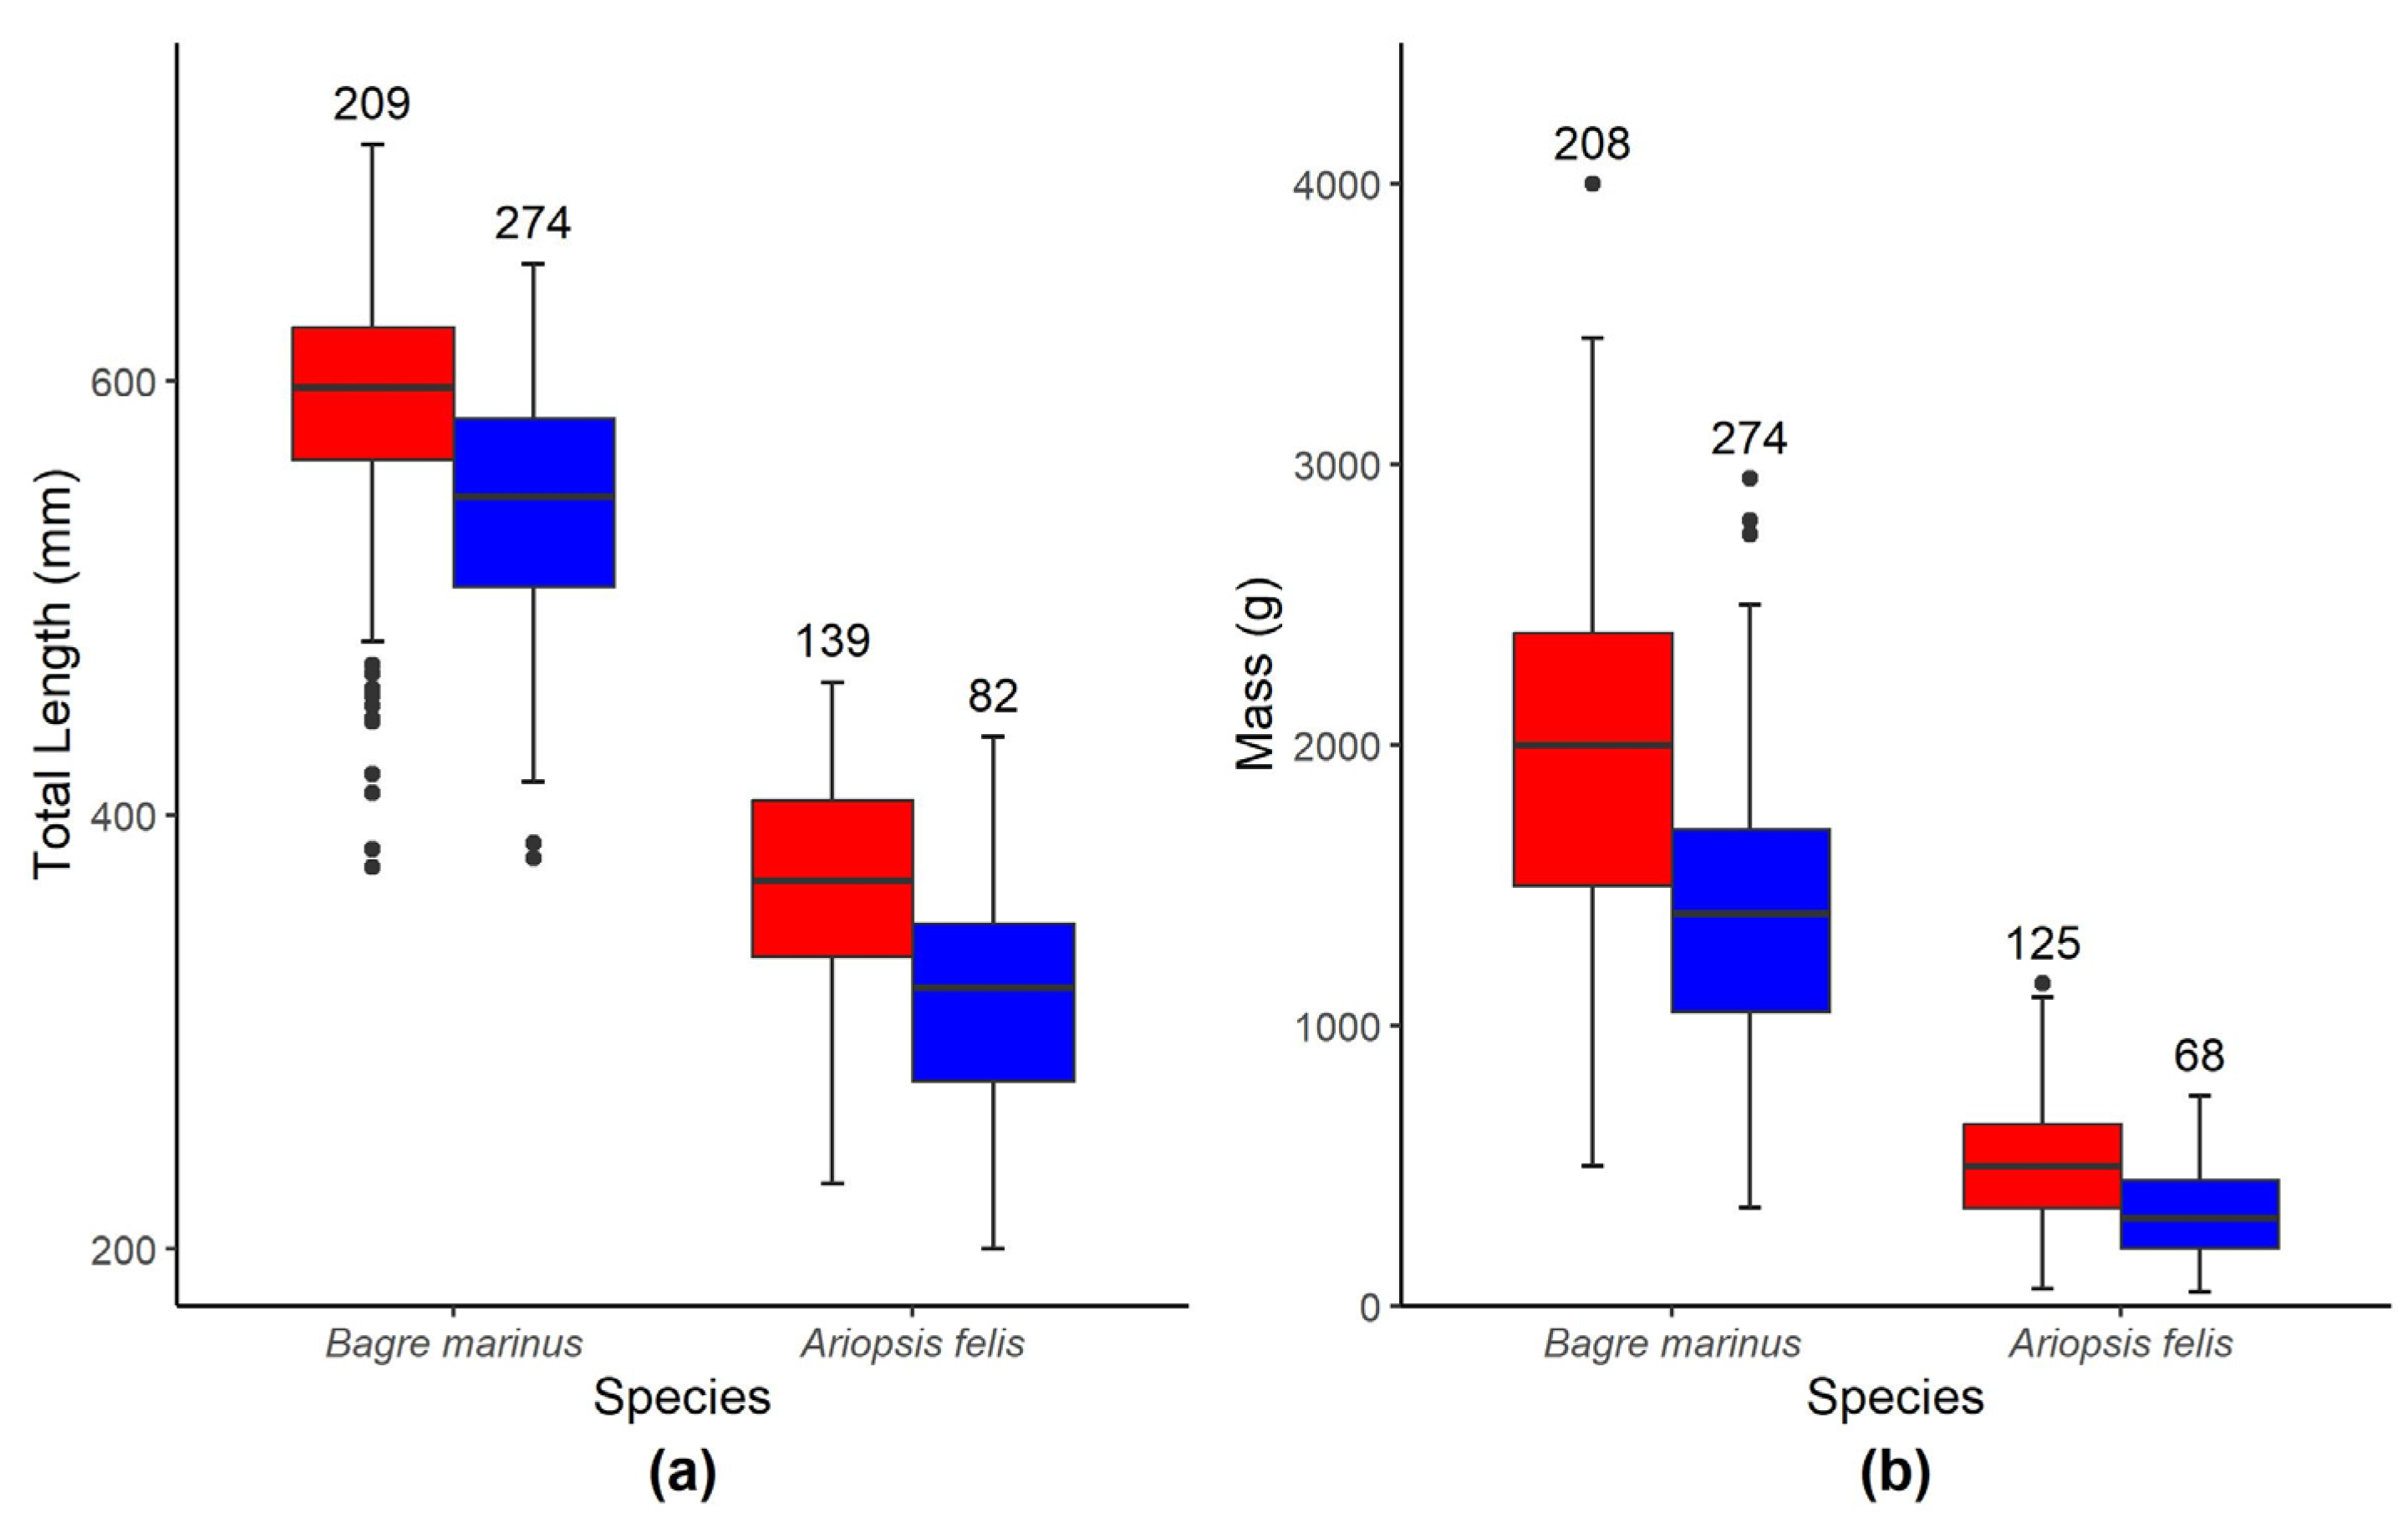
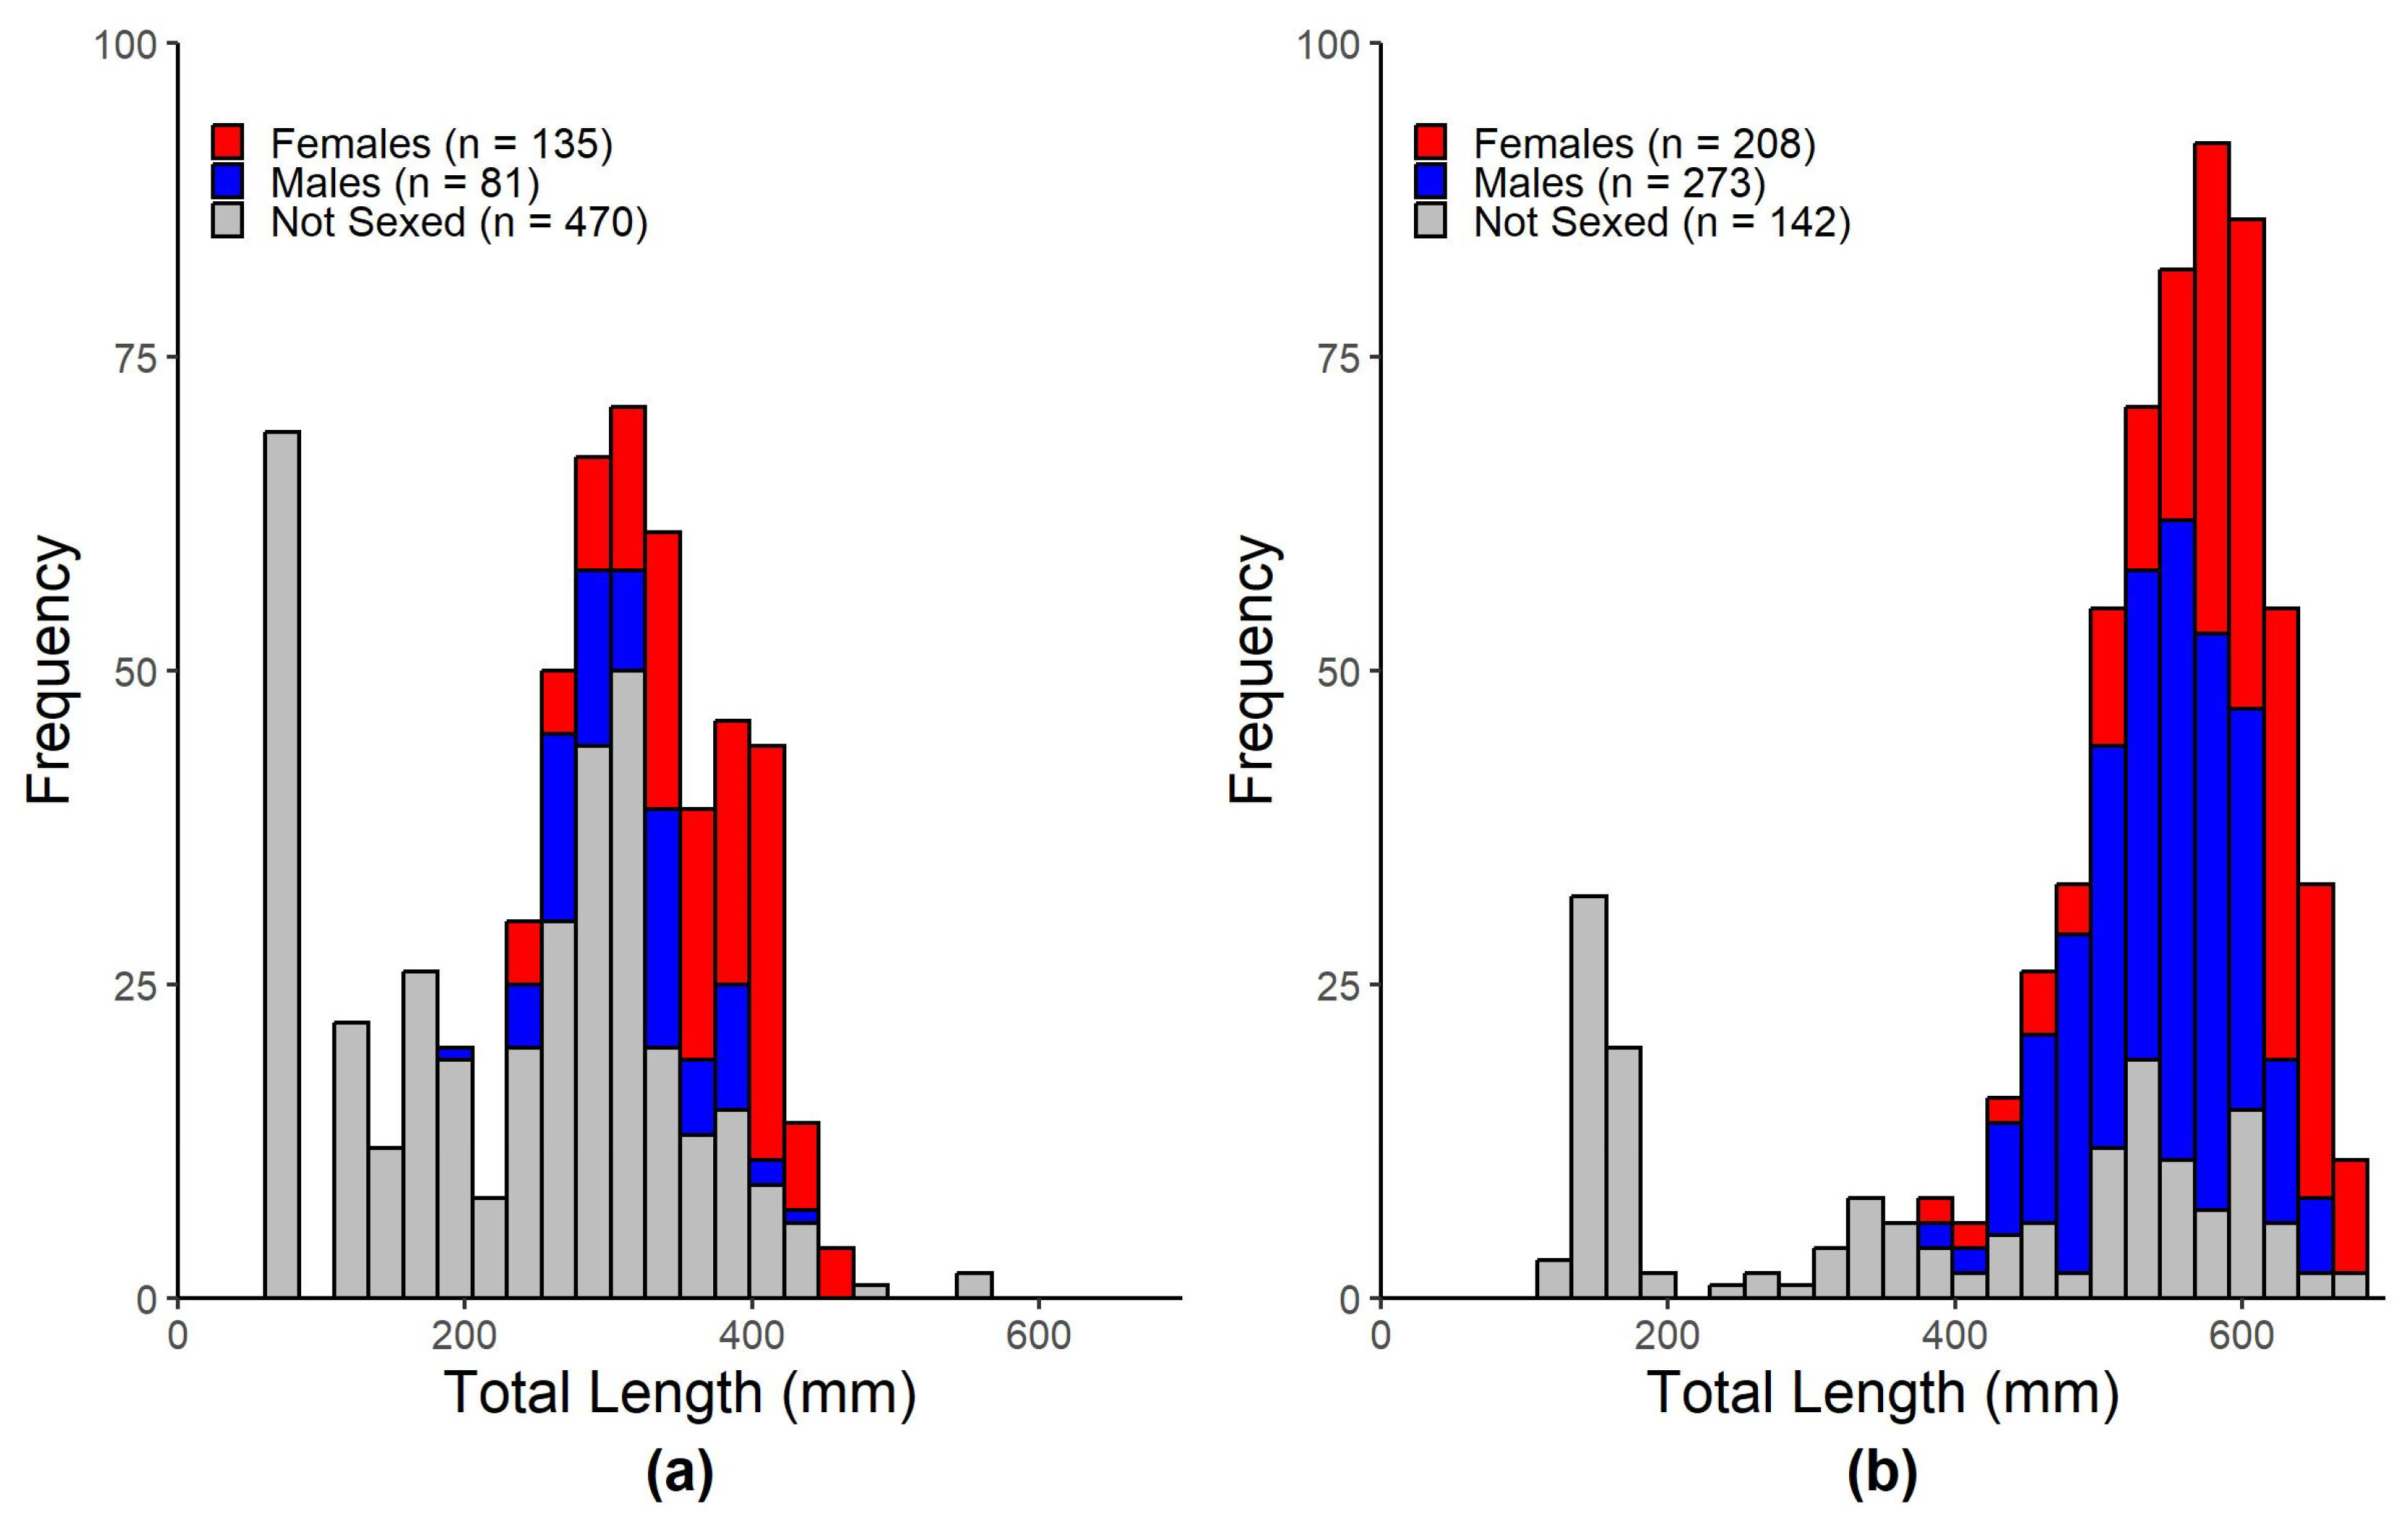
3.1. Morphometrics
3.2. Hardhead Catfish Diet
3.2.1. Diet Characterization
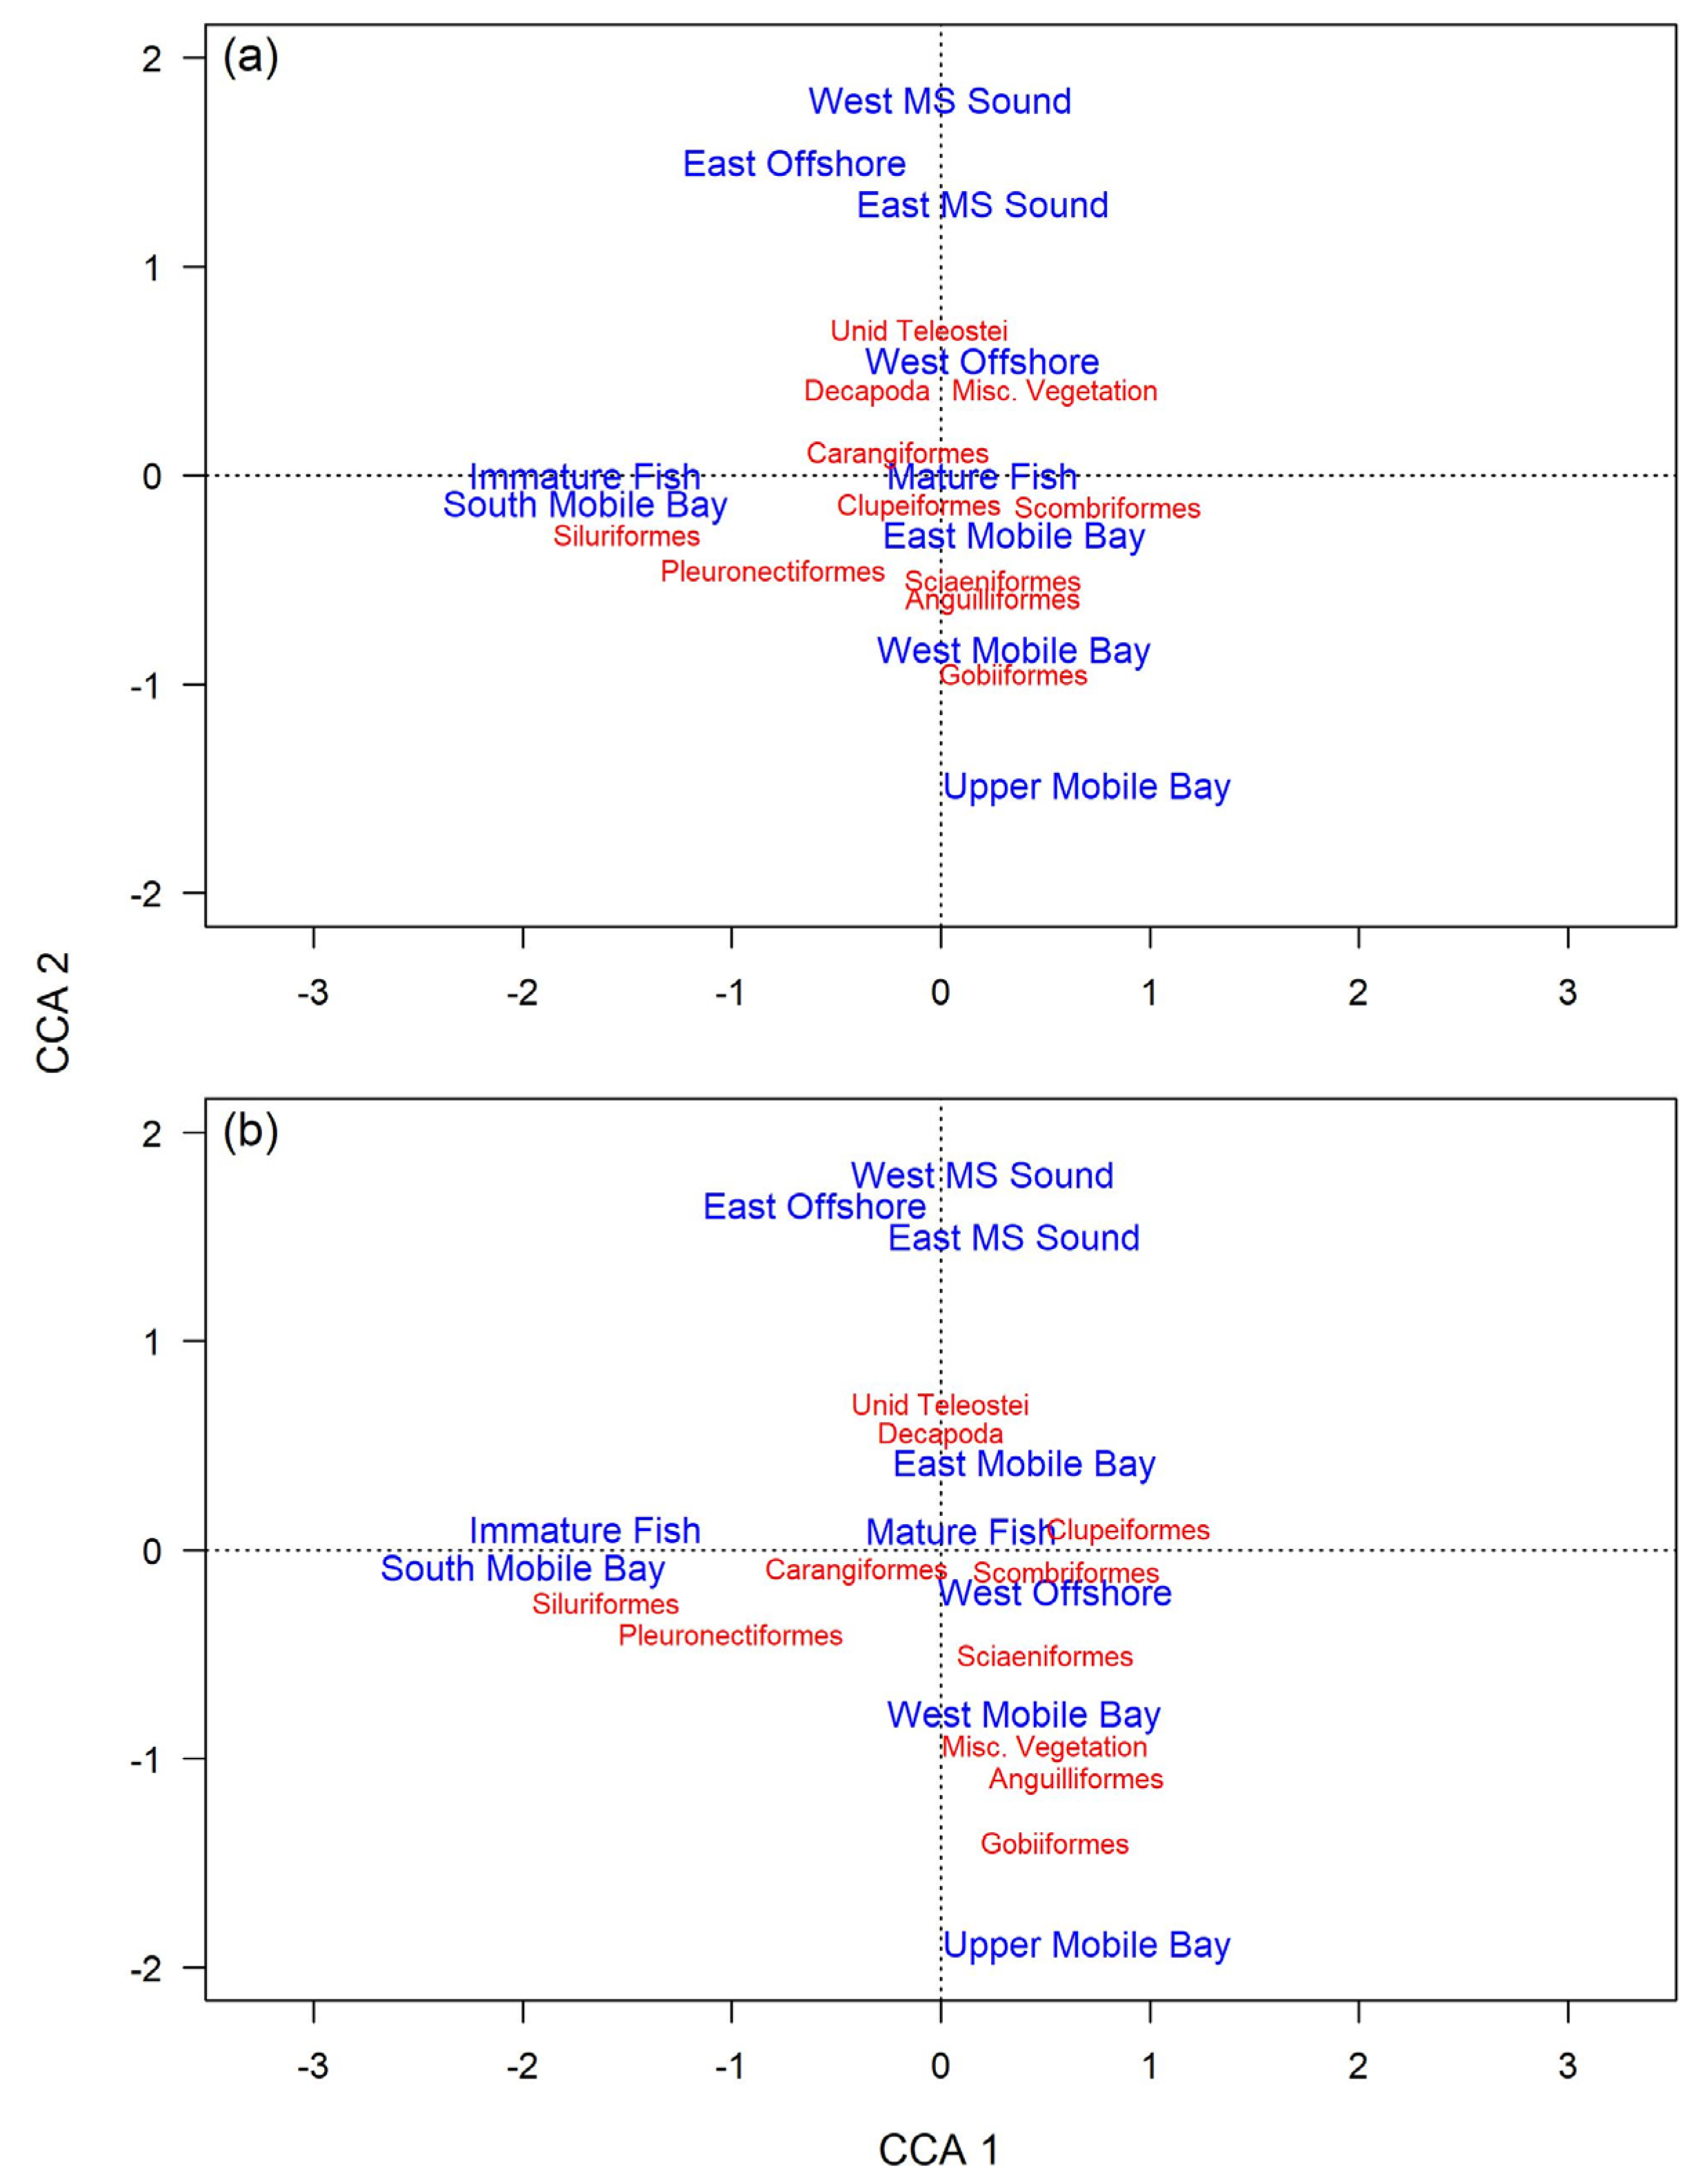
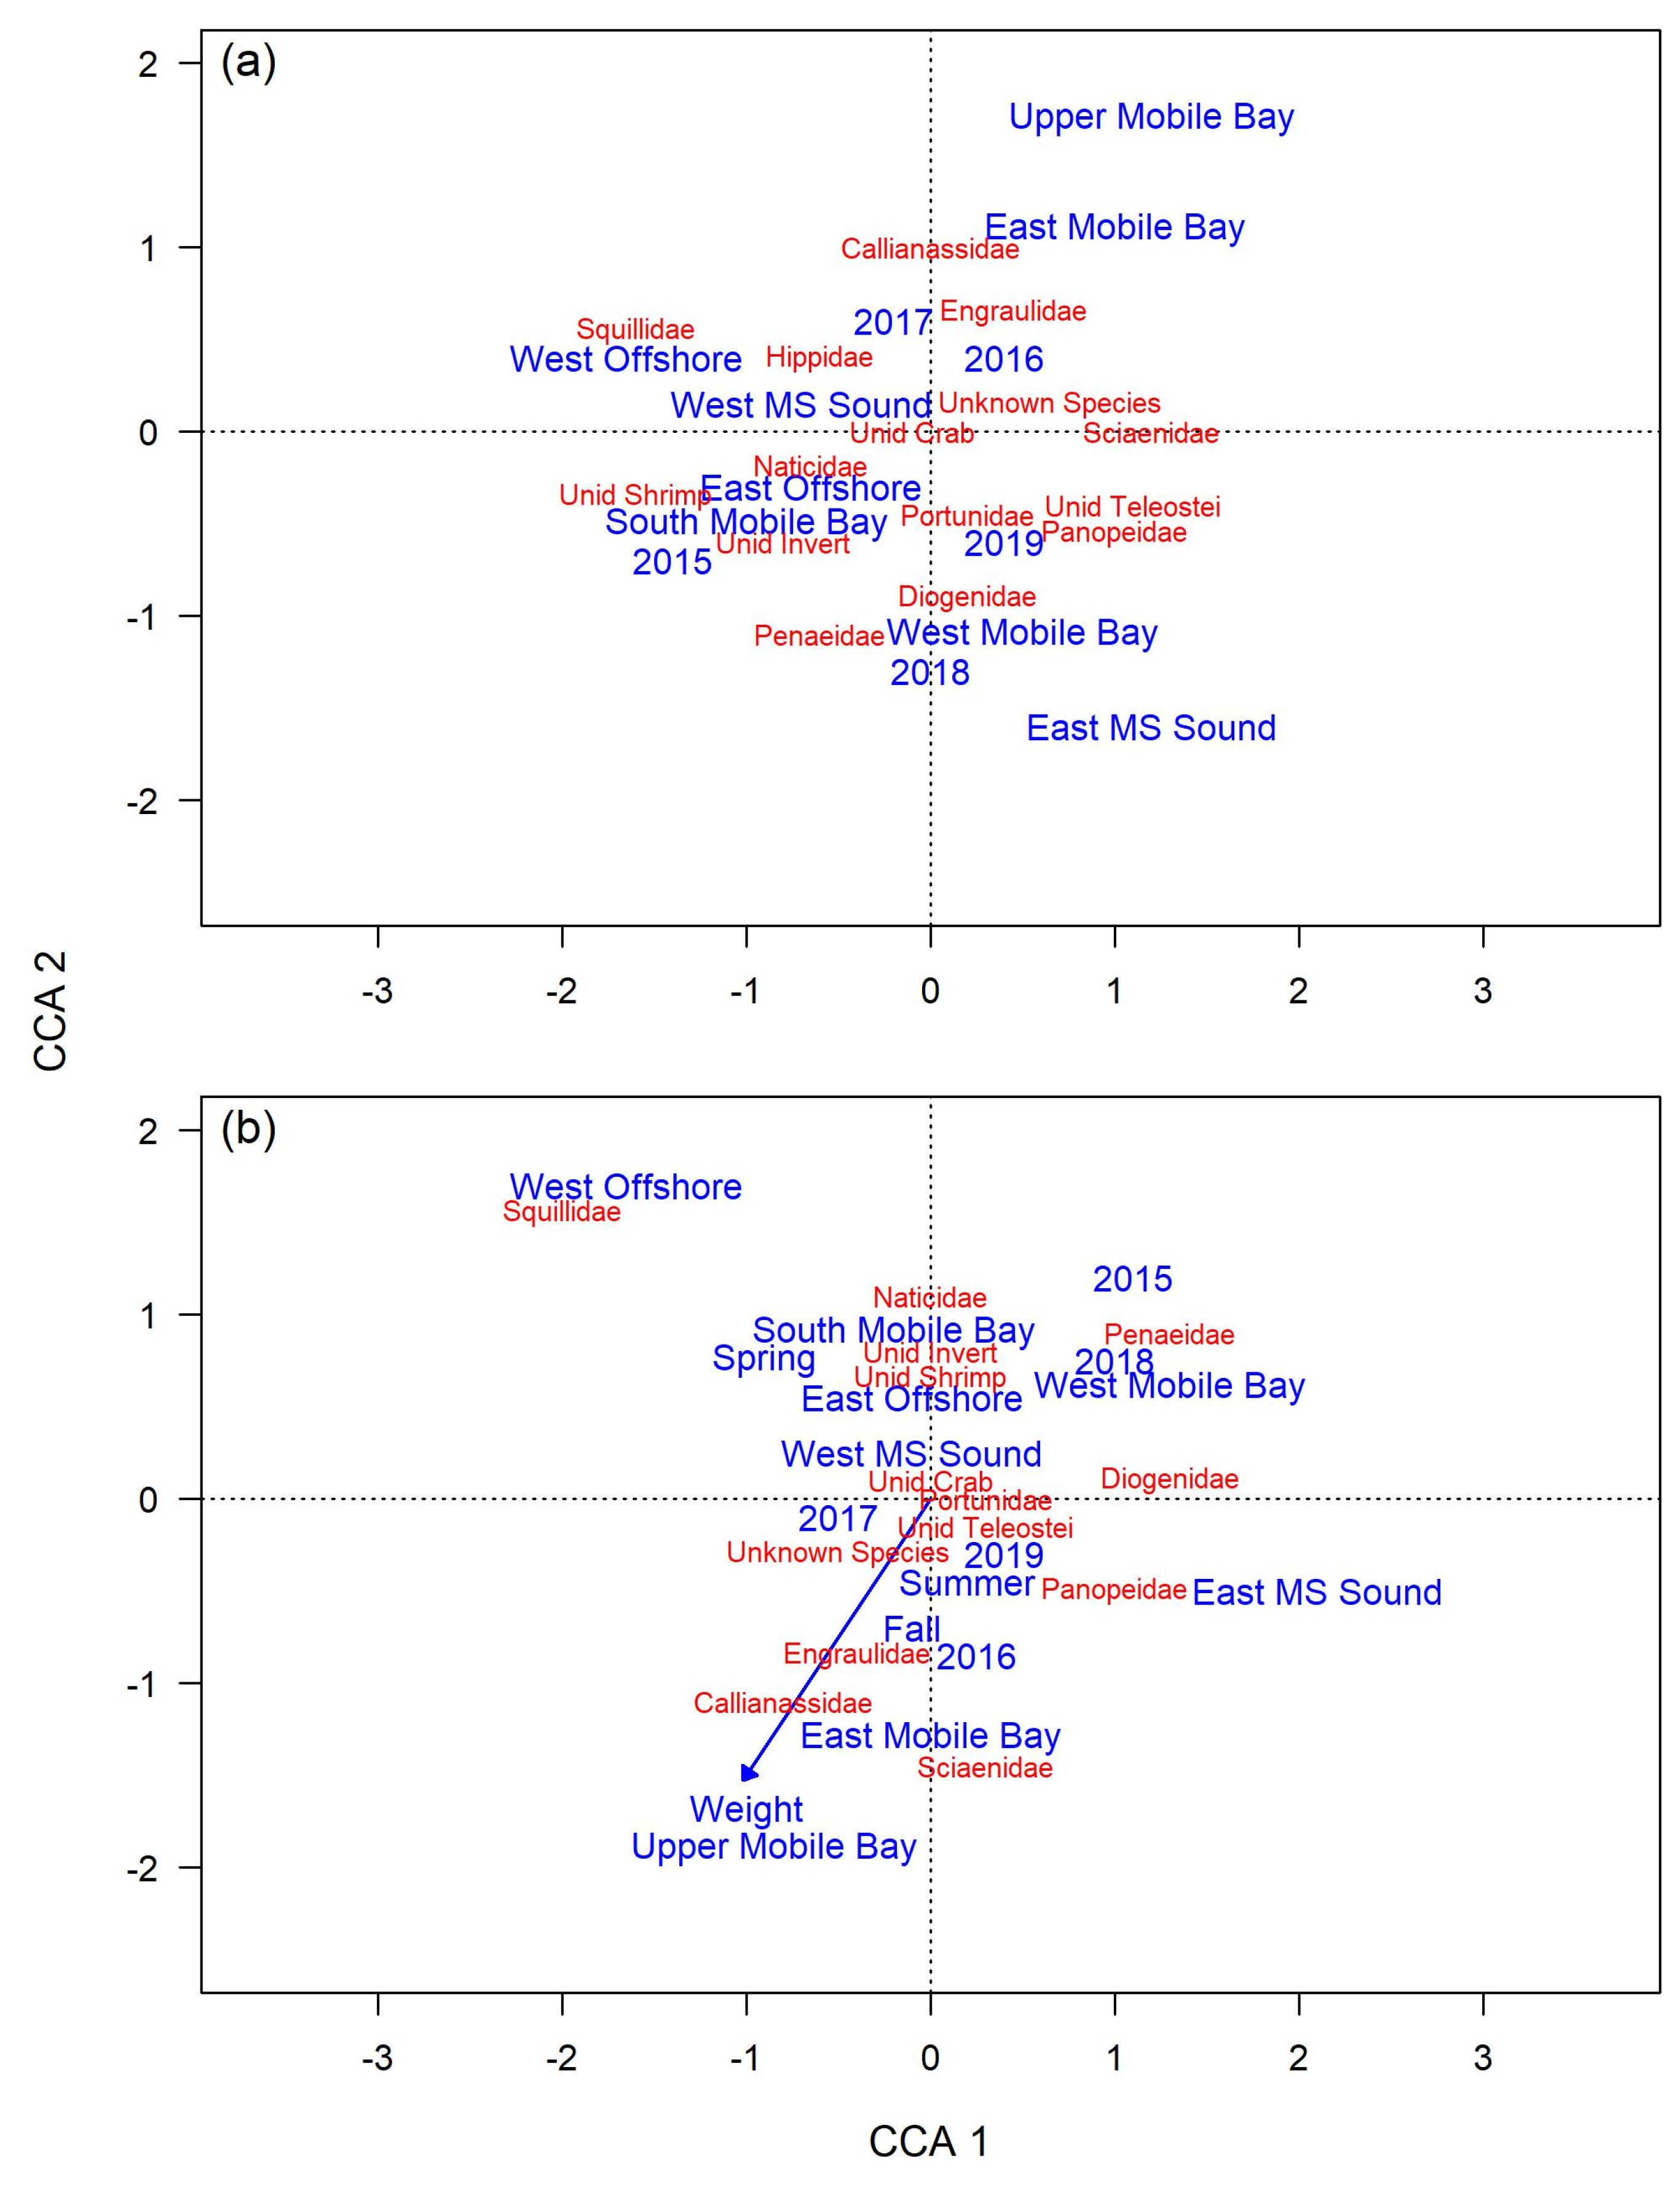
3.2.2. Diet Variability
3.3. Gafftopsail Catfish Diet
3.3.1. Diet Characterization
3.3.2. Diet Variability
4. Discussion
5. Conclusions
Author Contributions
Funding
Institution Review Board Statement
Acknowledgments
Conflicts of Interest
Appendix A


References
- Yanez-Arancibia, A.; Lara-Dominguez, A.L. Ecology of three sea catfishes (Ariidae) in a tropical coastal ecosystem—Southern Gulf of Mexico. Mar. Ecol. Prog. Ser. 1988, 49, 215–230. [Google Scholar] [CrossRef]
- Armstrong, M.P.; Murphy, M.D.; Muller, R.G.; Harshany, D.P.; Crabtree, R.E. A Stock Assessment of Hardhead Catfish, Arius felis, and Gafftopsail Catfish, Bagre marinus, in Florida Waters; Report to the Florida Marine Fisheries Commission; Florida Department of Environmental Protection, Florida Marine Research Institute: St. Petersburg, FL, USA, 1996. [Google Scholar]
- Muncy, R.J.; Wingo, W.M. Species Profiles: Life Histories and Environmental Requirements of Coastal Fishes and Invertebrates (Gulf of Mexico): Sea Catfish and Gafftopsail Catfish (Tech. REP.); U.S. Fish and Wildlife Service, Division of Biological Sciences, FWS/OBS-82/11.5; TR EL-82–4; U.S. Army Corps of Engineers: Washington, DC, USA, 1983; 17p. [Google Scholar]
- Pinheiro, P.; Broadhurst, M.K.; Hazin, F.H.V.; Bezerra, T.; Hamilton, S. Reproduction in Bagre marinus (Ariidae) off Pernambuco, northeastern Brazil. J. Appl. Ichthyol. 2006, 22, 189–192. [Google Scholar] [CrossRef]
- Mendoza-Carranza, M. The feeding habits of Gafftopsail Catfish Bagre marinus (Ariidae) in Paraiso Coast, Tabasco, Mexico. Hidrobiológica 2003, 13, 119–126. [Google Scholar]
- Segura-Berttolini, E.C.; Mendoza-Carranza, M. Importance of male gafftopsail catfish, Bagre marinus (Pisces: Ariidae), in the reproductive process. Cienc. Mar. 2013, 39, 29–30. [Google Scholar] [CrossRef]
- Flinn, S.; Midway, S.; Ostrowski, A. Age and growth of hardhead catfish and gafftopsail catfish in coastal Louisiana, USA. Mar. Coast. Fish. 2019, 11, 362–371. [Google Scholar] [CrossRef]
- Merriman, D. Morphological and embryological studies on two species of marine catfish, Bagre marinus and Galeichthys felis. Zoologica 1940, 25, 221–248. [Google Scholar] [CrossRef]
- Rudershausen, P.J.; Locascio, J.V. Dietary habits of the gafftopsail catfish, Bagre marinus, in Tarpon Bay and Pine Island Sound, Florida. Gulf Mex. Sci. 2001, 19, 90–96. [Google Scholar]
- Peterson, C.T.; Grubbs, R.D.; Mickle, A. An Investigation of effects of the Deepwater Horizon Oil Spill on coastal fishes in the Florida Big Bend using fishery-independent surveys and stable isotope analysis. Southeast. Nat. 2017, 16, G93–G108. [Google Scholar] [CrossRef]
- Olin, J.A.; Rush, S.A.; MacNeil, M.A.; Fisk, A.T. Isotopic ratios reveal mixed seasonal variation among fishes from two subtropical estuarine systems. Estuaries Coast. 2012, 35, 811–820. [Google Scholar] [CrossRef]
- Pensinger, L.G.; Polito, M.J.; Midway, S.R. Ontogentic stability in the trophic niche of a common Gulf of Mexico fish, Ariopsis felis. Environ. Biol. Fish. 2021, 104, 569–579. [Google Scholar] [CrossRef]
- Geers, T.M.; Pikitch, E.K.; Frisk, M.G. An original model of the northern Gulf of Mexico using Ecopath with Ecosim and its implications for the efforts of fishing on ecosystem structure and maturity. Deep Sea Res. II Top. Stud. Oceanogr. 2016, 129, 319–331. [Google Scholar] [CrossRef]
- Leray, M.; Yang, J.Y.; Meyer, C.P.; Mills, S.C.; Agudelo, N.; Ranwez, V.; Boehm, J.T.; Machida, R.J. A new versatile primer set targeting a short fragment of the mitochondrial COI region for metabarcoding metazoan diversity: Application for characterizing coral reef fish gut contents. Front. Zool. 2013, 10, 1–14. [Google Scholar] [CrossRef] [PubMed]
- Geller, J.; Meyer, C.; Parker, M.; Hawk, H. Redesign of PCR primers for mitochondrial cytochrome c oxidase subunit I for marine invertebrates and application in all-taxa biotic surveys. Mol. Ecol. Resour. 2013, 13, 851–861. [Google Scholar] [CrossRef]
- Boyer, F.; Mercier, C.; Bonin, A.; Le Bras, Y.; Taberlet, P.; Coissac, E. Obitools: A unix-inspired software package for DNA metabarcoding. Mol. Ecol. Resour. 2016, 16, 176–182. [Google Scholar] [CrossRef] [PubMed]
- Hao, X.; Jiang, R.; Chen, T. Clustering 16S rRNA for OUT prediction: A method of unsupervised Bayesian clustering. Bioinformatics 2011, 27, 611–618. [Google Scholar] [CrossRef]
- Rognes, T.; Flouri, T.; Nichols, B.; Quince, C.; Mahe, F. VSEARCH: A versatile open source tool for metagenomics. PeerJ 2016, 4, e2584. [Google Scholar] [CrossRef] [PubMed]
- Edgar, R.C. Search and clustering orders of magnitude faster than BLAST. Bioinformatics 2010, 26, 2460–2461. [Google Scholar] [CrossRef]
- Gremme, G.; Steinbiss, S.; Kurtz, S. GenomeTools: A comprehensive software library for efficient processing of structured genome annotations. IEEE/ACM Trans. Comput. Biol. Bioinform. 2013, 10, 645–656. [Google Scholar] [CrossRef]
- Brown, S.C.; Bizzarro, J.J.; Calliet, G.M.; Ebert, D.A. Breaking with tradition: Redefining measures for diet description with a case study of the Aleutian skate Bathyraja aleutica (Gilbert 1986). Environ. Biol. Fishes 2012, 95, 3–20. [Google Scholar] [CrossRef]
- Hyslop, E.J. Stomach contents analysis—A review of methods and their application. J. Fish Biol. 1980, 17, 411–429. [Google Scholar] [CrossRef]
- Chipps, S.R.; Garvey, J.E. Assessment of diet and feeding patterns. In Analysis and Interpretation of Freshwater Fisheries Data; Guy, C.S., Brown, M.L., Eds.; American Fisheries Society: Bethesda, MD, USA, 2007; pp. 473–514. [Google Scholar]
- Ferry, L.A.; Calliet, G.M. Sample size and data analysis: Are we characterizing and comparing diet properly? In Gutshop 096: Feeding Ecology and Nutrition in Fish Symposium Proceedings, Proceedings of the American Fisheries Society, San Francisco, CA, USA, 14–18 July 1996; MacKinlay, D., Shearer, K., Eds.; American Fisheries Society: San Francisco, CA, USA, 1996; pp. 71–80. [Google Scholar]
- Clarke, K.R.; Gorley, R.N.; Somerfield, P.J.; Warwick, R.M. Change in Marine Communities: An Approach to Statistical Analysis and Interpretation; Primer-E Ltd.: Plymouth, UK, 2014. [Google Scholar]
- Pensinger, L.; Brown-Peterson, N.J.; Green, C.C.; Midway, S.R. Reproductive biology of hardhead catfish Ariopsis felis: Evidence for overwintering oocytes. J. Fish Biol. 2021, 99, 308–320. [Google Scholar] [CrossRef]
- Miguez, J.S. Age, growth, and maturity of the gafftopsail catfish, Bagre marinus. in Northwest Florid. Undergraduate Thesis, Florida State University, Tallahassee, FL, USA, 2019. [Google Scholar]
- Courtney, J.; Klinkmann, T.; Torano, J.; Courtney, M. Weight-Length Relationships in Gafftopsail Catfish (Bagre marinus) and Hardhead Catfish (Ariopsis felis) in Lousiana Waters; Cornwell University Library: Ithaca, NY, USA, 2012. [Google Scholar]
- Anderson, D.R.; Walsh, D.C. PERMANOVA, ANOSIM, and the Mantel test in the face of heterogeneous dispersions: What null hypothesis are you testing? Ecol. Monogr. 2013, 83, 557–574. [Google Scholar] [CrossRef]
- ter Braak, C.J.; Verdonschot, P.F. Canonical correspondence analysis and related multivariate methods in aquatic ecology. Aquat. Sci. 1995, 57, 255–289. [Google Scholar] [CrossRef]
- Kemper, J.M.; Bizzarro, J.J.; Ebert, D.A. Dietary variability in two common Alaskan skates (Bathyraja interrupta and Raja rhina). Mar. Biol. 2017, 164, 52. [Google Scholar] [CrossRef]
- R Core Team. R: A Language and Environment for Statistical Computing; R Foundation for Statistical Computing: Vienna, Austria, 2016. [Google Scholar]
- Oksanen, J.; Blanchet, F.G.; Friendly, M.; Kindt, R.; Legendre, P.; McGlinn, D.; Minchin, P.R.; O’Hara, R.B.; Simpson, G.L.; Solymos, P.; et al. Vegan: Community Ecology Package. R Package Version 2.5–7. Available online: https://cran.r-project.org/web/packages/vegan/index.html (accessed on 10 January 2023).
- Reid, W.D.; Clark, S.; Collins, M.A.; Belchier, M. Distribution and ecology of Chaenocephalus aceratus (Channichthyidae) around South Georgia and Shag Rocks (Southern Ocean). Polar Biol. 2007, 30, 1523–1533. [Google Scholar] [CrossRef]
- Felder, D.L.; de Almeida Rodrigues, S. Reexamination of the ghost shrimp Lepidophthalmus louisianensis (Schmitt, 1935) from the northern Gulf of Mexico and comparison to L. siriboia, new species, from Brazil (Decapoda: Thalassinidea: Callianassidae). J. Crust.Biol. 1993, 13, 357–376. [Google Scholar] [CrossRef]
- Norse, E.A. Aspects of the Zoogeographic Distribution of Callinectes (Brachyura: Portunidae). Bull. Mar. Sci. 1977, 27, 404–447. [Google Scholar]
- Walters, C.J.; Martell, S.J.D.; Mahmoudi, B. An Ecosim model for exploring ecosystem management options for the Gulf of Mexico: Implications of including multistanza life history models for policy predictions. Bull. Mar. Sci. 2006, 83, 23. [Google Scholar]
- Sagarese, S.R.; Nuttall, M.A.; Geers, T.M.; Lauretta, M.V.; Walter, J.F., III; Serafy, J.E. Quantifying the trophic importance of Gulf menhaden within the northern Gulf of Mexico Ecosystem. Mar. Coast. Fish. 2016, 8, 23–45. [Google Scholar] [CrossRef]
- Winemiller, K.O.; Rose, K.A. Patterns of life-history diversification in North American fishes: Implications for population regulation. Can. J. Fish. Aquat. Sci. 1992, 49, 2196–2218. [Google Scholar] [CrossRef]


| Variable | Hardhead Catfish | Gafftopsail Catfish | |||||
|---|---|---|---|---|---|---|---|
| Stomach Content | Stomach Content | ||||||
| Food | Empty | Total | Food | Empty | Total | ||
| Location | West Mississippi Sound | 25 | 101 | 126 | 20 | 20 | 40 |
| East Mississippi Sound | 17 | 31 | 48 | 36 | 46 | 82 | |
| West Offshore | 20 | 9 | 29 | 21 | 15 | 36 | |
| East Offshore | 31 | 54 | 85 | 13 | 9 | 22 | |
| North Mobile Bay | 16 | 39 | 55 | 22 | 19 | 41 | |
| South Mobile Bay | 15 | 149 | 164 | 34 | 65 | 99 | |
| West Mobile Bay | 24 | 27 | 51 | 56 | 99 | 155 | |
| East Mobile Bay | 25 | 38 | 63 | 33 | 40 | 73 | |
| Season | Spring | 75 | 171 | 246 | 38 | 28 | 66 |
| Summer | 93 | 118 | 211 | 205 | 306 | 511 | |
| Fall | 26 | 210 | 236 | 36 | 42 | 78 | |
| Year | 2015 | 7 | 49 | 56 | 1 | 15 | 16 |
| 2016 | 15 | 102 | 117 | 5 | 0 | 5 | |
| 2017 | 95 | 249 | 344 | 158 | 156 | 314 | |
| 2018 | 32 | 42 | 74 | 58 | 114 | 172 | |
| 2019 | 45 | 57 | 102 | 57 | 91 | 148 | |
| Total Length (mm) | Mass (g) | ||||||||||
|---|---|---|---|---|---|---|---|---|---|---|---|
| Species | Min | Max | Mean | SD | n | Min | Max | Mean | SD | n | |
| Hardhead Catfish | All | 64.05 | 561 | 248.9 | 118.03 | 686 | 1.708 | 1500 | 251 | 248.3 | 686 |
| Females | 230 | 461 | 363 | 51.6 | 135 | 60 | 1150 | 500 | 213 | 135 | |
| Males | 200 | 436 | 318 | 50 | 81 | 50 | 750 | 336 | 151 | 81 | |
| Gafftopsail Catfish | All | 119 | 709 | 515.6 | 132.5 | 623 | 13 | 4000 | 1459.2 | 745.3 | 623 |
| Females | 376 | 709 | 588 | 57.9 | 208 | 500 | 4000 | 1961 | 660 | 208 | |
| Males | 380 | 654 | 543 | 53.6 | 273 | 100 | 2950 | 1404 | 474 | 273 | |
| Class | Order | Family | Species | %FO | %N | %PN | %M | %PM | %PSIRI |
|---|---|---|---|---|---|---|---|---|---|
| Vegetation (Misc.) | Unidentified | 0.52 | 0.52 | 100.00 | 0.52 | 100.00 | 0.52 | ||
| Unknown | Unidentified worm | 1.55 | 1.29 | 83.33 | 1.16 | 75.24 | 1.23 | ||
| Malacostraca | 82.47 | 81.14 | 92.94 | 80.23 | 91.96 | 76.25 | |||
| Decapoda | 76.29 | 61.94 | 93.05 | 60.96 | 91.80 | 70.51 | |||
| Alpheidae | Alpheus heterochaelis | 1.55 | 1.55 | 100.00 | 1.55 | 100.00 | 1.55 | ||
| Callianassidae | Lepidophthalmus louisianensis | 18.04 | 16.32 | 90.48 | 16.28 | 90.24 | 16.30 | ||
| Cambaridae | Unidentified | 0.52 | 0.52 | 100.00 | 0.52 | 100.00 | 0.52 | ||
| Ctenochelidae | Dawsonius latispina | 0.52 | 0.52 | 100.00 | 0.52 | 100.00 | 0.52 | ||
| Diogenidae | Clibanarius vittatus | 3.61 | 2.15 | 59.52 | 2.21 | 61.29 | 2.18 | ||
| Hippidae | Emerita benedicti | 3.09 | 2.15 | 69.44 | 2.22 | 71.79 | 2.18 | ||
| Leucosiidae | Persephona punctata | 0.52 | 0.26 | 50.00 | 0.25 | 48.59 | 0.25 | ||
| Palaemonidae | Palaemonetes spp. | 1.03 | 1.03 | 100.00 | 1.03 | 100.00 | 1.03 | ||
| Panopeidae | Unidentified | 9.79 | 7.71 | 78.70 | 6.79 | 69.34 | 7.25 | ||
| Penaeidae | 3.10 | 2.10 | 67.86 | 2.30 | 74.35 | 2.20 | |||
| Farfantepenaeus aztecus | 2.58 | 1.76 | 68.10 | 2.02 | 78.48 | 1.89 | |||
| Litopenaeus setiferus | 0.52 | 0.34 | 66.67 | 0.28 | 53.70 | 0.31 | |||
| Pinnotheridae | Austinixa behreae * | 0.52 | 0.52 | 100.00 | 0.52 | 100.00 | 0.52 | ||
| Portunidae | 10.83 | 7.51 | 72.80 | 7.42 | 72.02 | 7.46 | |||
| Callinectes sapidus | 6.70 | 5.07 | 75.60 | 5.21 | 77.80 | 5.14 | |||
| Callinectes similis | 3.61 | 2.18 | 60.37 | 2.07 | 57.33 | 2.12 | |||
| Portunus gibbesii * | 0.52 | 0.26 | 50.00 | 0.14 | 27.56 | 0.20 | |||
| Sergestidae | Unidentified | 1.03 | 0.97 | 94.05 | 0.39 | 38.24 | 0.68 | ||
| Unidentified | Brachyura spp. | 7.73 | 6.70 | 86.70 | 6.90 | 89.20 | 6.80 | ||
| Unidentified | Dendrobranchiata spp. | 2.58 | 2.32 | 90.00 | 2.34 | 90.87 | 2.33 | ||
| Unidentified | Unidentified invertebrate | 21.13 | 19.20 | 90.84 | 19.27 | 91.19 | 19.23 | ||
| Stomatopoda | Squillidae | Squilla spp. | 5.67 | 5.15 | 90.91 | 5.34 | 94.12 | 5.25 | |
| Gastropoda | Neotaenioglossa | Naticidae | Sinum perspectivum | 6.70 | 4.59 | 68.54 | 4.18 | 62.30 | 4.38 |
| Actinopterygii | 18.56 | 32.43 | 79.76 | 34.81 | 87.56 | 15.52 | |||
| Anguilliformes | Ophichthidae | Myrophis punctatus * | 0.52 | 0.52 | 100.00 | 0.52 | 100.00 | 0.52 | |
| Clupeiformes | 4.64 | 5.84 | 79.53 | 5.79 | 79.74 | 3.61 | |||
| Clupeidae | Brevoortia patronus | 2.06 | 1.20 | 58.33 | 1.61 | 77.92 | 1.40 | ||
| Engraulidae | 2.58 | 2.32 | 90.00 | 2.09 | 81.20 | 2.21 | |||
| Anchoa mitchilli | 2.06 | 2.06 | 100.00 | 2.06 | 100.00 | 2.06 | |||
| Anchoa hepsetus | 0.52 | 0.26 | 50.00 | 0.03 | 5.99 | 0.14 | |||
| Gobiiformes | Gobiidae | Gobiosoma bosc | 0.52 | 0.26 | 50.00 | 0.34 | 66.67 | 0.30 | |
| Perciformes | Serranidae | Diplectrum bivittatum * | 1.03 | 1.03 | 100.00 | 1.03 | 100.00 | 1.03 | |
| Sciaeniformes | Sciaenidae | 3.09 | 2.06 | 66.67 | 2.63 | 84.75 | 2.34 | ||
| Micropogonias undulatus | 2.58 | 1.80 | 70.00 | 2.26 | 87.53 | 2.03 | |||
| Menticirrhus americanus | 0.52 | 0.26 | 50.00 | 0.37 | 70.88 | 0.31 | |||
| Unidentified | 9.28 | 7.41 | 79.89 | 8.04 | 86.63 | 7.73 | |||
| Unidentified (fish) | 7.22 | 5.95 | 82.48 | 6.31 | 87.37 | 6.13 | |||
| Unidentified (bone) | 2.06 | 1.46 | 70.83 | 1.73 | 84.02 | 1.60 | |||
| Unknown | Unidentified | 3.61 | 2.15 | 59.52 | 2.05 | 56.93 | 2.10 |
| %N | %M | |||||||
|---|---|---|---|---|---|---|---|---|
| Model | Variable(s) | df | F | R2 | p | F | R2 | p |
| Single Variables | Total Length (binned) | 1 | 0.868 | 0.005 | 0.552 | 0.837 | 0.004 | 0.600 |
| Location | 7 | 2.984 | 0.114 | <0.001 | 2.831 | 0.108 | <0.001 | |
| Season | 2 | 1.114 | 0.012 | 0.301 | 1.130 | 0.012 | 0.282 | |
| Mass | 1 | 0.948 | 0.005 | 0.602 | 0.939 | 0.005 | 0.624 | |
| Year | 4 | 1.658 | 0.034 | 0.007 | 1.657 | 0.034 | 0.007 | |
| Interactions | Total Length (binned) × Location | 5 | 0.924 | 0.025 | 0.657 | 0.940 | 0.026 | 0.623 |
| Total Length (binned) × Season | 2 | 1.782 | 0.018 | 0.015 | 1.753 | 0.018 | 0.016 | |
| Total Length (binned) × Mass | 1 | 1.226 | 0.007 | 0.219 | 1.220 | 0.007 | 0.225 | |
| Total Length (binned) × Year | 2 | 1.178 | 0.012 | 0.229 | 1.185 | 0.012 | 0.219 | |
| Year × Location | 13 | 1.501 | 0.102 | <0.001 | 1.480 | 0.101 | 0.004 | |
| Year × Season | 2 | 0.968 | 0.010 | 0.503 | 0.971 | 0.010 | 0.503 | |
| Year × Mass | 4 | 1.613 | 0.034 | 0.005 | 1.547 | 0.032 | 0.011 | |
| Season × Location | 11 | 1.338 | 0.079 | 0.009 | 1.362 | 0.080 | 0.006 | |
| Season × Mass | 2 | 1.932 | 0.021 | 0.007 | 1.900 | 0.020 | 0.008 | |
| Location × Mass | 7 | 1.025 | 0.040 | 0.417 | 1.031 | 0.041 | 0.397 | |
| Final Model | Location | 7 | 3.051 | 0.113 | <0.001 | 2.894 | 0.108 | <0.001 |
| Season | 2 | 1.754 | 0.019 | 0.027 | 1.710 | 0.018 | 0.026 | |
| Mass | 1 | 1.694 | 0.009 | <0.001 | 1.667 | 0.009 | <0.001 | |
| Year | 4 | 1.914 | 0.041 | 0.001 | 1.935 | 0.041 | <0.001 | |
| Year × Location | 12 | 1.445 | 0.092 | <0.001 | 1.424 | 0.091 | <0.001 | |
| Residuals | 137 | 0.273 | 0.268 | |||||
| Class | Order | Family | Species | %FO | %N | %PN | %M | %PM | %PSIRI |
|---|---|---|---|---|---|---|---|---|---|
| Vegetation (Misc.) | Unidentified | 1.80 | 0.93 | 51.67 | 0.85 | 47.33 | 0.89 | ||
| Unknown | Unidentified worm | 0.36 | 0.18 | 50.00 | 0.21 | 57.09 | 0.19 | ||
| Hydrozoa | Hydrozoan sp. | 0.36 | 0.18 | 50.00 | 0.18 | 50.00 | 0.18 | ||
| Sipunculidea | Golfingiida | Sipunculidae | Xenosiphon sp. | 0.36 | 0.21 | 57.14 | 0.33 | 92.49 | 0.27 |
| Polychaeta | 0.72 | 0.90 | 100.00 | 0.90 | 100.00 | 0.72 | |||
| Leptothecata | Hydrozoan sp. | 0.36 | 0.18 | 50.00 | 0.18 | 50.00 | 0.18 | ||
| Phyllodocida | Nereididae | Alitta succinea * | 0.36 | 0.36 | 100.00 | 0.36 | 100.00 | 0.36 | |
| Spionida | Paraprionospio | Paraprionospio pinnata * | 0.36 | 0.36 | 100.00 | 0.36 | 100.00 | 0.36 | |
| Insecta | Coleoptera | Unidentified beetle | 0.36 | 0.36 | 100.00 | 0.36 | 100.00 | 0.36 | |
| Gastropoda | 1.44 | 9.72 | 56.25 | 2.45 | 32.43 | 0.64 | |||
| Littorinimorpha | Littorinidae | Littoraria irrorata | 0.72 | 0.54 | 75.00 | 0.43 | 59.17 | 0.48 | |
| Neotaenioglossa | Naticidae | Sinum perspectivum | 0.36 | 0.18 | 50.00 | 2.00 | 4.65 | 0.10 | |
| Unidentified | Unidentified gastrodpod | 0.36 | 9.00 | 25.00 | 0.02 | 6.71 | 0.06 | ||
| Malacostraca | 36.69 | 29.27 | 79.74 | 28.35 | 77.29 | 28.81 | |||
| Decapoda | 35.61 | 28.31 | 79.48 | 27.50 | 77.23 | 27.90 | |||
| Alpheidae | Alpheus heterochaelis | 2.52 | 2.22 | 88.07 | 2.10 | 83.34 | 2.16 | ||
| Callianassidae | Lepidophthalmus louisianensis | 1.80 | 1.80 | 100.00 | 1.80 | 100.00 | 1.80 | ||
| Diogenidae | Clibanarius vittatus | 1.08 | 0.58 | 54.17 | 0.76 | 70.53 | 0.67 | ||
| Hippidae | Emerita benedicti | 0.36 | 0.18 | 50.00 | 0.04 | 11.32 | 0.11 | ||
| Penaeidae | 16.19 | 13.02 | 80.40 | 12.78 | 78.96 | 12.90 | |||
| Farfantepenaeus aztecus | 9.35 | 7.62 | 81.46 | 7.37 | 78.83 | 7.50 | |||
| Farfantepenaeus duorarum * | 0.72 | 0.54 | 75.00 | 0.54 | 75.00 | 0.54 | |||
| Litopenaeus setiferus | 6.12 | 4.86 | 79.41 | 4.87 | 79.63 | 4.86 | |||
| Portunidae | 8.99 | 6.21 | 69.04 | 5.83 | 64.86 | 6.02 | |||
| Callinectes sapidus | 5.76 | 4.87 | 84.58 | 4.61 | 80.01 | 4.74 | |||
| Callinectes similis | 2.88 | 1.16 | 40.33 | 1.00 | 34.86 | 1.08 | |||
| Portunus gibbesii | 0.36 | 0.18 | 50.00 | 0.22 | 62.50 | 0.20 | |||
| Sergestidae | Unidentified | 0.36 | 0.36 | 100.00 | 0.36 | 100.00 | 0.36 | ||
| Unidentified | Brachyura spp. | 3.24 | 2.19 | 67.59 | 2.34 | 72.34 | 2.27 | ||
| Unidentified invertebrate | 2.25 | 1.45 | 57.65 | 1.42 | 56.38 | 1.44 | |||
| Unidentified shrimp | Dendrobranchiata spp. | 0.72 | 0.30 | 41.67 | 0.07 | 9.54 | 0.18 | ||
| Isopoda | Unidentified isopod | 0.72 | 0.54 | 75.00 | 0.40 | 55.60 | 0.47 | ||
| Stomatopoda | Squillidae | Squilla spp. | 1.08 | 0.42 | 38.49 | 0.45 | 42.14 | 0.44 | |
| Cephalopoda | Myopsina | Loliginidae | Lolliguncula brevis | 0.72 | 0.27 | 37.50 | 0.19 | 26.56 | 0.23 |
| Actinopterygii | 74.10 | 90.82 | 89.93 | 92.74 | 91.61 | 67.26 | |||
| Anguilliformes | Ophichthidae | 3.60 | 2.59 | 71.90 | 2.19 | 60.98 | 2.39 | ||
| Bascanichthys scuticaris * | 1.80 | 1.21 | 67.14 | 1.07 | 59.68 | 1.14 | |||
| Myrophis punctatus * | 1.80 | 1.38 | 76.67 | 1.12 | 62.27 | 1.25 | |||
| Atheriniformes | Atherinopsidae | Membras martinica | 0.72 | 0.25 | 35.00 | 0.30 | 41.02 | 0.27 | |
| Aulopiformes | Synodontidae | Synodus foetens * | 0.36 | 0.10 | 28.57 | 0.04 | 10.84 | 0.07 | |
| Beloniformes | Hemiramphidae | Hyporhamphus unifasciatus * | 0.36 | 0.18 | 50.00 | 0.34 | 93.35 | 0.26 | |
| Blenniiformes | Gobiesocidae | Gobiesox strumosus * | 0.36 | 0.12 | 33.33 | 0.16 | 45.26 | 0.14 | |
| Carangiformes | Carangidae | 2.16 | 1.98 | 91.67 | 1.82 | 84.19 | 1.90 | ||
| Chloroscombrus chrysurus * | 1.80 | 1.62 | 90.00 | 1.46 | 81.03 | 1.54 | |||
| Hemicaranx amblyrhynchus * | 0.36 | 0.36 | 100.00 | 0.36 | 100.00 | 0.36 | |||
| Clupeiformes | 26.62 | 45.56 | 85.56 | 47.46 | 89.15 | 23.25 | |||
| Clupeidae | 18.71 | 15.54 | 83.08 | 16.56 | 88.56 | 16.05 | |||
| Brevoortia patronus | 14.39 | 12.00 | 83.42 | 12.76 | 88.71 | 12.38 | |||
| Dorosoma petenense * | 0.72 | 0.72 | 100.00 | 0.72 | 100.00 | 0.72 | |||
| Harengula jaguana * | 3.60 | 2.82 | 78.33 | 3.08 | 85.69 | 2.95 | |||
| Engraulidae | 8.27 | 7.24 | 87.46 | 7.17 | 86.62 | 7.20 | |||
| Anchoa hepsetus | 1.80 | 1.38 | 76.67 | 1.37 | 75.79 | 1.37 | |||
| Anchoa lyolepis * | 0.72 | 0.72 | 100.00 | 0.72 | 100.00 | 0.72 | |||
| Anchoa mitchilli | 5.76 | 5.14 | 89.27 | 5.08 | 88.28 | 5.11 | |||
| Gobiiformes | 2.16 | 3.12 | 80.56 | 2.64 | 69.33 | 1.62 | |||
| Eleotridae | Erotelis smaragdus * | 0.36 | 0.36 | 100.00 | 0.36 | 100.00 | 0.36 | ||
| Gobiidae | 1.80 | 1.38 | 76.67 | 1.14 | 63.20 | 1.26 | |||
| Gobionellus oceanicus * | 0.36 | 0.36 | 100.00 | 0.36 | 100.00 | 0.36 | |||
| Microdesmus longipinnis * | 1.44 | 1.02 | 70.83 | 0.78 | 54.00 | 0.90 | |||
| Mugiliformes | Mugilidae | Mugil cephalus | 0.72 | 0.48 | 66.67 | 0.43 | 60.22 | 0.46 | |
| Sciaeniformes | Sciaenidae | 16.55 | 13.03 | 78.72 | 14.22 | 85.97 | 13.62 | ||
| Bairdiella chrysoura | 1.08 | 1.08 | 100.00 | 1.08 | 100.00 | 1.08 | |||
| Cynoscion arenarius | 1.08 | 1.08 | 100.00 | 1.08 | 100.00 | 1.08 | |||
| Larimus fasciatus | 1.44 | 0.81 | 56.25 | 0.83 | 57.96 | 0.82 | |||
| Leiostomus xanthurus | 3.24 | 2.31 | 71.30 | 2.59 | 80.05 | 2.45 | |||
| Micropogonias undulatus | 9.35 | 7.39 | 79.01 | 8.28 | 88.54 | 7.84 | |||
| Stellifer lanceolatus * | 0.36 | 0.36 | 100.00 | 0.36 | 100.00 | 0.36 | |||
| Perciformes | Serranidae | Centropristis philadelphica * | 0.36 | 0.09 | 25.00 | 0.24 | 65.34 | 0.16 | |
| Pleuronectiformes | 1.80 | 1.29 | 71.67 | 1.28 | 70.87 | 1.28 | |||
| Achiridae | Trinectes maculatus * | 0.72 | 0.48 | 66.67 | 0.42 | 58.15 | 0.45 | ||
| Paralichthyidae | Etropus crossotus * | 1.08 | 0.81 | 75.00 | 0.86 | 79.35 | 0.83 | ||
| Scombriformes | Trichiuridae | Trichiurus lepturus | 3.60 | 2.82 | 78.33 | 2.61 | 72.69 | 2.72 | |
| Scorpaeniformes | Triglidae | Prionotus scitulus * | 0.36 | 0.05 | 14.29 | 0.00 | 1.14 | 0.03 | |
| Siluriformes | Ariidae | 6.83 | 6.18 | 90.35 | 6.49 | 94.99 | 6.33 | ||
| Ariopsis felis | 3.60 | 3.18 | 88.33 | 3.27 | 90.88 | 3.22 | |||
| Bagre marinus | 1.08 | 0.84 | 77.78 | 1.06 | 98.68 | 0.95 | |||
| Unidentified catfish | 2.16 | 2.16 | 100.00 | 2.16 | 100.00 | 2.16 | |||
| Spariformes | Sparidae | Lagodon rhomboides | 0.36 | 0.03 | 7.14 | 0.01 | 3.97 | 0.02 | |
| Unidentified | 16.91 | 12.95 | 76.62 | 12.51 | 74.00 | 12.63 | |||
| Unidentified (fish) | 16.55 | 12.77 | 77.20 | 12.48 | 75.45 | 12.63 | |||
| Unidentified (scales) | 0.36 | 0.18 | 50.00 | 0.03 | 7.35 | 0.10 | |||
| Unknown | Unidentified | 0.72 | 0.45 | 62.50 | 0.45 | 63.05 | 0.45 |
| %N | %M | |||||||
|---|---|---|---|---|---|---|---|---|
| Model | Variable(s) | df | F | R2 | p | F | R2 | p |
| Single Variables | Total Length (binned) | 1 | 3.446 | 0.012 | 0.006 | 3.540 | 0.013 | 0.004 |
| Location | 7 | 1.839 | 0.056 | 0.003 | 1.769 | 0.054 | 0.006 | |
| Mass | 1 | 3.082 | 0.011 | 0.007 | 3.227 | 0.012 | 0.008 | |
| Year | 4 | 1.195 | 0.017 | 0.218 | 1.309 | 0.019 | 0.126 | |
| Interactions | Total Length (binned) × Location | 4 | 2.099 | 0.036 | 0.002 | 2.206 | 0.038 | 0.002 |
| Total Length (binned) × Mass | 1 | 3.023 | 0.011 | 0.012 | 3.531 | 0.013 | 0.004 | |
| Total Length (binned) × Year | 2 | 0.915 | 0.007 | 0.574 | 0.900 | 0.006 | 0.583 | |
| Location × Mass | 7 | 1.357 | 0.041 | 0.076 | 1.400 | 0.042 | 0.064 | |
| Location × Year | 12 | 1.015 | 0.053 | 0.443 | 0.994 | 0.052 | 0.489 | |
| Mass × Year | 3 | 0.770 | 0.008 | 0.733 | 0.734 | 0.008 | 0.776 | |
| Final Model | Total Length (binned) | 1 | 3.671 | 0.016 | 0.004 | 3.786 | 0.016 | 0.003 |
| Location | 7 | 1.539 | 0.046 | 0.026 | 1.464 | 0.044 | 0.042 | |
| Total Length (binned) × Location | 4 | 2.100 | 0.036 | 0.001 | 2.206 | 0.038 | 0.001 | |
| Residuals | 212 | 0.097 | 0.097 | |||||
Disclaimer/Publisher’s Note: The statements, opinions and data contained in all publications are solely those of the individual author(s) and contributor(s) and not of MDPI and/or the editor(s). MDPI and/or the editor(s) disclaim responsibility for any injury to people or property resulting from any ideas, methods, instructions or products referred to in the content. |
© 2023 by the authors. Licensee MDPI, Basel, Switzerland. This article is an open access article distributed under the terms and conditions of the Creative Commons Attribution (CC BY) license (https://creativecommons.org/licenses/by/4.0/).
Share and Cite
Osowski, A.R.; Jargowsky, M.B.; Cooper, P.T.; Powers, S.P.; Drymon, J.M. Dietary Habits of Hardhead (Ariopsis felis) and Gafftopsail (Bagre marinus) Catfish Revealed through DNA Barcoding of Stomach Contents. Fishes 2023, 8, 539. https://doi.org/10.3390/fishes8110539
Osowski AR, Jargowsky MB, Cooper PT, Powers SP, Drymon JM. Dietary Habits of Hardhead (Ariopsis felis) and Gafftopsail (Bagre marinus) Catfish Revealed through DNA Barcoding of Stomach Contents. Fishes. 2023; 8(11):539. https://doi.org/10.3390/fishes8110539
Chicago/Turabian StyleOsowski, Ana R., Matthew B. Jargowsky, Pearce T. Cooper, Sean P. Powers, and J. Marcus Drymon. 2023. "Dietary Habits of Hardhead (Ariopsis felis) and Gafftopsail (Bagre marinus) Catfish Revealed through DNA Barcoding of Stomach Contents" Fishes 8, no. 11: 539. https://doi.org/10.3390/fishes8110539
APA StyleOsowski, A. R., Jargowsky, M. B., Cooper, P. T., Powers, S. P., & Drymon, J. M. (2023). Dietary Habits of Hardhead (Ariopsis felis) and Gafftopsail (Bagre marinus) Catfish Revealed through DNA Barcoding of Stomach Contents. Fishes, 8(11), 539. https://doi.org/10.3390/fishes8110539