Article

Dynamic Evolution and Convergence Analysis of the Ecological Efficiency of China’s Fisheries

1
Institute of Strategic Planning, Shandong Academy of Macroeconomic Research, Jinan 250014, China
2
School of Economics and Management (School of Tourism), Dalian University, Dalian 116622, China
3
School of Marine Law and Humanities, Dalian Ocean University, Dalian 116023, China
4
School of Economics and Management, Dalian Ocean University, Dalian 116023, China
*
Author to whom correspondence should be addressed.
Fishes 2023, 8(10), 499; https://doi.org/10.3390/fishes8100499
Submission received: 14 August 2023 / Revised: 2 October 2023 / Accepted: 3 October 2023 / Published: 6 October 2023
(This article belongs to the Special Issue Economics of Fish Farms and the Impact Marketing)

Abstract

:
The dynamic evolution and regional heterogeneity of fishery efficiency development must be explored from an ecological perspective to reveal the spatial pattern of fishery ecological efficiency. Thus, taking 30 provinces/cities in China between 2006 and 2020 as research objects, we measured the level of the fishery ecological efficiency and regional fishery ecological efficiency convergence indexes using the superefficiency and convergence indexes, respectively. We found the following: (1) The ecological efficiency of China’s fishery shows a wavelike upward trend with significant fluctuations, but the overall efficiency level is not high. (2) The development of regional fishery ecological efficiency is not well coordinated; however, the variation curve of fishery ecological efficiency in the eastern and central regions is gradually decreasing. (3) A trend of “catching up and surpassing” is observed in the development of fishery ecological efficiency in various regions of China, and regional fishery ecological efficiency gradually converges to the regions’ respective steady-state levels over time. The results indicate a significant gap in regional fishery ecological efficiency, as well as polarization; areas with lower fishery efficiency are catching up with high-efficiency areas at different speeds, and regional fishery ecological efficiency is stabilizing.
Key Contribution: This paper analyzes the dynamic evolution characteristics and regional heterogeneity of fishery ecological efficiency under carbon emission constraints and clarifies the convergence state and speed of regional fishery ecological efficiency.

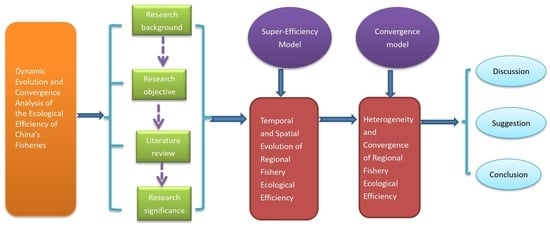
Graphical Abstract

1. Introduction and Literature Review

1.1. Introduction

The fishery is an important industry for global economic development, so its sustainable and healthy development is crucial for improving dietary structure, ensuring food security, promoting economic development and stabilizing social employment. According to the report The State of World Fisheries and Aquaculture 2022, released by the Food and Agriculture Organization of the United Nations, owing to the growth of aquaculture globally, particularly the Asian aquaculture industry, the total production of fisheries and aquaculture increased to a historical high of 214 million tons in 2020, with a production value of approximately $424 billion. The growth of fisheries and aquaculture plays a crucial role in eradicating hunger, poverty, and malnutrition globally. The primary sectors of fisheries and aquaculture have employed 58.5 million people [1]. Countries worldwide are accelerating the implementation of fishery economy development strategies, incorporating improving fishery efficiency into national food system policies and plans, actively adjusting fishery management systems, expanding the scale of the fishery economy, and and enhancing the comprehensive strength of the fishery economy. However, with the frequent occurrence of events such as “black swans” and “gray rhinoceroses” and the low-quality, disorderly, and extensive development of traditional fisheries, the development of the fishery economy is facing multiple crises.
In 2022, the Intergovernmental Panel on Climate Change explicitly stated in Climate Change 2022: Impacts, Adaptation, and Vulnerability that “climate change has caused serious damage to terrestrial, freshwater, coastal, and marine ecosystems, with approximately half of the world’s species migrating to the poles or higher altitudes, resulting in a degradation of ecosystem structure, function, and natural adaptability” [2].
Factors such as resource depletion, climate change, and environmental pollution have weakened the resilience of the fishery economy, reducing its input-output ratio and even threatening food safety. Among them, China’s average annual economic losses from industrial waste, pesticide pollution, plastic waste, and the destruction of fishing habitats caused by engineering construction amount to several hundred million US dollars. Moreover, the low quality, high energy consumption, and high emission development of the fishery economy have led to an increase in unexpected outputs such as increased ecological fragility, increased carbon emissions, and a sharp decline in biodiversity, bringing many negative impacts on the ecological development of the fishery. For example, the backwardness of aquaculture and production methods in fisheries leads to water eutrophication, overfishing in fisheries sharply reduces the amount of fishery biological resources, and fishery pollution accidents lower the ecological benefits of fisheries. These issues seriously constrain the sustainable development of the fishery economy and the restoration of ecosystem structure and function. Therefore, adhering to the concept of green ecological development, implementing an intensive and circular development model, accelerating the “blue transformation” of fisheries, and improving the ecological efficiency of fisheries have become urgent needs for the sustainable development of fisheries economies in various countries around the world.

1.2. Literature Review

At present, research on fishery efficiency in China and abroad mainly focuses on aspects including the evolution of marine fishery ecological efficiency, evaluation and influencing factors of marine fishery economic efficiency, and carbon emission efficiency of the fishery economy. Many methods, such as the super efficiency DEA model, non-expected output (SBM) model, and Malmquist index, are used to calculate the efficiency relationship between fishery production factors and expected output, such as the superefficient DEA model, unexpected output (SBM) model, and Malmquist index. In terms of the evolution of ecological efficiency in marine fisheries, ecological efficiency refers to “creating more value with less impact”, which means “creating more value with fewer resources”. The improvement in ecological efficiency can be seen as maximizing economic benefits and minimizing resource consumption and waste pollution [3]. System efficiency studies mainly focus on the measurement of energy efficiency, namely the single-factor energy efficiency (SFEE) and total-factor energy efficiency (TFEE), which play an important role in the green economy [4]. Moreover, the development of integrated ecological-economic fisheries models (IEEFMs) has increased over the past two decades. For example, Nielsen et al. presented a global review and comparative evaluation of 35 IEEFMs applied to marine fisheries and marine ecosystem resources to identify the characteristics that determine their usefulness, effectiveness, and implementation [5]. Currently, research on ecological efficiency is broadly divided into three dimensions: Decompose ecological efficiency into resource efficiency and environmental efficiency and conduct research on one of the sub-sectors separately; or consider ecological efficiency as a whole and study its changing trends and major influencing factors [6]. Zenglin et al. evaluated the sustainable development level of China’s marine ecological economy, and the results show that the overall sustainability of marine ecological economy development is better, but localized problems remain, i.e., excessive environmental loading rates and a low ecological carrying capacity [7,8]. Jianyue and Qi used the difference between the added value of mariculture and the economic losses caused by environmental pollution as a green output indicator for mariculture, and they calculated the green technology efficiency of China’s mariculture industry [9]. Lu et al. studied the level and regional convergence of green growth in marine fisheries under environmental constraints in China and confirmed that China’s marine fishery economy belongs to the rough economy. The growth rate of green total factor productivity in most provinces and cities is far lower than the GDP growth rate of marine fisheries [10]. In terms of fishery economic efficiency evaluation and influencing factors, Fuentes R pointed out that the DEA model has become one of the most commonly used models for efficiency evaluation, both domestically and internationally, owing to its advantages of fewer evaluation indicators, accurate evaluation results, and less loss of original information of indicators. It is widely used in fishery economic efficiency evaluation [11]. Moreover, Tone pointed out that the superefficient SBM model can effectively solve the problem of multiple DMUs with an efficiency of 1 and has been widely used [12]. Eggert et al. measured the economic efficiency of fisheries in three different regions (Iceland, Norway, and Sweden) and analyzed the dynamic evolution of the fisheries’ economic efficiency in different regions [13]. Similarly, Yufei pointed out that the evaluation of the economic efficiency of marine fisheries refers to the evaluation of the efficiency of resource conversion and utilization between the investment of relevant marine fishery resource elements (e.g., labor, capital, land) in a coastal area and the output of marine fishery economic benefits [14]. Wang and Ji evaluated the efficiency of mariculture with undesired outputs based on the DEA model using the Seiford linear transformation method, and the research results show that the convenience and level of technology promotion have a positive impact on aquaculture efficiency [15]. Further, Zhanglei et al. analyzed the total factor production efficiency and convergence of marine fisheries in 11 coastal provinces and cities in China [16]. Kang analyzed the economic efficiency of marine fisheries in China’s coastal areas from two dimensions, time and space, and concluded that the environmental carrying capacity of marine fisheries resources is approaching or reaching its limit and that there is an urgent need to improve the economic efficiency of marine fisheries [17]. In terms of carbon emission efficiency in the fishery economy, the concept of carbon emission efficiency was first introduced by Kaya et al. [18]. Goldemberg et al. evaluated carbon emissions in developing countries via carbon indices [19]. Beatriz et al. argued that fishery technology and marine management affect the efficiency of fisheries [20]. Based on the perspective of pollutant emissions, Martinezcordero and Leung used the total output value of mariculture as the expected output indicator and the nitrogen and phosphorus pollution output as the unexpected output indicator to calculate the green efficiency of mariculture [21]. Moreover, Ziegler et al. pointed out the importance of fishermen for energy conservation and emission reduction in fisheries, positing that training fishermen on environmental issues is crucial for improving fishery environmental efficiency [22]. Gliber took the Sulu Sea in the Philippines as an example to stimulate algae to sequester carbon by adding urea, emphasizing that in terms of using organisms for “carbon sequestration”, attention should also be paid to the feasibility and environmental costs of the method [23]. Later, Bing et al. calculated fishery carbon emissions based on the fuel consumption coefficient of fishing vessels and the year-end power data of fishing vessels [24]. Guanghui et al. used the Kaya GLMDI model and Tapio decoupling model based on parameter adjustment to calculate the driving factors of carbon emissions in China’s fishery economy and the decoupling relationship between carbon emissions and the fishery economy [25]. Qianbin et al. established a dynamic model of carbon emissions from marine fisheries using system dynamics methods, pointing out that economic development, energy, and industrial structure adjustments can affect the level of carbon emissions from marine fisheries [26]. Additionally, Chuantang et al. used the DEA model to calculate the production efficiency of marine fisheries in Fujian and Taiwan and combined it with the Tobit model to analyze the impact of the per-capita aquaculture area, fishery disasters, economic development level, average ship tonnage, fishery scale, fishing intensity, and aquaculture intensification on fishery production efficiency [27]. Xiaolong et al. calculated the carbon emissions and spatiotemporal distribution characteristics of marine fisheries by constructing a carbon emission model. They used the marine fisheries carbon emission index to explore the potential for carbon reduction and attempted to explore the carbon emission patterns of China’s marine fisheries [28]. Fisheries have changed the allocation of fish and now take place in the deep oceans. While growing populations and rising affluence have increased global demand for fish, the increasing abundance of fish from epipelagic oceans has pushed industrial fisheries further away from home ports and markets [29].This review paper will highlight the mesopelagic zone function, asking whether the deep-sea fishery can be sustainable and able to foster food and nutrition security, carrying improved livelihoods all around the world–and, above all, empowering vulnerable people in developing countries [30].
By reviewing the above literature, it can be seen that various methods have been used to comprehensively study fishery efficiency from multiple perspectives, such as the economy, environment, technology, and industrial structure, both domestically and internationally. These achievements provide an important theoretical basis and research methods for this paper. However, these studies mostly focus on the perspective of marine fishery efficiency, total factor production efficiency of fisheries, and carbon emission efficiency, leaving omissions and areas that need to be deepened. Specifically, what is the state of fishery ecological efficiency under carbon emission constraints, and what are the dynamic evolution characteristics and patterns? Is there coordination and heterogeneity in the development of regional fishery ecological efficiency? How can we ensure the maximization of fishery economic efficiency without losing ecological benefits? Deepening the analysis of these issues is an important issue that urgently needs to be addressed in the development of fisheries in various countries worldwide. It is of important theoretical and practical value in reversing the traditional “high-input, low-output” development pattern in fisheries. In view of this, this paper explores the dynamic evolution and regional heterogeneity of fishery efficiency development from an ecological perspective to reveal the spatial pattern of fishery ecological efficiency, grasp the development laws of regional fishery ecological efficiency, and provide a research framework and reference suggestions for the sustainable development of the regional fishery economy. We make contributions in the following aspects: First, a fishery ecological efficiency evaluation system is constructed using fishery carbon emissions and fishery disaster losses as unexpected outputs, enriching the connotation of fishery ecological efficiency. Second, the dynamic evolution law and operational mechanism of fishery ecological efficiency are revealed, and the differences and convergence of regional fishery ecological efficiency are explored from the perspective of regional development. Third, taking Chinese fisheries as the research object, we use the superefficient SBM model to calculate its fishery ecological efficiency and analyze the spatiotemporal changes in fishery ecological efficiency and regional coordination. The research results can serve as a typical case, providing theoretical reference and decision-making support for other countries and regions to formulate high-quality fishery development policies.

2. Study Design and Methods

2.1. Study Area

We selected 30 provinces/cities in China as the research object. We use relevant data to measure the fishery ecological efficiency of these provinces and cities and focus on exploring the dynamic evolution and regional convergence of China’s fishery ecological efficiency. The study period is 2006–2021. The data sources include the China Fisheries Statistical Yearbook (2006–2021), China Statistical Yearbook (2006–2021), and China Energy Statistical Yearbook (2006–2021). Missing data are obtained using linear interpolation or are calculated by the authors (The National Bureau of Statistics of China divides the national economic zone into four major regions: the eastern region, which includes 10 provinces and cities, namely, Beijing, Tianjin, Shanghai, Jiangsu, Zhejiang, Fujian, Shandong, Hebei, Guangdong, and Hainan Province; the central region, which includes six provinces: Anhui, Jiangxi, Henan, Hubei, Hunan, and Shanxi; the western region, which includes 12 provinces and cities, namely, Inner Mongolia, Guangxi, Chongqing, Sichuan, Guizhou, Yunnan, Tibet, Shaanxi, Gansu, Qinghai, Ningxia, and Xinjiang. The northeast region includes three provinces: Heilongjiang, Jilin, and Liaoning).

2.2. Research Methods

2.2.1. Superefficiency Model

Traditional data envelopment models are mostly based on expected output and do not fully consider the redundancy and relaxation issues of input and output. When analyzing efficiency, it is impossible to distinguish the efficiency differences of multiple decision units with the same maximum efficiency value of 1, and limitations apply in the selection of regression models for analyzing influencing factors. Tone proposed the “Super SBM” model, which combines the advantages of the superefficient DEA model and the SBM model. Its optimal solution is dimensionless and allows the SBM efficiency value to be greater than 1. This not only solves the efficiency evaluation problem with unexpected outputs but also solves the problem of the evaluation unit located at the forefront (efficiency values greater than 1) that cannot be effectively distinguished. Relaxed variables are directly included in the objective function [12]. Fisheries are highly susceptible to uncertain risks, such as natural disasters and environmental pollution during the development process, resulting in negative impacts on fishery ecology, that is, unexpected outputs. Therefore, we adopt a non-radial Super-SBM model to measure the ecological efficiency of fisheries, and the specific expressions are given below.
ρ = min 1 + 1 z i = 1 z s i x / x i k 1 1 m + n ( r = 1 m s r y / y r k + h = 1 n s h b / b h k )
s . t . { j = 1 , j k N x i j λ j s i x x i k j = 1 , j k N y i j λ j + s r y y r k j = 1 , j k N b i j λ j s h b b h k 1 1 m + n ( r = 1 m s r y / y r k + h = 1 n s h b / b h k ) > 0 λ 0 , s i x 0 , s r y 0 , s h b 0 i = 1 , 2 , , z ; r = 1 , 2 , , m ; h = 1 , 2 , , n ; j = 1 , 2 , , n ; k = 1 , 2 , , K ;
In Equations (1) and (2), ρ represents the result of green superefficiency for fisheries ( ρ 0 ); x and y are input and output variables, respectively; z , m , and n are the number of indicators for inputs, expected outputs, and unexpected outputs, respectively; i , r , and h are input, expected output, and unexpected output types, respectively; s i x , and s h b are slack variables for input, desired output, and undesired output variables, respectively; λ j represents weight. The larger the ρ , the higher the green efficiency of fisheries in the province and city in that year, and vice versa.

2.2.2. Convergence Analysis Method

σ convergence: The direct concept of convergence refers to the process in which the dispersion decreases over time; that is, if the dispersion decreases, then σ convergence exists. If dispersion increases, then the σ convergence does not exist. This article uses σ convergence to reflect the dynamic process of the regional fishery ecological efficiency level deviating from the overall average level and its imbalance, and its expression is given by:
C V = i = 1 n ( y i y ¯ ) 2 n y ¯
In Equation (3), C V represents the coefficient of variation, y i represents the ecological efficiency of fisheries, y ¯ represents the average ecological efficiency of regional fisheries, and n represents the number of provinces and cities in the region. If C V is larger, the difference in fishery ecological efficiency is greater. Otherwise, the decrease in C V indicates a convergence of σ in fishery ecological efficiency.
β convergence: β convergence is mainly divided into absolute β convergence and conditional β convergence, based on different initial conditions. β convergence indicates a negative correlation between the growth rate of the research object and the initial level [31]. Among them, the absolute β convergence refers to the convergence phenomenon of fishery ecological efficiency within a region, even without controlling for influencing factors. Over time, relatively backward areas with higher growth rates will catch up with areas with higher efficiency and ultimately show a convergence trend of the same growth rate. Conditional β convergence refers to the convergence trend of fishery ecological efficiency development in different regions after controlling for a series of influencing factors, and it ultimately converges to the regions’ respective steady-state levels.
The absolute β convergence expression is as follows:
ln ( y i t + 1 y i t ) = α + β ln ( y i t ) + ε i t
The conditional β convergence expression is as follows:
ln ( y i t + 1 y i t ) = α + β ln ( y i t ) + δ ln x i t + ε i t
The convergence rate expression is as follows:
v = l n ( 1 + b ) / T
In Equations (4)–(6), y i t and y i t + 1 represent the ecological efficiency values of fisheries in the early and late stages, respectively. x i t represents the factors that affect the ecological efficiency of fisheries, ε i t represents a random disturbance term, v represents the convergence rate, and T represents the time span. If the estimated coefficient of β is negative and the regression coefficient is significant at the 1% level, the β -convergence exists in the ecological efficiency of fisheries; if not, no β convergence exists.

2.3. Index System Construction

To accurately measure the ecological efficiency of fisheries, we adhere to the principles of scientificity, pertinence, comprehensiveness, and accessibility to select input-output indicators for the ecological efficiency of fisheries. In the efficiency model, resources, labor, capital, and technology are the core production factors. Based on these indicators and drawing on existing research results, we construct a fishery ecological efficiency indicator system [32]. Among them, in terms of resource investment, the number of aquatic seedlings and aquaculture areas are selected to represent biological resource investment and land resource investment, respectively. In terms of capital investment, the year-end ownership of fishing vessels and the cost of aquatic technology promotion are selected to represent fixed capital investment and technical capital investment, respectively. We select the number of fishery employees as labor input. From the perspective of output, desirable output, and undesirable output are considered separately, with the desirable output selected as the total output value of the fishery economy to represent the ecological efficiency output. Undesirable output is generated along with desirable output, which is not beneficial to the overall goal of the ecological environment and does not meet expectations [33]. We select carbon emissions from fisheries and economic losses caused by fishery disasters as undesirable outputs. The specific indicators are shown in Table 1.

3. Result Analysis

3.1. Analysis of Spatiotemporal Evolution of Fishery Ecological Efficiency

According to Equations (1) and (2), MaxDEA software is used to calculate the ecological efficiency of fisheries, and the ecological efficiency of fisheries in the four major economic zones is analyzed. The results are shown in Figure 1. The overall ecological efficiency of China’s fisheries shows a wavelike upward trend, but the efficiency level is not high, and the fluctuation range is large. During the research period, the ecological efficiency value of fisheries fluctuated at around 0.8, and there is a 20% improvement compared to the production frontier, as can be seen in Figure 1.
In terms of time evolution, the ecological efficiency of fisheries shows a U-shaped development trend of first decreasing and then increasing between 2006 and 2018. This result is mainly due to China’s implementation of ecological civilization construction, acceleration of structural adjustment of the fisheries industry, and promotion of green and low-carbon development of fisheries. 2019 represents an important turning point, with significant fluctuations occurring between 2019 and 2021, resulting in a significant decline in the ecological efficiency of fisheries. This result is mainly due to the impact of the COVID-19 epidemic. The fishery has undergone tremendous changes in input and output, which has affected the ecological efficiency of the entire fishery industry and the quality of economic development. From the perspective of China’s four major economic regions, significant differences exist in fishery ecological efficiency between regions. Among them, the average ecological efficiency of fisheries in the eastern region is the highest, reaching 0.96, followed by the northeastern region, with an average ecological efficiency of 0.94; the central region, with an average ecological efficiency of 0.72; and the western region, with the lowest average ecological efficiency, only 0.61, far lower than the national average level of ecological efficiency of fisheries. Between 2006 and 2018, the ecological efficiency of fisheries in the western and central regions fluctuated slightly and showed an overall upward trend. The ecological efficiency value of fisheries in the western region fluctuates between 0.6 and 0.7, with the lowest ecological efficiency value in 2009, only 0.56. The ecological efficiency value of fisheries in the central region fluctuates around 0.7, with that in most years exceeding 0.7. The ecological efficiency of fisheries in the eastern and northeastern regions fluctuates significantly, with a V-shaped distribution overall. Among them, the ecological efficiency value of fisheries in the northeast region fluctuates between 0.8 and 1.2, with the highest ecological efficiency value of fisheries reaching 1.29 in 2016. The ecological efficiency value of fisheries in the eastern region fluctuates around 1, with the lowest ecological efficiency value in 2020, only 0.46. Throughout the research period, the ecological efficiency of China’s fisheries shows an increasing trend to varying degrees, indicating that the green and low-carbon development of fisheries has achieved initial results.
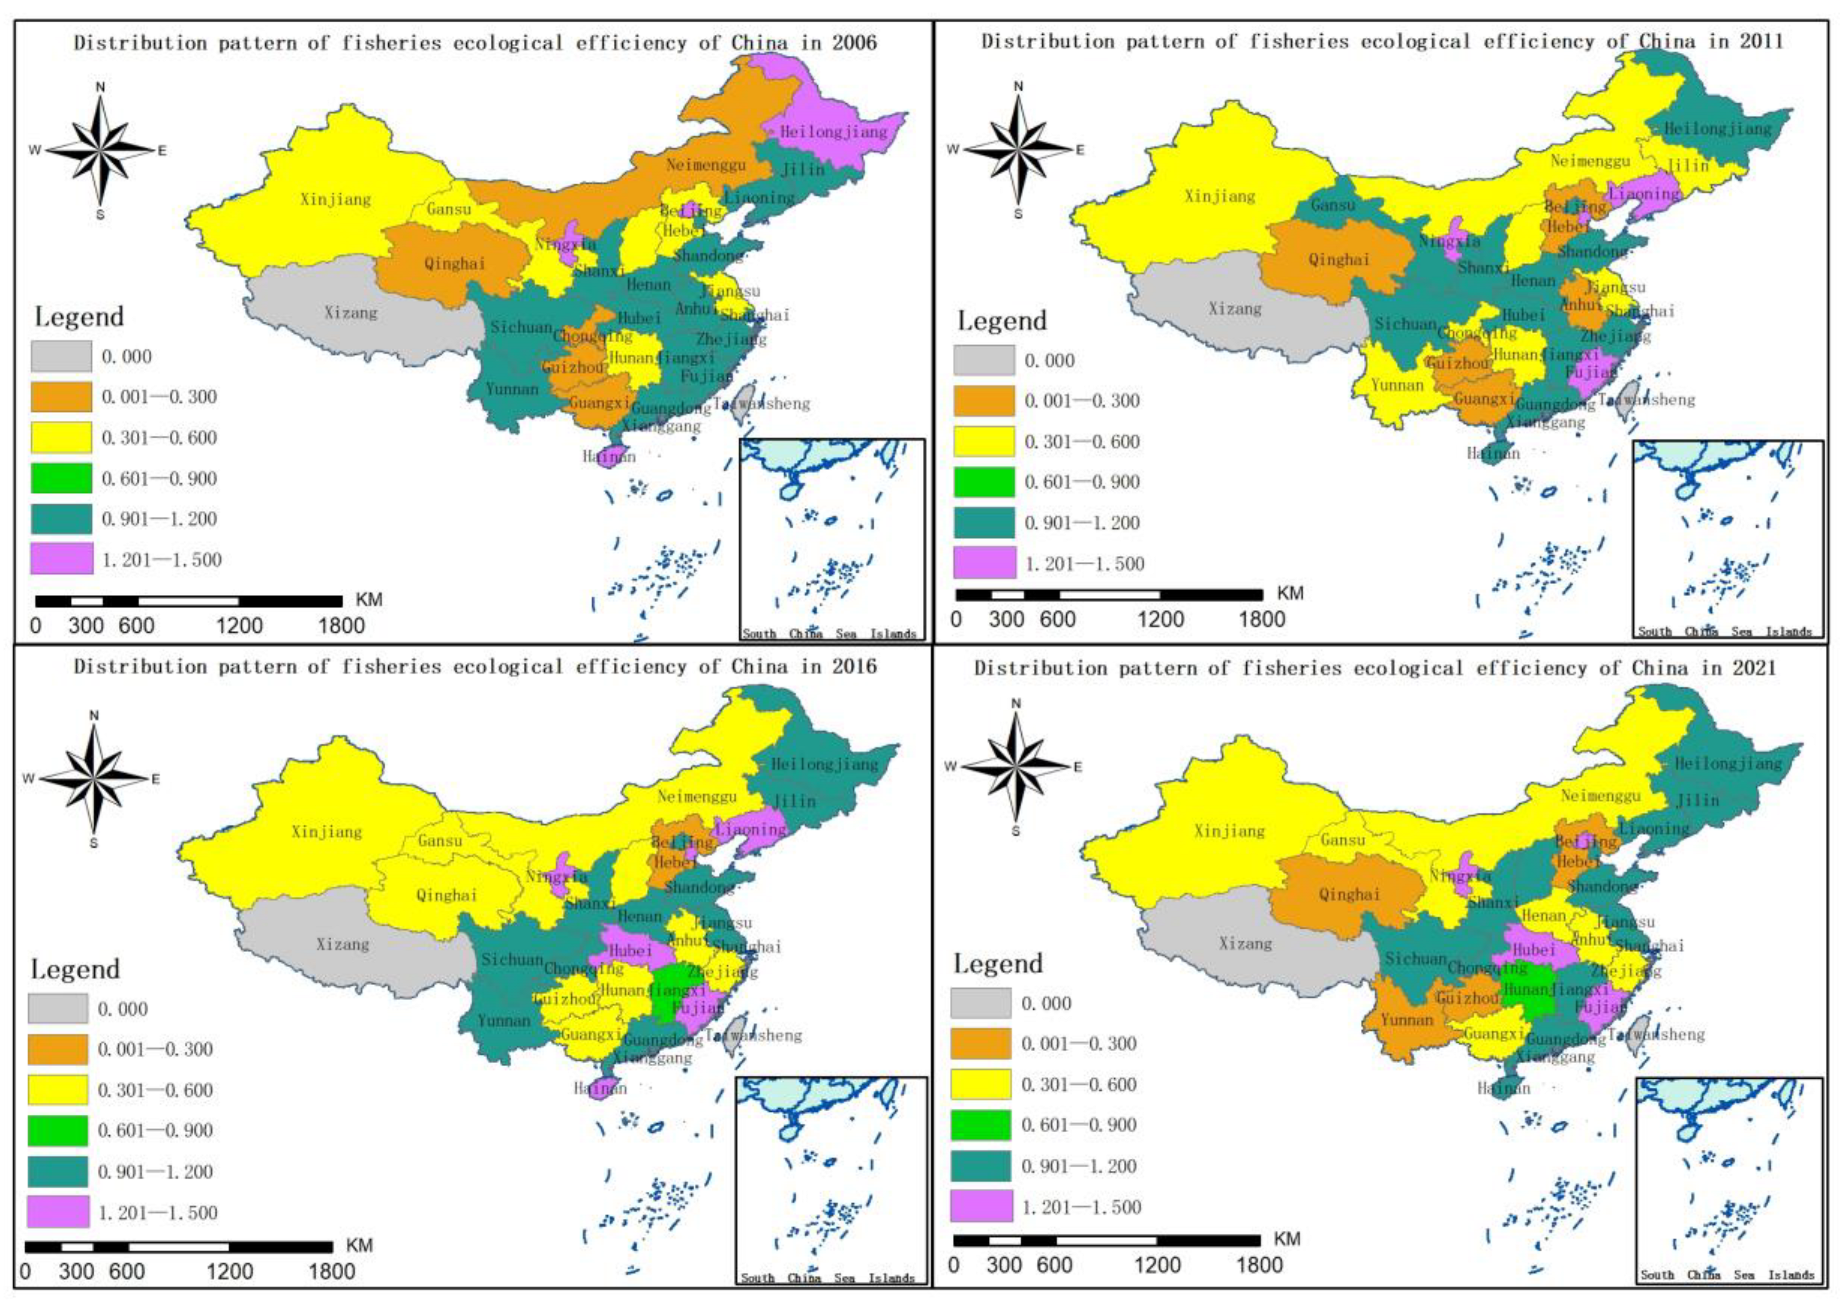
In terms of spatial evolution, to delineate the spatial evolution pattern of China’s fishery ecological efficiency more clearly, we use the natural breakpoint method to divide fishery ecological efficiency into five types (0.001–0.300, low efficiency; 0.301–0.600, medium-low efficiency; 0.601–0.900, medium efficiency; 0.901–1.200, medium-high efficiency; and 1.201–1.500, high efficiency). The typical years of fishery ecological efficiency are selected for plotting, as shown in Figure 2.
From the perspective of fishery ecological efficiency, the patterns are summarized as follows: (1) Low-efficiency category. In 2006, this category was divided into five provinces and cities: Neimenggu, Guangxi, Chongqing, Guizhou, and Qinghai. In 2011, Chongqing and Gansu were reduced, while Hebei and Anhui were added. In 2016, only Hebei was left. In 2021, Yunnan, Qinghai, and Guizhou were added, reaching four provinces and cities. From the spatial distribution pattern, it can be seen that most of the inefficient areas are provinces and cities in the western region. The main reason is that the western region represents an underdeveloped area in China, with a relatively backward fishery resource and technological level, along with relatively low ecological input and output in fisheries. (2) Medium-to-low efficiency category. In 2006, this category was established in six provinces: Xinjiang, Gansu, Shanxi, Hebei, Jiangsu, and Hunan. In 2011, Chongqing, Yunnan, Neimenggu, and Jilin were added, while Gansu and Hebei were reduced, reaching eight provinces and cities. In 2016, Gansu, Qinghai, Guangxi, Guizhou, Zhejiang, and Anhui were added, while Yunnan, Chongqing, Jiangsu, and Jilin were reduced, reaching 10 provinces and cities. In 2021, Henan was added, while Qinghai, Guizhou, Shanxi, and Hunan were reduced, reaching seven provinces and cities. This result indicates that the ecological efficiency of such fisheries is fluctuating greatly and is in a dynamic adjustment phase, transitioning toward a moderate efficiency level. (3) Medium efficiency category. In 2016, only Jiangxi achieved moderate efficiency. In 2021, Hunan also achieved moderate efficiency. This result indicates that there are fewer provinces in China with moderate efficiency in fishery ecology. (4) Medium-to-high efficiency category. In 2006, 15 provinces and cities (Liaoning, Jilin, Tianjin, Shaanxi, Shandong, Henan, Anhui, Shanghai, Zhejiang, Fujian, Guangdong, Jiangxi, Hubei, Sichuan, and Yunnan) achieved medium to high efficiency. In 2011, Gansu, Hainan, and Heilongjiang were added, while Yunnan, Anhui, Jilin, Liaoning, and Fujian were reduced, reaching 13 provinces and cities. In 2016, Jilin and Yunnan were added, while Gansu, Jilin, Hainan, and Jiangxi were reduced, reaching 11 provinces and cities. In 2021, Liaoning, Tianjin, Hainan, Shanxi, and Jiangxi were added, while Beijing, Henan, and Yunnan were reduced. This result indicates that the dynamic changes in the high efficiency of China’s fishery ecology are not significant and account for a large proportion of fisheries and that there is still significant room for improvement in fishery ecological efficiency. (5) High-efficiency category. In 2006, the ecological efficiency of fisheries in four provinces (Ningxia, Beijing, Heilongjiang, and Hainan) reached a high level. In 2011, Beijing, Heilongjiang, and Hainan were reduced, while Tianjin, Fujian, and Liaoning were added. In 2016, Hubei and Hainan were added. In 2021, Tianjin, Hainan, and Liaoning were reduced, while Beijing was added. Overall, there are relatively few provinces in China that have achieved high ecological efficiency in fisheries, with only about four provinces accounting for a relatively low proportion in the country.
From the above analysis, it can be concluded that the ecological efficiency of Chinese fisheries has the following two characteristics: First, the spatial differentiation of fisheries’ ecological efficiency in China is significant, showing a spatial gradient distribution pattern of “decreasing from east to west.” This is consistent with the distribution of China’s geographical and economic environment. The main coastal areas in Eastern China are relatively developed in terms of economy, market, technology, and resources. Most provinces and cities have obvious comparative advantages in economy, market, technology, and resources. The investment in marine and freshwater fishery resources is relatively large, and the output of fishery ecological benefits is relatively high. Second, the distribution of ecological efficiency in China’s fisheries shows a trend of medium-to-high-efficiency provinces gradually converging toward the eastern coastal areas. Most provinces in the eastern coastal region have achieved a medium-to-high efficiency level in terms of fishery ecological efficiency, while neighboring central provinces and cities have also experienced a rapid growth in fishery ecological efficiency, with most of them reaching a medium-to-high efficiency level. This indicates that the fishing economy in the eastern coastal provinces and cities of China shows a strong radiative driving ability, a strong spatial spillover effect, and a significant improvement in the ecological efficiency of fishing in surrounding provinces and cities.

3.2. Convergence Analysis of Fishery Ecological Efficiency

3.2.1. Convergence Results of σ Fishery Ecological Efficiency

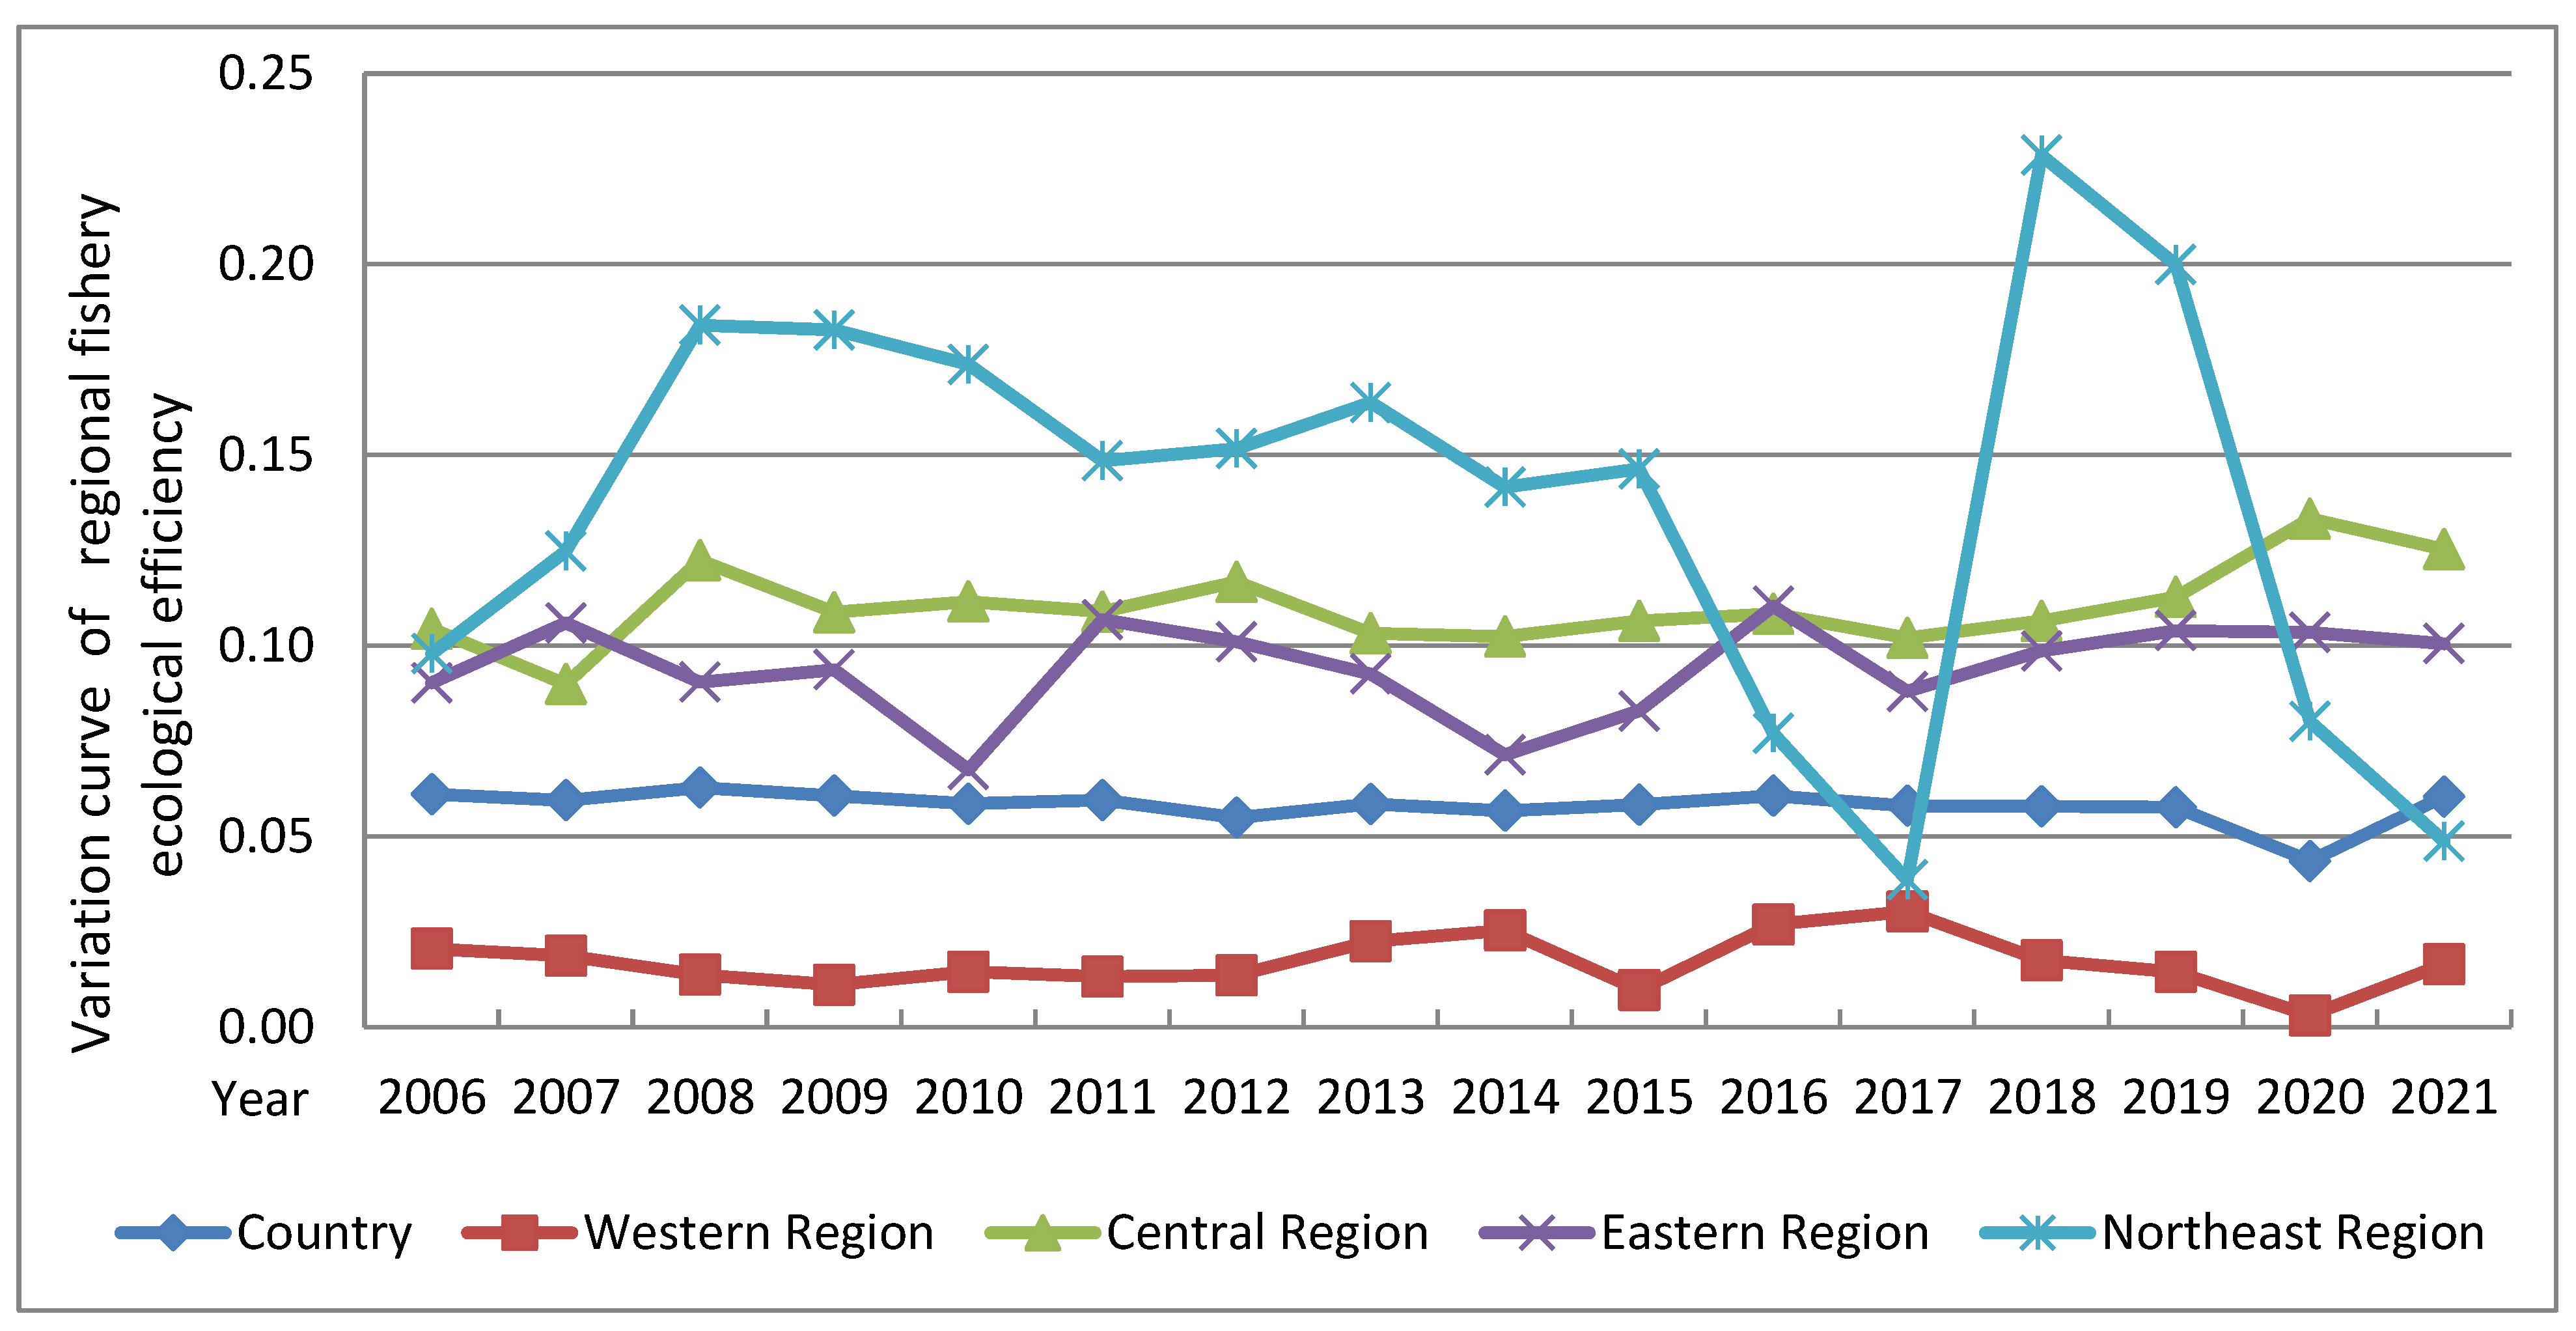
Based on Equation (3), we calculate the σ convergence of fishery ecological efficiency in China from 2006 to 2021, as shown in Table 2 and Figure 3.
From Table 2 and Figure 3, it can be seen that a significant difference exists in the coefficient of variation curve of regional fishery ecological efficiency in China. Among them, the coefficient of variation of national fishery ecological efficiency fluctuates at around 0.06, showing a slow downward trend overall. This indicates that there is σ convergence in fishery ecological efficiency across the country and that the gap between provinces is large and gradually decreasing but that the reduction speed is relatively slow. From the regional perspective, the coefficient of variation curve of fishery ecological efficiency in the western region is the lowest, with little fluctuation. It fluctuates at around 0.02, showing two convergence turning processes, from 2006 to 2015 and from 2016 to 2020, and showing a downward trend throughout the research period. The results fully demonstrate the σ convergence of fishery ecological efficiency in the western region, and the overall gap in fishery ecological efficiency between provinces is not significant and is gradually narrowing. The coefficient of variation of fishery ecological efficiency in the central region fluctuates at around 0.1, with a large fluctuation range. There is a convergence process between 2008 and 2011, but the entire research period shows an upward trend, and the convergence is not significant. The results indicate that there is no σ convergence in fishery ecological efficiency in the central region and that the overall state is discrete. Moreover, a significant gap exists in fishery ecological efficiency between provinces, which gradually decreases, but the degree of reduction is small. The variation value of fishery ecological efficiency in the eastern region fluctuates significantly, with fluctuations at around 0.1, showing a wavelike pattern. It has undergone two major convergence turning points, from 2006 to 2010 and from 2011 to 2014, indicating that there is no σ convergence in fishery ecological efficiency in the eastern region and that there is significant dynamic change in interprovincial differences, as well as disharmony. The variation coefficient curve of fishery ecological efficiency in the northeast region is the highest, with the highest volatility and a steep trend. It fluctuates at around 0.15 and experiences two convergence processes, from 2008 to 2017 and from 2018 to 2021. Overall, the variation coefficient of fishery ecological efficiency shows a downward trend, indicating that there is σ convergence in fishery ecological efficiency in the northeast region and that the gap between provinces within the region is relatively large but gradually narrowing.

3.2.2. Absolute β Convergence Results of Fishery Ecological Efficiency

Based on Equations (4) and (6), we calculate the absolute β convergence of fishery ecological efficiency in China from 2006 to 2021, as shown in Table 3.
Generally, such as the fixed and random effects estimators, where the intercepts are allowed to differ across groups while all other coefficients and error variances are constrained to be the same [34]. The pooled mean group (PMG) estimator is better because it involves both pooling and averaging. This estimator allows the intercepts, short-run coefficients, and error variances to differ freely across groups but constrains the long-run coefficients to be the same [35]. The focus of this paper is to analyze the convergence of regional fishery ecological efficiency, and the accuracy of explanatory variables is not high. Therefore, RE and FE will continue to be used to compare and analyze the convergence of regional fishery ecological efficiency. From Table 3, it can be seen that the Hausman test results show that the northeast region uses a random-effects (RE) model, while the other regions use a fixed-effects model (FE). Therefore, the FE model is chosen, while we choose the RE model for the northeast region. The β estimated value at the national level is negative and has passed the 1% significance test, indicating absolute β convergence. The results fully indicate that under similar initial conditions, areas with low fishery ecological efficiency values exhibit a trend of “catching up later”, with an average growth rate higher than that of areas with higher efficiency values. Over time, the ecological efficiency of fisheries in various regions will reach a relatively balanced level, and the pattern of the coordinated development of China’s fisheries regions will gradually take shape. In terms of subregions, the β estimated values for the four major economic regions of the eastern, western, central, and northeastern regions all become negative and have passed the 1% significance test. The results indicate that these economic regions all have absolute β convergence and that there is competition and catching up within the regions. The efficiency differences between provinces will gradually narrow. From the perspective of convergence speed, the ecological efficiency of fisheries in the eastern region has the highest convergence speed, reaching 0.081. This result indicates that the provinces with low ecological efficiency of fisheries in the eastern region are catching up with provinces with high efficiency at a faster speed, further confirming the obvious agglomeration of the ecological efficiency of fisheries in the eastern region. The convergence rate in the western region is only second to that in the eastern region, reaching 0.073, indicating that provinces and cities with lower fishery ecological efficiency in the western region are catching up with higher efficiency provinces and cities at a faster pace. The convergence speed of fishery ecological efficiency in the central and northeastern regions is similar, reaching 0.067 and 0.064, respectively, significantly lagging behind the convergence speed of other regions. This result is mainly due to the significant differences in fishery ecological efficiency between provinces within these two regions. The synergy between provinces and cities with low fishery ecological efficiency and those with high efficiency is weak, and the spatial spillover effect of fishery ecological efficiency in provinces and cities with high efficiency has not been fully realized.

3.2.3. Convergence Results of Fishery Ecological Efficiency Conditions

When conducting absolute β convergence analysis on the ecological efficiency of regional fisheries, one can observe significant differences in economic conditions and resource endowments among different regions, which can affect the accuracy of the analysis results. To ensure the reliability of the research results, we introduce economic benefits as a control variable, as there is a close connection between economic benefits and ecological benefits. Among them, economic benefits are represented by the degree of openness to the outside world and the level of economic development. The degree of openness to the outside world is represented by the total import and export volume of aquatic products (X1), while the level of economic development is represented by the per-capita gross domestic product of fisheries (X2). These two control variables are used to examine whether differences exist in regional fishery ecological efficiency owing to individual characteristics and conditions, leading to fishery ecological efficiency approaching the stable level—that is, conditional β convergence. Based on Equations (5) and (6), the results are shown in Table 4.
From Table 4, it can be seen that in the Hausman test results, the FE model is used in the central region, while the RE model is used in the remaining regions.
From the perspective of the convergence coefficient, the β estimated values for the whole country and various economic regions are negative and have passed the 1% significance test, indicating β conditional convergence. This result indicates that over time, even with the addition of control variables, the ecological efficiency of fisheries across the country and various economic regions will still tend toward their respective steady-state levels.
From the perspective of convergence speed, first, the ecological efficiency of fisheries in the central region has the highest convergence speed, reaching 0.044. This indicates that the ecological efficiency of fisheries in the central region is rapidly stabilizing under the influence of multiple factors, mainly owing to the development of the economy, information, science and technology, and resources in the eastern coastal region, leading to a transition toward a high-efficiency level and a faster convergence speed. Second, the convergence rate of fishery ecological efficiency in the northeast region is relatively fast, reaching 0.036. This is mainly because the ecological efficiency of fisheries in the three provinces and cities in the northeast has reached a medium-to-high efficiency level, with overall high efficiency and a transition toward a high-efficiency level. Therefore, the convergence speed is relatively high. The convergence speed of fishery ecological efficiency in the country and in eastern and western regions is similar, reaching 0.015, 0.014, and 0.015, respectively. This result is due to the uneven development of fishery ecological efficiency between provinces in these regions, with obvious polarization, which affects the convergence speed of fishery ecological efficiency in these regions. At the same time, the convergence rate of fishery ecological efficiency conditions β in the country and in major economic regions is significantly lower than the absolute β convergence rate. This result is mainly due to China’s implementation of the regional coordinated development strategy, promoting the full utilization of the comparative advantages among regions, deepening interregional division of labor, accelerating the orderly and free flow of fishery elements, improving the spatial allocation efficiency of fishery ecological resources, and achieving certain results in regional coordinated development. The absolute β convergence speed has improved the ecological efficiency of fisheries in the region.
From the perspective of controlling variable coefficients, the regression coefficients of the level of opening up and economic development are significantly positive at the national level, indicating that the improvement in these two factors can promote the growth of fishery ecological efficiency. From the regional perspective, significant differences exist in the impact of openness on the ecological efficiency of fisheries. Among them, the level of opening up in the eastern and northeastern regions has a significant positive regression coefficient on fishery ecological efficiency, indicating that it has a positive effect on the improvement in fishery ecological efficiency. This is because the eastern region has a strong geographical advantage and is the core region of China’s opening-up policy. Thus, the improvement in the opening-up level can drive the rapid growth of fishery ecological efficiency. The regression coefficient of the level of opening up to the outside world on the ecological efficiency of fisheries in the central, western, and northeastern regions is not significant, possibly owing to the relatively low level of opening up in these regions, which has no significant impact on the ecological efficiency of fisheries within the region. The regression coefficients of the economic development level on the ecological efficiency of fisheries in various regions are significantly positive, but the degree of impact varies, indicating that improving the economic development level can enhance the ecological efficiency of fisheries by promoting technological innovation, optimizing resource allocation, and enhancing spatial spillover effects.

4. Discussions

After analyzing the ecological efficiency of regional fisheries in China during the research period, it was found that although the ecological efficiency of fisheries has steadily improved, the efficiency level is relatively low. There are significant differences in the ecological efficiency of regional fisheries, but the overall trend shows convergence. The reason for this is that the green and low-carbon development of fisheries has achieved results, but the trend of deteriorating environmental quality in fishery waters has not been fundamentally curbed, seriously constraining the improvement in fishery ecological efficiency. The unreasonable structure of the fishery, the extensive development model of the fishery, and overfishing deeply constrain the sustainable development of the fishery economy. Second, the gap in ecological efficiency of regional fisheries has decreased, but the development of regional fisheries is uneven, the division of labor is unreasonable, the flow of regional fishery elements is not smooth, and the coordinated development mechanism is not sound, which still affects the balanced development of regional fishery ecological efficiency. Previous studies have confirmed that the overall carbon emission efficiency of China’s fisheries is continuously increasing, but the overall level is not high. High-efficiency provinces have shown a significant trend of agglomeration from scattered layouts to the eastern coastal and Yangtze River basins [32]. The economic efficiency of marine fisheries shows a polarized trend and has not been effectively improved, indicating that the level of fishery economic development in China’s coastal areas is imbalanced [17]; the relationship between the economic efficiency and input-output of marine fisheries is becoming more complex, with high-value areas of fishery economic efficiency tending to gather and the scope of high-value areas expanding [10]. These research conclusions are similar to the empirical results of this article, which also support and expand early research from multiple aspects. Previous studies have mostly focused on measuring the dynamic evolution characteristics, patterns, and influencing factors of the economic efficiency of marine fisheries [5,6,9,10,13,21,26], and measure the dynamic evolution characteristics, laws, and influencing factors of economic efficiency in marine fisheries. However, this research analyzes the dynamic evolution of ecological efficiency in fisheries, expanding the research object and scope. Compared with previous studies, this study not only comprehensively analyzed the spatiotemporal evolution of fishery ecological efficiency but also revealed the heterogeneity and coordination of regional fishery ecological efficiency. It was found that there is a significant gap in regional fishery ecological efficiency, and there is a phenomenon of polarization. Areas with lower fishery efficiency are catching up with high-efficiency areas at different speeds, and the ecological efficiency of regional fisheries is developing towards a stable state. This is mainly due to the adjustment of fishery structure and development mode, the transition from traditional resource consumption to green and low-carbon, and the initial effectiveness of a regional coordinated development strategy.
Moreover, the development of fishery ecological efficiency in different countries and regions is also influenced by various factors such as the geographical environment, resource endowment, economic structure, institutional mechanisms, and technological level, forming their own unique characteristics. However, fishery ecological efficiency should be a key focus of research on the sustainable development of fisheries. For example, the Food and Agriculture Organization of the United Nations has proposed that the El Niño phenomenon will cause some fluctuations in the next decade, leading to a decrease in South American fishing, especially of Peruvian anchovy, which, in turn, will result in an overall decrease of approximately 2% in global fishing production during this period. Climate variability and climate change, including the frequency and severity of extreme weather events, may have significant and regional impacts on the availability, processing, and trading of fish and fish products, making countries more vulnerable to risks [2]. Therefore, strengthening the ecological protection of fisheries and reducing carbon emissions from fisheries should be important measures for the efficient development of fisheries. Significant differences in the ecological efficiency of regional fisheries can lead to imbalances in fisheries development. Thus, accelerating the coordinated development of regional fisheries and promoting the balanced and sustainable development of regional fisheries are also important directions for global fisheries development. Countries and regions should build diversified collaborative governance models based on their own economic background, resource endowment, development experience, value system, and comparative advantages. For example, Madagascar should better implement regional fishery management policies and improve the level of fishery development [36]. Further, countries and regions should implement a coordinated development assessment of regional fishery ecological efficiency and dynamically adjust fishery development policies. Different regions can strengthen cooperation in the fields of fishery environment and ecology and technology, implement cross-regional and cross-departmental collaborative governance models, formulate regional fishery ecological development policies, promote the transformation of regional fishery structure, develop green and low-carbon fisheries, and form a new regional coordinated development pattern. Therefore, this study can provide new research ideas and frameworks for other countries and regions to study the development of fishery ecological efficiency and regional fishery differences.
Although we use the superefficient DEA model to comprehensively and objectively measure the ecological efficiency level of China’s fisheries, owing to the unavailability of some data, some indicators may have been excluded in the evaluation index system, which may affect the accuracy of empirical results. Moreover, this research includes a weak analysis of the spatial agglomeration and influencing factors of fishery ecological efficiency, and it does not explore the driving mechanism and path of the coordinated development of regional fishery ecological efficiency. This aspect will also be the focus of our future research. In addition, other researchers can consider using qualitative or different statistical methods to study the impact of carbon emissions on fishery ecological efficiency at the global scale, as well as to adopt corresponding policies and governance strategies.

5. Conclusions and Suggestions

5.1. Conclusions

Using empirical research and analysis, we can conclude the following:
(1)
The ecological efficiency of China’s fisheries shows a wavelike upward trend with significant fluctuations, but the overall efficiency level is not high, with efficiency values fluctuating around 0.8. There are significant differences in the ecological efficiency of regional fisheries, with higher ecological efficiency in the eastern and northeastern regions, with an average of 0.96 and 0.94, respectively, and significant volatility. The ecological efficiency of fisheries in the central and western regions is relatively low, with an average of 0.72 and 0.61, respectively, and there is no strong volatility. The spatial distribution of fishery ecological efficiency shows a gradient pattern of “decreasing from east to west.” At the same time, the distribution of fishery ecological efficiency shows a trend of medium-to-high efficiency provinces gradually gathering toward the eastern region;
(2)
The coordination of regional fishery ecological efficiency development is not strong, showing a polarization trend. Throughout the country, the variation curve of fishery ecological efficiency fluctuates at around 0.06 during the study period, showing a decreasing trend overall and at a slower rate. The gap between provinces is significant but is gradually decreasing. The overall variation curve of fishery ecological efficiency in the western and northeastern regions shows a downward trend, and the gap between provinces is gradually narrowing. However, the variation curve of fishery ecological efficiency in the eastern and central regions is gradually decreasing, showing a divergent trend. The gap between provinces is dynamically changing, and the development imbalance is further deepening;
(3)
There is a trend of “catching up and surpassing” in the development of fishery ecological efficiency in various regions of China. From the perspective of convergence speed, the eastern region has the highest convergence speed, reaching 0.081, followed by the western region, with a convergence speed of 0.074. The convergence speed of fishery ecological efficiency in the central and northeastern regions is similar, reaching 0.067 and 0.064, respectively. At the same time, there is conditional β convergence in the ecological efficiency of fisheries in various regions of China, and the ecological efficiency of fisheries will gradually converge to their respective steady-state levels over time. From the perspective of convergence speed, the central region has the highest rate of convergence, at 0.044. The northeastern region has the second highest rate of convergence, at 0.036, while the eastern and western regions have slower rates of convergence, at 0.015 and 0.014, respectively.

5.2. Suggestions

First, accelerating the green, low-carbon, and circular development of fisheries. Implement a system for controlling the total amount of pollutants from land, sea, and atmospheric sources, strictly control the discharge of industrial wastewater, domestic sewage, and agricultural non-point source pollution into fishery waters, and gradually reduce the impact of external pollution on the fishery environment. Strengthen the environmental protection and green transformation and upgrading of aquaculture fish ponds, wastewater treatment, recycled water, offshore fishing vessels, and shipboard facilities. Promote the application of standard ship types for fishing vessels, promote new materials and energy technologies, and continue to promote the treatment of waste gas, sewage, and garbage from fishing vessels. Promote online monitoring and classified comprehensive treatment of aquaculture tail water discharge, and promote the resource utilization of aquaculture waste. Strengthen the supervision of inputs for fishery aquaculture inputs to achieve refinement, intensification, and reduction. Support the research and development of green fishery drugs and prohibited drug substitutes, and promote green investment in the whole process of aquaculture. Promote the digitization of fisheries and carry out the “cloud empowerment and intelligent use” of the fisheries industry. Actively build a big data platform for the fisheries economy, develop digital industrialization of fisheries, and construct “digital fisheries”. Innovate the ecological and healthy development model of fisheries. Explore ecological fisheries development models, such as marine ranching, intelligent aquaculture, large offshore deepwater cages, deep-sea aquaculture craft, deepwater bottom seeding, and three-dimensional ecological aquaculture. By means of artificial fish reefs, multiplication and release, fishery conservation and environmental restoration are strengthened to realize the coordinated development of resource environmental protection and economy. Strengthen the coordination and symbiosis between coastal environmental protection and aquaculture, and expand the potential of carbon sinks and the space for green development of fisheries. Promote the ecological, landscape, and recreational transformation of traditional aquaculture farms, develop industries such as sightseeing fishing, fishing experience, and leisure fishing, and build a good ecological space for fishery production and life. Strengthen the investigation and assessment of fishery resources, orderly promote the pilot of quota fishing and promote the gradual withdrawal of inland river fishing and the expansion of marine fishing into the deep and distant seas.
Second, promote integrated regional fisheries development. (1) Improve policies for coordinated development within the region. Break the various administrative constraints caused by fragmentation and administrative regional division, strengthen policy synergies in data sharing, spatial planning, environmental protection, industrial layout, supervision, and management, and implement flattened management. (2) Establish a regional functional cooperation platform. Accelerate the establishment of platforms for fisheries economic collaboration, monitoring of fisheries ecosystem and pollution sources, fostering and perfecting various property rights trading platforms, and building cross-administrative information-sharing platforms for science and technology, talents, capital, and industries. Utilize important platforms for cooperation and opening up, strengthen regional fisheries exchanges and cooperation, and learn advanced management and development experiences from high-level regions. Create positive synergies and external spillover effects via enhanced cooperation on regional platforms to improve the quality and effectiveness of the regional fisheries economy. (3) Optimize the layout of regional fisheries. Based on the resource endowments and ecological types of various regions, a development pattern with a reasonable division of labor and complementary advantages should be formed to strengthen the agglomeration capacity of regional fisheries, develop modern fisheries, promote the upgrading of fishery structure, and innovate new models of cross-regional industrial division and cooperation. Support the establishment of upstream and downstream linkages in regional fisheries chains, promote the development of fisheries groups and clusters, and strengthen cross-regional synergies between innovation and fisheries chains. Adhere to green development, optimize industrial layout according to the carrying capacity of resources and environment, regulate the scale of regional fisheries development, and jointly build parks with various forms of cooperation. (4) Promote regional ecological joint prevention and governance. From the perspective of ecosystems, establish a spatial zoning control system corresponding to “sea area, watershed, and land area”, strengthen the joint management of water bodies, the atmosphere, and solid waste in the region, and enhance the joint protection of fishery ecosystems in the region. Improve the regional ecological synergistic management mechanism. Establish and improve regional ecological compensation mechanisms and pollution compensation mechanisms, strengthen regional environmental joint prevention and monitoring mechanisms, and upgrade the scientific, refined, and integrated level of regional ecological fishery environmental governance.

Author Contributions

Conceptualization, resource preparation, data analysis, and original draft, W.T.; methodology, software, validation, and visualization, Y.J. and Y.L.; writing—review and editing, L.H. and Y.F.; supervision, project administration, and funding acquisition, C.L. All authors have read and agreed to the published version of the manuscript.

Funding

Major Projects of National Social Science Foundation of China’s “Study on the Development Strategy of China’s ‘Dark Blue Fisheries’ under the Background of Accelerating the Construction of a Marine Power” (Grant No. 21&ZD100). Social Science Planning Fund of Liaoning’s “Research on high-quality development path of marine economy in Liaoning” (L22AJL002). Project approved by Liaoning Department of Education’s “Research on the digital transformation and development of Liaoning marine industry” (KJKMR20221130).

Institutional Review Board Statement

Not applicable.

Informed Consent Statement

Informed consent was obtained from all subjects involved in the study.

Data Availability Statement

The data presented in this study are available on request from the corresponding author.

Acknowledgments

The authors would like to thank Phil Shea and Carola Wang for this kind and insightful advice. We thank LetPub (www.letpub.com, accessed on 25 September 2023) for its linguistic assistance during the preparation of this manuscript.

Conflicts of Interest

The authors declare no conflict of interest.

References

  1. Food and Agriculture Organization of the United Nations. The State of World Fisheries and Aquaculture: Towards Blue Transformation. Rome. 2022. Available online: https://www.sgpjbg.com/info/36072.html (accessed on 10 July 2023).
  2. The Intergovernmental Panel on Climate Change. Climate Change 2022: Impacts, Adaptation and Vulnerability. Available online: https://www.las.ac.cn/front/product/detail?id=859f0b9ea1fb47aed2e565f749ac8e75 (accessed on 10 July 2023).
  3. Qiuguang, H.; Xuan, Y. Evaluation of Marine Ecological Efficiency and Temporal and Spatial Differences in China: Analysis Based on Data Envelopment Method. Soc. Sci. 2018, 1, 18–28. [Google Scholar]
  4. Ma, X.; Li, Y.; Zhang, X.; Wang, C.; Li, Y.; Dong, B.; Gu, Y. Research on the ecological efficiency of the Yangtze River Delta region in China from the perspective of sustainable development of the economy-energy-environment (3E) system. Environ. Sci. Pollut. Res. 2018, 25, 29192–29207. Available online: https://link.springer.com/article/10.1007/s11356-018-2852-y (accessed on 1 August 2023). [CrossRef] [PubMed]
  5. Nielsen, J.R.; Thunberg, E.; Holland, D.S.; Schmidt, J.O.; Fulton, E.A.; Bastardie, F.; Punt, A.E.; Allen, I.; Bartelings, H.; Bertignac, M.; et al. Integrated ecological–economic fisheries models—Evaluation, review and challenges for implementation. Fish Fish. 2017, 19, 1–29. [Google Scholar] [CrossRef]
  6. Ma, X.; Wang, C.; Yu, Y.; Li, Y.; Dong, B.; Zhang, X.; Niu, X.; Yang, Q.; Chen, R.; Li, Y.; et al. Ecological efficiency in China and its influencing factors—A super-efficient SBM metafrontier- Malmquist-Tobit model study. Environ. Sci. Pollut. Res. 2018, 25, 20880–20898. [Google Scholar] [CrossRef] [PubMed]
  7. Zenglin, H.; Wei, H.; Jingqiu, Z.; Yuan, H.; Tianbao, L. Evaluation of Sustainable Development of China’s Marine Ecological Economy Based on Emergy Analysis. J. Ecol. 2017, 37, 2563–2574. [Google Scholar]
  8. Zenglin, H.; Xueqing, J.; Ying, H.; Xianzhe, C. The spatiotemporal evolution of ecological efficiency in China’s marine fisheries based on the SBM model. Ocean. Dev. Manag. 2019, 36, 3–8. [Google Scholar]
  9. Jianyue, J.; Qi, Z. Analysis of the spatiotemporal evolution of green technology efficiency in China’s marine aquaculture industry based on global DEA. China Manag. Sci. 2016, 24, 774–778. [Google Scholar]
  10. Xu, L. The Research on Change of Green Total Factor Productivity and Convergence of China’s Coastal City; Ocean University of China: Qingdao, China, 2015. [Google Scholar]
  11. Fuentes, R.; Fuster, B.; Lillo-Bañuls, A. A three-stage DEA model to evaluate learning-teaching technical efficiency: Key performance indicators and contextual variables. Expert Syst. Appl. 2016, 48, 89–99. [Google Scholar]
  12. Kaoru, T. A slacks-based measure of efficiency in data envelopment analysis. Eur. J. Oper. Res. 2002, 143, 32–41. [Google Scholar]
  13. Eggert, H.; Tveteras, R. Productivity development in Icelandic, Norwegian and Swedish fisheries. Appl. Econ. 2013, 45, 709–720. [Google Scholar] [CrossRef]
  14. Yufei, R.; Chuanglin, F. County scale ecological efficiency evaluation and spatial pattern analysis of the Beijing Tianjin Hebei urban agglomeration. Prog. Geogr. Sci. 2017, 36, 87–98. [Google Scholar]
  15. Wang, P.; Ji, J. Research on China’s Mariculture Efficiency Evaluation and Influencing Factors with Undesirable Outputs—An EmpiricalAnalysis of China’s Ten Coastal Regions. Aquac. Int. 2017, 25, 1521–1530. [Google Scholar] [CrossRef]
  16. Zhanglei, C.; Yongyi, C.; Manhong, S. Research on the Production Efficiency and Regional Differences of Marine Fisheries in China. Sci. Technol. Econ. 2017, 30, 56–60. [Google Scholar]
  17. Kang, S.; Yannan, W.; Zixiao, S. Spatial-temporal differentiation of economic efficiency of China’s marine fishing. Resour. Ind. 2020, 22, 25–33. [Google Scholar]
  18. Yamaji, K.; Matsuashi, R.; Nagata, Y.; Kaya, Y. A Study on Economic Measure for CO2 Reduction in Japan. Energy Policy 1993, 21, 123–132. [Google Scholar] [CrossRef]
  19. Mielnik, O.; Goldemberg, J. Communication on the evolution of the “carbonization index” in developing countries. Energy Policy 1999, 27, 307–308. [Google Scholar] [CrossRef]
  20. Guijarro, B.; Ordines, F.; Massuti, E.J. Improving the ecological efficiency of the bottom trawl fishery in the western Mediterranean: It’s about time. Mar. Policy 2017, 83, 204–214. [Google Scholar] [CrossRef]
  21. Martinezcordero, F.J.; Leung, P. Sustainable Aquaculture and Producer Performance: Measurement of Environmentally Adjusted Productivity and Efficiency of a Sample of Shrimp Farms in Mexico. Aquaculture 2004, 241, 249–268. [Google Scholar] [CrossRef]
  22. Ziegler, F.; Hansson, P.-A. Emissions from fuel combustion in Swedish cod fishery. J. Clean. Prod. 2003, 11, 303–314. [Google Scholar] [CrossRef]
  23. Glibert, P.M.; Azanza, R.; Burford, M.; Furuya, K.; Abal, E.; Al-Azri, A.; Al-Yamani, F.; Andersen, P.; Anderson, D.M.; Beardall, J.; et al. Ocean urea fertilization for carbon credits poses high ecological risks. Mar. Pollut. Bull. 2008, 56, 1049–1056. [Google Scholar]
  24. Bing, Z. Research on the spatial pattern and influencing factors of carbon emission efficiency in the fishery economy of the Yangtze River Economic Belt. Contemp. Econ. Manag. 2019, 41, 44–48. [Google Scholar]
  25. Guanghui, M. Research on the driving factors of carbon emissions in China’s fisheries economy—A dual perspective analysis based on LMDI and decoupling models. J. Qingdao Univ. Nat. Sci. Ed. 2022, 35, 117–123. [Google Scholar]
  26. Qianbin, D.; Qianying, L. Analysis of spatiotemporal differences and influencing factors of China’s marine economic efficiency under carbon emission constraints. Ocean. Bull. 2018, 37, 272–279. [Google Scholar]
  27. Chuantang, R.; Suqiong, W.; Xiaojun, Y.; Wei, L.; Yanhua, Z. Comparison of Production Efficiency and Impact Mechanism of Fisheries in Fujian and Taiwan under the Background of “Dual Openness”. Econ. Geogr. 2020, 40, 127–135. [Google Scholar]
  28. Qianbin, D.; Xiaolong, C.; Zixiao, S.; Kang, S. Research on Regional Differences in Carbon Emission Efficiency and Carbon Reduction Potential of China’s Marine Fisheries under the “Dual Carbon” Goal. Mar. Environ. Sci. 2023, 42, 29–36. [Google Scholar]
  29. Norse, E.A. Sustainability of deep-sea fisheries. Mar. Policy 2012, 36, 307–320. [Google Scholar]
  30. Gatto, A.; Sadik-Zada, E.R.; Ozbek, S.; Kieu, H.; Huynh, N.T.N. Deep-sea fisheries as resilient bioeconomic systems for food and nutrition security and sustainable development. Resour. Conserv. Recycl. 2023, 197, 106907. [Google Scholar] [CrossRef]
  31. Zhu, B.Z.; Zhang, M.F.; Zhou, Y.H.; Wang, P.; Sheng, J.; He, K.; Wei, Y.-M.; Xie, R. Exploring the effect of industrial structure adjustment on interprovincial green development efficiency in China: A novel integrated approach. Energy Policy 2019, 134, 110946. [Google Scholar]
  32. Chen, L.; Wei, F.; Guilan, S. Temporal and Spatial Differentiation of Total Factor Carbon Emission Efficiency in Provincial Fisheries in China. Econ. Geogr. 2018, 38, 179–187. [Google Scholar]
  33. Zhu, W.; Li, B.; Han, Z. Synergistic analysis of the resilience and efficiency of China’s marine economy and the role of resilience policy. Mar. Policy 2021, 132, 104703. [Google Scholar] [CrossRef]
  34. Pesaran, M.H.; Smith, R.P. Estimating long-run relationships from dynamic heterogeneous panels. J. Econom. 1995, 68, 79–113. [Google Scholar]
  35. Shin, Y. Pooled Mean Group Estimation of Dynamic Heterogeneous Panels; Edinburgh School of Economics Discussion Paper Series Number 16; University of Edinburgh: Edinburgh, UK, 1998. [Google Scholar]
  36. Andriamahefazafy, M. Governing Distant-Water Fishing with the Blue Economy in Madagascar: Policy Frameworks, Challenges and Pathways. Fishes 2023, 8, 361. [Google Scholar] [CrossRef]
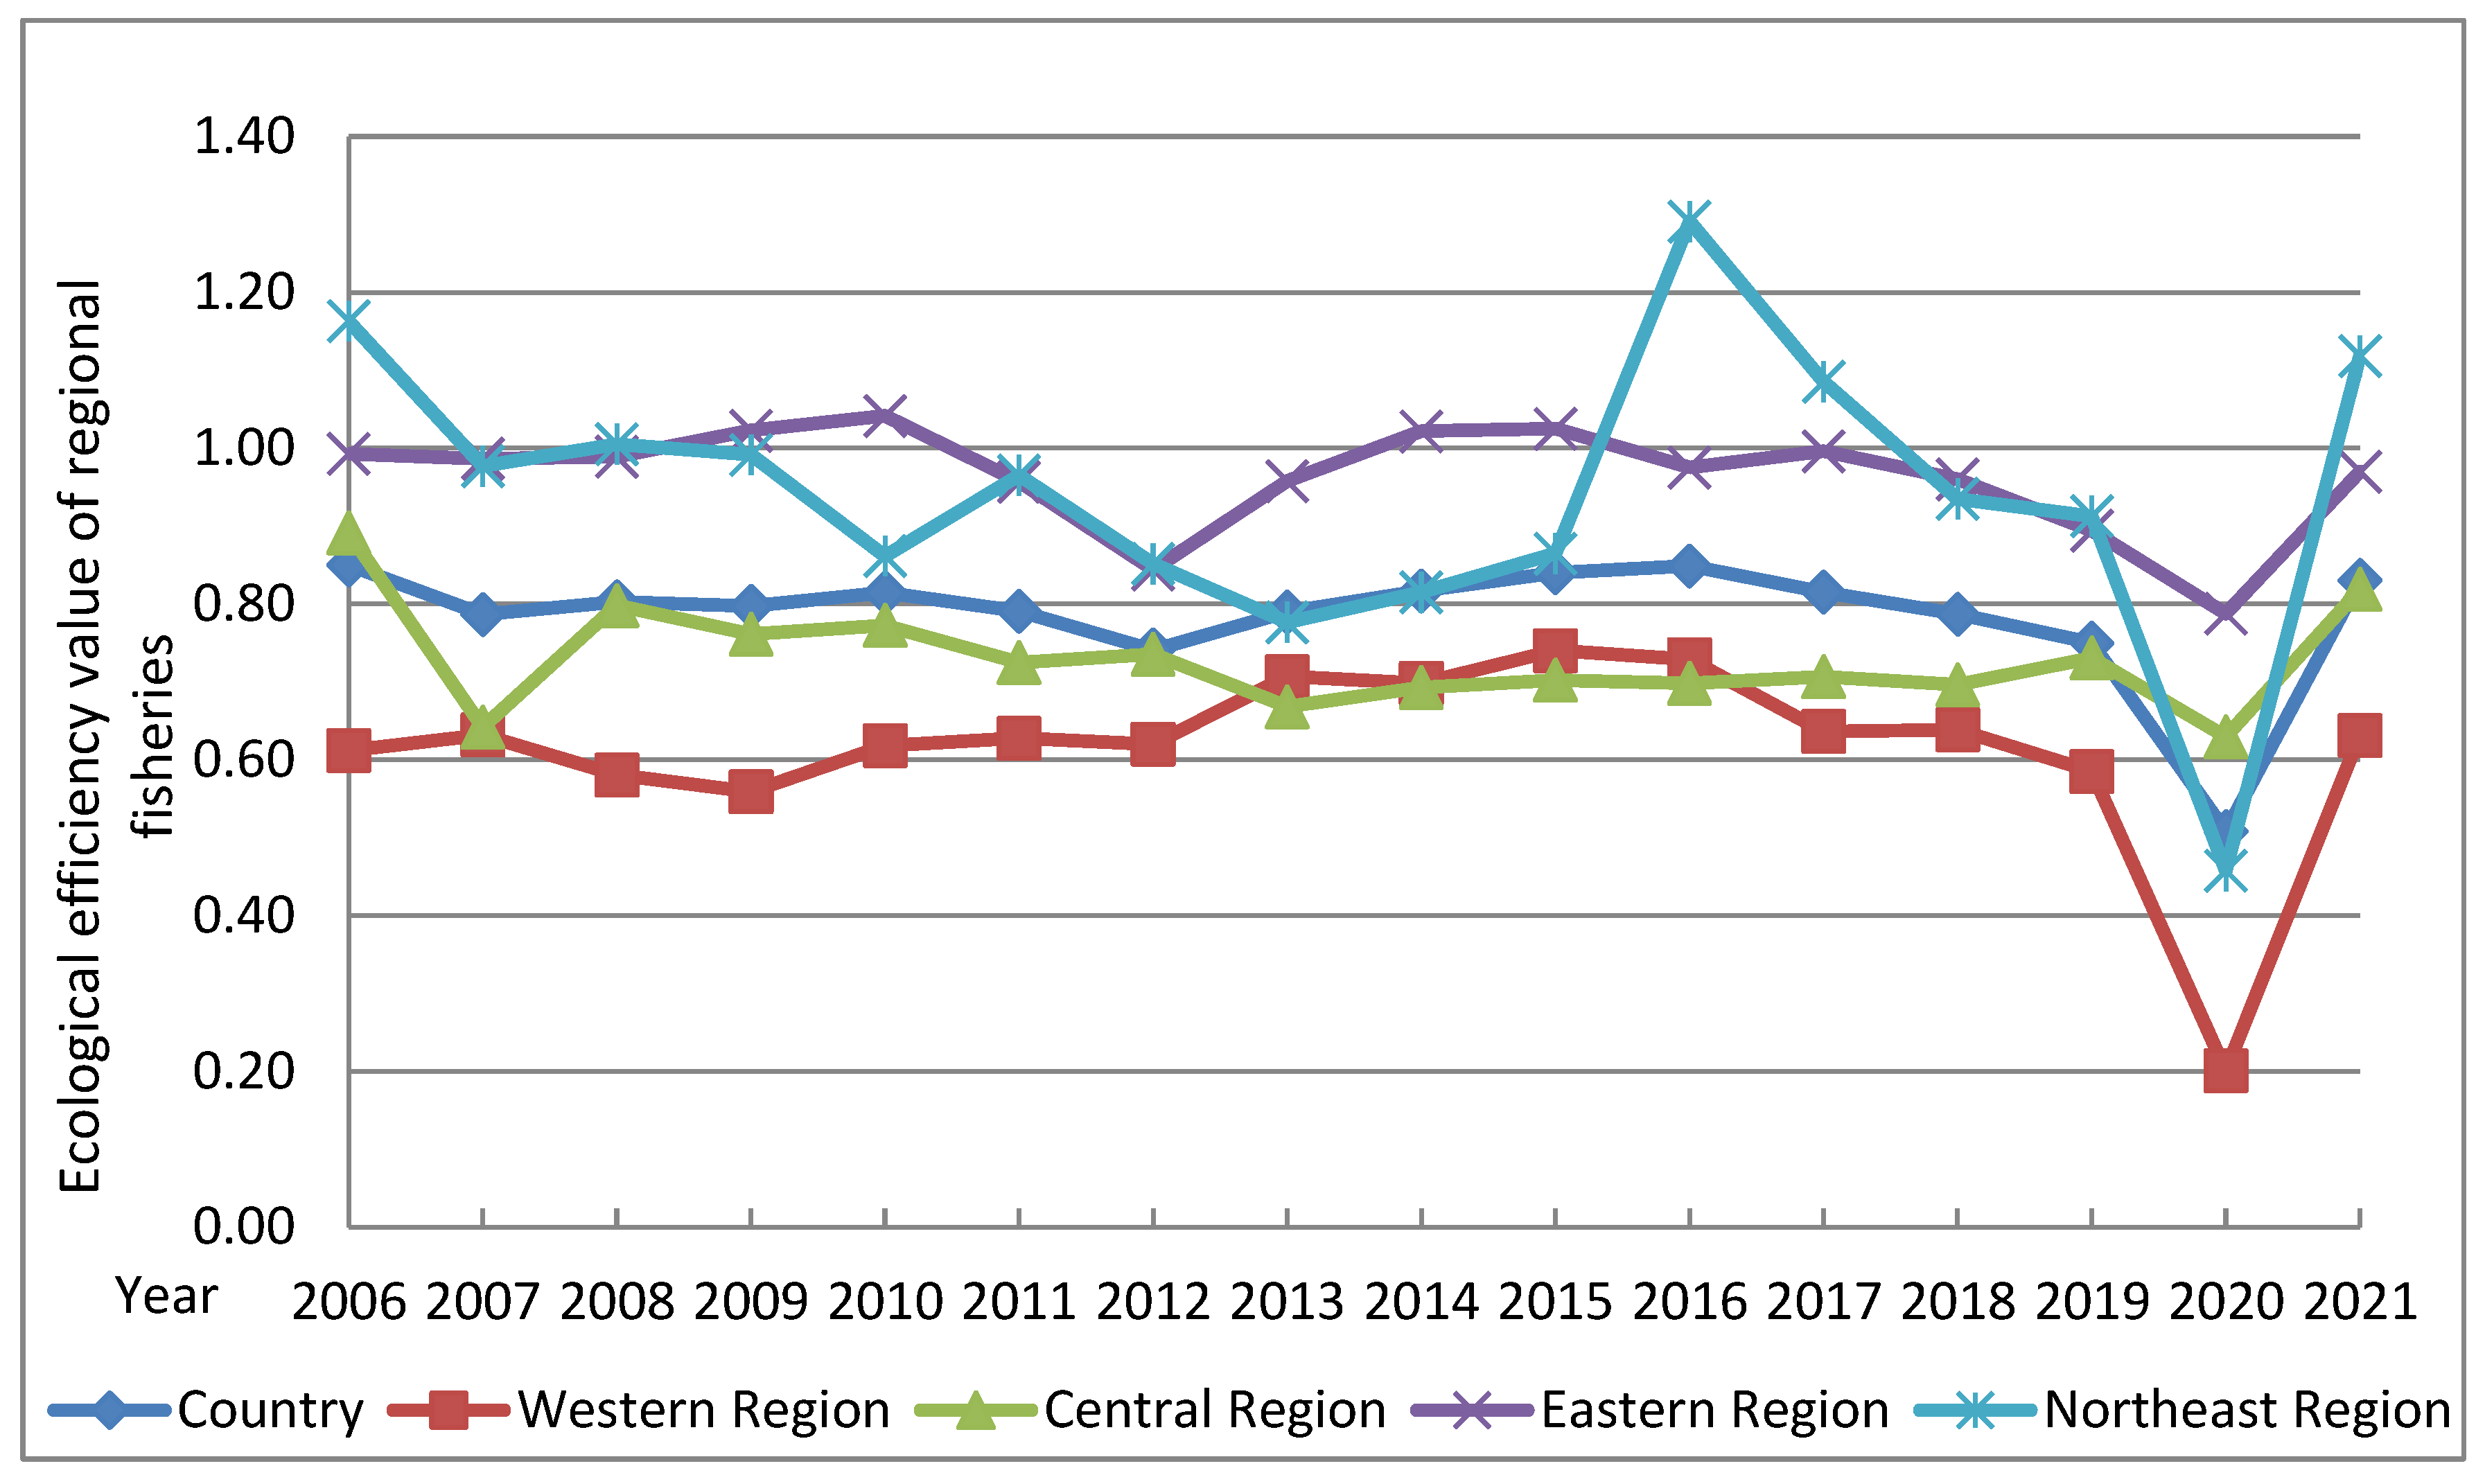
Figure 1. Curve of changes in ecological efficiency of regional fisheries in China (2006–2021).
Fishes 08 00499 g001
Figure 2. Distribution pattern of fisheries ecological efficiency of China in typical years (2006, 2011, 2016, 2021).
Fishes 08 00499 g002
Figure 3. Variation curve of regional fishery ecological efficiency in China.
Fishes 08 00499 g003
Table 1. Input-output indicator system for fishery ecological efficiency.
Indicator TypePrimary IndicatorsSpecific Indicators
Input indicatorsResource investmentNumber of aquatic seedlings (100 million)
Aquaculture area (hectares)
Capital investmentYear-end ownership of fishing vessels (total tons)
Aquatic Technology promotion cost (10,000 yuan)
Labor investmentNumber of fishery employees (person)
Output indicatorsDesirable outputTotal output value of fishery economy (10,000 yuan)
Undesirable outputFishery carbon emissions (10,000 tons)
Economic losses caused by fishery disasters (10,000 yuan)
Note: Carbon emissions from fisheries = (Gross output value of fishery economy/regional GDP) × the sum of all emissions of CO2.
Table 2. σ Convergence results of regional fisheries ecological efficiency in China (2006–2021).
YearCountryWestern RegionCentral RegionEastern RegionNortheast Region
20060.0610.0210.1040.0900.098
20070.0590.0190.0900.1060.125
20080.0630.0140.1220.0900.184
20090.0610.0110.1090.0940.183
20100.0590.0150.1120.0670.174
20110.0600.0130.1090.1070.148
20120.0550.0140.1170.1010.152
20130.0580.0220.1030.0930.164
20140.0570.0250.1020.0710.142
20150.0580.0100.1070.0830.146
20160.0610.0270.1080.1100.077
20170.0580.0300.1020.0880.039
20180.0580.0180.1060.0990.229
20190.0580.0140.1130.1040.200
20200.0440.0030.1330.1030.080
20210.0600.0160.1250.1010.049
Table 3. Regression results of absolute β convergence.
VariableCountryEastern RegionWestern RegionCentral RegionNortheast Region
FEREFEREFEREFEREFERE
β−0.695 *** (−14.89)−0.226 ***
(−7.55)
−0.723 *** (−9.01)−0.223 *** (−4.23)−0.689 *** (−8.86)−0.225 *** (−4.57)−0.639 *** (−6.20)−0.220 *** (−3.23)−0.731 *** (−4.85)−0.655 *** (−4.62)
C0.542 *** (14.22)0.175 *** (6.61)0.695 *** (8.83)0.213 *** (3.98)0.423 *** (8.22)0.139 *** (3.73)0.457 *** (5.86)0.155 *** (2.77)−0.658 *** (4.52)0.589 *** (4.27)
R20.3460.3460.3690.3690.3390.3390.3160.3160.3650.365
v 0.0740.0810.0730.0640.067
Hausman171.607 ***68.345 ***59.293 ***29.367 ***2.202 [0.138]
Note: *** p < 0.01, ** p < 0.05, * p < 0.1 (The value of t is in parentheses); FE (Fixed Effect Model); RE (Random Effect Model).
Table 4. Regression results of conditional β convergence.
VariableCountryEastern RegionWestern RegionCentral RegionNortheast Region
FEREFEREFEREFEREFERE
β−0.654 *** (−14.15)−0.208 *** (−7.15)−0.700*** (−8.51)−0.207 *** (−3.93)−0.673 *** (−8.59)−0.217 ** (−4.43)−0.505 *** (−4.96)−0.157 ** (−2.53)−0.478 *** (−3.57)−0.436 *** (−3.41)
X10.013 (1.20)0.022 * (1.77)0.014 (0.79)0.018 ** (0.87)0.013 (0.77)0.024 (1.30)−0.008 (−0.36)−0.001 (−0.06)0.084 (0.94)0.082 (0.92)
X20.022 ** (−1.96)0.026 ** (−2.03)0.032 (1.21)0.066 ** (2.21)0.036 (1.49)0.045 * (1.70)0.293 *** (4.04)0.377 *** (5.03)0.652 ** (2.55)0.599 ** (2.39)
C0.508 *** (13.43)0.158 *** (6.12)0.671 *** (8.29)0.194 *** (3.62)0.411*** (7.87)0.129 *** (3.47)0.328 *** (4.10)0.066 (1.25)0.355 ** (2.55)0.324 ** (2.40)
R20.3370.2870.3770.2780.3510.2790.4310.3530.4020.401
v 0.0150.0140.0150.0440.036
Hausman154.183 ***60.605 ***55.468***18.584 ***1.836 ***
Note: *** p < 0.01, ** p < 0.05, * p < 0.1 (The value of t is in parenthesis.).
Disclaimer/Publisher’s Note: The statements, opinions and data contained in all publications are solely those of the individual author(s) and contributor(s) and not of MDPI and/or the editor(s). MDPI and/or the editor(s) disclaim responsibility for any injury to people or property resulting from any ideas, methods, instructions or products referred to in the content.