Article

Transcriptome Analysis of the Immune Process of Golden Pompano (Trachinotus ovatus) Infected with Streptococcus agalactiae

1
Key Laboratory of South China Sea Fishery Resources Exploitation and Utilization, Ministry of Agriculture and Rural Affairs, South China Sea Fisheries Research Institute, Chinese Academy of Fishery Sciences, Guangzhou 510300, China
2
Ocean College, Hebei Agricultural University, Qinhuangdao 066000, China
3
Guangdong Provincial Engineer Technology Research Center of Marine Biological Seed Industry, Guangzhou 510300, China
4
Sanya Tropical Fisheries Research Institute, Sanya 572019, China
*
Author to whom correspondence should be addressed.
These authors contributed equally to this work.
Fishes 2023, 8(1), 52; https://doi.org/10.3390/fishes8010052
Submission received: 22 December 2022 / Revised: 8 January 2023 / Accepted: 9 January 2023 / Published: 13 January 2023
(This article belongs to the Special Issue Application of Transcriptomics in Fish)

Abstract

:
The golden pompano (Trachinotus ovatus) is one of the most economically valuable marine fishes in South China. Streptococcus agalactiae, an infectious Gram-positive bacterium that is highly destructive for golden pompano culture, has recently caused massive losses to the golden pompano industry. This study aimed to investigate the dynamic immune response of golden pompano to S. agalactiae infection, using RNA-seq analysis at two different time points after infection. Abundances of differentially expressed genes (DEGs) gradually increased in the liver and spleen 48–120 h post-infection, whereas those in the head kidney were lower at 120 h than at 48 h. Pathway enrichment analysis of DEGs revealed that genes related to the complement system were continuously transcribed between 48 and 120 h. Metabolic and immune-regulation-related pathways were highly enriched in the liver 48 h after infection. Transcriptome analysis was verified using quantitative PCR for eight genes with similar expression trends. This study revealed the inflammatory response of golden pompano after S. agalactiae infection, including inflammation-related chemokines and signaling pathways. Our findings provide a theoretical basis for studying S. agalactiae resistance in golden pompano and provide a reliable resource for the genetic breeding of fish.

Graphical Abstract

1. Introduction

The golden pompano (Trachinotus ovatus) is an economically important fish usually farmed in deep water nets off the coast of the southeastern part of China. The value of rearing golden pompano has increased considerably with the introduction of deep water netting in aquaculture [1]. However, disease outbreaks due to poor water circulation and other rearing problems have caused severe economic losses [2]. Therefore, research on disease resistance and immunology in fish has recently received considerable attention.
RNA-seq is a powerful tool for studying gene expression profiles under different physiological and pathological conditions [3,4]. Transcriptomic analysis of the immune response to bacterial infections (e.g., Aeromonas hydrophila, Edwardsiella, Vibrio alginolyticus, and Streptococcus agalactiae) has been performed in specific immune tissues (spleen, liver, and head kidney) of some fish [5,6,7,8,9,10,11]. There is evidence that diverse fish species can activate the complement system, pattern recognition pathways, and B-cell and T-cell receptors in response to bacterial infections [12]. Even though these studies have revealed the immune response mechanisms of fish during the bacterial infection process, little research has been performed using transcriptomic analysis to study the dynamic immune response of fish over time and across organs.
Toxicological exposure to bacteria can cause physiological changes in bony fish, disrupt their immune systems and metabolic processes, weaken their natural defenses, and increase the risk of infectious diseases [13]. S. agalactiae is commonly referred to as group B Streptococcus. It is a Gram-positive parthenogenic anaerobic coccus that causes infectious diseases in humans and other animals, including fish. The high pathogenicity and pathogenic mechanisms of S. agalactiae have been extensively studied in several animal species, including humans, rats, cattle, and horses [14,15,16]. To our knowledge, no study has systematically examined the global gene expression and pathways in response to S. agalactiae infection in golden pompano. However, it is necessary to understand how golden pompano respond to bacterial infections to prevent and control diseases.
The liver defends against pathogenic bacteria by regulating immune and metabolic-related pathways [17]. In addition, the spleen and head kidney produce many cytokines and chemokines in response to a pathogen infection due to the large numbers of macrophages and neutrophils [18,19,20].
To better understand the immune response of golden pompano to bacteria, this study investigated the transcriptomic characteristics of the head kidney, spleen, and liver 48 and 120 h after artificial infection with S. agalactiae. All clean reads from the golden pompano reference genome were mapped using available whole-genome sequences. According to our analysis, a significant number of differentially expressed genes (DEGs) were involved in pathways related to ligation/adhesion, pathogen recognition, cell surface receptor signaling, and immune responses. Studying the molecular processes involved in immune responses to bacterial infections can advance our understanding of the immune mechanisms of golden pompano and provide recommendations for selective breeding.

2. Materials and Methods

2.1. Ethical Statement

The Committee of the South China Sea Fisheries Research Institute, Chinese Academy of Fisheries Sciences (no. SCSFRI96-253), approved the animal protocols, and all experiments were performed under the applicable standards.

2.2. Fish, Bacterial Challenge, and Sampling

Healthy juvenile golden pompano (30 ± 1.2 g) were obtained from the fish breeding base at the Shenzhen Experimental Base (114.58° E 22.49° N). Before bacterial infection, the fish were domesticated and cultured, in a laboratory setting, in 140 L water, with a temperature of 27 ± 0.5 °C, salinity of 25‰, and dissolved oxygen above 5.5 mg/L. Fish were fed twice per day (9:00 a.m. and 4:00 p.m.) using a healthy golden pompano diet (Guangdong Yuequn Biological Technology LTD, golden pompano compound feed), at approximately 4% of their biomass per feeding.
S. agalactiae used for the immune challenge was isolated from diseased golden pompano. Before the experiment, bacteria were inoculated into BHI liquid medium and incubated on a shaker at 140× g and 27 °C for 24 h. As previously reported, the test group was injected intraperitoneally with 200 μL of an S. agalactiae suspension per fish (120 h half lethal amount: 2.0 × 10⁷ CFU/fish), and the control group was injected with an equal amount of phosphate-buffered saline per fish. The experimental and control groups were established using three replicates of 12 fish each. Nine fish were randomly selected from the experimental group at 48 and 120 h post-injection and the control group was selected at 0 h as one biological sample. The sampled fish were euthanized with eugenol (40 mg/L) [21], and samples of the liver, spleen, and head kidney were collected and placed in a 1.5 mL centrifuge tube. Each tissue sample was immediately soaked in liquid nitrogen and stored at −80 °C until RNA extraction was performed.

2.3. RNA Extraction and Sequencing

TRIzol reagent (Invitrogen, Thermo Fisher Scientific, Waltham, MA, USA) was used to isolate total RNA, which was then analyzed using NanoDrop (Thermo Fisher Scientific) to determine its concentration, mass, and integrity [22]. Input RNA samples were prepared using 3 µg RNA. Poly-T-oligo magnetic beads were used to purify the mRNA from the total RNA. Divalent cations were used to fragment DNA at high temperatures in Illumina’s proprietary fragmentation buffer. A random oligonucleotide primer and SuperScript II were used for first-strand cDNA synthesis. RNase H and DNA polymerase I were used to synthesize cDNA from the second strand. Exonuclease/polymerase activity was used to convert the remaining overhang to blunt ends and to eliminate the enzyme. Hybridization was performed using Illumina PE oligonucleotides after they were adenylated at the 3′ ends of DNA fragments. A 400–500 bp cDNA fragment was selected, and the library fragment was purified using the AMPure XP system (Beckman Coulter, Pasadena, CA, USA). DNA fragments were selectively enriched for both end-joined molecules in a 15-cycle PCR reaction using an Illumina PCR primer cocktail. The products were purified (AMPure XP system) and quantified on an Agilent Bioanalyzer 2100 (Agilent Technologies, Santa Clara, CA, USA) using Agilent High-Sensitivity DNA Analysis. Sequencing libraries were sequenced on a NovaSeq 6000 platform (Illumina) by Suzhou PANOMIX Biomedical Tech Co., Ltd. Transcriptome sequences were mapped to an existing genome of T. ovatus (GenBank GCA_900607315.1).

2.4. Differential Gene Expression Analysis

The read count value of each gene with the original gene expression was statistically compared using HTSeq (0.9.1) and then normalized using FPKM. For DEG analysis, we used DESeq (1.30.0) with the following filters: expression difference multiplicity |log2FoldChange| > 1 and significant p-value < 0.05 [23]. Two-way clustering analysis was performed using the pheatmap (1.0.8) package in R [24]. The distances based on the expression levels of the same gene in different samples and the expression patterns of different genes in the same sample were calculated and clustered using the Euclidean and complete chain methods, respectively, to obtain the maps.

2.5. Gene Ontology (GO) and Kyoto Encyclopedia of Genes and Genomes (KEGG) Enrichment Analyses

Genes were mapped to terms in the GO database, and the number of differentially enriched genes was calculated for each term [25]. GO enrichment analysis of DEGs was performed using topGO, and p-values were calculated using the hypergeometric distribution method to identify GO terms that were significantly enriched (p < 0.05) for differential genes and to determine the main biological functions of differential genes [26]. ClusterProfiler (3.4.4) software was used to perform KEGG pathway enrichment analysis of the DEGs [27,28], focusing on the significantly enriched pathways.

2.6. Verification Result via qPCR

The Applied Biosystems 6300 RT-PCR system (Waltham, MA, USA) was used to detect the mRNA expression levels of selected DEGs in the spleen, head kidney, and liver. The target gene expression was determined via qPCR using a Roche LightCycler 480 II system (Roche Diagnostics, Shanghai, China). The reaction volume of qPCR was 12.5 μL. Melting curve analysis was performed based on a denaturation step at 95 °C for 30 s followed by 40 cycles of 95 °C for 5 s and 60 °C for 30 s. The experiment was repeated three times per sample to ensure accuracy. The primers are listed in Table 1, and amplification efficiency exceeded 90%. EF-1α was selected as the internal reference gene because it was not affected by S. agalactiae infection in our study. The expression levels of target genes relative to the control group were calculated using the 2−ΔΔCT method [29].

2.7. Statistical Analysis

The data obtained from the experiments were analyzed using SPSS statistical software. All data are expressed as the means ± standard errors. Significant differences between the group means were analyzed using a one-way analysis of variance and Duncan’s multiple comparison test, and differences were considered significant at p < 0.05 [30].

3. Results

3.1. Transcriptome Sequencing and Raw Read Data Analysis

Twenty-seven high-quality cDNA libraries were constructed from the liver, spleen, and head kidney, and sequenced using the NovaSeq 6000 platform (Illumina) (Supplementary Table S1). Liver samples yielded 39,676,608–53,730,328 raw reads with Q20 and Q30 (quality score) values greater than 97.5% and 94.2%, respectively. In spleen samples, the raw reads ranged from 38,767,690 to 48,411,046 with Q20 and Q30 greater than 97.5% and 93.9%, respectively. In head kidney samples, the raw reads ranged from 40,243,318 to 47,852,690 with Q20 and Q30 scores greater than 97.5% and 93.7%, respectively. After filtration, clean reads were mapped to golden pompano sequences, with mapping rates for each sample exceeding 92% in the liver samples and 96% in the spleen and head kidney samples (Supplementary Table S2).

3.2. DEG Analysis during S. agalactiae Infection Stress

We compared the gene expression between the experimental and control groups after S. agalactiae infection and identified 6061, 7775, and 5177 DEGs in the liver, spleen, and head kidney, respectively. The total numbers of upregulated and downregulated DEGs in the liver samples were 3714 and 2347, respectively (Table 2). After 48 h of infection, the total number of DEGs was lower than that at 120 h, and the number of upregulated DEGs was significantly higher than the number of downregulated DEGs at all time points (p < 0.05). In addition, the number of upregulated and downregulated DEGs in the liver continued to increase between 48 and 120 h.
The total number of upregulated and downregulated DEGs in spleen samples was 3557 and 4198, respectively (Table 2). The proportions of upregulated and downregulated DEGs 48 h post-infection were 43.4% and 56.6%, respectively. After 120 h of infection, the percentage of upregulated DEGs increased; however, it remained lower than that of downregulated DEGs. Overall, the total number of DEGs after 120 h of infection (4617) was higher than that after 48 h (3138).
The total numbers of upregulated and downregulated DEGs in the head kidney samples were 2229 and 2948, respectively (Table 2). The number of DEGs after 48 h post-infection in the head kidney (3554) was significantly higher than that after 120 h (1623). The percentage of downregulated DEGs at 48 h was 66.2% and that of upregulated DEGs increased (63.2%) after 120 h of infection.

3.3. DEG Functional Analysis

In total, 98,661 GO-annotated DEGs and 11,299 KEGG-annotated DEGs were detected in the liver; 102,177 GO-annotated DEGs and 12,566 KEGG-annotated DEGs were observed in the spleen; 78,267 and 9440 DEGs were annotated in the liver by the GO and KEGG databases, respectively (Table 3). Among all of the DEGs in the spleen, liver, and head kidney at different time points post-infection, the proportion of GO-annotated DEGs was distinctly higher than that of KEGG-annotated DEGs.
GO enrichment analysis was performed using topGO, where the gene list and the number of genes were calculated for each term using GO-annotated DEGs. The results of the GO enrichment analysis of DEGs were classified into GO categories according to molecular function, biological process, and cellular component. The top 10 GO term entries with the smallest p-value and the most significant enrichment in each GO classification were selected (Figure 1). The liver, spleen, and head kidney were enriched for multiple GO terms at both 48 and 120 h time points.
With regard to liver molecular function enzyme activity, peptidase activity GO terms were detected at 48 h, and hydrolase activity GO terms were detected at 120 h. Among biological processes, GO terms related to the immune response, protein decomposition, chemotaxis, and cell metal ion homeostasis were detected at 48 h, and GO terms related to metabolic processes were detected at 120 h. In addition, collagen trimer was detected in cell components at 120 h. The GO terms MHC class II protein complex, MHC protein complex, anchored component of membrane, and peptidase complex were detected at 48 h. Moreover, many upregulated genes were enriched in the phagosome, proteasome (Supplementary Figure S1), and ubiquitin-mediated proteolysis (Supplementary Figure S2).
Most GO terms related to biological processes and molecular functions in the spleen, including cytokine activity, chemokine activity, and enzyme inhibitor activity, were detected at 48 h. At 120 h, serine-type peptidase activity and serine hydrolase activity were detected. In biological processes, GO terms related to the response to stimulus, signal transduction, and cellular response to stimulus were detected at 48 h. GO terms related to stimulus and signal transduction were detected at 120 h.
Unlike in the liver and spleen, in the head kidney the 48 h GO enrichment was more significant than the 120 h GO enrichment and was most pronounced in terms of molecular functions. GO terms related to heme binding, chemokine activity, and chemokine receptor binding were detected at 48 h. At 120 h, enzyme activity, such as serine-type endopeptidase activity, was detected. Regarding biological processes, GO terms related to head kidney development, renal system development, and immune responses were detected at 48 h. At 120 h, GO terms related to leukocyte differentiation, cytokine responses, and cell activation were detected.
After infection, KEGG enrichment analysis was used to identify the 20 most enriched pathways in the liver, spleen, and head kidney (Figure 2). Among them, cytokine–cytokine receptor interactions (ko04060), hematopoietic cell lineage (ko04640), and complement and coagulation cascades (ko04610) were significantly enriched in the liver, spleen, and head kidney at 48 h and 120 h. Moreover, the JAK-STAT signaling pathway was strongly enriched.

3.4. Inflammation-Related Genes against S. agalactiae Infection

After infection, several inflammatory cytokine-related DEGs were detected in the liver, spleen, and head kidney. Three TNF and three TNF receptors (TNFR) were detected in the liver, spleen, and head kidney. In the liver, TNFα, TNFβ, TNFR3, and TNFR5 were significantly upregulated at 48–120 h (p < 0.05). In the spleen, TNFα and TNFR3 mRNA were significantly upregulated at 48–120 h (p < 0.05), and TNFβ was only significantly upregulated at 120 h (p < 0.05). The gene expression of TNF in the head kidney differed from that in the liver and spleen; however, significant differences were only observed at 120 h after infection. Seven interleukins and nine interleukin (IL) receptors were detected in the liver, spleen, and head kidney. IL-1β, IL-6α, and IL-1 mRNAs were significantly upregulated at 48–120 h (p < 0.05) in the liver and spleen. IL-17α and IL-6β mRNAs were significantly upregulated only at 120 h (p < 0.05), and IL-15 was also significantly upregulated in the spleen at 120 h (p < 0.05). In the head kidney, IL-1β, IL-6, and IL-11 mRNAs were significantly upregulated at 48 h (p < 0.05), and IL-8 mRNA was highly expressed at 120 h (p < 0.05). Notably, the expression of colony-stimulating factor 1 (CSF1), interferon γ (IFNγ), and IFNγ receptor (IFNγR) were detected in the spleen; CSF1, IFNγ, and IFNγR mRNAs were highly expressed at 48–120 h (Supplementary Figure S3).

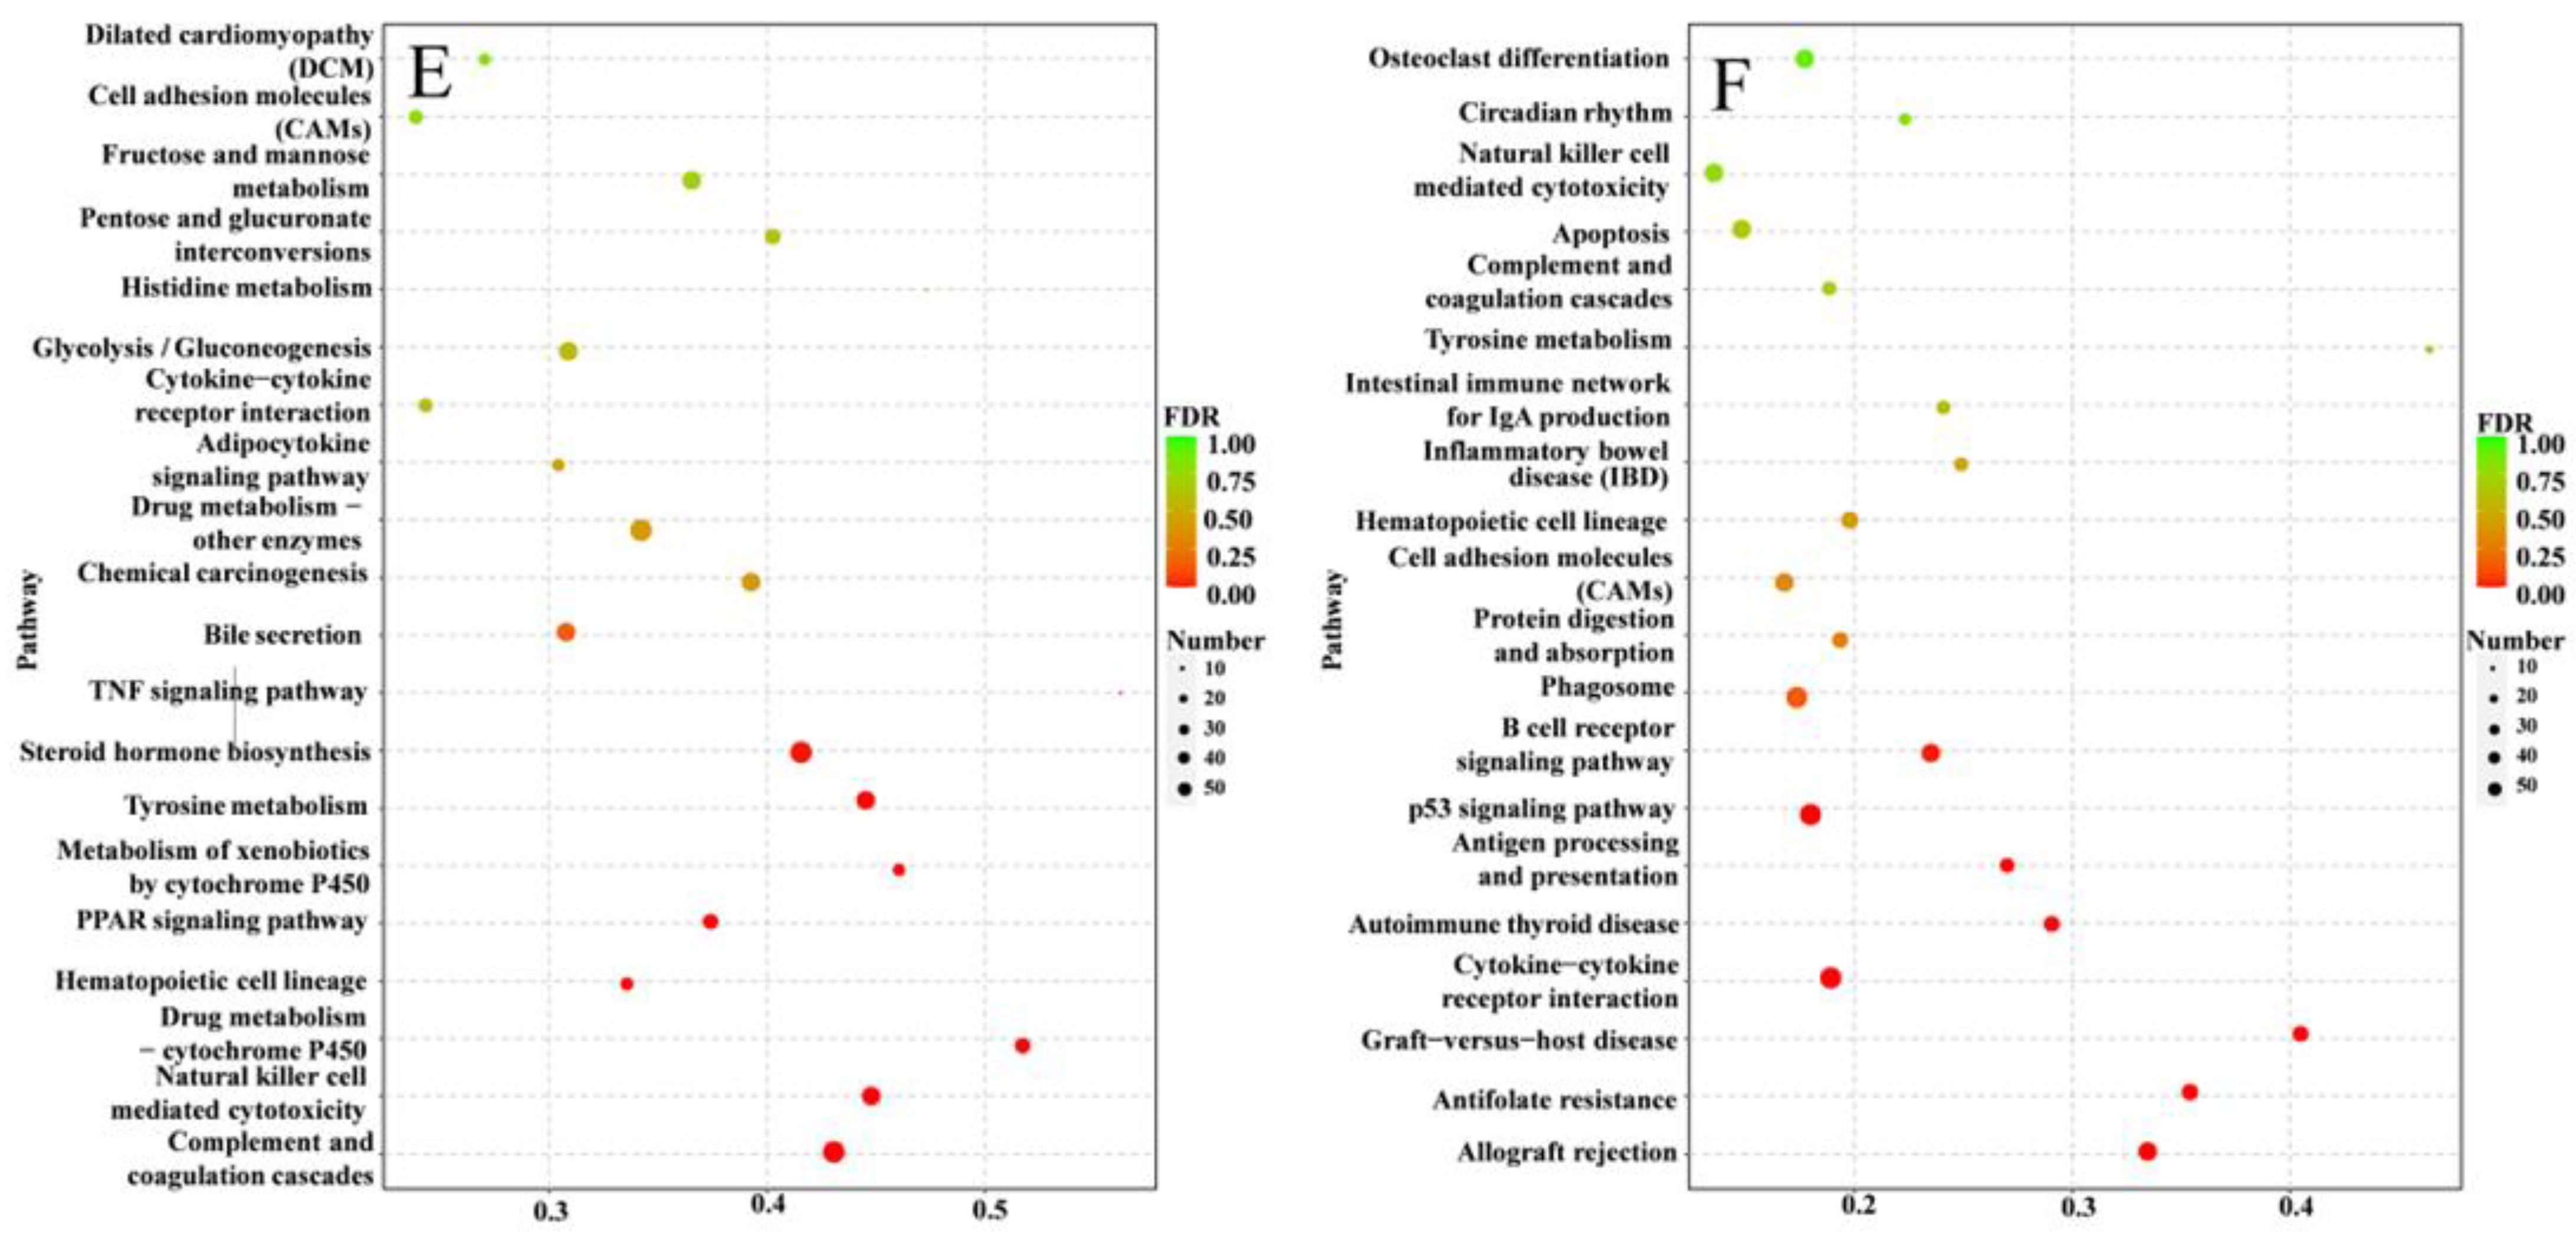
3.5. Inflammation-Related Pathways against S. agalactiae Infection

Based on the 19,553 DEGs that were co-detected in the liver, spleen, and head kidney, ten inflammation-related pathways were significantly enriched in the KEGG enrichment analysis, namely the chemokine signaling pathway, cytokine–cytokine receptor interaction, JAK-STAT signaling pathway, Th17 cell differentiation, complement and coagulation cascades, MAPK signaling pathway, TNF signaling pathway, NF-κB signaling pathway, Th1 and Th2 cell differentiation, and antigen processing and presentation (Table 4). The cytokine–cytokine receptor interaction signaling pathway is important for cell signaling as it mediates downstream signal transduction of chemokines and JAK-STAT pathways. Thirteen chemokine DEGs were detected in the liver, spleen, and kidney after infection.
In the liver, IL-2α, Janus kinase 1 (JAK1), and suppressor of cytokine signaling 1 (COCS) mRNAs were significantly upregulated at 48–120 h (p < 0.05). However, IL-2α, ciliary neurotrophic factor, and tyrosine-protein phosphatase non-receptor type 6 were significantly upregulated at 48 h (p < 0.05) but were downregulated at 120 h. IL-2α, IL-2 rα, and phosphatidylinositol-4,5-bisphosphate 3-kinase catalytic subunit α/β mRNA were significantly upregulated in the spleen at 48–120 h. JAK1, signal transducer, and activator of transcription 1 (STAT1) mRNAs were significantly upregulated only at 48 h (p < 0.05). However, four and a half LIM domains of protein 1 (SLIM) and cytokine-inducible SH2-containing protein mRNA were significantly downregulated only at 48 h (p < 0.05). Additionally, except for the glial fibrillary acidic protein, no significant differences were observed in the gene expression in the spleen at 120 h compared to 0 h. In the head kidney, only a few genes were upregulated or downregulated at the mRNA level; CXC motif chemokines 1/2/3/13 were significantly upregulated (p < 0.05), whereas CXC chemokine receptor type 2 (CXCR2) was significantly downregulated (Supplementary Figure S3).
In addition, DEGs of inflammatory signaling pathways were detected in the liver, spleen, and head kidney after infection. In the liver, the mRNA levels of the NF-κB inhibitor alpha-like (IKBα) and caspase-8 were significantly increased at 48 h (p < 0.05), and that of the NF-κB kinase subunit alpha (IKKα) was significantly increased at 120 h (p < 0.05). In the spleen and head kidney, IKBα, IKBβ, and caspase-8 mRNA were significantly upregulated at 48 h (p < 0.05). However, caspase-3 was only significantly upregulated at 120 h (p < 0.05) (Supplementary Figure S3).

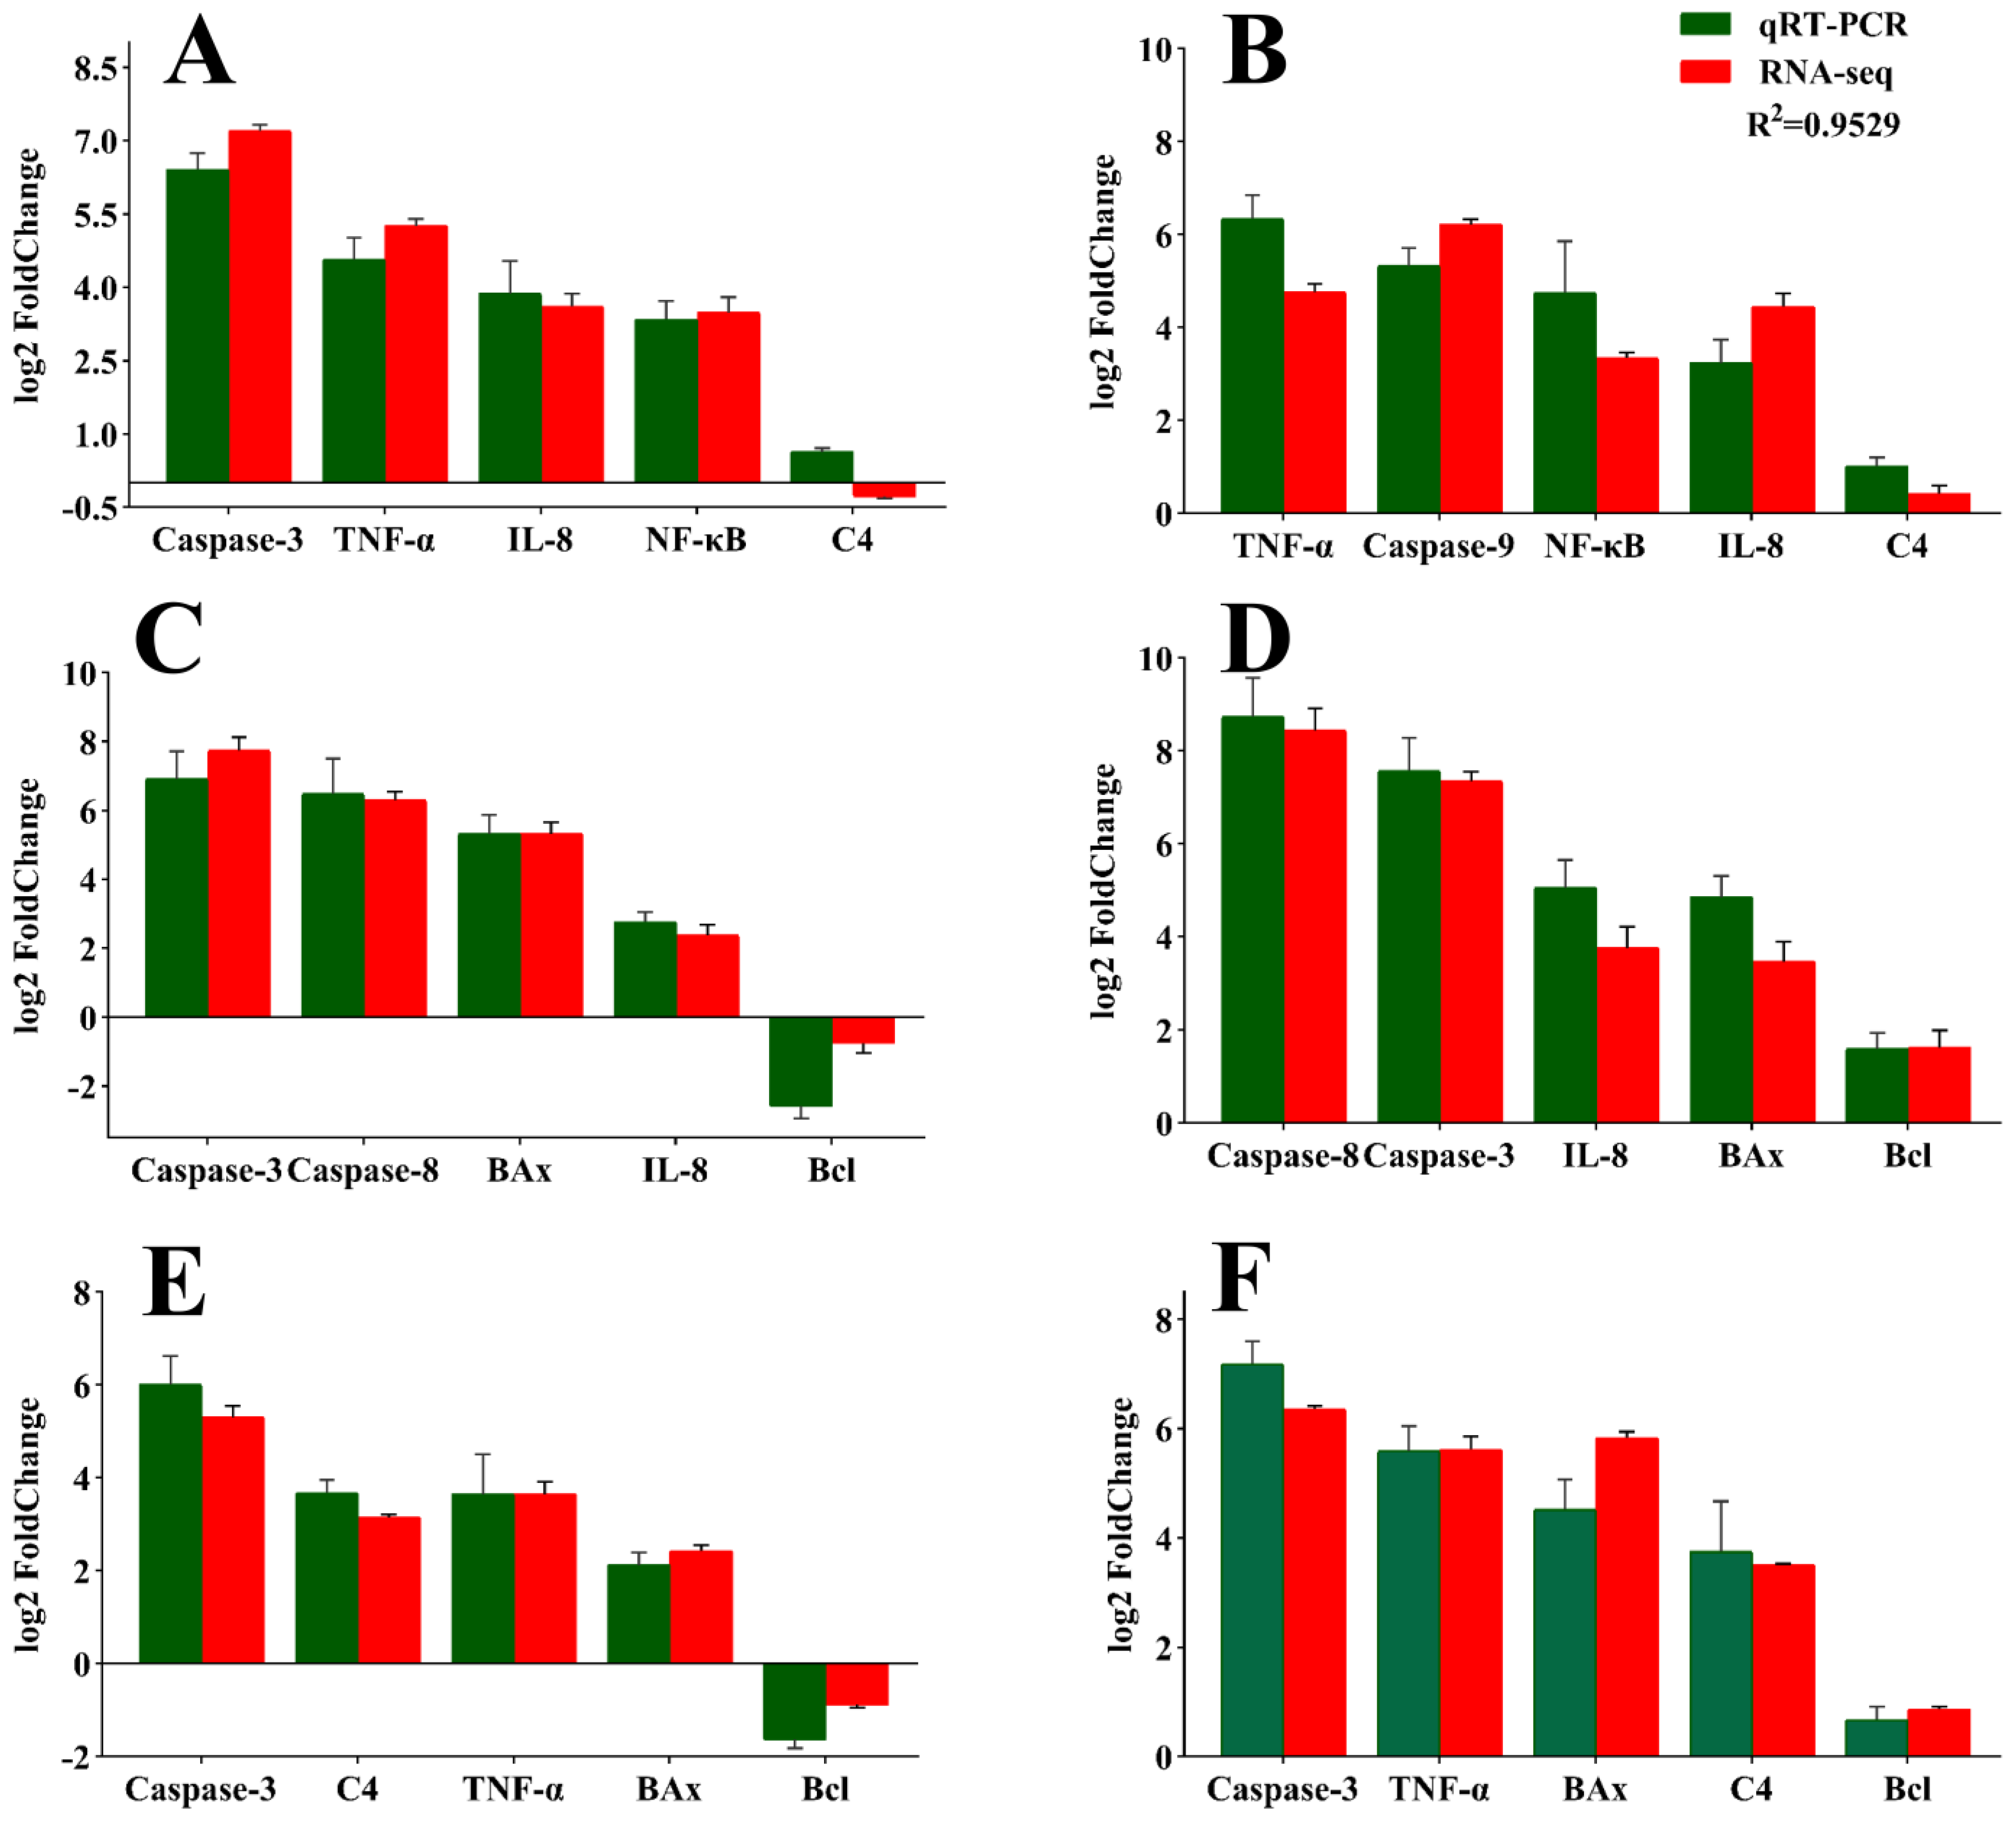
3.6. Validation of RNA Sequencing Data Results via qPCR

To validate the DEGs identified through comparative transcriptome analysis, we randomly selected eight genes at each time point (48 and 120 h post-infection) to confirm the differential expression via qPCR. Three sets of biological samples (n = 5 per pool) from the control and S. agalactiae-infected groups at different time points were used in the qPCR analysis. As shown in Figure 3, the results of the comparative analysis of all detected genes and transcriptomes were consistent, and there was little difference in expression levels. There was no significant difference in expression between the two methods, indicating the accuracy of transcriptome expression analysis. Melting curve analysis showed that only one product was amplified, indicating that the reference assembly was accurate and did not contain a large number of chimeric transcripts.

4. Discussion

Bacterial infections develop through pathogen–host interactions, and a strong response to the pathogen is necessary for the host’s survival [31]. We have previously studied the physiological and pathological changes of Streptococcus aureus infection in golden pompano, but failed to study its pathogenic mechanisms in depth [32]. Using modern molecular biology techniques to conduct transcriptomic analysis of the resistance of infected hosts and analyzing the expression and function of differential pathogenic genes during infection will help further clarify the pathogenic mechanisms involved. Such research will provide a theoretical basis for the prevention and treatment of diseases. Transcriptomics is widely used in marine animal research as it provides a vast amount of genetic data and lays the foundation for studies on aquatic animal growth and development, molecular markers, genetic improvements, and stress [33,34]. Using transcriptomics, analyzing the differential expression of genes is commonly applied to identify DEGs at the mRNA level [35,36,37].

4.1. Dynamic Immune Response of Golden Pompano against S. agalactiae

Previous transcriptomic analyses of the immune response to bacterial infection in fish have focused on specific tissues or time points after infection [4,17]. However, studies investigating the immune response in multiple tissues and at various time points after bacterial infections are limited. In the present study, we used RNA-seq to examine the course of immune responses in the liver, spleen, and head kidney at two different time points after infecting golden pompano fish with S. agalactiae. The spleen had the largest number of DEGs, followed by the liver, and then the head kidney. Overall, the number of DEGs annotated in the liver, spleen, and head kidney based on the GO database was higher than that based on the KEGG database (Table 2). This differential expression in golden pompano was similar to that reported in adult zebrafish infected with S. agalactiae for 24 and 48 h [38]. GO and KEGG enrichment analyses at different time points after infection showed differences in the biological functions of the liver, spleen, and head kidney.
The number and level of DEGs in the liver increased with time, as shown by the 48 h and 120 h post-infection levels. KEGG enrichment analysis revealed that during this period, the TNF signaling pathway (ko04668), NF-κB signaling pathway (ko04064), and complement and coagulation cascades (ko04610) were enriched. These results suggest that an immune response occurs in the liver 48 h after infection and is mediated by the production and activation of cytokines. It is then that the complement system plays an important role [39]. This immune dynamic is similar to that reported in Pelteobagrus fulvidraco after infection with Edwardsiella ictaluri [40]. Additionally, considerable energy is consumed during the inflammatory response to infection [41]. In the liver GO enrichment analysis, GO terms associated with fat digestion and absorption (ko04975) processes were detected at 48 h, whereas in the KEGG enrichment analysis, glycerolipid metabolism (ko00561), amino sugar and nucleotide sugar metabolism (ko00520), and fructose and mannose metabolism (ko00051) were enriched at 120 h after infection. This indicates that metabolic regulation in the liver of golden pompano is activated within 48 h of infection to provide energy for the immune response against bacterial infections.
In the spleen, the number of DEGs increased at 48 h after infection. Pathways related to DNA replication, cell cycle, RNA translocation, transcription, translation, and cellular metabolism of bacterial proliferation were enriched during infection. The glycolysis/gluconeogenesis pathway is essential for energy generation. Significant upregulation of genes in the glycolysis/gluconeogenesis pathway was also observed in golden pompano infected with S. agalactiae. Moreover, apoptosis (ko04210) was detected in the KEGG enrichment analysis. Because host signaling pathways play an essential role in many cellular processes [42], bacteria regulate these pathways in various ways; bacterial infections can activate PI3K-Akt/PKB signaling (ko04151) in golden pompano spleens, which induces bacterial replication and apoptosis [5]. In the present study, the PI3K-Akt/PKB signaling pathway was enriched for 88 DEGs at 120 h post-infection, most of which were related to cell activation. Activated PKB can directly phosphorylate apoptotic precursor proteins, such as BAD, and prevent apoptotic pathway activation [37,43]. This explains our observation of severe apoptosis in the spleen of golden pompano following infection with S. agalactiae.
The number of DEGs in the head kidney of golden pompano after infection with S. agalactiae was lower at 120 h than at 48 h. In the golden pompano spleen, cytokines were expressed at both 48 and 120 h, and a cytokine–cytokine receptor interaction (ko04060) was detected in the KEGG enrichment analysis at 48 and 120 h. Chemokines, a class of small extensively regulated cytokines or signaling proteins, are secreted by cells to induce targeted chemotaxis in nearby cells [44]. These results suggest that cytokines can be consistently and significantly transcribed in the spleen of golden pompano after S. agalactiae infection. A similar expression pattern was found in common carp [45].
Notably, the cytokine–cytokine receptor interaction (ko04060), hematopoietic cell lineage (ko04640), and complement and coagulation cascades (ko04610) were enriched in the liver, spleen, and head kidney during the whole assay. The JAK-STAT signaling pathway is a hub for cytokine secretion [46]; several pro-inflammatory molecules signal via the JAK-STAT pathway to mediate downstream effects and activate gene transcription to regulate local and systemic inflammation in response to bacterial infection [47]. These findings indicate that the immune response is ongoing, the innate immune and coagulation systems interact, and in pathological situations, they are organically linked to coordinate defense against pathogenic invasion and damage to the organism.

4.2. Changes in the Expression of Inflammation-Related DEGs in S. agalactiae Infection

In fish, antimicrobial peptides belong to the innate immune system and have an important defense function. Antimicrobial peptide expression occurs mainly after recognizing binding patterns between receptors and pathogenic molecules. The binding induces the activation of transcription factor NF-ĸB, leading to the production of antimicrobial peptides and other pro-inflammatory factors. Host immune responses against microorganisms are regulated and mediated by several molecules that can exert both pro-inflammatory and anti-inflammatory roles [48,49,50]. When the inflammatory process is initiated, several pro-inflammatory cytokines, such as IL-1β, IL-8, and TNF, are activated and released [51,52]. IL-11, a member of the IL-6 cytokine family, exhibits multiple pro-inflammatory and anti-inflammatory effects, such as stimulation of the acute-phase response and induction of immunoglobulin production [53]. IL-11 can bind to macrophage receptors to form a positive feedback regulation mechanism, causing cells to produce inflammation [54]. Meanwhile, IL-11 can also play an anti-inflammatory role by inhibiting inflammatory factors, such as TNF and IL-12, or enhancing the expression of the inhibitor of NF-κB (IκB) to inhibit IκBα. This finding was also verified by inflammation in Ctenopharyngodon idella infected with A. hydrophila [55]. Moreover, IL-11 mediates its anti-inflammatory effects by promoting the binding of NF-κB to TNF and IL-1β promoter sites. IL-12 acts as a pro-inflammatory factor and can promote the differentiation of Th1 cells. Differentiated Th1 cells produce IFNγ, which can indirectly activate neutrophils [56]. IL-17α, an important inflammatory factor in Th17 cells, can induce both chemokines and inflammatory factors [57].
Chemokines are a class of low-molecular-weight proteins secreted by cells upon activation by pathogenic factors such as viruses, bacteria, and parasites, and can induce leukocyte chemotaxis [58]. CXC13 mainly attracts lymphocytes and monocytes after pathogenic bacterial infection [59]. Tian et al. found that a triple vaccine quickly induced significant upregulation of CXC13 in the visceral tissue of Larimichthys crocea, suggesting that CXC13 is involved in the inflammatory response caused by bacterial infection [60]. CXC13 maintained a high expression level in this study after S. agalactiae infection. This result showed that it might be involved in the chemotaxis process of phagocytes after infection.
Many inflammatory cytokines, such as IL-1β, IL-12, IL-17, and IFNγ, have been reported. They are mainly synthesized by peripheral immune cells (such as macrophages, lymphocytes, and fibroblasts), participate in immune and inflammatory responses and reactions, and play essential roles in the chemotaxis and activation of macrophages, neutrophils, and lymphocytes [61,62,63]. In the present study, the mRNA expression levels of the four factors were significantly increased after infection, indicating that phagocytosis played an essential role in the defense against S. agalactiae infection. At the same time, IFNγ activates the JAK-STAT signaling pathway through IFNγR1 and IFNγR2 [64]. Many genes, such as IL-1β, IL-12, IL-17, and IFNγ, play similar roles in mammals [61,62,63]. IFNγ activates the JAK-STAT signaling pathway through IFNγR1 and IFNγR2 [64].

4.3. Changes in the Expression of the JAK-STAT Signaling Pathway against S. agalactiae

The JAK-STAT signaling pathway plays a key role in regulating the functions of various cells and maintaining stem cell homeostasis during the adaptive immune response of the fish liver, spleen, and head kidney (Supplementary Figure S4) [65]. Transcriptional gene activator proteins are involved in the signal transduction process of various cytokines and growth factors in cells, and this pathway plays a role in signal transduction. There is a close connection between the JAK-STAT pathway and cell proliferation, differentiation, apoptosis, bacterial infection, immune regulation, and inflammation [66]. During regulation of the JAK/STAT pathway, STAT1 and STAT4 can regulate type I interferon, which plays a crucial role in natural killer cells. When Mycobacterium tuberculosis infects macrophages, JAK/STAT signaling is rapidly activated, reducing infection risk. STAT1 is rapidly phosphorylated, and the transcription of downstream apoptotic factors is promoted [67,68].
In the present study, several DEGs were involved in the JAK/STAT pathway. Regarding the JAK family, JAK1, JAK2, JAK3, and TYK2 are widely distributed in the liver, spleen, and head kidney, and JAK1 has been shown to play a key role in the overall immune response [69]. Similarly, IFNγ-mediated STAT1 signaling induces macrophages to enhance resistance to bacteria, conferring protection to the host [70]. STAT3 acts as an important mediator of IL-6 and IL-22, plays a pro-inflammatory role in regulating the adaptive immune system, and exhibits an important protective effect on innate immune cells [71]. Additionally, it has been shown that inflammation develops because of the co-activation and interaction of multiple STATs [72]. Together with previous research, our results suggest that this pathway may have an essential role in the host’s response to S. agalactiae infection.
Collectively, these findings indicate that the immune system of golden pompano is rapidly activated upon S. agalactiae infection to fight invading pathogens. Although we systematically elucidated the immune response of golden pompano infected with S. agalactiae, we were limited to analyzing spatiotemporal expression patterns in the liver, spleen, and head kidney after infection. In the future, we plan to further study the spatiotemporal expression patterns in various immune tissues and the pathogenesis of fish infections.

5. Conclusions

This study describes the immune responses, at the mRNA level, of the liver, spleen, and head kidney at different times after infection. Our results indicate that multiple inflammation-related signaling pathway genes are dysregulated during S. agalactiae infection. The slightly lower expression levels of most genes in immune-related pathways relative to those of inflammatory genes suggest that S. agalactiae may suppress the host’s innate immunity. Future research will focus on screening for those DEGs associated with S. agalactiae resistance to improve survival. In conclusion, the transcriptomic data and related analyses presented here will contribute to a better understanding of the defense mechanisms related to bacterial infections and provide essential information regarding the immune regulation of bacterial diseases in golden pompano.

Supplementary Materials

The following supporting information can be downloaded at https://www.mdpi.com/article/10.3390/fishes8010052/s1: Figure S1: The Changes of hepatic proteasome at 96 h of infection. Red, green and purple arrows indicate genes increased in liver, spleen and head kidney, respectively; Figure S2: The Changes of hepatic ubiquitin-mediated proteolysis at 96 h of infection. Red, green and purple arrows indicate genes increased in liver, spleen and head kidney, respectively; Figure S3: Illustrated overview of the inflammatory response in the golden pompano; Figure S4: Changes in JAK-STAT signaling pathway at different time points after infection. Red boxes indicate genes with increased expression; Green boxes indicate genes with reduced expression; Purple boxes indicate genes whose expression is uncertain; Table S1: Disembarkation data; Table S2: Data filtering statistics.

Author Contributions

D.-C.Z. and S.-G.J.: writing—review and editing, funding acquisition. J.G. and H.-Y.G.: writing—original draft. K.-C.Z.: data curation. B.L.: supervision. N.Z.: visualization, investigation. M.-J.L.: methodology, software. B.-S.L.: software, validation. All authors have read and agreed to the published version of the manuscript.

Funding

This study was supported by the Key Projects of Joint Fund for Regional Innovation and Development of NSFC (U20A2064), the Central Public Interest Scientific Institution Basal Research Fund CAFS (NO.2020TD29), the Earmarked fund for CARS-47 (CARS-47), the Central Public-Interest Scientific Institution Basal Research Fund of South China Sea Fisheries Research Institute, the CAFS (2021SD12), and the Guangdong Provincial Special Fund for Modern Agriculture Industry Technology Innovation Teams (2019KJ143).

Institutional Review Board Statement

The Committee of the South China Sea Fisheries Research Institute, Chinese Academy of Fisheries Sciences (no. SCSFRI96-253) approved the animal protocols, and all experiments were performed under the applicable standards.

Informed Consent Statement

Not applicable.

Data Availability Statement

The datasets presented in this study can be found in online repositories. The names of the repository and accession number can be found below: BioProject, accession number PRJNA871979.

Conflicts of Interest

The authors declare that the research was conducted in the absence of any commercial or financial relationships that could be construed as potential conflict of interest.

References

  1. Liu, M.J.; Guo, H.Y.; Liu, B.; Zhu, K.C.; Guo, L.; Liu, B.S.; Zhang, N.; Yang, J.W.; Jiang, S.G.; Zhang, D.C. Gill oxidative damage caused by acute ammonia stress was reduced through the HIF-1α/NF-κb signaling pathway in golden pompano (Trachinotus ovatus). Ecotoxicol. Environ. Saf. 2021, 222, 112504. [Google Scholar] [CrossRef] [PubMed]
  2. Guo, S.; Mo, Z.; Wang, Z.; Xu, J.; Li, Y.; Dan, X.; Li, A. Isolation and pathogenicity of Streptococcus iniae in offshore cage-cultured Trachinotus ovatus in China. Aquaculture 2018, 492, 247–252. [Google Scholar] [CrossRef]
  3. Qian, X.; Ba, Y.; Zhuang, Q.; Zhong, G. RNA-Seq technology and its application in fish transcriptomics. OMICS 2014, 18, 98–110. [Google Scholar] [CrossRef] [PubMed] [Green Version]
  4. Costa, V.; Angelini, C.; De Feis, I.; Ciccodicola, A. Uncovering the complexity of transcriptomes with RNA-Seq. J. BioMed. Biotechnol. 2010, 2010, 853–916. [Google Scholar] [CrossRef] [Green Version]
  5. Romero, A.; Saraceni, P.R.; Pereiro, P.; Tomás, J.; Merino, S.; Figueras, A.; Novoa, B. Development of a zebrafish larvae infection model to study virulence factors of A. hydrophila. Fish Shellfish. Immunol. 2016, 55, 85–86. [Google Scholar] [CrossRef]
  6. Maekawa, S.; Wang, P.C.; Chen, S.C. Comparative study of immune reaction against bacterial infection from transcriptome analysis. Front. Immunol. 2019, 10, 153. [Google Scholar] [CrossRef] [PubMed]
  7. Kim, A.; Yoon, D.; Lim, Y.; Roh, H.J.; Kim, S.; Park, C.I.; Kim, H.S.; Cha, H.J.; Choi, Y.H.; Kim, D.H. Co-expression network analysis of spleen transcriptome in rock bream (Oplegnathus fasciatus) naturally infected with rock bream iridovirus (RBIV). Int. J. Mol. Sci. 2020, 21, 1707. [Google Scholar] [CrossRef] [Green Version]
  8. Xu, D.; Han, P.; Xia, L.; Gan, J.; Xu, Q. A comparative transcriptome analysis focusing on immune responses of Asian swamp eel following infection with Aeromonas hydrophila. Aquaculture 2021, 539, 736655. [Google Scholar] [CrossRef]
  9. Song, L.; Dong, X.; Hu, G. Transcriptome analysis of red sea bream (Pagrus major) head kidney and spleen infected by Vibrio anguillarum. Aquac. Rep. 2021, 21, 100789. [Google Scholar] [CrossRef]
  10. Han, C.; Li, Q.; Chen, Q.; Zhou, G.; Huang, J.; Zhang, Y. Transcriptome analysis of the spleen provides insight into the immunoregulation of Mastacembelus armatus under Aeromonas veronii infection. Fish Shellfish. Immunol. 2019, 88, 272–283. [Google Scholar] [CrossRef]
  11. Long, M.; Zhao, J.; Li, T.; Tafalla, C.; Zhang, Q.; Wang, X.; Gong, X.; Shen, Z.; Li, A. Transcriptomic and proteomic analyses of splenic immune mechanisms of rainbow trout (Oncorhynchus mykiss) infected by Aeromonas salmonicida subsp. salmonicida. J. Proteom. 2015, 122, 41–54. [Google Scholar] [CrossRef] [PubMed]
  12. Li, J.; Zhang, X.; Xu, J.; Pei, X.; Wu, Z.; Wang, T.; Yin, S. iTRAQ analysis of liver immune-related proteins from darkbarbel catfish (Pelteobagrus vachelli) infected with Edwardsiella ictaluri. Fish Shellfish. Immunol. 2019, 87, 695–704. [Google Scholar] [CrossRef] [PubMed]
  13. Mugimba, K.K.; Byarugaba, D.K.; Mutoloki, S.Ø.; Evensen, H.M.; Munang’Andu, H.M. Challenges and solutions to viral diseases of finfish in Marine Aquaculture. Pathogens 2021, 10, 673. [Google Scholar] [CrossRef] [PubMed]
  14. Johri, A.K.; Paoletti, L.C.; Glaser, P.; Dua, M.; Sharma, P.K.; Grandi, G.; Rappuoli, R. Group B Streptococcus: Global incidence and vaccine development. Nat. Rev. Microbiol. 2006, 4, 932–942. [Google Scholar] [CrossRef]
  15. Lee, I.P.A.; Andam, C.P. Frequencies and characteristics of genome-wide recombination in Streptococcus agalactiae, Streptococcus pyogenes, and Streptococcus suis. Sci. Rep. 2022, 12, 1515. [Google Scholar] [CrossRef]
  16. Zeng, Y.F.; Zeng, Y.F.; Zeng, Y.F.; Zeng, Y.F.; Chen, C.M.; Chen, C.M.; Li, X.Y.; Chen, J.J.; Chen, J.J.; Chen, J.J.; et al. Development of a droplet digital PCR method for detection of Streptococcus agalactiae. BMC Microbiol. 2020, 20, 179. [Google Scholar] [CrossRef]
  17. Causey, D.R.; Pohl MA, N.; Stead, D.A.; Martin SA, M.; Secombes, C.J.; Macqueen, D.J. High-throughput proteomic profiling of the fish liver following bacterial infection. BMC Genom. 2018, 19, 717. [Google Scholar] [CrossRef] [Green Version]
  18. Huang, J.; Chen, W.; Wang, Q.; Zhang, Y.; Liu, Q.; Yang, D. Iso-Seq assembly and functional annotation of full-length transcriptome of turbot (Scophthalmus maximus) during bacterial infection. Mar. Genom. 2022, 63, 100954. [Google Scholar] [CrossRef]
  19. Ding, F.F.; Li, C.H.; Chen, J. Molecular characterization of the NK-lysin in a teleost fish, Boleophthalmus pectinirostris: Antimicrobial activity and immunomodulatory activity on monocytes/macrophages. Fish Shellfish. Immunol. 2019, 92, 256–264. [Google Scholar] [CrossRef]
  20. Ye, H.; Xiao, S.; Wang, X.; Wang, Z.; Zhang, Z.; Zhu, C.; Hu, B.; Lv, C.; Zheng, S.; Luo, H. Characterization of Spleen Transcriptome of Schizothorax prenanti during Aeromonas hydrophila Infection. Mar. Biotechnol. 2018, 20, 246–256. [Google Scholar] [CrossRef]
  21. Roubach, R.; Gomes, L.C.; Leão Fonseca, F.A.; Val, A.L. Eugenol as an efficacious anaesthetic for tambaqui, Colossoma macropomum (Cuvier). Aquac. Res. 2005, 36, 1056–1061. [Google Scholar] [CrossRef]
  22. Loureiro, S.; Amorim, A.; Cainé, L.; Silva, B.; Gomes, I. Evaluation of two DNA/RNA co-extraction methods for organism fluid identification in forensics. Forensic Sci. Int. Genet. Suppl. Ser. 2019, 7, 250–252. [Google Scholar] [CrossRef]
  23. Love, M.I.; Huber, W.; Anders, S. Moderated estimation of fold change and dispersion for RNA-seq data with DESeq. Genome Biol. 2014, 15, 550. [Google Scholar] [CrossRef] [PubMed] [Green Version]
  24. Wang, L.; Feng, Z.; Wang, X.; Wang, X.; Zhang, X. DEGseq: An R package for identifying differentially expressed genes from RNA-seq data. Bioinformatics 2010, 26, 136–138. [Google Scholar] [CrossRef] [PubMed] [Green Version]
  25. Götz, S.; García-Gómez, J.M.; Terol, J.; Williams, T.D.; Nagaraj, S.H.; Nueda, M.J.; Robles, M.; Talón, M.; Dopazo, J.; Conesa, A. High-throughput functional annotation and data mining with the Blast2GO suite. Nucleic Acids Res. 2008, 36, 3420–3435. [Google Scholar] [CrossRef]
  26. Trapnell, C.; Hendrickson, D.G.; Sauvageau, M.; Goff, L.; Rinn, J.L.; Pachter, L. Differential analysis of gene regulation at transcript resolution with RNA-seq. Nat. Biotechnol. 2013, 31, 46–53. [Google Scholar] [CrossRef]
  27. Kanehisa, M.; Goto, S.; Kawashima, S.; Okuno, Y.; Hattori, M. The KEGG resource for deciphering the genome. Nucleic Acids Res. 2004, 32, D277–D280. [Google Scholar] [CrossRef] [Green Version]
  28. Kanehisa, M.; Araki, M.; Goto, S.; Hattori, M.; Hirakawa, M.; Itoh, M.; Katayama, T.; Kawashima, S.; Okuda, S.; Tokimatsu, T.; et al. KEGG for linking genomes to life and the environment. Nucleic Acids Res. 2008, 36, D480–D484. [Google Scholar] [CrossRef]
  29. Liu, M.J.; Guo, H.Y.; Zhu, K.C.; Liu, B.S.; Liu, B.; Guo, L.; Zhang, N.; Yang, J.W.; Jiang, S.G.; Zhang, D.C. Effects of acute ammonia exposure and recovery on the antioxidant response and expression of genes in the Nrf2-Keap1 signaling pathway in the juvenile golden pompano (Trachinotus ovatus). Aquat. Toxicol. 2021, 240, 105969. [Google Scholar] [CrossRef]
  30. Livak, K.J.; Schmittgen, T.D. Analysis of relative gene expression data using real-time quantitative PCR and the 2−ΔΔCT Method. Methods 2001, 25, 402–408. [Google Scholar] [CrossRef]
  31. Luo, G.; Sun, Y.; Huang, L.; Su, Y.; Zhao, L.; Qin, Y.; Xu, X.; Yan, Q. Time-resolved dual RNA-seq of tissue uncovers Pseudomonas plecoglossicida key virulence genes in host-pathogen interaction with Epinephelus coioides. Environ. Microbiol. 2020, 22, 677–693. [Google Scholar] [CrossRef] [PubMed]
  32. Gao, J.; Liu, M.J.; Guo, H.Y.; Zhu, K.C.; Liu, B.; Liu, B.S.; Zhang, N.; Zhang, D.C. ROS Induced by Streptococcus agalactiae Activate Inflammatory Responses via the TNF-α/NF-κB Signaling Pathway in Golden Pompano Trachinotus ovatus (Linnaeus, 1758). Antioxidants 2022, 11, 1809. [Google Scholar] [CrossRef]
  33. Gates, K.; Sandoval-Castillo, J.; Bernatchez, L.; Beheregaray, L.B. De novo transcriptome assembly and annotation for the desert rainbowfish (Melanotaenia splendida tatei) with comparison with candidate genes for future climates. Mar. Genom. 2017, 35, 63–68. [Google Scholar] [CrossRef]
  34. Chou, C.H.; Huang, H.Y.; Huang, W.C.; Hsu S da Hsiao C der Liu, C.Y.; Chen, Y.H.; Liu, Y.C.; Huang, W.Y.; Lee, M.L.; Chen, Y.C.; Huang, H.D. The aquatic animals’ transcriptome resource for comparative functional analysis. BMC Genom. 2018, 19, 162–180. [Google Scholar] [CrossRef] [PubMed]
  35. Mola, S.; Foisy, S.; Boucher, G.; Major, F.; Beauchamp, C.; Karaky, M.; Goyette, P.; Lesage, S.; Rioux, J.D. A transcriptome-based approach to identify functional modules within and across primary human immune cells. PLoS ONE 2020, 15, e0233543. [Google Scholar] [CrossRef]
  36. Li, B.J.; Jiang, D.L.; Meng, Z.N.; Zhang, Y.; Zhu, Z.X.; Lin, H.R.; Xia, J.H. Genome-wide identification and differentially expression analysis of lncRNAs in tilapia 06 Biological Sciences 0604 Genetics. BMC Genom. 2018, 19, 2–12. [Google Scholar] [CrossRef] [Green Version]
  37. Anitha, A.; Gupta, Y.R.; Deepa, S.; Ningappa, M.; Rajanna, K.B.; Senthilkumaran, B. Gonadal transcriptome analysis of the common carp, Cyprinus carpio: Identification of differentially expressed genes and SSRs. Gen. Comp. Endocrinol. 2019, 279, 67–77. [Google Scholar] [CrossRef]
  38. Wu, X.M.; Cao, L.; Hu, Y.W.; Chang, M.X. Transcriptomic characterization of adult zebrafish infected with Streptococcus agalactiae. Fish Shellfish. Immunol. 2019, 94, 355–372. [Google Scholar] [CrossRef] [PubMed]
  39. Dostert, C.; Grusdat, M.; Letellier, E.; Brenner, D. The TNF Family of Ligands and Receptors: Communication Modules in the Immune System and Beyond. Physiol. Rev. 2019, 99, 115–160. [Google Scholar] [CrossRef]
  40. Zhou, X.; Zhang, G.R.; Ji, W.; Shi, Z.C.; Ma, X.F.; Luo, Z.L.; Wei, K.J. The Dynamic Immune Response of Yellow Catfish (Pelteobagrus fulvidraco) Infected With Edwardsiella ictaluri Presenting the Inflammation Process. Front. Immunol. 2021, 12, 625928. [Google Scholar] [CrossRef]
  41. Schneebauer, G.; Dirks, R.P.; Pelster, B. Anguillicola crassus infection affects mRNA expression levels in gas gland tissue of European yellow and silver eel. PLoS ONE 2017, 12, e0183128. [Google Scholar] [CrossRef] [Green Version]
  42. Li, C.; Jiang, J.; Xie, J.; Yang, W.; Wang, Y. Transcriptome profiling and differential expression analysis of the immune-related genes during the acute phase of infection with Mycobacterium marinum in the goldfish (Carassius auratus L.). Aquaculture 2021, 533, 736198. [Google Scholar] [CrossRef]
  43. Hossini, A.M.; Quast, A.S.; Plötz, M.; Grauel, K.; Exner, T.; Küchler, J.; Stachelscheid, H.; Eberle, J.; Rabien, A.; Makrantonaki, E.; et al. PI3K/AKT signaling pathway is essential for survival of induced pluripotent stem cells. PLoS ONE 2016, 11, e0154770. [Google Scholar] [CrossRef] [PubMed] [Green Version]
  44. Thelen, M. Dancing to the tune of chemokines. Nat. Immunol. 2001, 2, 129–134. [Google Scholar] [CrossRef]
  45. Jiang, Y.; Feng, S.; Zhang, S.; Liu, H.; Feng, J.; Mu, X.; Sun, X.; Xu, P. Transcriptome signatures in common carp spleen in response to Aeromonas hydrophila infection. Fish Shellfish. Immunol. 2016, 57, 41–48. [Google Scholar] [CrossRef] [PubMed]
  46. Majoros, A.; Platanitis, E.; Kernbauer-Hölzl, E.; Rosebrock, F.; Müller, M.; Decker, T. Canonical and non-canonical aspects of JAK-STAT signaling: Lessons from interferons for cytokine responses. Front. Immunol. 2017, 8, 29. [Google Scholar] [CrossRef] [PubMed] [Green Version]
  47. Ezeonwumelu, I.J.; Garcia-Vidal, E.; Ballana, E. JAK-STAT pathway: A novel target to tackle viral infections. Viruses 2021, 13, 2379. [Google Scholar] [CrossRef]
  48. Dondelinger, Y.; Hulpiau, P.; Saeys, Y.; Bertrand MJ, M.; Vandenabeele, P. An evolutionary perspective on the necroptotic pathway. Trends Cell Biol. 2016, 26, 721–732. [Google Scholar] [CrossRef]
  49. Nathan, C. Points of control in inflammation. Nature 2002, 420, 846–852. [Google Scholar] [CrossRef]
  50. Chazaud, B. Inflammation and Skeletal Muscle Regeneration: Leave It to the Macrophages! Trends Immunol. 2020, 41, 481–492. [Google Scholar] [CrossRef]
  51. Pérez-Figueroa, E.; Álvarez-Carrasco, P.; Ortega, E.; Maldonado-Bernal, C. Neutrophils: Many Ways to Die. Front. Immunol. 2021, 12, 631821. [Google Scholar] [CrossRef]
  52. Ribeiro, A.B.; de Barcellos-Filho PC, G.; Franci, C.R.; Menescal-de-Oliveira, L.; Saia, R.S. Pro-inflammatory cytokines, IL-1β and TNF-α, produce persistent compromise in tonic immobility defensive behaviour in endotoxemia guinea-pigs. Acta Physiol. 2016, 218, 123–135. [Google Scholar] [CrossRef] [PubMed]
  53. Cho, N.; Nguyen, D.H.; Satkunendrarajah, K.; Branch, D.R.; Fehlings, M.G. Evaluating the role of IL-11, a novel cytokine in the IL-6 family, in a mouse model of spinal cord injury. J. Neuroinflam. 2012, 9, 2–12. Available online: http://www.jneuroinflammation.com/content/9/1/134 (accessed on 5 October 2022). [CrossRef] [PubMed] [Green Version]
  54. Tang, W.; Geba, G.P.; Zheng, T.; Ray, P.; Homer, R.J.; Kuhn, C.; Flavell, R.A.; Elias, J.A. Targeted expression of IL-11 in the murine airway causes lymphocytic inflammation, bronchial remodeling, and airways obstruction. J. Clin. Investig. 1996, 98, 2845–2853. [Google Scholar] [CrossRef]
  55. Tie, H.M.; Jiang, W.D.; Feng, L.; Wu, P.; Liu, Y.; Kuang, S.Y.; Tang, L.; Zhou, X.Q. Dietary nucleotides in the diets of on-growing grass carp (Ctenopharyngodon idella) suppress Aeromonas hydrophila induced intestinal inflammation and enhance intestinal disease-resistance via NF-κB and TOR signaling. Aquaculture 2021, 533, 736075. [Google Scholar] [CrossRef]
  56. Chou, F.C.; Chen, H.Y.; Chen, H.H.; Lin, G.J.; Lin, S.H.; Sytwu, H.K. Differential modulation of IL-12 family cytokines in autoimmune islet graft failure in mice. Diabetologia 2017, 60, 2409–2417. [Google Scholar] [CrossRef] [Green Version]
  57. Nadeem, A.; Al-Harbi, N.O.; Alfardan, A.S.; Ahmad, S.F.; AlAsmari, A.F.; Al-Harbi, M.M. IL-17A-induced neutrophilic airway inflammation is mediated by oxidant-antioxidant imbalance and inflammatory cytokines in mice. Biomed. Pharmacother. 2018, 107, 1196–1204. [Google Scholar] [CrossRef]
  58. Laing, K.J.; Secombes, C.J. Chemokines. Dev. Comp. Immunol. 2004, 28, 443–460. [Google Scholar] [CrossRef]
  59. Korbecki, J.; Kojder, K.; Barczak, K.; Simińska, D.; Gutowska, I.; Chlubek, D.; Baranowska-Bosiacka, I. Hypoxia alters the expression of CC chemokines and cc chemokine receptors in a tumor–a literature review. Int. J. Mol. Sci. 2020, 21, 5647. [Google Scholar] [CrossRef]
  60. Tian, C.; Chen, Y.; Ao, J.; Chen, X. Molecular characterization and bioactivity of a CXCL13 chemokine in large yellow croaker Pseudosciaena crocea. Fish Shellfish. Immunol. 2010, 28, 445–452. [Google Scholar] [CrossRef]
  61. Hong, S.; Li, R.; Xu, Q.; Secombes, C.J.; Wang, T. Two types of TNF-alpha exist in teleost fish: Phylogeny, expression, and bioactivity analysis of type-II TNF-alpha3 in rainbow trout Oncorhynchus mykiss. J. Immunol. 2013, 191, 5959–5972. [Google Scholar] [CrossRef] [PubMed] [Green Version]
  62. Ding, Y.; Ao, J.; Ai, C.; Chen, X. Molecular and functional identification of three interleukin-17A/F (IL-17A/F) homologues in large yellow croaker (Larimichthys crocea). Dev. Comp. Immunol. 2016, 55, 221–232. [Google Scholar] [CrossRef]
  63. Zou, J.; Secombes, C.J. The function of fish cytokines. Biology 2016, 5, 23. [Google Scholar] [CrossRef] [PubMed]
  64. Kelly, A.; Robinson, M.W.; Roche, G.; Biron, C.A.; O’Farrelly, C.; Ryan, E.J. Immune Cell Profiling of IFN-λ Response Shows pDCs Express Highest Level of IFN-λR1 and Are Directly Responsive via the JAK-STAT Pathway. J. Interferon Cytokine Res. 2016, 36, 671–680. [Google Scholar] [CrossRef] [PubMed] [Green Version]
  65. Liongue, C.; Sertori, R.; Ward, A.C. Evolution of Cytokine Receptor Signaling. J. Immunol. 2016, 197, 11–18. [Google Scholar] [CrossRef] [Green Version]
  66. Morris, R.; Kershaw, N.J.; Babon, J.J. The molecular details of cytokine signaling via the JAK/STAT pathway. Protein Sci. 2018, 27, 1984–2009. [Google Scholar] [CrossRef] [Green Version]
  67. Miyagi, T.; Gil, M.P.; Wang, X.; Louten, J.; Chu, W.M.; Biron, C.A. High basal STAT4 balanced by STAT1 induction to control type 1 interferon effects in natural killer cells. J. Exp. Med. 2007, 204, 2383–2396. [Google Scholar] [CrossRef] [Green Version]
  68. Yao, K.Z.; Chen, Q.; Wu, Y.; Liu, F.; Chen, X.; Zhang, Y. Unphosphorylated STAT1 represses apoptosis in macrophages during Mycobacterium Tuberculosis infection. J. Cell Sci. 2017, 130, 1740–1751. [Google Scholar] [CrossRef] [Green Version]
  69. Nakayamada, S.; Poholek, A.C.; Lu, K.T.; Takahashi, H.; Kato, M.; Iwata, S.; Hirahara, K.; Cannons, J.L.; Schwartzberg, P.L.; Vahedi, G.; et al. Type I IFN Induces Binding of STAT1 to Bcl6: Divergent Roles of STAT Family Transcription Factors in the T Follicular Helper Cell Genetic Program. J. Immunol. 2014, 192, 2156–2166. [Google Scholar] [CrossRef] [Green Version]
  70. Miyawaki, A.; Iizuka, Y.; Sugino, H.; Watanabe, Y. IL-11 prevents IFN-γ-induced hepatocyte death through selective downregulation of IFN-γ/STAT1 signaling and ROS scavenging. PLoS ONE 2019, 14, e0211123. [Google Scholar] [CrossRef]
  71. Pfitzner, E.; Kliem, S.; Baus, D.; Litterst, C.M. The Role of STATs in Inflammation and Inflammatory Diseases. Curr. Pharm. Des. 2004, 10, 2839–2850. [Google Scholar] [CrossRef] [PubMed]
  72. Yan, Z.; Gibson, S.A.; Buckley, J.A.; Qin, H.; Benveniste, E.N. Role of the JAK/STAT signaling pathway in regulation of innate immunity in neuroinflammatory diseases. Clin. Immunol. 2018, 189, 4–13. [Google Scholar] [CrossRef] [PubMed]
Figure 1. The 30 most enriched GO terms in the liver, spleen, and head kidney of golden pompano at various time points following S. agalactiae challenge. Notes: CC, cellular component; MF, molecular function; BP, biological process.
Fishes 08 00052 g001aFishes 08 00052 g001b
Figure 2. Bubble chart of KEGG pathway enrichment of DEGs in the (A) liver, 48 h vs. 0 h; (B) liver, 120 h vs. 0 h; (C) spleen, 48 h vs. 0 h; (D) spleen, 120 h vs. 0 h; and (E) head kidney, 48 h vs. 0 h and (F) 120 h vs. 0 h. The vertical axis represents the pathway categories, and the horizontal axis shows the DEG ratio. The point size shows the number of DEGs enriched in the KEGG pathway. The point color shows different Q values, as indicated on the right.
Fishes 08 00052 g002aFishes 08 00052 g002b
Figure 3. Comparison of the transcriptome sequencing results and qRT-PCR determination of the DEG expression profiles. (A,C,E) show the liver, spleen, and head kidney 48 h after infection, respectively. (B,D,F) show the liver, spleen, and head kidney 120 h after infection, respectively.
Fishes 08 00052 g003
Table 1. Primers used for mRNA expression analysis.
Primer NamePrimer Sequences (5′−3′)Amplification Target
Caspase-3-FGCTGCTCTACTGCTTCTGCCTGATGqRT-PCR
Caspase-3-RTGGCTGAGGATTGTGATGTTGCTG
Caspase-8-FGCAACAAAACAGCCATCCA qRT-PCR
Caspase-8-RGCAGGGGTAAAGGGTCATT
TNF-α-FGCTCCTCACCCACACCATCAqRT-PCR
TNF-α-RCCAAAGTAGACCTGCCCAGACT
NF-κB-FCGTGAGGTCAGCGAGCCAATGqRT-PCR
NF-κB-RATGTGCCGTCTATCTTGTGGAATGG
1L-8-FTGCATCACCACGGTGAAAAAqRT-PCR
1L-8-RGCATCAGGGTCCAGACAAATC
C4-FTGGAGAAAAAGTTAAAGGGGCqRT-PCR
C4-RCAGGAAGGAAGTATGAGCGAGT
Bax-FACTGAGCAGGAGCAGAAGGTqRT-PCR
Bax-RCTGAATCCAGCCCAAGAGA
Bcl-FGGACATCGTGGAGGATTACCqRT-PCR
Bcl-RGACCGTCATTAGGCTTTGC
Table 2. Statistics of differentially expressed genes at different time points following S. agalactiae challenge.
TimeLiverSpleenHead Kidney
Upregulated (%)Downregulated (%)TotalUpregulated (%)Downregulated (%)TotalUpregulated (%)Downregulated (%)Total
48 h1655 (67.28)805 (32.72)24601362 (43.40)1776 (56.60)31381203 (33.85)2351 (66.15)3554
120 h2059 (57.18)1542 (42.82)36012195 (47.54)2422 (52.46)46171026 (63.22)597 (36.78)1623
Total371423476061355741987775222929485177
Table 3. Annotated DEGs in gene ontology and KEGG database.
TimeLiverSpleenHead Kidney
Total DEGsGO-Annotated DEGs KEGG-Annotated DEGs Total DEGsGO-Annotated DEGs KEGG-Annotated DEGs Total DEGsGO-Annotated DEGs KEGG-Annotated DEGs
48 h323,64639,0116320326,26954,6186445326,54654,2286285
120 h327,85759,6504979326,59247,5596121316,99224,0393155
Total651,50398,66111,299652,861102,17712,566643,53878,2679440
Table 4. Based on KEGG enrichment analysis, ten inflammation-related pathways were significantly enriched.
Ko idTermNumber of DEGsp-Value
ko04630JAK-STAT signaling pathway770.000150446
ko04064NF-kappa B signaling pathway720.000123683
ko04060Cytokine–cytokine receptor interaction632.63 × 10−10
ko04668TNF signaling pathway523.31 × 10−8
ko04062Chemokine signaling pathway529.47 × 10−5
ko04659Th17 cell differentiation350.000938016
ko04610Complement and coagulation cascades331.90 × 10−9
ko04010MAPK signaling pathway310.006077547
ko04612Antigen processing and presentation294.36 × 10−5
ko04658Th1 and Th2 cell differentiation260.004317579
Disclaimer/Publisher’s Note: The statements, opinions and data contained in all publications are solely those of the individual author(s) and contributor(s) and not of MDPI and/or the editor(s). MDPI and/or the editor(s) disclaim responsibility for any injury to people or property resulting from any ideas, methods, instructions or products referred to in the content.

