Article

Genetic Diversity and Differences among Three F1 Families and Two Wild Populations of Genus Scylla Using Microsatellite Markers

1
Guangdong Provincial Key Laboratory of Marine Biotechnology, Shantou University, Shantou 515063, China
2
STU-UMT Joint Shellfish Research Laboratory, Shantou University, Shantou 515063, China
3
Institute of Tropical Aquaculture and Fisheries, Universiti Malaysia Terengganu, Kuala Nerus 21030, Terengganu, Malaysia
*
Author to whom correspondence should be addressed.
These authors contributed equally to this work.
Fishes 2023, 8(1), 18; https://doi.org/10.3390/fishes8010018
Submission received: 24 November 2022 / Revised: 18 December 2022 / Accepted: 23 December 2022 / Published: 27 December 2022
(This article belongs to the Special Issue Recent Advances in Crab Aquaculture)

Abstract

:
Genetic diversity is the determinant of the allocation of germplasm resources in the genetic improvement of aquaculture species. In this study, three F1 families, including a hybrid Scylla family (S. paramamosain ♂ × S. serrata ♀), a paternal family of S. paramamosain, a maternal family of S. serrata, and two wild populations, including a paternal population of S. paramamosain and a maternal population of S. serrata, were used to investigate the genetic diversity and genetic difference. The results indicated that 98 alleles of nine microsatellites loci were observed in five Scylla populations. The highest average value of Ho (observed heterozygosity), He (expected heterozygosity), and PIC (polymorphic information content) of the wild S. paramamosain population were 0.790, 0.799, and 0.771, respectively, suggesting the wild paternal population has high genetic diversity. The comparative analysis of PIC, Fst (fixation index), and HWE (Hardy–Weinberg equilibrium) indicated that the paternal S. paramamosain may be more suitable for artificial breeding than the maternal S. serrata from the perspective of allele frequency. Analysis of molecular variance analysis (AMOVA) showed that the total genetic variation mainly occurred within populations (73.28%), demonstrating that artificial breeding may induce genetic differentiation of the family groups of Scylla. The results of the analysis of Fst value, UPGMA (unweighted pair-group mean analysis) dendrogram, and genetic diversity indicated that the F1 hybrid offspring had a close genetic distance and high genetic identity with the paternal S. paramamosain populations. It indicated that the F1 hybrid offspring showed potential paternal genetic affinities and a similar potential for artificial breeding with S. paramamosain. The study will provide valuable information to evaluate the difference in the genetic diversity and population structure between hybrid offspring and distinct parental populations of Scylla.

Graphical Abstract

1. Introduction

Scylla is divided into four distinct species that occupy an immense dispersion running from the Indo Pacific area to eastern and southeastern Africa, and each species lives in their own area [1]. The mud crab S. paramamosain is a crucial economic portunid crab mainly distributed along the southeastern coast of China [2]. The giant mud crab S. serrata has a broad native range in the Indian and tropical Western Pacific Ocean and is also an important source of income for small-scale fishers [3]. In particular, S. paramamosain and S. serrata possess many favorable attributes from a commercial perspective, making them attractive candidates for indigenous aquaculture [4]. The research on sequence analysis, genetic distance, and Neighbor-Joining clustering of the Mitochondrial DNA COI (mitochondrial cytochrome oxidase subunit 1) gene proved that the dominant species is S. paramamosain in China [5]. There are differences in genetic structure and genetic diversity between the hatchery and wild populations of S. paramamosain, as well as between different regional populations of the same species [6].
Hybridization plays a very important role in the speciation and adaptive radiation of animals [7], and has great potential for application in the aquaculture industry. The hybrids usually showed heterosis over their parents in some desirable traits; a pervasive phenomenon [8]. The success of hybridization programs depends on the availability of genetic diversity conserved in germplasm [4]. Recently, a hybridization breeding program has been launched in our laboratory to develop one hybrid Scylla strain with a good character of maternal size and a better flavor of paternal origin through the hybridization of the male S. paramamosain and the female S. serrata [9]. In aquaculture, the desired goal is to obtain hybrids that perform better than their parents in terms of survival rates, growth rates, meat quality, and stress resistance [10]. Obtaining a new variety of desirable traits is the fundamental goal of hybridization, but high levels of genetic diversity enable a species to respond efficiently to artificial breeding, environmental change, and pathogenic infection [11].
Investigations of the genetic diversity and population structure of Scylla are vital for the sustainable utilization of its germplasm resources and the development of its genetic potential. Evaluation of the genetic diversity among lines based on molecular markers is considered to be a possible way to select desirable genotypes, examine cultivar stability, and be used for cultivar identification [12]. Because marker systems reveal differences in DNA levels, they provide a powerful tool for assessing the genetic diversity of farmed and wild aquatic animal species, which can work for germplasm management and breeding programs [13]. Microsatellites, defined as loci of short DNA sequences arranged in tandem repeats (simple sequence repeats, SSR) and distributed randomly throughout the genome, are recognized as highly polymorphic markers suitable for genetic characterization, and are applicable in many studies of ecology, evolution, and conservation [14,15,16].
Considering the characteristics of abundance, high polymorphism content, co-dominance, and bi-parentally inherited, SSR was used in this study for the genetic analysis of Scylla. Inbreeding is caused by artificial breeding and genetic drift; two potential features that can destroy the genetic variability of the wild and hatchery populations over time. Therefore, it is critical that genetic characterization of the hatchery and wild populations is performed, using suitable molecular markers to help monitor periodic changes in the genetic structure.
The mud crab, genus Scylla, is distributed along the coast of Southeast Asia, the Indian Ocean, and the tropical western Pacific. Because of its high nutritional value and good flavor, it has become an important crab resource in fishery and aquaculture [17,18]. Recently, due to rising Scylla farming technology, the scale of Scylla farming has expanded dramatically. However, the hatchery technology of the Scylla’s culture is in the developmental stage, with a small number of breeding programs in a few countries [19]. At the same time, wild Scylla seedlings are also facing problems such as resource reduction, high disease susceptibility, and specification differences [20]. The sustainable development of the Scylla farming industry requires Scylla varieties with excellent genetic traits [9]. Therefore, there is an urgent need to understand the genetic diversity and population structure to get preferable varieties or species of Scylla for artificial breeding.

2. Materials and Methods

2.1. Sample Collection and DNA Extraction

In this study, five Scylla populations involving an F1 hybrid Scylla family (S. paramamosain ♂ × S. serrata ♀), an F1 paternal family, an F1 maternal family, a wild paternal population, and a wild maternal population were characterized using SSR markers. The purposes of this study were: (1) to compare the genetic diversity of the wild populations and families of S. paramamosain and S. serrata and the hybrid family; (2) to evaluate the genetic difference between the hybrid family and their parent populations.
A total of 36 wild individuals of S. paramamosain were collected by fishermen from the local shore (Guangdong Province, China), and 40 wild individuals of S. serrata were obtained from the local market (Tianhuan aquatic products market, Shantou, Guangdong Province, China). The number of crabs for wild populations was determined as described in the previous study [21]. These wild individuals were identified as the wild paternal S. paramamosain and maternal S. serrata populations, respectively. One male S. paramamosain and one female S. serrata that preceded the reproductive molt were selected for interspecific artificial mating. After mating, the female S. serrata were used for artificial breeding to obtain the hatchery F1 hybrid Scylla family. The artificial mating of Scylla was performed following the method described in the previous study [22]. The mated female S. paramamosain and S. serrata bought from the local market were expected to generate one hatchery F1 paternal and one maternal family group, respectively. The rearing method was carried out according to the previous study [9]; when the larvae grow to megalopa, individuals were randomly sampled. The number of samples for each hatchery population was more than 30 (Table 1). Genomic DNA was extracted from muscle tissue using proteinase K and phenol-chloroform [4]. DNA was modulated to a concentration of 100 ng/mL and stored at −20 °C until used in subsequent experiments.

2.2. PCR Amplification and Electrophoresis

A total of 201 individuals were genotyped using 9 microsatellite markers (Table 2) obtained from previous studies [20,21]. PCR was carried out in 12.5 µL volume containing 8.6 µL ddH2O, 1.0 µL dNTP mixture (2.5 mM), 1.3 µL 10 × EasyTaq buffer, 0.5 µL of each primer (10 µM), 0.5 µL of DNA (10–50 ng), and 0.1 µL of Taq DNA polymerase (Transgen Biotech Co., Ltd., Beijing, China). PCR amplification was performed on an Eppendorf AG 22,331 Hamburg instrument under the following conditions: initial denaturation at 94 °C for 5 min, one step of denaturation at 94 °C for 4 min, 32 cycles of 30 s at 94 °C, 50 s at a primer-specific annealing temperature (Table 2), and 50 s at 72 °C. As a final step, the products were extended for 7 min at 72 °C. PCR products were separated by 6% polyacrylamide gel electrophoresis and visualized after 0.1% silver staining. The allele size was estimated according to pBR322 DNA/MspI marker (Tiangen Biotech, Beijing, China).

2.3. Genetic Analysis
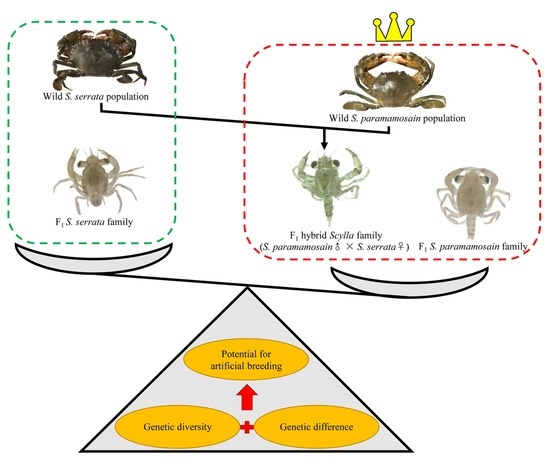
The polymorphism statistics, such as number of alleles (Na), effective number of alleles (Ne), observed heterozygosity (Ho), expected heterozygosity (He), genetic distance, and genetic identity, were calculated using GenAlEx v.6.502 (http://hdl.handle.net/1885/67271, accessed on 26 December 2022) [23]. The polymorphism information content (PIC) of polymorphic loci was calculated using Cervus v.3.0.7 [24]. Hardy–Weinberg equilibrium (HWE) and inbreeding coefficient (Fis) were assessed by GenePop v.4.7 [25]. The significant deviation from HWE was adjusted for multiple comparisons by Bonferroni correction. The frequency of null alleles (Fua) was calculated by software Micro-Checker v.2.2.3 [26]. Molecular variance (AMOVA) analysis and the fixation index (Fst) value were carried out using Arlequin v.3.1 [27]. An unweighted pair-group mean analysis (UPGMA) tree was constructed based on Nei’s genetic distance [28] of pairwise locations using MEGA v.7.0 software [29].

3. Results

3.1. Comparative Analysis of Genetic Diversity

In the present study, a total of 98 alleles were detected at nine microsatellite loci in five Scylla populations (Table 2). The average Na and Ne were 10.889 and 5.978, respectively. The genetic diversity index showed that the variation of these individuals was relatively high, and the Ho and He values were ranged from 0.405 to 0.927 and 0.750 to 0.876, respectively. The PIC value of each locus was ranged from 0.706 to 0.865, with an average of 0.796 (Table 3).
In general, the wild parental populations showed high levels of genetic diversity, while the family groups were slightly lower. For wild parental populations, the average Na (paternal versus maternal of 7.000 versus 4.111), Ne (paternal versus maternal of 5.210 versus 2.627), Ho (paternal versus maternal of 0.790 versus 0.667), He (paternal versus maternal of 0.799 versus 0.594), and PIC (paternal versus maternal of 0.771 versus 0.533) of the paternal S. paramamosain population was higher than that of the maternal S. serrata population. Except for the average Ho (paternal versus maternal of 0.755 versus 0.806), the average Na (paternal versus maternal of 3.556 versus 3.111), Ne (paternal versus maternal of 3.104 versus 2.469), He (paternal versus maternal of 0.658 versus 0.586), and PIC (paternal versus maternal of 0.596 versus 0.502) of the paternal S. paramamosain family was higher than that of the maternal S. serrata family (Table 4).
For the paternal S. paramamosain, the average Na (wild versus F1 family of 7.000 versus 3.556), Ne (wild versus F1 family of 5.210 versus 3.104), Ho (wild versus F1 family of 0.790 versus 0.755), He (wild versus F1 family of 0.799 versus 0.658), and PIC (wild versus F1 family of 0.771 versus 0.596) of the wild population was higher than that of the F1 family. In the maternal S. serrata, the average Na, Ne, He, and PIC of the wild population were higher than that of the F1 family, but the average Ho of the wild population (0.667) was lower than that of the F1 family (0.806) (Table 4).
The Na, Ne, Ho, He, and PIC of the F1 hybrid Scylla family were 3.333, 3.152, 0.867, 0.665, and 0.599, respectively. Interestingly, these genetic diversity parameters of the F1 hybrid Scylla family were higher than that of the F1 family of paternal S. paramamosain, F1 family of maternal S. serrata, and wild maternal S. serrata population, but lower than that of the wild paternal S. paramamosain population. Our result showed that the offspring of distant hybridization promoted genetic diversity (PIC = 0.599), especially compared to the F1 family of maternal S. serrata (PIC = 0.502) (Table 4).

3.2. Population Structure and Deviations from HWE

All loci were in HWE after Bonferroni correction in the wild paternal S. paramamosain population. Except for Scpa77, all other loci were in HWE in the wild maternal S. serrata population. There were four, six, and eight loci deviated from HWE in the F1 family of paternal S. paramamosain, F1 family of maternal S. serrata, and F1 hybrid Scylla family, respectively. Except for the wild paternal S. paramamosain population, the average values of Fis and Fua of the other four populations were negative (Table 4). The difference in Fst between the F1 family of maternal S. serrata and the F1 hybrid Scylla family was the highest (0.386, p < 0.001), and the difference in Fst between the wild population and the F1 family of maternal S. serrata (0.094, p < 0.001) was the lowest (Table 5). The difference in Fst between the two paternal S. paramamosain populations and the F1 hybrid Scylla family was higher than that between the two maternal S. serrata populations and the F1 hybrid Scylla family (Table 5). Analysis of molecular variance analysis (AMOVA) showed that the total genetic variation mainly occurred within populations (73.28%), and 26.72% was contributed by among populations variation (Table 6).

3.3. Genetic Distance and Genetic Identity among Distinct Populations

The UPGMA dendrogram based on Nei’s genetic distance revealed two clusters (Figure 1). The first cluster consisted of two paternal S. paramamosain populations and the F1 hybrid Scylla family, and the second cluster consisted of two maternal S. serrata populations. The genetic distance between the wild maternal S. serrata population and the F1 hybrid Scylla family was the biggest (1.835), and the genetic identity was the lowest (0.160), while the genetic distance between the wild population and the F1 family of maternal S. serrata was the nearest (0.164), and the genetic identity was the highest (0.849) (Table 7). Apart from that, the F1 hybrid Scylla family had a close genetic distance and high genetic identity with the two paternal S. paramamosain populations (Table 7).

4. Discussion

Genetic diversity is a determinant of the allocation of germplasm resources in the genetic improvement of aquaculture species [30]. The assessment of genetic variation among the germplasm collection provides decisive information, and on the basis of this variability, breeders can exploit genetically diverse lines as promising parents in breeding experiments [31]. Naturally occurring genetic diversity in a germplasm collection is the primary condition for the implementational success of any breeding program to improve desirable stocks [32]. In this study, an F1 hybrid Scylla family (S. paramamosain ♂ × S. serrata ♀), an F1 paternal family, an F1 maternal family, a wild paternal population, and a wild maternal population were collected to investigate the genetic diversity, and 98 alleles of nine microsatellites loci were observed in these populations. According to the number of detected alleles, gene diversity, PIC, and Fis values, the selected microsatellites performed well in the diversity study.
Gene heterozygosity is thought to be a good measure to assess the genetic diversity of organisms. The statistical evaluation of the informativeness of polymorphic marker is measured by the PIC value. Genetic markers with a PIC value greater than 0.5 are generally considered highly informative in population genetic analysis [33]. In the present study, the PIC values of all the populations were higher than 0.5, which indicated the abundance in genetic diversity of all Scylla populations. Furthermore, the PIC value of the paternal S. paramamosain populations was higher than the maternal S. serrata populations. This result is consistent with some previous studies that found that the wild Scylla population of the studied breeds has high genetic diversity [34,35]. Importantly, the PIC value of the F1 hybrid Scylla family was only lower than the wild paternal S. paramamosain population and similar to the F1 paternal family, indicating the F1 hybrid offspring share a similar genetic diversity to the paternal.
The preservation of genetic diversity in cultured populations is of high importance because it allows breeders to ensure genetic resources available for aquatic animal improvement. It also allows species to adapt to new breeding systems and new habitats [36]. Our results suggested that the overall heterozygosity and genetic diversity of the family groups of parental S. paramamosain and S. serrata were lower than the wild populations, which was consistent with the previous study on Haliotis discus hannai [37]. This indicates that artificial breeding constrained the genetic characteristics to affect the genetic diversity and population structure of hatchery crabs [38]. However, the average Ho of wild populations was significantly lower than that of the F1 family of S. serrata. This phenomenon in S. serrata populations may be caused by inbreeding, indicated by the high Fis value of Scpa24 and Scpa23. Additionally, in this study, the F1 family and wild populations of paternal S. paramamosain had higher levels of genetic diversity than those of maternal S. serrata. Furthermore, the average Ho of the F1 hybrid offspring was the highest, and the average of Ne and He was lower than that of the wild paternal S. paramamosain. These results further support that the F1 hybrid offspring have high genetic diversity, similar to their paternal. The greater the genetic diversity, the more excellent the opportunity for resiliency to environmental change caused by artificial breeding [39]. Besides, the loss of genetic diversity during artificial breeding needs to be countered by higher genetic diversity [40]. Additionally, paternal S. paramamosain is considered the dominant species for mud crabs cultured in China. All of the above information argues that paternal S. paramamosain has more genetic diversity to support being developed in China through artificial breeding, followed by the F1 hybrid offspring.
In the present study, the Fis value of the wild paternal S. paramamosain population was high, while the Fis value of the F1 hybrid offspring and family group of maternal S. serrata was low, which may be the result of the large-scale artificial rearing of paternal S. paramamosain in China [20]. Furthermore, the difference in Fst between the wild population and F1 family of S. serrata was the lowest, while one between the wild population and F1 family of S. paramamosain was relatively large. These results indicate a higher degree of genetic differentiation among paternal S. paramamosain populations than maternal S. serrata populations, which demonstrates that artificial breeding may produce more effects on population differentiation of paternal S. paramamosain than of maternal S. serrata. Importantly, the F1 hybrid offspring showed bigger paired Fst values with all the populations, especially the maternal S. serrata. The result implies a considerable degree of differentiation between the F1 hybrid offspring and other populations, especially the maternal S. serrata.
All loci were in HWE in the wild population and few loci deviated from HWE in the F1 family of paternal S. paramamosain, suggesting the relative frequencies of various alleles in paternal S. paramamosain populations tend to remain constant within some generations. The above results demonstrated paternal S. paramamosain had a facility for population differentiation under artificial breeding and then maintained the genetic balance within several generations. Accordingly, paternal S. paramamosain may be suitable for artificial breeding in China in the level of allele frequency. Contrary to the wild parental population, almost all loci in the F1 hybrid family deviated from HWE, which can be explained by the genetic drift caused by artificial breeding.
In the present study, ANOVA showed that the total genetic variation mainly occurred within populations, with a low level of genetic differentiation among populations, suggesting that the genetic differentiation occurred mainly within populations rather than among the groups. The result agreed with the former studies in S. paramamosain [5,20,41]. Expansion of genetic diversity within populations has been considered as a cause for an increase of adaptability to environmental variation [42]. For this reason, the artificial environment probably breaks the genetic balance of the population and promotes individual variation by changing the genetic characteristics to adapt to the aquaculture environment [43]. Without genetic variation, a population cannot evolve in response to changing environmental variables and, as a result, may face an increased risk of extinction [44]. The information provided by genetic variation within populations demonstrated the effects of artificial breeding on the genetic differentiation of the family groups of Scylla.
As the above results indicated, the difference in Fst between the two paternal S. paramamosain populations and the F1 hybrid family was higher than that between the two maternal S. serrata populations and the F1 hybrid family. Besides, The UPGMA dendrogram showed that two paternal S. paramamosain populations and the F1 hybrid family were clustered. This indicated that the F1 hybrid offspring possessed possible paternal genetic affinities with paternal S. paramamosain, which was opposite to the maternal effect [45]. The F1 hybrid family had the nearer genetic distance with the two paternal S. paramamosain populations, which indicated the potential paternal effect as well. Considering the remarkable variation between artificial and natural environments, we speculate that artificial breeding may be the vital factor contributing to this abnormality, and that artificial selection led to the hybrid individuals with genotypes close to the hatchery S. paramamosain populations who have a greater chance of surviving to megalopa in the artificial environment. Our data also indicated that the hybrid population has a genetic diversity lower only than the wild paternal S. paramamosain population and a close genetic distance and high genetic identity with the two paternal S. paramamosain populations. These shreds of evidence suggest that F1 hybrid offspring showed potential paternal genetic affinities with S. paramamosain and the effects of artificial breeding on offspring survival of different genotypes.

5. Conclusions

Based on the analysis results of Ho, He, and PIC, it can be concluded that the wild parental population of the studied breeds had high genetic diversity. The analysis of genetic diversity and population structure indicated that the paternal S. paramamosain may be more suitable for artificial breeding in the level of allele frequency. Furthermore, the information provided by genetic variation within populations demonstrated that the effects of artificial breeding on genetic differentiation of the family groups of Scylla. The comparative analysis of Fst value, UPGMA dendrogram, and genetic diversity indicated that the F1 hybrid offspring possessed potential paternal genetic affinities and a similar potential for artificial breeding with S. paramamosain. Our results are of great significance for detecting the population genetic structure, with the ultimate goal of assessing the genetic difference between the hybrid family and their parent populations.

Author Contributions

Conceptualization, W.G., W.C. and H.M.; Writing—original draft, W.G. and W.C.; Writing—review & editing, H.C., S.L., H.S.A.S., M.I. and H.M.; Data curation, W.G. and W.C.; Formal analysis, W.G. and W.C.; Methodology, S.Y., F.W. and M.G.; Supervision, H.M. All authors have read and agreed to the published version of the manuscript.

Funding

This work was supported by the Leading Talent Project of Special Support Plan of Guangdong Province [grant number 2019TX05N067], the Science and Technology Project of Guangdong Province [grant number STKJ202209029], the National Natural Science Foundation of China [grant number 42076133,42206127], the Special Projects in Key Fields of Colleges and Universities in Guangdong Province [grant number 2020ZDZX1001], the STU Scientific Research Foundation for Talents [grant number NTF21023], and Guangdong Basic and Applied Basic Research Fund Regional Joint Fund-Youth Fund Project [grant number 2021A1515110514].

Institutional Review Board Statement

The animal study protocol was approved by the medical animal care and welfare committee, Shantou university (Approval Code: SUMC2021-497, Approval Date: 12 May 2021).

Informed Consent Statement

Not applicable.

Data Availability Statement

The data presented in this study are available on request from the corresponding author.

Acknowledgments

We thank the referees for their thoughtful comments and recommendations.

Conflicts of Interest

The authors declare that the research was conducted in the absence of any commercial or financial relationships that could be construed as a potential conflict of interest.

References

  1. Naim, D.M.; Nor, S.A.M.; Mahboob, S. Reassessment of species distribution and occurrence of mud crab (Scylla spp., Portunidae) in Malaysia through morphological and molecular identification. Saudi. J. Biol. Sci. 2019, 27, 643–652. [Google Scholar] [CrossRef] [PubMed]
  2. Cui, W.; Yang, Q.; Zhang, Y.; Farhadi, A.; Zheng, H.; Li, S.; Zhang, Y.; Ikhwanuddin, M.; Ma, H. Integrative transcriptome sequencing reveals the molecular difference of maturation process of ovary and testis in mud crab Scylla paramamosain. Front. Mar. Sci. 2021, 8, 658091. [Google Scholar] [CrossRef]
  3. Meynecke, J.O.; Grubert, M.; Gillson, J. Giant mud crab (Scylla serrata) catches and climate drivers in Australia—A large scale comparison. Mar. Freshw. Res. 2012, 63, 84–94. [Google Scholar] [CrossRef] [Green Version]
  4. Ma, H.; Ma, C.; Ma, L.; Cui, H. Novel polymorphic microsatellite markers in Scylla paramamosain and cross-species amplification in related crab species. J. Crustacean Biol. 2010, 30, 441–444. [Google Scholar] [CrossRef] [Green Version]
  5. Wang, W.; Ma, C.; Chen, W.; Jin, Z.; Zhao, M.; Zhang, F.; Liu, Z.; Ma, L. Population genetic diversity of mud crab (Scylla paramamosain) from southeast coastal regions of China based on mitochondrial COI gene sequence. Gene 2020, 751, 144763. [Google Scholar] [CrossRef]
  6. Lin, Q. Species Composition of Genus Scylla and Genetic Diversity of Scylla paramamosain (Estampador, 1949) Population in China. Ph.D. Thesis, Xiamen University, Xiamen, China, 2009. [Google Scholar]
  7. Hulata, G. A review of genetic improvement of the common carp (Cyprinus carpio L.) and other cyprinids by crossbreeding, hybridization and selection. Aquaculture 1995, 129, 143–155. [Google Scholar] [CrossRef]
  8. Han, Z.; Li, Q.; Liu, S.; Kong, L. Crossbreeding of three different shell color lines in the Pacific oyster reveals high heterosis for survival but low heterosis for growth. Aquaculture 2020, 529, 735621. [Google Scholar] [CrossRef]
  9. Cui, W.; Guan, M.; Abu Sadek, M.; Wu, F.; Wu, Q.; Tan, H.; Shi, X.; Ikhwanuddin, M.; Ma, H. Construction of a genetic linkage map and QTL mapping for sex indicate the putative genetic pattern of the F1 hybrid Scylla (Scylla serrata ♀ × S. paramamosain ♂). Aquaculture 2021, 545, 737222. [Google Scholar] [CrossRef]
  10. Zheng, G.D.; Guo, D.D.; Wu, C.B.; Chen, J.; Jiang, X.Y.; Zou, S.M. The obvious heterosis and genetic characters of intergeneric cross and backcross juveniles between blunt snout bream (Megalobrama amblycephala) and topmouth culter (Culter alburnus). Aquac. Res. 2019, 50, 1634–1643. [Google Scholar] [CrossRef]
  11. Min, J.J.; Ye, R.H.; Zhang, G.F.; Zheng, R.Q. Microsatellite analysis of genetic diversity and population structure of freshwater mussel (Lamprotula leai). Zool. Res. 2015, 36, 34–40. [Google Scholar]
  12. Feng, Y.; Zhang, D.; Lv, J.; Gao, B.; Liu, P. Identification of SNP markers correlated with the tolerance of low-salinity challenge in swimming crab (Portunus trituberculatus). Acta Oceanol. Sin. 2019, 38, 41–47. [Google Scholar] [CrossRef]
  13. Kindie, B. Assess molecular marker applications for genetic variety analysis in biodiversity conservation status. Mol. Biol. 2021, 10, 287. [Google Scholar]
  14. Gross, R.; Kõiv, K.; Pukk, L.; Kaldre, K. Development and characterization of novel tetranucleotide microsatellite markers in the noble crayfish (Astacus astacus) suitable for highly multiplexing and for detecting hybrids between the noble crayfish and narrow-clawed crayfish (A. leptodactylus). Aquaculture 2017, 472, 50–56. [Google Scholar] [CrossRef]
  15. Souza, F.; Ruas, C.; Urrea-Rojas, A.M.; Lima, E.; Povh, J.A.; Ribeiro, R.P.; Ruas, E.A.; Benicio, L.M.; Furlan-Murari, P.J.; Lopera-Barrero, N.M. Novel microsatellite markers for the invasive golden mussel Limnoperna fortunei. J. Shellfish Res. 2018, 37, 485–489. [Google Scholar] [CrossRef]
  16. Mondal, D.; Dutta, S.; Chakrabarty, U.; Mallik, A.; Mandal, N. Development and characterization of white spot disease linked microsatellite DNA markers in Penaeus monodon, and their application to determine the population diversity, cluster and structure. J. Invertebr. Pathol. 2019, 168, 107275. [Google Scholar] [CrossRef] [PubMed]
  17. Unnikrishnan, U.; Paulraj, R. Dietary protein requirement of giant mud crab Scylla serrata juveniles fed iso-energetic formulated diets having graded protein levels. Aquac. Res. 2010, 41, 278–294. [Google Scholar] [CrossRef] [Green Version]
  18. Farhadi, A.; Fang, S.; Zhang, Y.; Cui, W.; Fang, H.; Ikhwanuddin, M.; Ma, H. The significant sex-biased expression pattern of Sp-Wnt4 provides novel insights into the ovarian development of mud crab (Scylla paramamosain). Int. J. Biol. Macromol. 2021, 183, 490–501. [Google Scholar] [CrossRef]
  19. Azra, M.N.; Ikhwanuddin, M. A review of maturation diets for mud crab genus Scylla broodstock: Present research, problems and future perspective. Saudi J. Biol. Sci. 2016, 23, 257–267. [Google Scholar] [CrossRef] [Green Version]
  20. Ma, H.Y.; Ma, C.Y.; Ma, L.B. Population genetic diversity of mud crab (Scylla paramamosain) in Hainan Island of China based on mitochondrial DNA. Biochem. Syst. Ecol. 2011, 39, 434–440. [Google Scholar] [CrossRef]
  21. Ma, C.; Ma, H.; Ma, L.; Jiang, K.; Zhang, F.; Song, W. Isolation and characterization of polymorphic microsatellite loci from cDNA library of Scylla paramamosain. Afr. J. Biotechnol. 2011, 10, 11142–11148. [Google Scholar]
  22. Ma, H.; Wu, Q.; Tan, H.; Wu, F.; Lin, F. Establishment of inter-specific hybridization technique and identification of phenotypic and genotypic characters of hybrids in mud crab (Scylla paramamosain and S. serrata). J. Shantou Univ. 2021, 36, 59–66. [Google Scholar]
  23. Peakall, R.; Smouse, P.E. GenAlEx 6.5: Genetic Analysis in Excel. Population Genetic Software for Teaching and Research—An Update. Bioinformatics 2012, 28, 2537–2539. [Google Scholar] [CrossRef] [PubMed] [Green Version]
  24. Kalinowski, S.T.; Taper, M.L.; Marshall, T.C. Revising how the computer program CERVUS accommodates genotyping error increases success in paternity assignment. Mol. Ecol. 2007, 16, 1099–1106. [Google Scholar] [CrossRef] [PubMed]
  25. Rousset, F. Genepop’007 A Complete Re-Implementation of the Genepop Software for Windows and Linux. Mol. Ecol. Resour. 2008, 8, 103–106. [Google Scholar] [CrossRef]
  26. Van Oosterhout, C.; Hutchinson, W.F.; Wills, D.P.; Shipley, P. MICRO-CHECKER: Software for identifying and correcting genotyping errors in microsatellite data. Mol. Ecol. Notes 2004, 4, 535–538. [Google Scholar] [CrossRef]
  27. Excoffier, L.; Laval, G.; Schneider, S. Arlequin Ver. 3.1: An Integrated Software Package for Population Genetics Data Analysis. Evol. Bioinform. 2005, 1, 47–50. [Google Scholar] [CrossRef] [Green Version]
  28. Nei, M. Estimation of average heterozygosity and genetic distance from a small number of individuals. Genetics 1978, 89, 583–590. [Google Scholar] [CrossRef] [PubMed]
  29. Tamura, K.; Dudley, J.; Nei, M.; And Kumar, S. MEGA4: Molecular Evolutionary Genetics Analysis (MEGA) software version 4.0. Mol. Biol. Evol. 2007, 24, 1596–1599. [Google Scholar] [CrossRef]
  30. Liu, F.; Yao, J.; Wang, X.; Repnikova, A.; Galanin, D.A.; Duan, D. Genetic diversity and structure within and between wild and cultivated Saccharina japonica (Laminariales, Phaeophyta) revealed by SSR markers. Aquaculture 2012, 358–359, 139–145. [Google Scholar] [CrossRef]
  31. Nayak, S.N.; Song, J.; Villa, A.; Pathak, B.; Ayala-Silva, T.; Yang, X.; Todd, J.; Glynn, N.C.; Kuhn, D.N.; Glaz, B.; et al. Promoting utilization of Saccharum spp. genetic resources through genetic diversity analysis and core collection construction. PLoS ONE 2014, 9, e110856. [Google Scholar] [CrossRef] [Green Version]
  32. Singh, R.B.; Singh, B.; Singh, R.K. Evaluation of genetic diversity in Saccharum species clones and commercial varieties employing molecular (SSRs) and physiological markers. Indian J. Plant. Genet. Resour. 2018, 31, 17–20. [Google Scholar] [CrossRef]
  33. Botstein, D.; White, R.L.; Skolnick, M.; Davis, R.W. Construction of a genetic linkage map in man using restriction fragment length polymorphisms. Am. J. Hum. Genet. 1980, 32, 314–333. [Google Scholar] [PubMed]
  34. Cui, H.; Ma, Y.; Ma, C.; Qiao, Z.; Ma, Q.; Qi, L.; Lv, S.A.; Ma, L.B. Genetic diversity among different families of mud crab Scylla paramamosain by microsatellite markers. Mar. Fish 2011, 33, 274–281, (In Chinese with English Abstract). [Google Scholar]
  35. Ma, H.; Ma, C.; Li, X.; Xu, Z.; Feng, N.; Ma, L. The complete mitochondrial genome and gene organization of the mud crab (Scylla paramamosain) with phylogenetic consideration. Gene 2013, 519, 120–127. [Google Scholar] [CrossRef] [PubMed]
  36. Ren, W.; Hu, L.; Guo, L.; Zhang, J.; Tang, L.; Zhang, E.; Zhang, J.; Luo, S.; Tang, J.; Chen, X. Preservation of the genetic diversity of a local common carp in the agricultural heritage rice-fish system. Proc. Natl. Acad. Sci. USA 2018, 115, 546–554. [Google Scholar] [CrossRef] [PubMed]
  37. Li, Q.; Park, C.; Endo, T.; Kijima, A. Loss of genetic variation at microsatellite loci in hatchery strains of the Pacific abaione (Haliotis discus hannai). Aquaculture 2004, 235, 207–222. [Google Scholar] [CrossRef]
  38. Li, W.; Liu, L.; Wang, Y.; Zhang, Q.; Fan, G.; Zhang, S.; Wang, Y.; Liao, K. Genetic diversity, population structure, and relationships of apricot (Prunus) based on restriction site-associated DNA sequencing. Hortic. Res. 2020, 7, 69. [Google Scholar] [CrossRef]
  39. Kovach, R.P.; Gharrett, A.J.; Tallmon, D.A. Genetic change for earlier migration timing in a pink salmon population. Proc. R. Soc. B Biol. Sci. 2012, 279, 3870–3878. [Google Scholar] [CrossRef] [Green Version]
  40. Bi, X.; Yang, Q.; Gao, T.; Li, C. The loss of genetic diversity during captive breeding of the endangered sculpin, Trachidermus fasciatus, based on ISSR markers: Implications for its conservation. Chin. J. Oceanol. Limnol. 2011, 29, 958–966. [Google Scholar] [CrossRef]
  41. He, L.J.; Zhang, A.B.; Weese, D.; Zhu, C.D.; Jiang, C.J.; Qiao, Z.G. Late Pleistocene population expansion of Scylla paramamosain along the coast of China: A population dynamic response to the Last Interglacial sea level highstand. J. Exp. Mar. Biol. Ecol. 2010, 385, 20–28. [Google Scholar] [CrossRef]
  42. Young, A.; Boyle, T.; Brown, T. The population genetic consequence of habitat fragmentation for plants. Trends Ecol. Evol. 1996, 11, 413–418. [Google Scholar] [CrossRef] [PubMed]
  43. Hill, W.G. Artificial selection. In Encyclopedia of Genetics; Academic Press: New York, NY, USA, 2001; pp. 96–101. [Google Scholar]
  44. Svardal, H.; Rueffler, C.; Hermisson, J. Comparing environmental and genetic variance as a response to fluctuating selection. Evolution 2011, 65, 2492–2513. [Google Scholar] [CrossRef] [PubMed]
  45. Zhang, Y.; Li, J.; Zhang, Y.; Ma, H.; Xiao, S.; Xiang, Z.; Yu, Z. Performance evaluation of reciprocal hybrids derived from the two brackish oysters, Crassostrea hongkongensis and Crassostrea sikamea in southern China. Aquaculture 2017, 473, 310–316. [Google Scholar] [CrossRef]
Figure 1. Dendrogram of five Scylla populations based on genetic distance using UPGMA method. WSp: Wild paternal S. paramamosain population; FSp: F1 paternal S. paramamosain family; WSp: Wild maternal S. serrata population; FSs; F1 maternal S. serrata family; Hy: F1 hybrid Scylla family (S. paramamosain ♂ × S. serrata ♀).
Fishes 08 00018 g001
Table 1. Characteristics of five populations of Scylla.
PopulationCodeSample Size
Wild paternal S. paramamosain populationWSp36
F1 paternal S. paramamosain familyFSp41
Wild maternal S. serrata populationWSs40
F1 maternal S. serrata familyFSs45
F1 hybrid Scylla family (S. paramamosain ♂ × S. serrata ♀)Hy39
Table 2. Primer sequences of nine microsatellites. WSp: Wild paternal S. paramamosain population; FSp: F1 paternal S. paramamosain family; WSp: Wild maternal S. serrata population; FSs; F1 maternal S. serrata family; Hy: F1 hybrid Scylla family (S. paramamosain ♂ × S. serrata ♀).
LocusRepeat MotifPrimer Sequences (5′-3′)Ta (°C)Size (bp)GenBank Accession No.
Scpa72(ATT)14F: TGCCGTCATTACTTCGTC53 °C240–390KC793964
R: GAGAGTGCTTTGCATTATCA
Scpa77(CA)13F: GTCTTTCAGGGTAGAGGTTATTA52 °C280–344KC793969
R: CACAACAGATGAAGAACGCT
Scpa02(CCA)3A(CGC)3N4(ACC)4N94(CT)27F: CAGCAGCTTCACCGCCAATA60 °C262–336GU182882
R: TCAAAGAAAGAGGGACGGGAGA
Scpa51(GT)8A(TG)6TAC(GT)7F: AAGTACCACCAATAAATATGAATAA46 °C218–242KC793943
R: TGGAAAAAATAACATAAATAAAAGT
Scpa07(CT)3(TCCT)6N49(AC)17F: CAGACCCTGAATTTACCTGT 49 °C170–216GU18288
R: TAGAATAAGAGTCAAAGAAAGCT
Scpa37(TG)17F: AGATGAGATCGCCAAGGGT53 °C190–218KC793929
R: CTGACCTGATTGTGTAACCCA
Scpa33(CA)13F: GTTCCTGCGTGGGTGCTC57 °C190–274KC793925
R: ACATCTAATCCAACCATGCGTAC
Scpa24(AGT)12F: TAGGGCTGAAATGTATGAAA52 °C275–332KC793916
R: AATGAGGCTAAGAATGTGAAT
Scpa23(TAG)10F: AAGCACCAAGAGGAGAGT
R: CTCATGTCTCGCTACACC
54 °C218–272KC793915
Table 3. Characterization of the nine microsatellite markers of Scylla. Na: observed number of alleles; Ne: effective number of alleles; Ho: observed heterozygosity; He: expected heterozygosity; PIC: Polymorphic information content.
LocusNaNeHoHePIC
Scpa72158.0080.8400.8750.863
Scpa77137.8940.9270.8730.861
Scpa0294.5870.8700.7820.753
Scpa5195.0710.7250.8030.774
Scpa07105.0310.9200.8010.778
Scpa3794.1540.7380.7590.726
Scpa33148.0530.8380.8760.865
Scpa2464.0010.4050.7500.706
Scpa23137.0010.7370.8570.842
Mean10.8895.9780.7780.8190.796
Table 4. The genetic diversity parameter of nine microsatellite markers in five Scylla populations.
LocusNaNeHoHePICHWEFisFua
WSp
Scpa7296.9640.8530.8560.8400.1920.0190.002
Scpa7765.3120.8790.8120.7850.631−0.067−0.037
Scpa0275.6420.8130.8230.7990.1080.0280.006
Scpa5163.5800.5630.7210.6710.0320.2350.092
Scpa0774.7340.8710.7890.7640.119−0.088−0.046
Scpa3764.2530.8000.7650.7290.074−0.031−0.020
Scpa3386.1350.8790.8370.8180.013−0.035−0.023
Scpa2464.0630.6970.7540.7180.0440.0910.033
Scpa2386.2050.7580.8390.8190.0840.1120.044
FSp
Scpa7243.0810.5760.6750.6280.003 *0.1630.060
Scpa7743.1290.9460.6800.6200.000 *−0.379−0.158
Scpa0243.9060.7300.7440.6960.1380.0330.008
Scpa5132.6520.7950.6230.5520.009−0.264−0.106
Scpa0743.7261.0000.7320.6820.000 *−0.355−0.155
Scpa3732.4900.5850.5980.5130.1970.0340.008
Scpa3343.4970.8650.7140.6610.000 *−0.198−0.088
Scpa2421.7300.3950.4220.3330.7020.0780.019
Scpa2343.7230.9020.7310.6810.076−0.222−0.099
WSs
Scpa7253.9410.8500.7460.7030.046−0.127−0.059
Scpa7762.9990.8680.6670.6160.0013 *−0.291−0.121
Scpa0252.6290.7950.6200.5780.407−0.271−0.108
Scpa5132.0270.6320.5070.4210.348−0.234−0.083
Scpa0753.1460.7630.6820.6400.013−0.106−0.048
Scpa3741.9940.5680.4990.4190.579−0.125−0.046
Scpa3342.3730.7300.5790.5280.146−0.249−0.096
Scpa2421.6510.3240.3940.3170.4000.1910.050
Scpa2332.8800.4720.6530.5790.1110.2900.109
FSs
Scpa7232.6671.0000.6250.5550.000 *−0.593−0.231
Scpa7732.1130.9330.5270.4190.000 *−0.768−0.266
Scpa0242.6641.0000.6250.5560.000 *−0.593−0.231
Scpa5142.9800.7500.6640.6020.000 *−0.116−0.051
Scpa0732.5590.9530.6090.5270.000 *−0.557−0.214
Scpa3732.6080.7750.6170.5460.042−0.245−0.098
Scpa3342.7380.8000.6350.5800.000 *−0.250−0.101
Scpa2421.9530.4890.4880.3691.0000.009−0.001
Scpa2321.9390.5560.4840.3670.536−0.136−0.048
Hy
Scpa7232.9470.8650.6610.5870.017−0.297−0.123
Scpa7743.8511.0000.7400.6920.000 *−0.339−0.149
Scpa0232.9921.0000.6660.5920.000 *−0.492−0.201
Scpa5143.8960.8790.7430.6950.000 *−0.167−0.078
Scpa0743.9511.0000.7470.7000.000 *−0.327−0.145
Scpa3743.6821.0000.7280.6790.000 *−0.360−0.157
Scpa3332.5040.9230.6010.5320.000 *−0.528−0.202
Scpa2421.9110.1350.4770.3630.000 *0.7230.231
Scpa2332.6381.0000.6210.5490.000 *−0.602−0.234
Mean
WSp7.0005.2100.7900.7990.7710.1440.0290.006
FSp3.5563.1040.7550.6580.5960.125−0.123−0.057
WSs4.1112.6270.6670.5940.5330.228−0.102−0.045
FSs3.1112.4690.8060.5860.5020.175−0.361−0.138
Hy3.3333.1520.8670.6650.5990.002−0.265−0.117
* Indicates significant deviation from HWE after Bonferroni correction. WSp: Wild paternal S. paramamosain population; FSp: F1 paternal S. paramamosain family; WSp: Wild maternal S. serrata population; FSs; F1 maternal S. serrata family; Hy: F1 hybrid Scylla family (S. paramamosain ♂ × S. serrata ♀).
Table 5. The fixation index (Fst) values of pairwise comparison (below diagonal) and p-values (above diagonal) among five Scylla populations. WSp: Wild paternal S. paramamosain population; FSp: F1 paternal S. paramamosain family; WSp: Wild maternal S. serrata population; FSs; F1 maternal S. serrata family; Hy: F1 hybrid Scylla family (S. paramamosain ♂ × S. serrata ♀).
PopulationWSpFSpWSsFSsHy
WSp 0.000 0.000 0.000 0.000
FSp0.179 0.000 0.000 0.000
WSs0.175 0.291 0.000 0.000
FSs0.223 0.362 0.094 0.000
Hy0.247 0.257 0.337 0.386
Table 6. Analysis of molecular variance (AMOVA).
Source of VariationVariance
Components
Percentage
of Variation (%)
Fixation Indexp Value
Among populations0.34 26.72 Φst = 0.267160.00000
Within populations0.93 73.28
Table 7. Genetic distances (below diagonal) and genetic identity (above diagonal) among five Scylla populations. WSp: Wild paternal S. paramamosain population; FSp: F1 paternal S. paramamosain family; WSp: Wild maternal S. serrata population; FSs; F1 maternal S. serrata family; Hy: F1 hybrid Scylla family (S. paramamosain ♂ × S. serrata ♀).
PopulationWSpFSpWSsFSsHy
WSp 0.4800.3740.4470.370
FSp0.734 0.3440.2340.543
WSs0.9851.068 0.8490.214
FSs0.8051.4530.164 0.160
Hy0.9950.6111.5401.835
Disclaimer/Publisher’s Note: The statements, opinions and data contained in all publications are solely those of the individual author(s) and contributor(s) and not of MDPI and/or the editor(s). MDPI and/or the editor(s) disclaim responsibility for any injury to people or property resulting from any ideas, methods, instructions or products referred to in the content.

