Article

Transcriptome Analysis Provides an Overview of Genes Involved in the Peculiar Food Preference at First-Feeding Stage in Mandarin Fish (Siniperca chuatsi)

1
Chinese Perch Research Center, College of Fisheries, Huazhong Agricultural University, Wuhan 430070, China
2
Engineering Research Center of Green Development for Conventional Aquatic Biological Industry in the Yangtze River Economic Belt, Ministry of Education, Wuhan 430070, China
*
Author to whom correspondence should be addressed.
Fishes 2023, 8(1), 17; https://doi.org/10.3390/fishes8010017
Submission received: 31 October 2022 / Revised: 19 December 2022 / Accepted: 23 December 2022 / Published: 27 December 2022
(This article belongs to the Special Issue Current Trends in Growth and Metabolism of Fishes)

Abstract

:
The mandarin fish (Siniperca chuatsi) is an important economic fish species in China. Many carnivorous fish larvae feed on zooplankton or microdiets. However, the mandarin fish larvae feed on live prey fish exclusively, while refusing zooplankton or microdiets. A stable supply of palatable live prey fish results in high costs. Moreover, the application of live prey fish might bring the risk of pathogens. However, little is known about the genes underlying the food preference of mandarin fish larvae. Partial offspring of the domesticated strain could feed brine shrimp from three days post-hatching (dph), the open mouth day. In the present study, the mandarin fish larvae were randomly divided into three groups, then treated differently at 3 dph: (1) unfed; (2) fed with live prey fish; (3) fed with brine shrimp (Artemia). Differentially expressed genes were identified by RNA-seq. The differential expression of the transcription factors involved in retinal photoreceptor development and differentiation might contribute to the intake of brine shrimp in mandarin fish larvae. Meanwhile, the digestive enzyme genes involved in protein, fat, and carbohydrate digestion have been expressed in mandarin fish larvae at 3 dph, contributing to the digestion of ingested food. Our study provides an overview of genes and biological processes involved in the peculiar food preference at the first-feeding stage in mandarin fish larvae and has critical importance to the future application of non-fish live feeds in the culture of mandarin fish larvae.

1. Introduction

Mandarin fish (Siniperca chuatsi) is an important economic fish species in China. It is becoming increasingly popular with consumers in recent years due to its delicious and nutritious flesh, and its output value has been more than 3 billion U.S. dollars since 2015 (FAO, 2016–2022). However, mandarin fish displays a very peculiar food preference for live prey fish, while refusing artificial diets, or even dead prey fish [1]. A stable supply of palatable live prey fish for mandarin fish results in high farming costs [1]. It is very important to find out the potential factors that contribute to this peculiar food preference.
Food choice is not solely influenced by endogenous factors, such as physiological or nutritional needs, but also by various exogenous factors, such as the odor, shape, color, and size of food [2,3]. These exogenous factors can be captured by sensory systems. Diverse sensory modalities are used for foraging in teleosts, including vision, olfaction, gustation, and lateral-line mechanoreception [4]. We have previously studied the sensory basis of mandarin fish in feeding and found that vision was the major sensory modality for mandarin fish to detect and catch prey, and lateral-line mechanoreception was used to assist feeding [1]. Our previous transcriptome analysis of hybrid F1 of S. chuatsi (♀) × S. scherzeri (♂) with different performance in accepting dead prey fish indicated that the genes in the retinal photosensitivity pathway might contribute to the peculiar food preference, including retinal G protein-coupled receptor (rgr) and retinol dehydrogenase 8 (rdh8) [5]. Olfaction is essential for the recognition of food in many fish species, while mandarin fish display a relatively low dependency on olfaction. Our previous genome-wide identification of olfactory receptors indicated that the diversity of olfactory receptors was decreased, and two subfamilies were absent in mandarin fish [6]. Gustation was used in the final verification of the captured prey for swallowing in mandarin fish [1]. Based on these results, a specific training procedure was developed to wean mandarin fish from live prey fish to artificial diets [1]. After training, mandarin fish with a total length of more than 6 cm usually display good performance in accepting artificial diets. However, at the first-feeding stage, the mandarin fish larvae still only consume live prey fish, while refusing zooplankton or microdiets. A stable supply of palatable live prey fish consumes large amounts of fingerling resources and manpower, resulting in high costs. Moreover, the application of live prey fish might bring the risk of pathogens. However, little is known about the genes underlying the food preference of mandarin fish larvae.
The larvae of most fish species preferentially use vision to detect prey, such as Asian seabass (Lates calcarifer) [7], brown-marbled grouper (Epinephelus fuscoguttatus) [8], and salmonid fishes [9]. Striped bass (Morone saxatilis) spawns in a highly turbid estuary, and its larvae rely mainly on superficial neuromasts for feeding [10]. Japanese eel (Anguilla japonica) larvae identify food in swallowed seawater by olfaction/taste under dark conditions [11]. As the digestive systems have not yet been fully developed, digestible live food is essential for fish larvae, such as rotifers (Brachionus sp.), brine shrimp (Artemia sp.), and copepods [12,13]. Many carnivorous fish larvae feed on non-fish live feeds. For example, Asian seabass larvae feed on brine shrimp and rotifers [14]; European seabass (Dicentrarchus labrax) larvae feed on brine shrimp and copepods [15]; large yellow croaker (Larimichthys crocea) larvae feed on rotifers, brine shrimp and copepods [16]; snakehead (Channa argus) feed on cladocerans, rotifers, and copepods [17]. To better meet the nutritional needs of fish larvae and reduce the costs, microdiets have been developed as alternatives to living feeds [18].
Previous transcriptome studies of other fish larvae provided some clues and inspiration. Longfin yellowtail (Seriola rivoliana) larvae opened their mouth at 3 days post-hatching (dph), and the genes involved in autophagy and AMPK signaling pathways were up-regulated, consistent with their swirling behavior near the water surface to seek food [19]. In estuarine tapertail anchovies (Coilia nasus), the genes involved in retinol metabolism and lipid metabolism were differentially expressed during the mouth-open period, contributing to eye development and lipid storage [20]. We found that partial offspring of the domesticated strain of mandarin fish could feed brine shrimp from 3 dph, the open mouth day. In the present study, transcriptome sequencing was performed between the mandarin fish larvae fed with live prey fish and brine shrimp at 3 dph, with unfed larvae as a negative control. Representative differentially expressed genes (DEGs) and pathways were identified. Our study might provide an overview of genes and biological processes involved in the peculiar food preference at the first-feeding stage in mandarin fish larvae, and has critical importance to the future application of non-fish live feeds in the culture of mandarin fish larvae.

2. Materials and Methods

2.1. Fish

Mandarin fish (Siniperca chuatsi) were obtained from the Chinese Perch Research Center of Huazhong Agricultural University (Wuhan, China). Fertilized eggs were collected after artificial insemination, transferred to the hatcher in a 40 L tank, and hatched at 25 °C. After hatching, the larvae were randomly divided into 3 groups (3 tanks/group), then treated differently at 3 dph: (1) unfed (negative control); (2) fed with live prey fish (zebrafish (Danio rerio) larvae); (3) fed with brine shrimp (Artemia). At 2 h after feeding, the larvae were sampled. The animal protocol was approved by the Institutional Animal Care and Use Committees of Huazhong Agricultural University (Wuhan, China) (HZAUFI-2019-038).

2.2. Total RNA Extraction

Total RNA was extracted from the mandarin fish larvae using RNAiso Plus (TaKaRa, Dalian, China) according to the manufacturer’s manual. The larvae samples were homogenized with glass beads using a tissue grinder TissueLyser II (QIAGEN, Hilden, Germany). Subsequently, RNA was isolated using chloroform and precipitated using isopropyl alcohol. The precipitated RNA was washed with 75% ethanol and resuspended in RNase-free water. The integrity of RNA was assessed by agarose gel electrophoresis. The concentration and purity of RNA were determined by NanoDrop 2000 spectrophotometer (Thermo Fisher Scientific, Waltham, MA, USA). The RIN (RNA Integrity Number) was measured using Agilent 2100 Bioanalyzer (Agilent, Santa Clara, CA, USA). The RNA sample with a total amount ≥1 μg, concentration ≥ 50 ng/μL, 1.8 ≤ OD260/280 ≤ 2.2, OD260/230 ≥ 1.0, and RIN ≥ 8.0 were used for library construction and RNA-seq.

2.3. cDNA Library Construction and RNA-seq

Three biological replicates (each biological replicate included 10 fish larvae) from each group were used for the cDNA library construction and RNA-seq. The cDNA libraries were constructed with the Illumina® TruSeq™ RNA Sample Preparation Kit (Illumina, San Diego, CA, USA). mRNA was purified from the total RNA with Oligo(dT)-attached magnetic beads, then randomly fragmented into small pieces. After size selection with magnetic beads, the fragments of approximately 300 bp were isolated. The first-strand cDNA was synthesized by reverse transcription with random hexamers, followed by second-strand cDNA synthesis. The sticky ends of the cDNA were repaired to generate blunt ends. Subsequently, 3′ end A-Tailing was performed, and RNA Index Adapters were ligated. cDNA libraries were obtained by 15 cycles of PCR enrichment. The target fragments were purified by 2% agarose gel electrophoresis. The obtained cDNA libraries were quantified using a TBS380 fluorometer (Turner Biosystems, Sunnyvale, CA, USA) with the Quant-iT™ PicoGreen™ dsDNA Assay Kit (Thermo Fisher Scientific). Bridge PCR was performed on the cBot to generate clusters. Then the libraries were sequenced on Illumina Novaseq 6000 platform (Illumina, PE150). Library construction and RNA-seq were performed by Shanghai Majorbio Bio-pharm Technology Co., Ltd. (Shanghai, China).

2.4. Data Processing and Mapping

Base calling was performed with CASAVA. Raw sequencing data were filtered and trimmed by fastp software [21]. Adapters, reads without insert fragments, and reads containing more than 10% unknown bases (N) were removed. Low-quality bases (quality value < 30) at 3′ ends were trimmed. After trimming, reads shorter than 50 bp were discarded. Clean reads were aligned to our reference S. chuatsi genome assembly sinChu7 [22] using HISAT2 software [23]. The mapped reads were assembled using StringTie software [24].

2.5. Differential Expression Analysis

Read counts for each gene were calculated by RSEM software [25]. Gene expression levels were calculated as TPM (Transcripts Per Million reads). Differential expression analysis was performed using the R package DESeq2 [26]. Genes were considered to be differentially expressed between (1) the mandarin fish larvae fed with live prey fish and brine shrimp; (2) the mandarin fish larvae unfed and fed with live prey fish; (3) the mandarin fish larvae unfed and fed with brine shrimp when |log2FC| ≥ 1 and padjust (Benjamini–Hochberg adjust p-value) <0.05.

2.6. Functional Enrichment Analyses

Gene ontology (GO) enrichment analysis was performed using the Python package GOATOOLS [27]. GO terms were considered to be significantly enriched when padjust (Benjamini–Hochberg adjust p-value) <0.05. KEGG (Kyoto Encyclopedia of Genes and Genomes) pathway enrichment analysis was performed using custom R scripts. KEGG terms were considered to be significantly enriched when padjust (Benjamini–Hochberg adjust p-value) <0.05.

2.7. Experimental Validation of DEGs by RT-qPCR

Six biological replicates (each biological replicate included 10 fish larvae) from each group were used for the experimental validation of DEGs by RT-qPCR. The extracted RNA was quantified with a BioTek Synergy™ 2 Multi-detection Microplate Reader (BioTek Instruments, Winooski, VT, USA) and agarose gel electrophoresis. One microgram of total RNA was used for the synthesis of cDNA with HiScript® II Q RT SuperMix for qPCR (+gDNA wiper) (Vazyme, Nanjing, China). Primers (Table 1) were designed using PrimerQuest™ Tool, and synthesized by Tsingke Biotech Co., Ltd. (Wuhan, China). The mRNA expression of the rpl13a gene, which was relatively stable between treatments, was amplified as an internal control. RT-qPCR was carried out with CFX384 Touch™ Real-Time PCR Detection System (Bio-Rad, Hercules, CA, USA) and ChamQ SYBR qPCR Master Mix (Vazyme). Melt curve analysis was performed to verify the specificity. Reactions for each sample were performed in triplicate.
Statistical analyses were performed with SPSS19.0 software. Significant differences were found using one-way analysis of variance (ANOVA), followed by Fisher’s least significant difference post hoc test and Duncan’s multiple range tests, after confirming data normality and homogeneity of variances. Differences were considered to be significant if p < 0.05.

3. Results

3.1. Statistics of RNA-seq Data

A total of 419,814,128 raw reads were obtained by the RNA-seq of nine cDNA libraries constructed from the mandarin fish larvae fed with live prey fish, brine shrimp, or unfed. After filtering, 413,197,884 (98.42%) clean reads were retained. The effective rates (the ratio of clean data to raw data) were 97.81–99.02%. The Q20 (sequencing error rate < 1%) and Q30 (sequencing error rate < 0.1%) were 97.89–98.29% and 93.98–94.80%, respectively. The GC contents were 44.99–50.28% (Supplementary Table S1). 41,684,865 (94.54%), 40,457,714 (95.59%), 40,925,166 (94.37%), 40,021,291 (90.94%), 42,176,745 (90.93%), 41,734,359 (91.45%), 41,747,651 (90.91%), 50,216,399 (92.06%), and 44,201,037 (94.21%) clean reads were mapped to the mandarin fish reference genome (version: sinChu7), respectively. Among these, 39,560,073 (89.72%), 38,778,886 (91.63%), 38,969,033 (89.86%), 37,871,341 (86.06%), 39,906,845 (86.04%), 39,966,316 (87.58%), 39,780,370 (86.63%), 47,792,891 (87.62%), and 42,087,500 (89.70%) clean reads were uniquely mapped, respectively (Supplementary Table S1).

3.2. Differentially Expressed Genes between the Mandarin Fish Larvae Fed with Live Prey Fish and Brine Shrimp

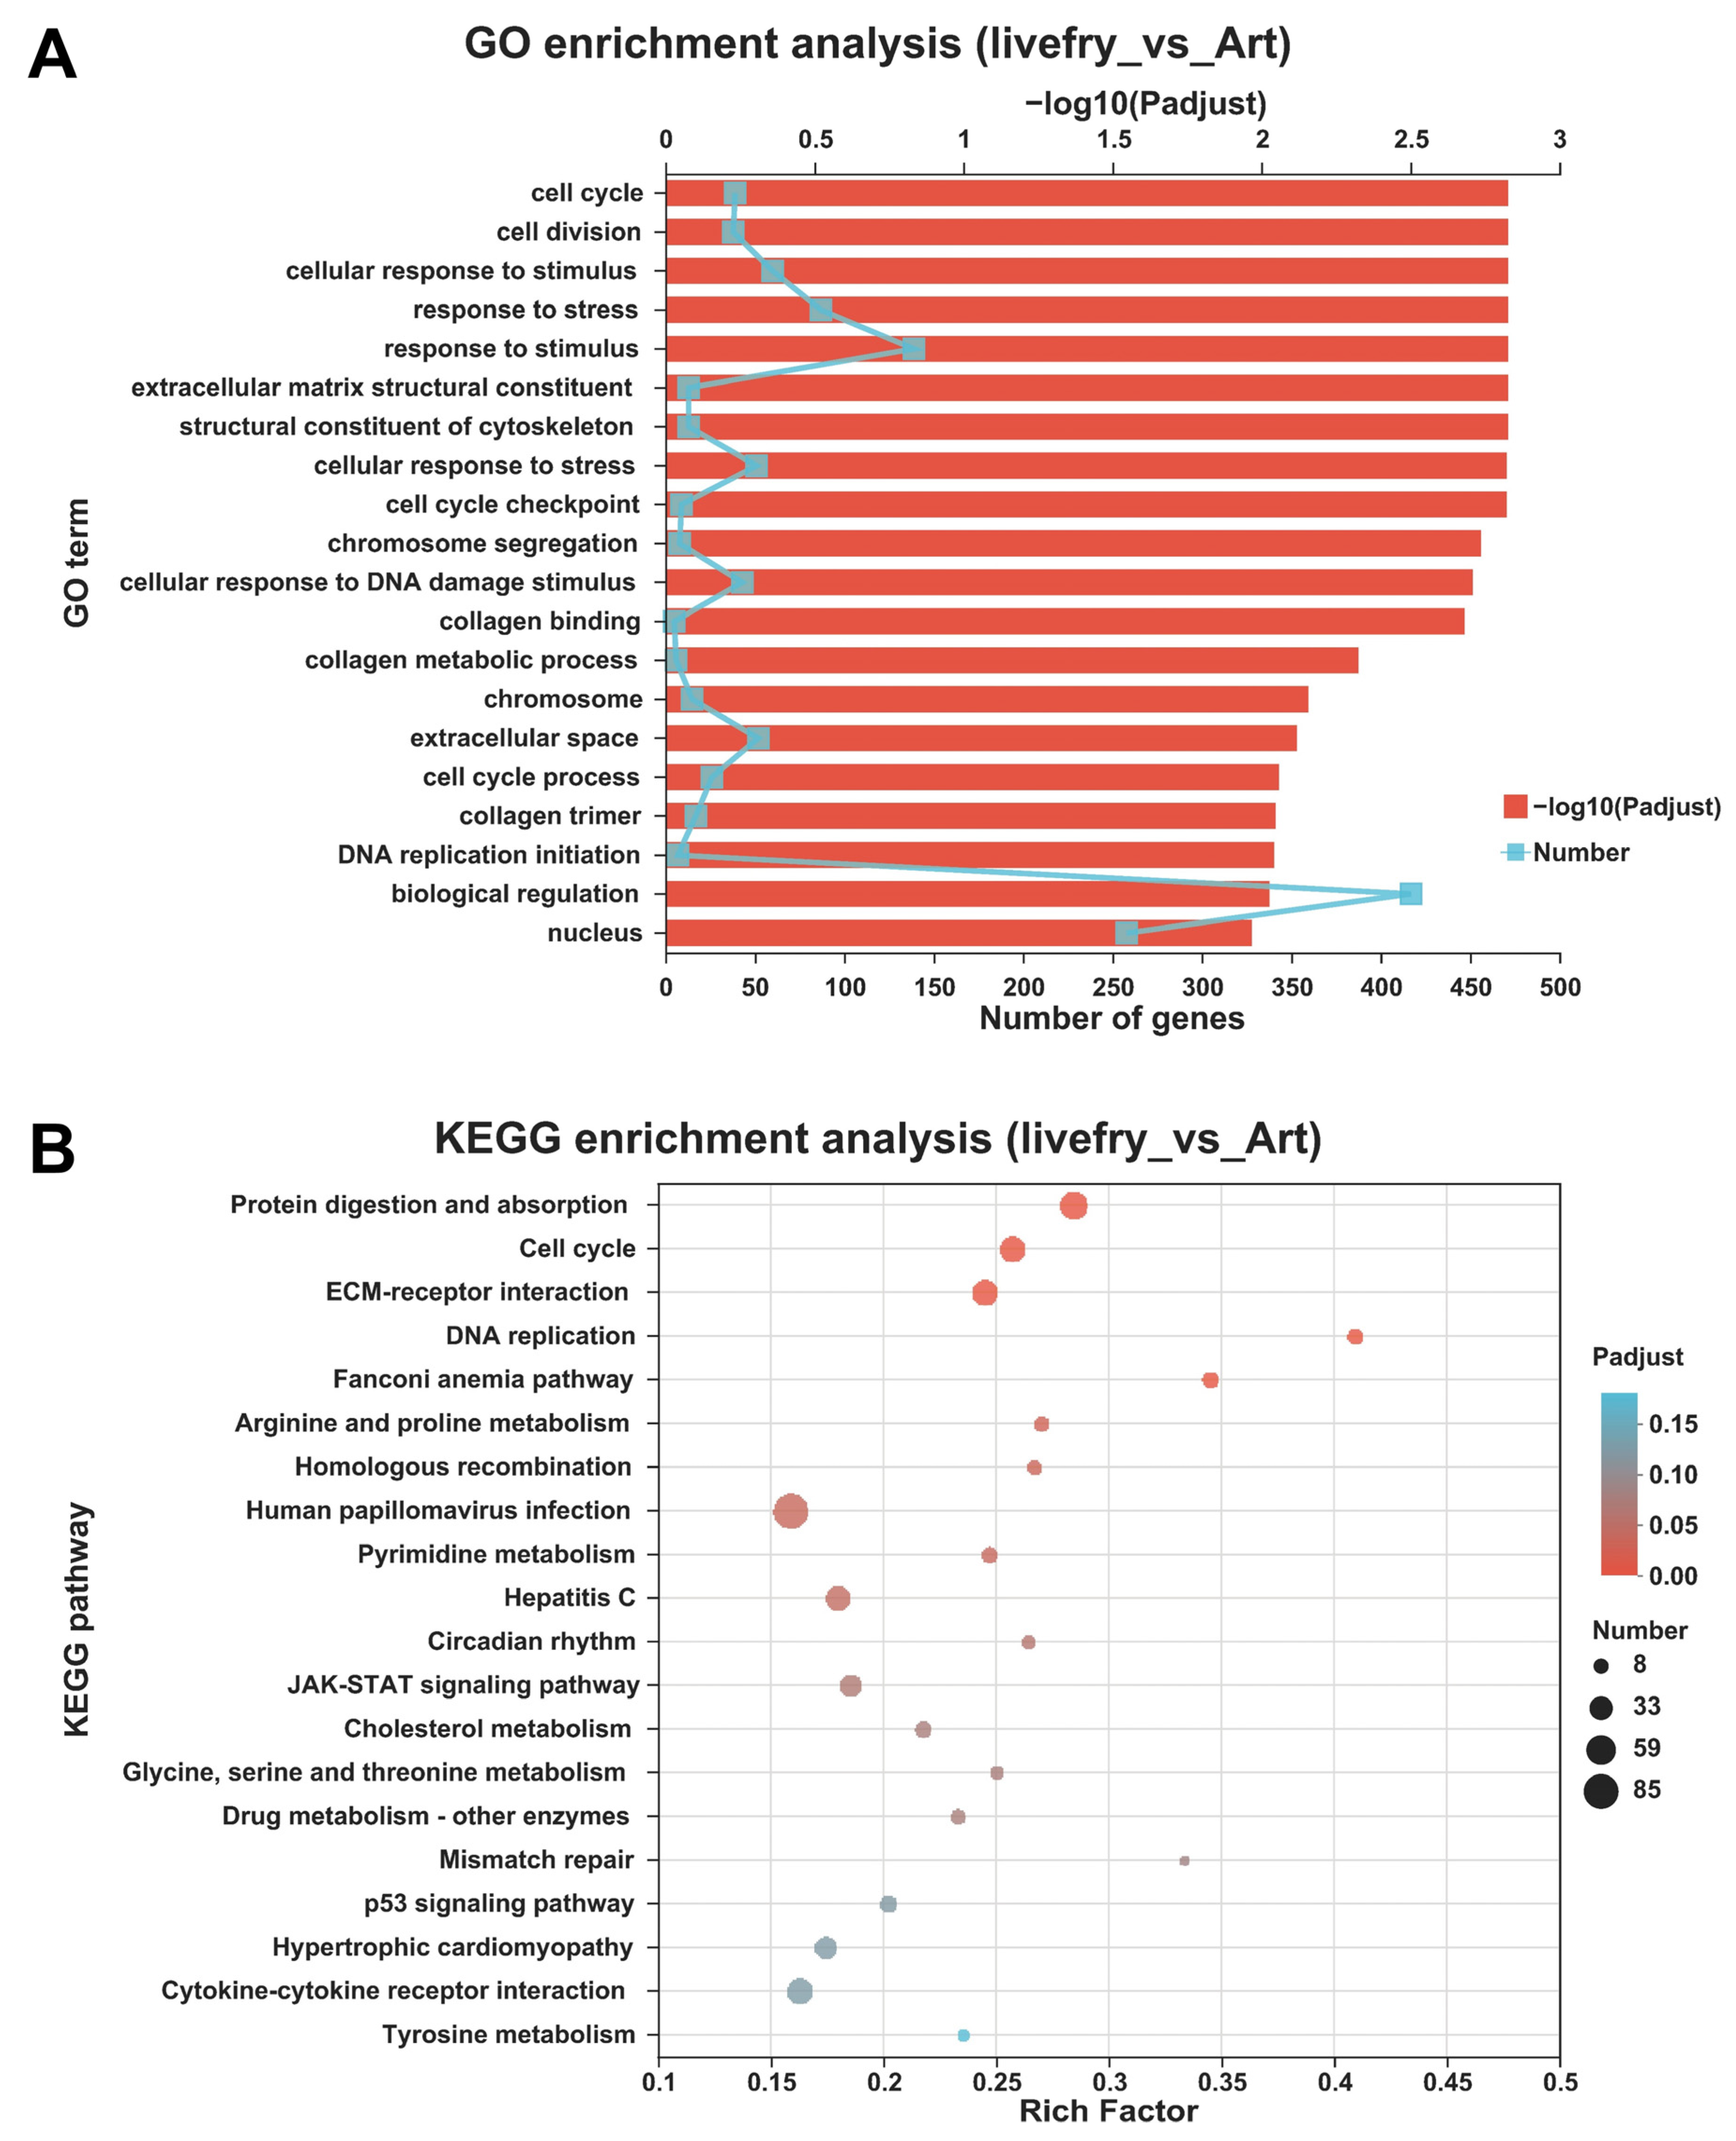
A total of 3227 DEGs were identified between the mandarin fish larvae fed with live prey fish and brine shrimp. Compared with the mandarin fish larvae fed with live prey fish, 1547 genes were up-regulated and 1680 genes were down-regulated in the mandarin fish larvae fed with brine shrimp (Figure 1A,B). GO enrichment analysis revealed that these genes were significantly enriched in 36 GO items, including 19 GO terms in biological process, 9 GO terms in cellular components, and 8 GO terms in molecular function (Figure 2A, Supplementary Table S2). GO enrichment indicated that 139 genes were involved in response to stimulus, including endou, rcvrn3, per3, non-visual opsin genes opn4xb and opn5. KEGG enrichment analysis revealed that these genes were significantly enriched in 10 KEGG pathways, including protein digestion and absorption, cell cycle, ECM-receptor interaction, DNA replication, arginine and proline metabolism, and pyrimidine metabolism (Figure 2B, Supplementary Table S3). The transcription factors involved in retinal photoreceptor development and differentiation were differentially expressed. Compared with the mandarin fish larvae fed with live prey fish, prdm1a and thrb were up-regulated, crx and nr2e3 were down-regulated in the mandarin fish larvae fed with brine shrimp. In addition, the transcription factors esrrg, eloa/tceb3, per3, homeza, and egr1 were up-regulated, gtf2f1 and mef2ca were down-regulated in the mandarin fish larvae fed with brine shrimp (Table 2).

3.3. Differentially Expressed Genes between the Mandarin Fish Larvae Unfed and Fed with Live Prey Fish

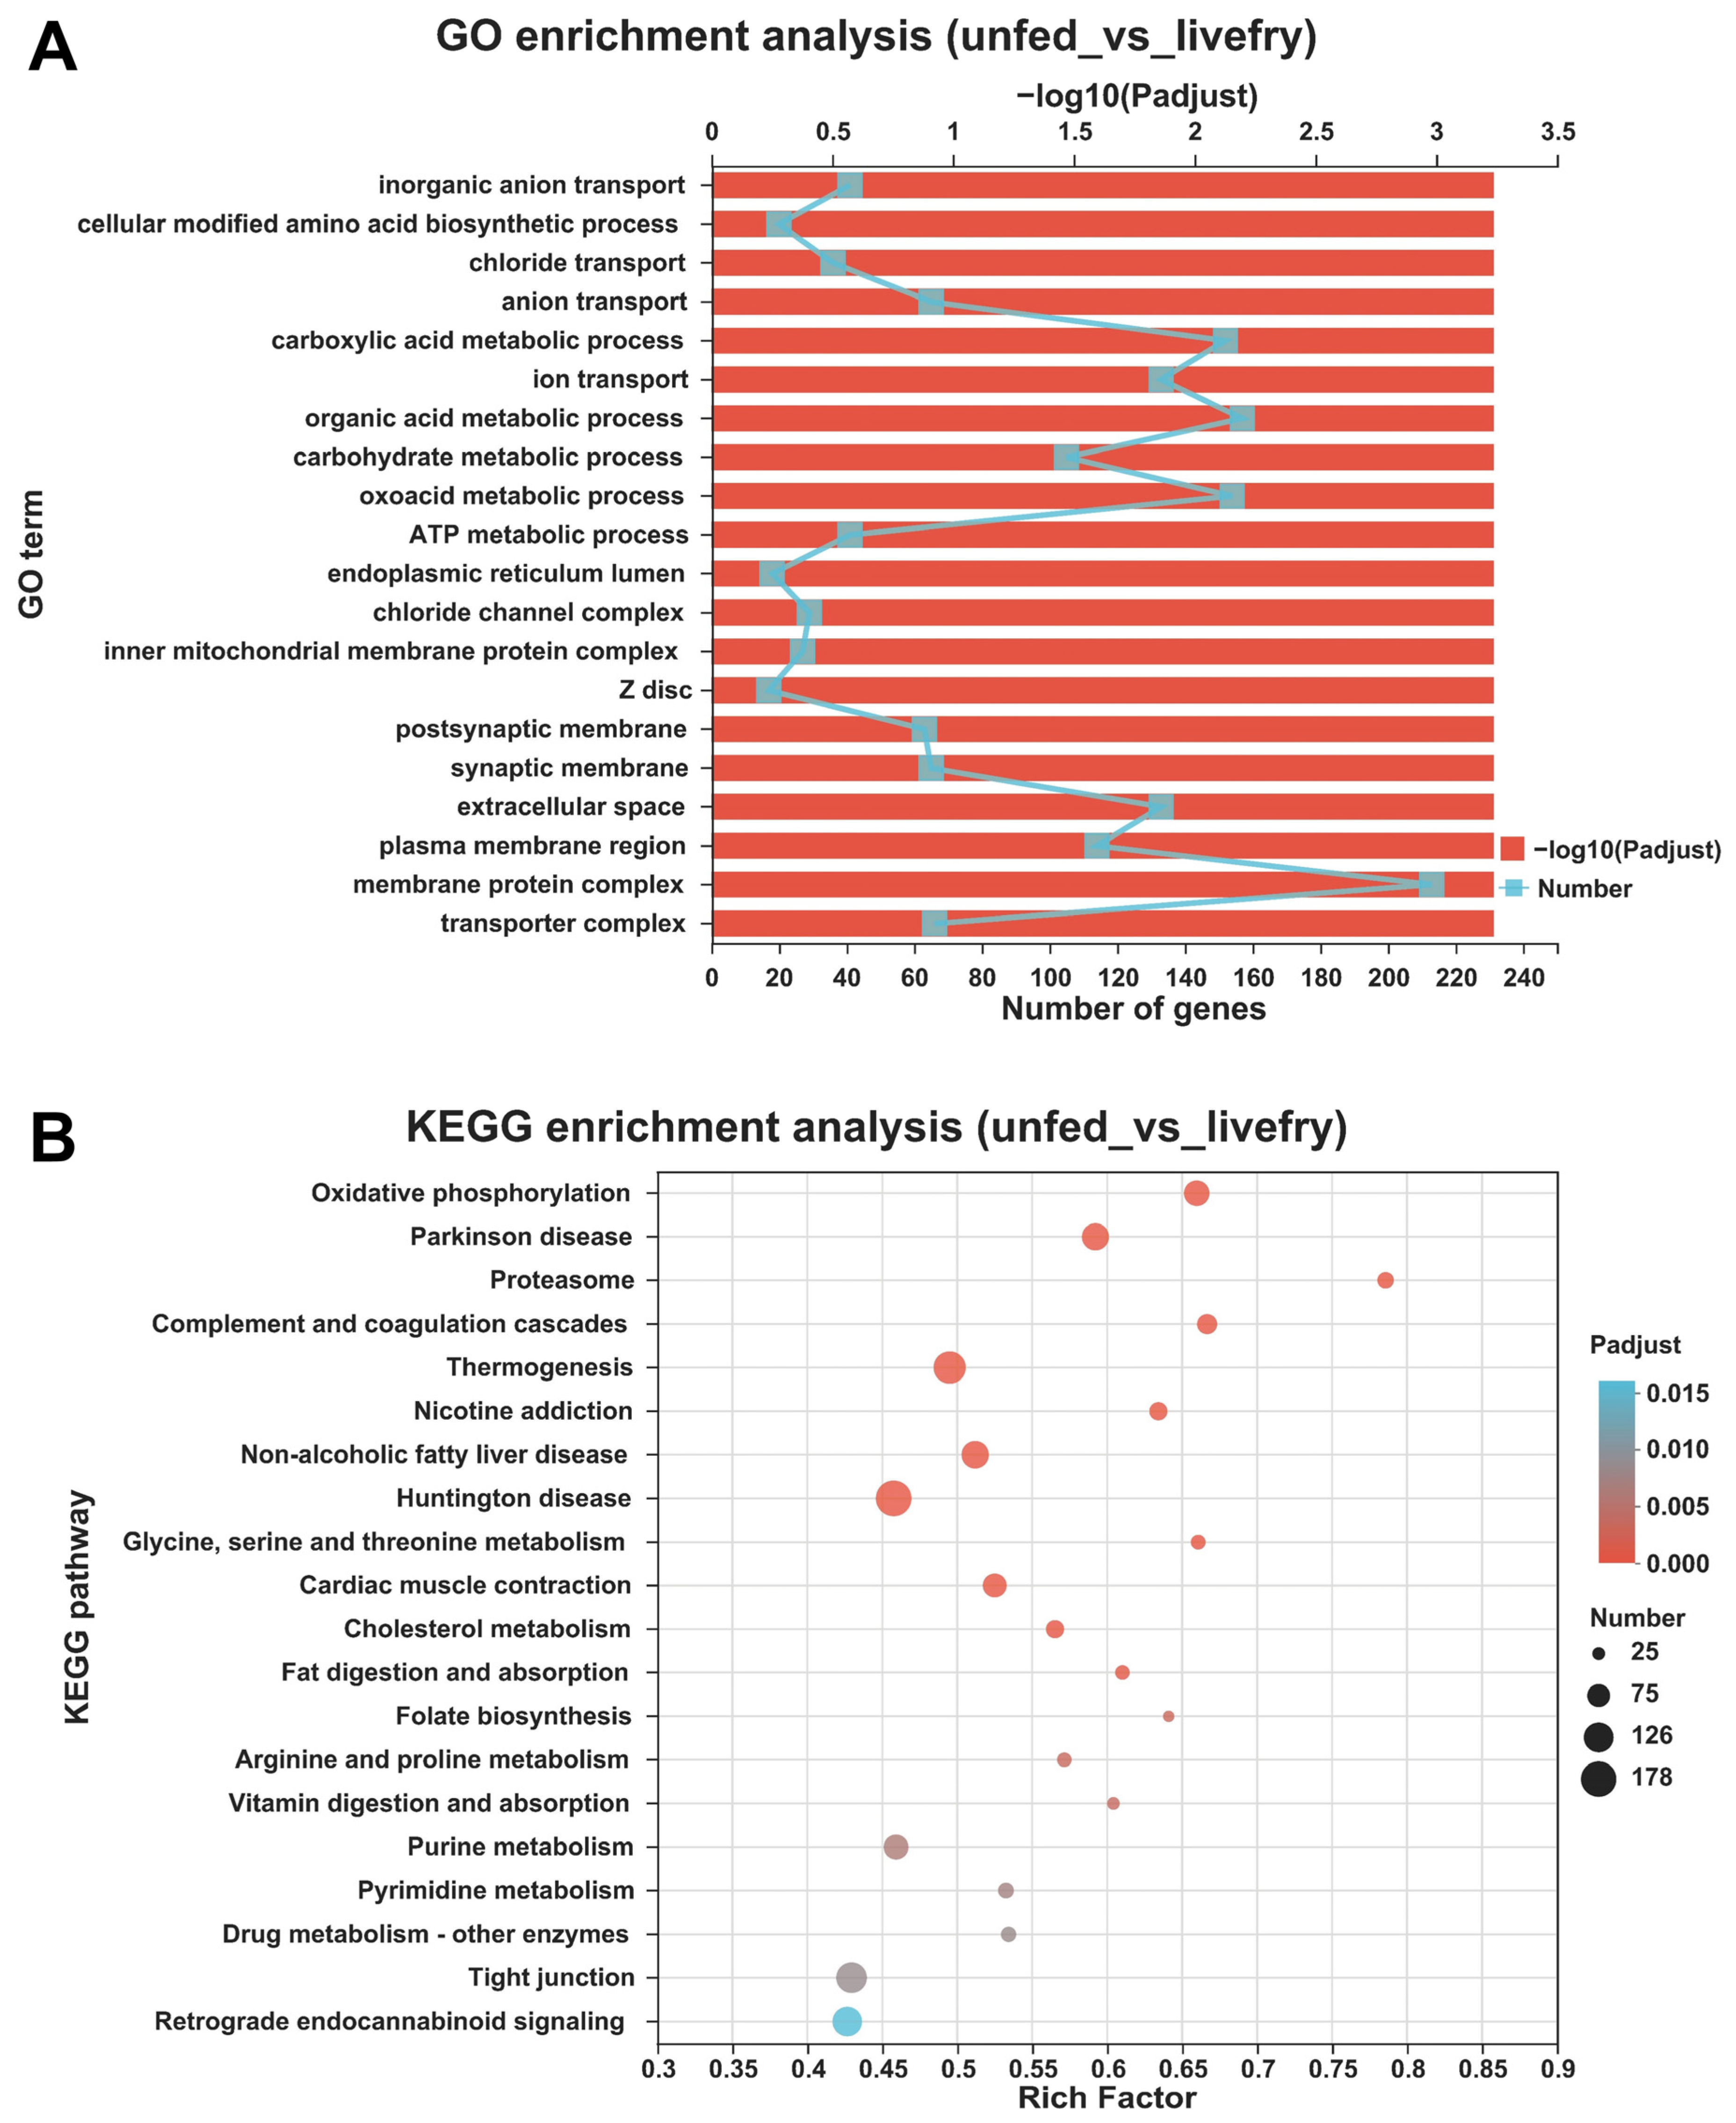
A total of 9430 DEGs were identified between the mandarin fish larvae unfed and fed with live prey fish. Compared with the unfed mandarin fish larvae, 5379 genes were up-regulated and 4051 genes were down-regulated in the mandarin fish larvae fed with live prey fish (Figure 1A,C). GO enrichment analysis revealed that these genes were significantly enriched in 309 GO items, including 171 GO terms in the biological process, 49 GO terms in the cellular component, and 89 GO terms in molecular function (Figure 3A, Supplementary Table S4). KEGG enrichment analysis revealed that these genes were significantly enriched in 25 KEGG pathways, including oxidative phosphorylation, proteasome, thermogenesis, nicotine addiction, glycine, serine and threonine metabolism, cholesterol metabolism, fat digestion and absorption, folate biosynthesis, arginine and proline metabolism, vitamin digestion and absorption, purine metabolism, pyrimidine metabolism, protein digestion and absorption, steroid biosynthesis, and glutathione metabolism (Figure 3B, Supplementary Table S5). Compared with the unfed mandarin fish larvae, try, prss, ctr, ctrl, cela, cpa, and cpb involved in protein digestion, cel involved in fat digestion, amy and lct involved in carbohydrate digestion were up-regulated in the mandarin fish larvae fed with live prey fish (Table 3).

3.4. Differentially Expressed Genes between the Mandarin Fish Larvae Unfed and Fed with Brine Shrimp

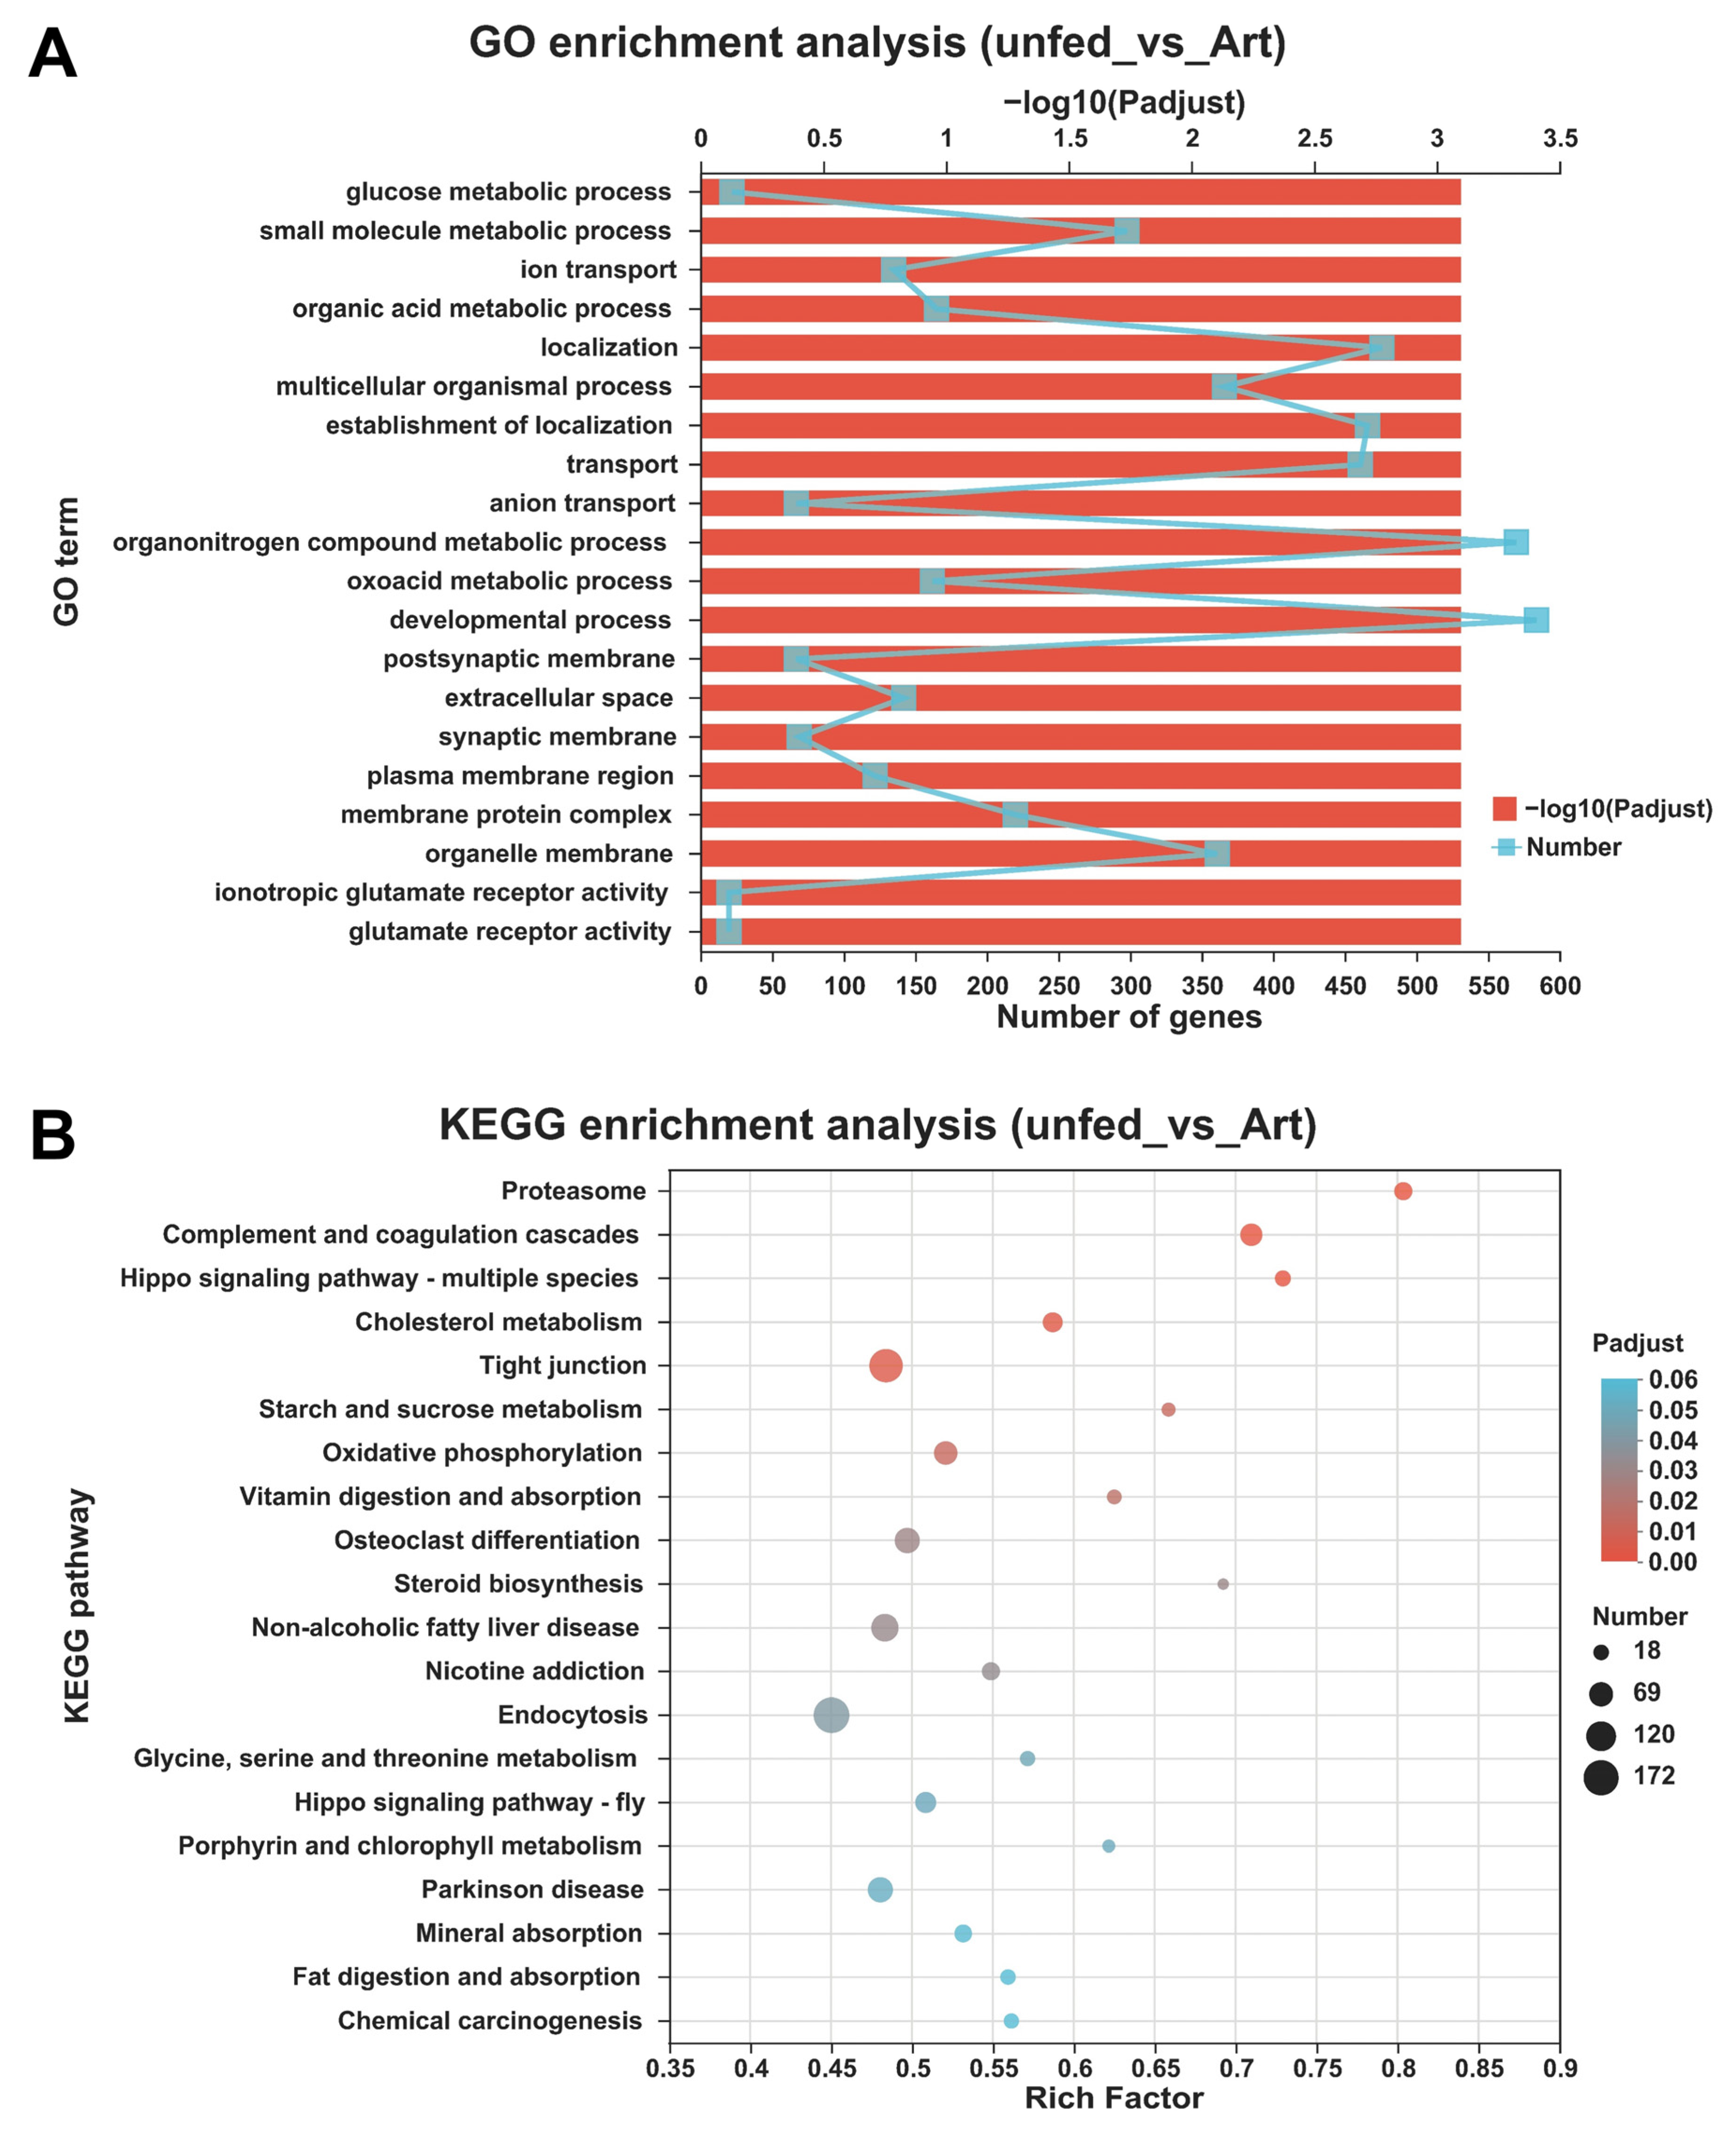
A total of 10,641 DEGs were identified between the mandarin fish larvae unfed and fed with brine shrimp. Compared with unfed mandarin fish larvae, 6257 genes were up-regulated and 4384 genes were down-regulated in the mandarin fish larvae fed with brine shrimp (Figure 1A,D). GO enrichment analysis revealed that these genes were significantly enriched in 210 GO items, including 104 GO terms in the biological process, 34 GO terms in cellular components, and 72 GO terms in molecular function (Figure 4A, Supplementary Table S6). KEGG enrichment analysis revealed that these genes were significantly enriched in 15 KEGG pathways, including proteasome, cholesterol metabolism, starch and sucrose metabolism, oxidative phosphorylation, vitamin digestion and absorption, steroid biosynthesis, nicotine addiction, glycine, and serine and threonine metabolism (Figure 4B, Supplementary Table S7). Compared with unfed mandarin fish larvae, try, prss, ctr, ctrl, cela, cpa, and cpb involved in protein digestion, cel involved in fat digestion, amy involved in carbohydrate digestion were up-regulated in the mandarin fish larvae fed with brine shrimp (Table 4).

3.5. Experimental Validation of DEGs by RT-qPCR

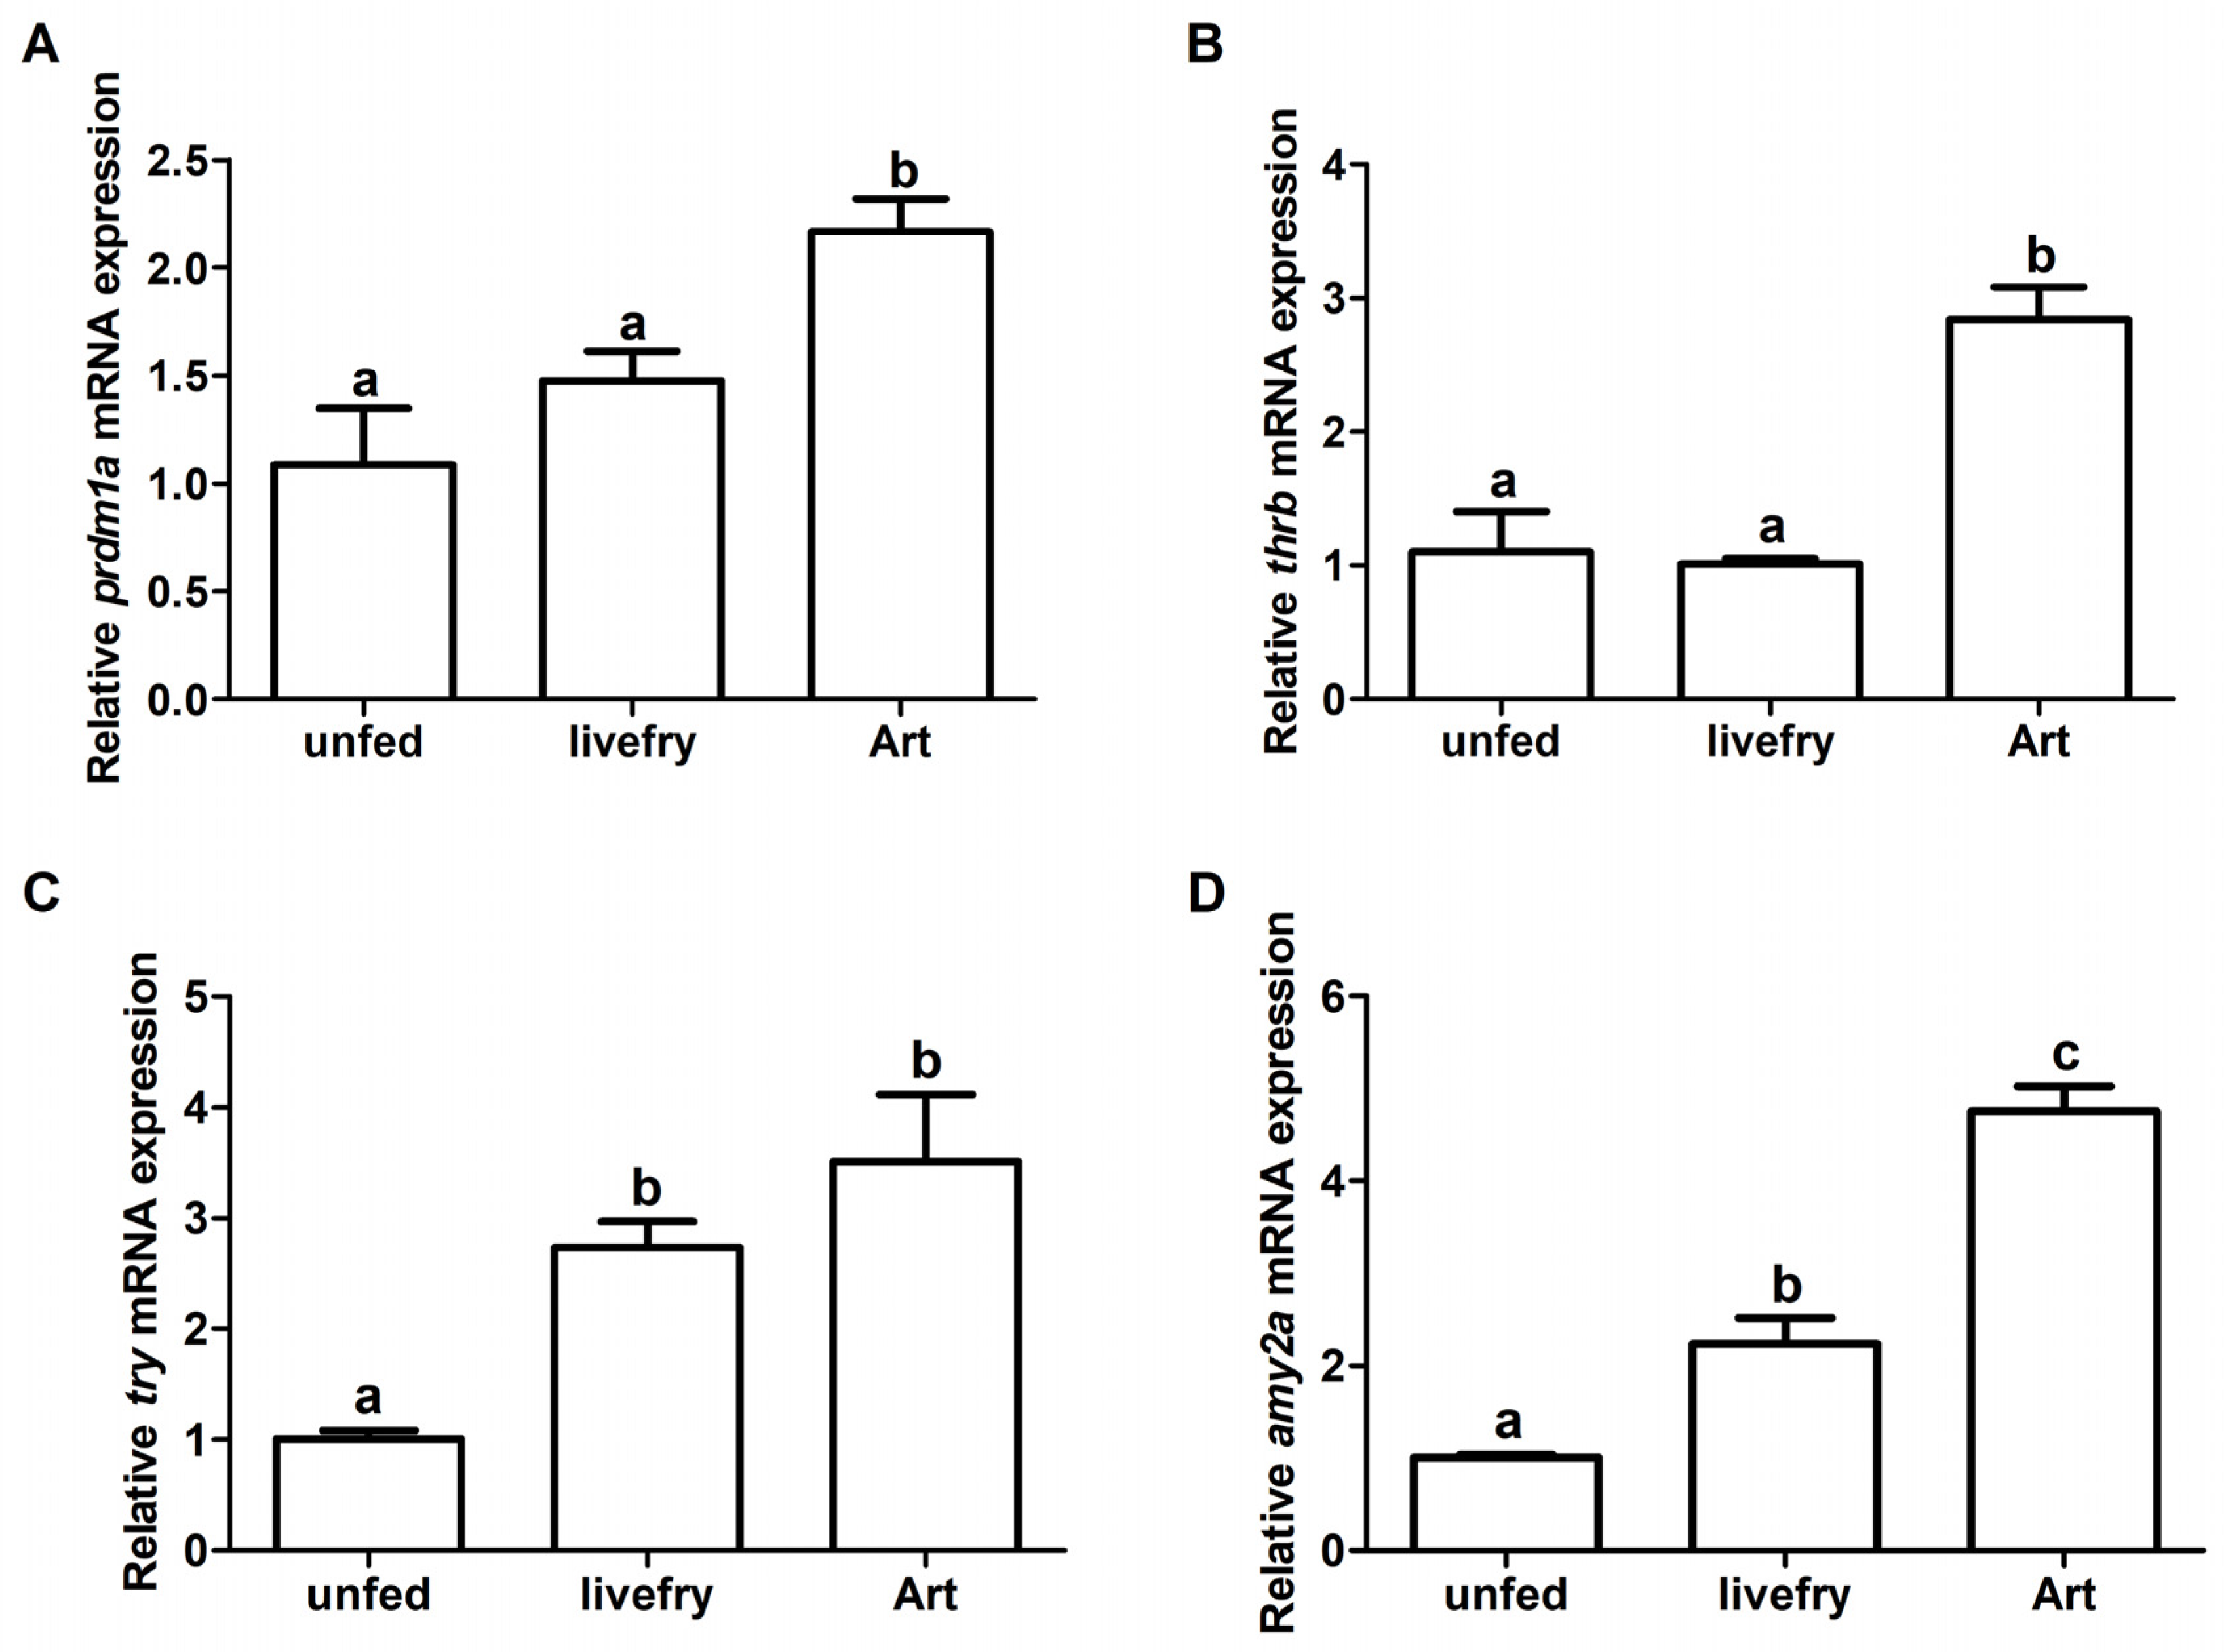
Four genes selected from the DEGs were verified by RT-qPCR. The mRNA expression levels of prdm1a and thrb were significantly higher in the mandarin fish larvae fed with brine shrimp than those fed with live prey fish (p < 0.05) (Figure 5A,B). The mRNA expression levels of try and amy2a were significantly higher in the mandarin fish larvae fed with live prey fish and brine shrimp than those unfed (p < 0.05) (Figure 5C,D). The mRNA expression levels of these four genes detected by RT-qPCR were consistent with the RNA-seq data.

4. Discussion

Many carnivorous fish larvae feed on non-fish live feeds, such as rotifers, brine shrimp, and copepods [12,13]. Moreover, microdiets have been developed as alternatives to live feeds [18]. However, the mandarin fish larvae feed on live prey fish exclusively, while refusing zooplankton or microdiets. Currently, little is known about the genes underlying the food preference of mandarin fish larvae. We found that partial offspring of the domesticated strain could feed brine shrimp from the open mouth day (3 dph). In the present study, transcriptome sequencing was performed between the mandarin fish larvae fed with live prey fish and brine shrimp at 3 dph, and DEGs were identified. GO enrichment indicated that 139 genes were involved in the response to stimulus, including poly(U)-specific endoribonuclease (endou), visinin-like (rcvrn3), period circadian protein homolog 3 (per3), non-visual opsins melanopsin (opn4xb), and neuropsin (opn5). endou was identified as a putative controller of lens development in zebrafish as its strong expression in the lens at 1 day post fertilization (dpf) [28]. The up-regulation of endou in the mandarin fish larvae fed with brine shrimp might accelerate the lens development, allowing the eye to focus on the brine shrimp. rcvrn3 plays an important role in phototransduction [29], and the up-regulation of rcvrn3 in the mandarin fish larvae might enhance the phototransduction to recognize the brine shrimp. Melanopsin is a short-wavelength-sensitive photopigment, and melanopsin signals contribute to visual detection and color perception [30]. Opn5 is a UV-sensitive opsin, involved in the regulation of the retinal circadian clock [31]. The up-regulation of non-visual opsin genes opn4xb and opn5 in the mandarin fish larvae fed with brine shrimp might influence the visual detection, color perception, or retinal circadian clock, contributing to the intake of brine shrimp. Our previous genome-wide identification of visual opsin genes (expressed in the retinal photoreceptor cells) found 5 cone opsin genes in mandarin fish, including short-wavelength sensitive opsins (sws1, sws2Aα, and sws2Aβ), middle-wavelength sensitive opsin (rh2) and long-wavelength sensitive opsin (lws), and 2 rod opsin genes, including rhodopsin (rh1 and rh1-exorh) [32]. Except for the rh2 opsin gene, other visual opsin genes displayed very low expression levels at 3 dph, or were even undetectable [32]. In the present study, the visual opsin genes did not show significant differential expression between the mandarin fish larvae fed with live prey fish and brine shrimp, probably due to the low expression at 3 dph.
Vision is essential for animals to perceive the appearance (such as shape, color, and size) and movement of objects in the surrounding environment. Many transcription factors play important roles in retinal photoreceptor development and differentiation [33,34,35], including orthodenticle homeobox 2 (otx2) [36], visual system homeobox 2 (vsx2/chx10) [37], PR domain zinc finger protein 1 (prdm1/blimp1) [38], paired box 6 (pax6) [39], cone-rod homeobox (crx) [40], neural retina leucine zipper (nrl) [41], nuclear receptor subfamily 2, group E, member 3 (nr2e3) [42], thyroid hormone receptor beta (thrb) [43], retinal homeobox 1 (rx1) [44], growth/differentiation factor 6a (gdf6a) [45], and T-box transcription factor 2b (tbx2b) [46]. Of these transcription factors, crx, otx2, otx5, rx1, and rax are involved in the fate determination of photoreceptor and non-photoreceptor; nrl, nr2e3, rarαb, gdnf, rorβ, pias3, gdf6a, tbx2b, rxrγ, and thrb are involved in the fate determination of rod and cone; thrb, rxrγ, gdf6a, tbx2b, six7 are involved in the fate determination of cone subtype [34]. Crx is a member of the orthodenticle homeobox (otx) family, encoding a photoreceptor-specific transcription factor that regulates photoreceptor differentiation and the expression of photoreceptor cell-specific genes [47]. Nr2e3 is a photoreceptor-specific nuclear receptor [48], mutation of NR2E3 caused enhanced S-cone syndrome in humans with the phenotype of excess S-cones and loss of rods [49]. Knockout of nr2e3 resulted in failure in rod differentiation and selective degeneration of L-/M-cones in zebrafish [50]. Thrb is a ligand-activated transcription factor that is required for the development of red and green cones [43,51]. The deletion of thrb caused selective loss of M-cones in mice [43]. Mutations of thrb resulted in the loss of red cones and abundance changes of other cone subtypes in zebrafish [52]. In the present study, compared with the mandarin fish larvae fed with live prey fish, prdm1a and thrb were up-regulated, crx and nr2e3 were down-regulated in the mandarin fish larvae fed with brine shrimp, suggesting the potential difference in retinal photoreceptor development and differentiation between the mandarin fish larvae fed with live prey fish and brine shrimp. In addition, transcription factors estrogen-related receptor gamma (esrrg), transcription elongation factor B polypeptide 3 (eloa/tceb3), per3, homeobox and leucine zipper encoding a (homeza), early growth response protein 1 (egr1) were up-regulated, general transcription factor IIF subunit 1 (gtf2f1) and myocyte enhancer factor 2ca (mef2ca) were down-regulated in the mandarin fish larvae fed with brine shrimp. Although the roles of these transcription factors in retinal photoreceptor development and differentiation have not been characterized, they were reported to be differentially expressed between rods and cones, or between cone subtypes in zebrafish [53]. The differential expression of these transcription factors between the mandarin fish larvae fed with live prey fish and brine shrimp indicated the potential roles of these transcription factors in the peculiar food preference of mandarin fish.
GO and KEGG enrichment analyses indicated that the DEGs between the mandarin fish larvae fed with live prey fish and brine shrimp were mainly involved in the response to stimulus (vision), protein digestion and absorption, while the DEGs between the mandarin fish larvae unfed and fed with live prey fish or brine shrimp were mainly involved in the digestion and metabolism of nutrients. Adaptive changes were observed in the digestive system of young mandarin fish after artificial diet domestication, including the morphological changes in the stomach, intestines, and pyloric cecum, and the expression changes of digestive enzymes [54], indicating that digestive system or digestive enzymes might play important roles in the adaption of artificial diets in mandarin fish. The domestication process significantly influenced the digestion ability at the very beginning of ontogeny [55]. Although the digestive systems have not yet been fully developed at the onset of exogenous feeding in fish larvae, pancreatic enzymes were efficient at hatching [56]. Digestive enzymes are essential for fish larvae to utilize exogenous nutrients. In the present study, compared with the unfed mandarin fish larvae, try, prss, ctr, ctrl, cela, cpa, and cpb involved in protein digestion, cel involved in fat digestion, amy involved in carbohydrate digestion were up-regulated in the mandarin fish larvae fed with live prey fish or brine shrimp, suggesting that these digestive enzymes have been expressed in the mandarin fish larvae at 3 dph, contributing to the digestion of ingested food. Similar results were reported between the mandarin fish larvae unfed and fed with brine shrimp in our previous study detected by RT-qPCR and enzyme activity assays [57]. The expression of digestive enzyme genes showed less difference between the mandarin fish larvae fed with live prey fish and brine shrimp.

5. Conclusions

In conclusion, our study provides an overview of genes and biological processes involved in the peculiar food preference at the first-feeding stage in mandarin fish larvae. Vision plays an important role in feeding in mandarin fish larvae. Differential expression of transcription factors involved in retinal photoreceptor development and differentiation might contribute to the intake of brine shrimp in mandarin fish larvae. Meanwhile, the digestive enzyme genes involved in protein, fat, and carbohydrate digestion have been expressed in the mandarin fish larvae at 3 dph, contributing to the digestion of ingested food. The results could provide insight into the future application of non-fish live feeds in the culture of mandarin fish larvae.

Supplementary Materials

The following supporting information can be downloaded at: https://www.mdpi.com/article/10.3390/fishes8010017/s1, Table S1: Statistics of RNA-seq data; Table S2: GO enrichment of DEGs between the mandarin fish larvae fed with live prey fish and brine shrimp; Table S3: KEGG enrichment of DEGs between the mandarin fish larvae fed with live prey fish and brine shrimp; Table S4: GO enrichment of DEGs between the mandarin fish larvae unfed and fed with live prey fish; Table S5: KEGG enrichment of DEGs between the mandarin fish larvae unfed and fed with live prey fish; Table S6: GO enrichment of DEGs between the mandarin fish larvae unfed and fed with brine shrimp; Table S7: KEGG enrichment of DEGs between the mandarin fish larvae unfed and fed with brine shrimp.

Author Contributions

Conceptualization, S.H. and X.-F.L.; Formal analysis, L.L.; Funding acquisition, L.L. and X.-F.L.; Investigation, L.L.; Resources, S.-L.T.; Writing—original draft, L.L.; Writing—review and editing, S.H. All authors have read and agreed to the published version of the manuscript.

Funding

This work was financially supported by the China Postdoctoral Science Foundation (NO. 2021M701352), and the National Natural Science Foundation of China (NO. 32202903 and 31972809).

Institutional Review Board Statement

In the present study, all procedures were performed in accordance with the “Guidelines for Experimental Animals” of the Ministry of Science and Technology (Beijing, China) and were approved by the Institutional Animal Care and Use Committees of Huazhong Agricultural University, ethic code HZAUFI-2019-038.

Data Availability Statement

RNA-seq data have been deposited at the Sequence Read Archive (SRA) of the National Center for Biotechnology Information (NCBI) (BioProject: PRJNA894326).

Conflicts of Interest

The authors declare no conflict of interest. This work has not been published previously.

References

  1. Liang, X.F.; Oku, H.; Ogata, H.Y.; Liu, J.; He, X. Weaning Chinese perch Siniperca chuatsi (Basilewsky) onto artificial diets based upon its specific sensory modality in feeding. Aquac. Res. 2001, 32, 76–82. [Google Scholar] [CrossRef] [Green Version]
  2. Huang, F.-Y.; Sutcliffe, M.P.F.; Grabenhorst, F. Preferences for nutrients and sensory food qualities identify biological sources of economic values in monkeys. Proc. Natl. Acad. Sci. USA 2021, 118, e2101954118. [Google Scholar] [CrossRef]
  3. Kasumyan, A.O. The taste system in fishes and the effects of environmental variables. J. Fish Biol. 2019, 95, 155–178. [Google Scholar] [CrossRef] [Green Version]
  4. Mogdans, J. Sensory ecology of the fish lateral-line system: Morphological and physiological adaptations for the perception of hydrodynamic stimuli. J. Fish Biol. 2019, 95, 53–72. [Google Scholar] [CrossRef]
  5. He, S.; Liang, X.-F.; Sun, J.; Li, L.; Yu, Y.; Huang, W.; Qu, C.-M.; Cao, L.; Bai, X.-L.; Tao, Y.-X. Insights into food preference in hybrid F1 of Siniperca chuatsi (♀) × Siniperca scherzeri (♂) mandarin fish through transcriptome analysis. BMC Genomics 2013, 14, 601. [Google Scholar] [CrossRef] [PubMed] [Green Version]
  6. Lv, L.-Y.; Liang, X.-F.; He, S. Genome-wide identification and characterization of olfactory receptor genes in Chinese perch, Siniperca chuatsi. Genes 2019, 10, 178. [Google Scholar] [CrossRef] [Green Version]
  7. Yahaya, S.; Lim, L.-S.; Shaleh, S.R.M.; Mukai, Y.; Anraku, K.; Kawamura, G. Ontogenetic eye development and related behavioural changes in larvae and juveniles of barramundi Lates calcarifer (Bloch). Mar. Freshw. Behav. Physiol. 2011, 44, 339–348. [Google Scholar] [CrossRef]
  8. Lim, L.-S.; Mukai, Y. Morphogenesis of sense organs and behavioural changes in larvae of the brown-marbled grouper Epinephelus fuscoguttatus (Forsskål). Mar. Freshw. Behav. Physiol. 2014, 47, 313–327. [Google Scholar] [CrossRef]
  9. Cheng, C.L.; Flamarique, I.N.; Hárosi, F.I.; Rickers-Haunerland, J.; Haunerland, N.H. Photoreceptor layer of salmonid fishes: Transformation and loss of single cones in juvenile fish. J. Comp. Neurol. 2006, 495, 213–235. [Google Scholar] [CrossRef]
  10. Sampson, J.A.; Duston, J.; Croll, R.P. Superficial neuromasts facilitate non-visual feeding by larval striped bass (Morone saxatilis). J. Exp. Biol. 2013, 216, 3522–3530. [Google Scholar] [CrossRef]
  11. Kenzaki, A.; Okunishi, S.; Tomoda, T.; Shioura, Y.; Uchida, M.; Tezuka, N.; Maeda, H. Observation of the feeding behaviour of reared Japanese eel Anguilla japonica leptocephali fed picocyanobacteria Synechococcus spp. J. Fish Biol. 2022, 100, 727–737. [Google Scholar] [CrossRef]
  12. Rasdi, N.W.; Qin, J.G. Improvement of copepod nutritional quality as live food for aquaculture: A review. Aquac. Res. 2016, 47, 1–20. [Google Scholar] [CrossRef]
  13. Conceição, L.E.C.; Yúfera, M.; Makridis, P.; Morais, S.; Dinis, M.T. Live feeds for early stages of fish rearing. Aquac. Res. 2010, 41, 613–640. [Google Scholar] [CrossRef]
  14. Curnow, J.; King, J.; Bosmans, J.; Kolkovski, S. The effect of reduced Artemia and rotifer use facilitated by a new microdiet in the rearing of barramundi Lates calcarifer (BLOCH) larvae. Aquaculture 2006, 257, 204–213. [Google Scholar] [CrossRef]
  15. Giebichenstein, J.; Giebichenstein, J.; Hasler, M.; Schulz, C.; Ueberschär, B. Comparing the performance of four commercial microdiets in an early weaning protocol for European seabass larvae (Dicentrarchus labrax). Aquac. Res. 2022, 53, 544–558. [Google Scholar] [CrossRef]
  16. Chen, R.; Hong, Y.; Hong, Y.; Sun, K.; Hong, Y. Study on formulated diet for large yellow croaker (Larimichthys crocea) larvae at the early feeding stage. Iran. J. Fish. Sci. 2021, 20, 313–323. [Google Scholar] [CrossRef]
  17. Xie, C.; Xiong, C.; Zhou, J.; Wei, K. Development of feeding organs and selective behavior on food of larval Chinese snake-head fish Channa argus. J. Huazhong Agric. Univ. 1997, 16, 399–407. [Google Scholar]
  18. Kolkovski, S. Microdiets as alternatives to live feeds for fish larvae in aquaculture: Improving the efficiency of feed particle utilization. In Advances in Aquaculture Hatchery Technology; Allan, G., Burnell, G., Eds.; Woodhead Publishing: Sawston, UK, 2013; pp. 203–222. [Google Scholar] [CrossRef]
  19. Guerrero-Tortolero, D.A.; Vázquez-Islas, G.; Campos-Ramos, R. A transcriptome insight during early fish larval development followed by starvation in Seriola rivoliana. Mar. Biotechnol. 2021, 23, 749–765. [Google Scholar] [CrossRef]
  20. Gao, J.; Xu, G.; Xu, P. Comparative transcriptome analysis reveals metabolism transformation in Coilia nasus larvae during the mouth-open period. Comp. Biochem. Physiol. D Genom. Proteom. 2020, 36, 100712. [Google Scholar] [CrossRef]
  21. Chen, S.; Zhou, Y.; Chen, Y.; Gu, J. fastp: An ultra-fast all-in-one FASTQ preprocessor. Bioinformatics 2018, 34, i884–i890. [Google Scholar] [CrossRef]
  22. He, S.; Li, L.; Lv, L.-Y.; Cai, W.-J.; Dou, Y.-Q.; Li, J.; Tang, S.-L.; Chen, X.; Zhang, Z.; Xu, J.; et al. Mandarin fish (Sinipercidae) genomes provide insights into innate predatory feeding. Commun. Biol. 2020, 3, 361. [Google Scholar] [CrossRef] [PubMed]
  23. Kim, D.; Paggi, J.M.; Park, C.; Bennett, C.; Salzberg, S.L. Graph-based genome alignment and genotyping with HISAT2 and HISAT-genotype. Nat. Biotechnol. 2019, 37, 907–915. [Google Scholar] [CrossRef] [PubMed]
  24. Pertea, M.; Pertea, G.M.; Antonescu, C.M.; Chang, T.-C.; Mendell, J.T.; Salzberg, S.L. StringTie enables improved reconstruction of a transcriptome from RNA-seq reads. Nat. Biotechnol. 2015, 33, 290–295. [Google Scholar] [CrossRef] [Green Version]
  25. Li, B.; Dewey, C.N. RSEM: Accurate transcript quantification from RNA-Seq data with or without a reference genome. BMC Bioinformatics 2011, 12, 323. [Google Scholar] [CrossRef] [Green Version]
  26. Love, M.I.; Huber, W.; Anders, S. Moderated estimation of fold change and dispersion for RNA-seq data with DESeq2. Genome Biol. 2014, 15, 550. [Google Scholar] [CrossRef] [Green Version]
  27. Klopfenstein, D.V.; Zhang, L.; Pedersen, B.S.; Ramírez, F.; Vesztrocy, A.W.; Naldi, A.; Mungall, C.J.; Yunes, J.M.; Botvinnik, O.; Weigel, M.; et al. GOATOOLS: A Python library for Gene Ontology analyses. Sci. Rep. 2018, 8, 10872. [Google Scholar] [CrossRef] [Green Version]
  28. Farnsworth, D.R.; Posner, M.; Miller, A.C. Single cell transcriptomics of the developing zebrafish lens and identification of putative controllers of lens development. Exp. Eye Res. 2021, 206, 108535. [Google Scholar] [CrossRef]
  29. Ogawa, Y.; Corbo, J.C. Partitioning of gene expression among zebrafish photoreceptor subtypes. Sci. Rep. 2021, 11, 17340. [Google Scholar] [CrossRef]
  30. Zele, A.J.; Feigl, B.; Adhikari, P.; Maynard, M.L.; Cao, D. Melanopsin photoreception contributes to human visual detection, temporal and colour processing. Sci. Rep. 2018, 8, 3842. [Google Scholar] [CrossRef] [Green Version]
  31. Ota, W.; Nakane, Y.; Hattar, S.; Yoshimura, T. Impaired circadian photoentrainment in Opn5-null mice. iScience 2018, 6, 299–305. [Google Scholar] [CrossRef] [PubMed]
  32. Tang, S.-L.; Liang, X.-F.; Li, L.; Wu, J.; Lu, K. Genome-wide identification and expression patterns of opsin genes during larval development in Chinese perch (Siniperca chuatsi). Gene 2022, 825, 146434. [Google Scholar] [CrossRef]
  33. Brzezinski, J.A.; Reh, T.A. Photoreceptor cell fate specification in vertebrates. Development 2015, 142, 3263–3273. [Google Scholar] [CrossRef] [PubMed] [Green Version]
  34. Viets, K.; Eldred, K.C.; Johnston, R.J. Mechanisms of photoreceptor patterning in vertebrates and invertebrates. Trends Genet. 2016, 32, 638–659. [Google Scholar] [CrossRef] [PubMed] [Green Version]
  35. Diacou, R.; Nandigrami, P.; Fiser, A.; Liu, W.; Ashery-Padan, R.; Cvekl, A. Cell fate decisions, transcription factors and signaling during early retinal development. Prog. Retin. Eye Res. 2022, 91, 101093. [Google Scholar] [CrossRef]
  36. Nishida, A.; Furukawa, A.; Koike, C.; Tano, Y.; Aizawa, S.; Matsuo, I.; Furukawa, T. Otx2 homeobox gene controls retinal photoreceptor cell fate and pineal gland development. Nat. Neurosci. 2003, 6, 1255–1263. [Google Scholar] [CrossRef]
  37. Goodson, N.B.; Kaufman, M.A.; Park, K.U.; Brzezinski, J.A., IV. Simultaneous deletion of Prdm1 and Vsx2 enhancers in the retina alters photoreceptor and bipolar cell fate specification, yet differs from deleting both genes. Development 2020, 147, dev190272. [Google Scholar] [CrossRef]
  38. Brzezinski, J.A., IV; Lamba, D.A.; Reh, T.A. Blimp1 controls photoreceptor versus bipolar cell fate choice during retinal development. Development 2010, 137, 619–629. [Google Scholar] [CrossRef] [PubMed] [Green Version]
  39. Marquardt, T.; Ashery-Padan, R.; Andrejewski, N.; Scardigli, R.; Guillemot, F.; Gruss, P. Pax6 is required for the multipotent state of retinal progenitor cells. Cell 2001, 105, 43–55. [Google Scholar] [CrossRef] [Green Version]
  40. Freund, C.L.; Gregory-Evans, C.Y.; Furukawa, T.; Papaioannou, M.; Looser, J.; Ploder, L.; Bellingham, J.; Ng, D.; Herbrick, J.-A.S.; Duncan, A.; et al. Cone-rod dystrophy due to mutations in a novel photoreceptor-specific homeobox gene (CRX) essential for maintenance of the photoreceptor. Cell 1997, 91, 543–553. [Google Scholar] [CrossRef] [PubMed] [Green Version]
  41. Mears, A.J.; Kondo, M.; Swain, P.K.; Takada, Y.; Bush, R.A.; Saunders, T.L.; Sieving, P.A.; Swaroop, A. Nrl is required for rod photoreceptor development. Nat. Genet. 2001, 29, 447–452. [Google Scholar] [CrossRef] [PubMed]
  42. Cheng, H.; Khanna, H.; Oh, E.C.T.; Hicks, D.; Mitton, K.P.; Swaroop, A. Photoreceptor-specific nuclear receptor NR2E3 functions as a transcriptional activator in rod photoreceptors. Hum. Mol. Genet. 2004, 13, 1563–1575. [Google Scholar] [CrossRef]
  43. Ng, L.; Hurley, J.B.; Dierks, B.; Srinivas, M.; Saltó, C.; Vennström, B.; Reh, T.A.; Forrest, D. A thyroid hormone receptor that is required for the development of green cone photoreceptors. Nat. Genet. 2001, 27, 94–98. [Google Scholar] [CrossRef]
  44. Nelson, S.M.; Park, L.; Stenkamp, D.L. Retinal homeobox 1 is required for retinal neurogenesis and photoreceptor differentiation in embryonic zebrafish. Dev. Biol. 2009, 328, 24–39. [Google Scholar] [CrossRef] [Green Version]
  45. Duval, M.G.; Oel, A.P.; Allison, W.T. gdf6a is required for cone photoreceptor subtype differentiation and for the actions of tbx2b in determining rod versus cone photoreceptor fate. PLoS ONE 2014, 9, e92991. [Google Scholar] [CrossRef] [Green Version]
  46. Alvarez-Delfin, K.; Morris, A.C.; Snelson, C.D.; Gamse, J.T.; Gupta, T.; Marlow, F.L.; Mullins, M.C.; Burgess, H.A.; Granato, M.; Fadool, J.M. Tbx2b is required for ultraviolet photoreceptor cell specification during zebrafish retinal development. Proc. Natl. Acad. Sci. USA 2009, 106, 2023–2028. [Google Scholar] [CrossRef] [PubMed] [Green Version]
  47. Hennig, A.K.; Peng, G.-H.; Chen, S. Regulation of photoreceptor gene expression by Crx-associated transcription factor network. Brain Res. 2008, 1192, 114–133. [Google Scholar] [CrossRef] [PubMed] [Green Version]
  48. Chen, J.; Rattner, A.; Nathans, J. The rod photoreceptor-specific nuclear receptor Nr2e3 represses transcription of multiple cone-specific genes. J. Neurosci. 2005, 25, 118–129. [Google Scholar] [CrossRef] [Green Version]
  49. Haider, N.B.; Jacobson, S.G.; Cideciyan, A.V.; Swiderski, R.; Streb, L.M.; Searby, C.; Beck, G.; Hockey, R.; Hanna, D.B.; Gorman, S.; et al. Mutation of a nuclear receptor gene, NR2E3, causes enhanced S cone syndrome, a disorder of retinal cell fate. Nat. Genet. 2000, 24, 127–131. [Google Scholar] [CrossRef] [PubMed]
  50. Xie, S.; Han, S.; Qu, Z.; Liu, F.; Li, J.; Yu, S.; Reilly, J.; Tu, J.; Liu, X.; Lu, Z.; et al. Knockout of Nr2e3 prevents rod photoreceptor differentiation and leads to selective L-/M-cone photoreceptor degeneration in zebrafish. Biochim. Biophys. Acta Mol. Basis Dis. 2019, 1865, 1273–1283. [Google Scholar] [CrossRef] [Green Version]
  51. Volkov, L.I.; Kim-Han, J.S.; Saunders, L.M.; Poria, D.; Hughes, A.E.O.; Kefalov, V.J.; Parichy, D.M.; Corbo, J.C. Thyroid hormone receptors mediate two distinct mechanisms of long-wavelength vision. Proc. Natl. Acad. Sci. USA 2020, 117, 15262–15269. [Google Scholar] [CrossRef]
  52. Deveau, C.; Jiao, X.; Suzuki, S.C.; Krishnakumar, A.; Yoshimatsu, T.; Hejtmancik, J.F.; Nelson, R.F. Thyroid hormone receptor beta mutations alter photoreceptor development and function in Danio rerio (zebrafish). PLoS Genet. 2020, 16, e1008869. [Google Scholar] [CrossRef] [PubMed]
  53. Angueyra, J.; Kunze, V.P.; Patak, L.K.; Kim, H.; Kindt, K.S.; Li, W. Identification of transcription factors involved in the specification of photoreceptor subtypes. bioRxiv 2022. [Google Scholar] [CrossRef]
  54. Shen, Y.; Li, H.; Zhao, J.; Tang, S.; Zhao, Y.; Bi, Y.; Chen, X. The digestive system of mandarin fish (Siniperca chuatsi) can adapt to domestication by feeding with artificial diet. Aquaculture 2021, 538, 736546. [Google Scholar] [CrossRef]
  55. Palińska-Żarska, K.; Woźny, M.; Kamaszewski, M.; Szudrowicz, H.; Brzuzan, P.; Żarski, D. Domestication process modifies digestion ability in larvae of Eurasian perch (Perca fluviatilis), a freshwater Teleostei. Sci. Rep. 2020, 10, 2211. [Google Scholar] [CrossRef] [PubMed] [Green Version]
  56. Cuvier-Péres, A.; Kestemont, P. Development of some digestive enzymes in Eurasian perch larvae Perca fluviatilis. Fish Physiol. Biochem. 2001, 24, 279–285. [Google Scholar] [CrossRef]
  57. Wang, Y.-Y.; Liang, X.-F.; He, S.; Tang, S.-L.; Peng, D. The potential use of Artemia for larval rearing of mandarin fish (Siniperca chuatsi). Aquac. Rep. 2022, 25, 101216. [Google Scholar] [CrossRef]
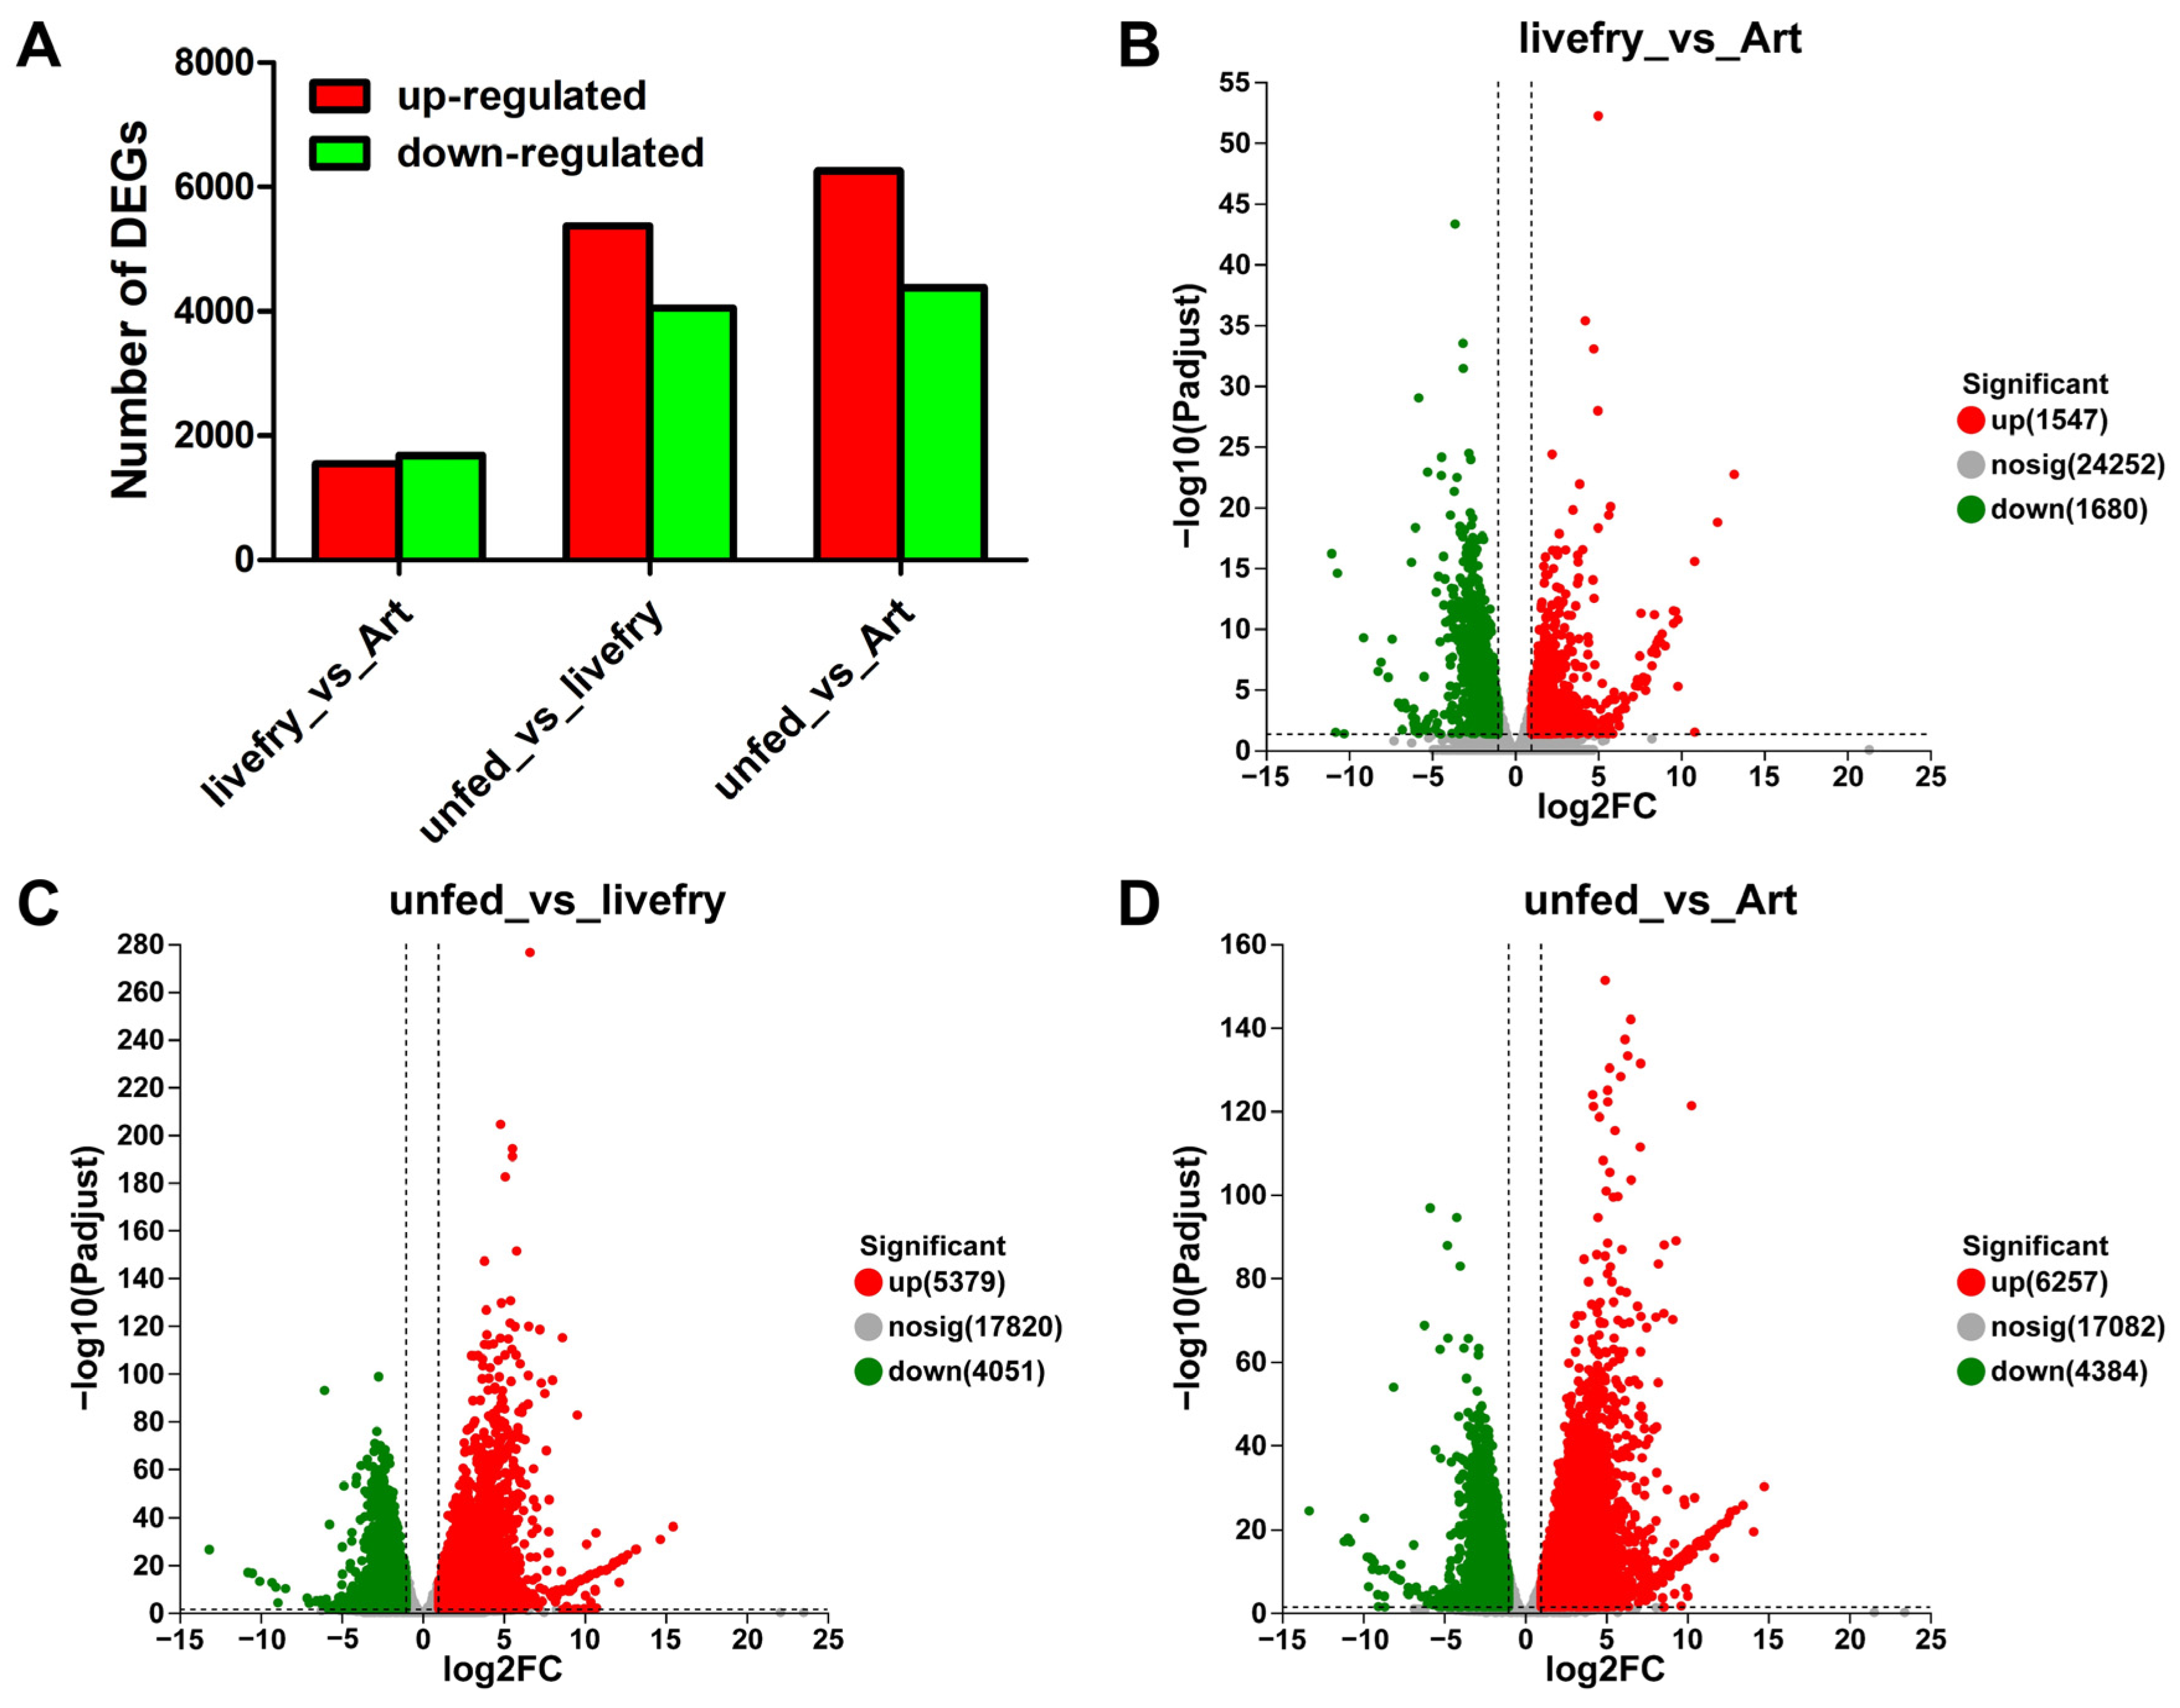
Figure 1. The statistics of differentially expressed genes (DEGs). (A). The number of DEGs; (B). Volcano plot of DEGs between the mandarin fish larvae fed with live prey fish and brine shrimp; (C). Volcano plot of DEGs between the mandarin fish larvae unfed and fed with live prey fish; (D). Volcano plot of DEGs between the mandarin fish larvae unfed and fed with brine shrimp.
Fishes 08 00017 g001
Figure 2. Functional enrichment analyses of DEGs between the mandarin fish larvae fed with live prey fish and brine shrimp. (A). Top 20 GO enrichment terms; (B). Top 20 KEGG enrichment pathways.
Fishes 08 00017 g002
Figure 3. Functional enrichment analyses of DEGs between the mandarin fish larvae unfed and fed with live prey fish. (A). Top 20 GO enrichment terms; (B). Top 20 KEGG enrichment pathways.
Fishes 08 00017 g003
Figure 4. Functional enrichment analyses of DEGs between the mandarin fish larvae unfed and fed with brine shrimp. (A). Top 20 GO enrichment terms; (B). Top 20 KEGG enrichment pathways.
Fishes 08 00017 g004
Figure 5. Experimental validation of DEGs by RT-qPCR. (A). PR domain zinc finger protein 1a (prdm1a); (B). thyroid hormone receptor beta (thrb); (C). pancreatic trypsin (try); (D). pancreatic alpha-amylase-like (amy2a). Data are represented as mean ± S.E.M. (n = 6). Data with different letters above the bars indicated significant differences (p < 0.05).
Fishes 08 00017 g005
Table 1. Primers used for RT-qPCR.
PrimersSequence 5′–3′Amplification Efficiency (%)Annealing Temp (°C)
sc-rpl13a-FTATCCCCCCACCCTATGACA100.659
sc-rpl13a-RACGCCCAAGGAGAGCGAACT
sc-prdm1a-FCTGACGAAACACTGGAGAAAGA93.755
sc-prdm1a-RGTCCTAGGTACGCTGGTTAAAG
sc-thrb-FCAAGGATGAGCTCTGTGTAGTG91.055
sc-thrb-RGCGTAGGTTGGGTTGAGATT
sc-try-FAGTAGGTGCAGAACACAATCA93.855
sc-try-RACTCGTAGCCTCCAACAATC
sc-amy2a-FTGCCTTTGGACGTGGTAATC93.055
sc-amy2a-RGCACCTGTTTCCTTCCTTCT
Table 2. Representative DEGs between the mandarin fish larvae fed with live prey fish and brine shrimp.
Gene IDDescriptionGene SymbolLog2FCPadjustRegulation
lens development
SC7-LG04_05276poly(U)-specific endoribonucleaseendou4.164.81 × 10−3up
phototransduction
SC7-LG08_10491visinin-likercvrn31.762.80 × 10−4up
transcription factors
SC7-LG01_00775general transcription factor IIF subunit 1gtf2f1−1.052.39 × 10−4down
SC7-LG04_05393period circadian protein homolog 3per31.401.55 × 10−4up
SC7-LG08_10567transcription elongation factor B polypeptide 3eloa/tceb31.776.36 × 10−3up
SC7-LG08_10670PR domain zinc finger protein 1aprdm1a1.101.94 × 10−3up
SC7-LG08_11305thyroid hormone receptor betathrb1.553.77 × 10−2up
SC7-LG09_12670estrogen-related receptor gammaesrrg1.161.96 × 10−3up
SC7-LG13_17911myocyte enhancer factor 2camef2ca−1.411.77 × 10−10down
SC7-LG16_20751nuclear receptor subfamily 2, group E, member 3nr2e3−1.107.21 × 10−3down
SC7-LG18_22664homeobox and leucine zipper protein ahomeza1.154.80 × 10−3up
SC7-LG21_27073early growth response protein 1egr11.036.87 × 10−3up
SC7-LG22_27752cone-rod homeoboxcrx−1.026.93 × 10−3down
opsins
SC7-LG07_09212melanopsin Aopn4xb1.201.33 × 10−2up
SC7-LG10_13207opsin 5opn52.894.87 × 10−2up
Table 3. Representative DEGs between the mandarin fish larvae unfed and fed with live prey fish.
Gene IDDescriptionGene SymbolLog2FCPadjustRegulation
protein digestion
SC7-LG04_05415anionic trypsin-1-likeprss13.951.05 × 10−13up
SC7-LG05_06178carboxypeptidase A1cpa13.722.75 × 10−29up
SC7-LG05_06203carboxypeptidase A2-likecpa24.663.03 × 10−6up
SC7-LG07_09459chymotrypsin-like elastase family member 2Acela2a3.148.44 × 10−6up
SC7-LG08_10790trypsin-3-liketry4.662.60 × 10−8up
SC7-LG09_12234neprilysinmme1.201.70 × 10−11up
SC7-LG10_13776chymotrypsin-like elastase family member 2A cela2a2.471.88 × 10−7up
SC7-LG12_16603meprin A subunit alpha-likemep1a.13.736.95 × 10−104up
SC7-LG12_16604meprin A subunit alpha-likemep1a.23.411.38 × 10−34up
SC7-LG14_18622carboxypeptidase B2cpb25.126.99 × 10−17up
SC7-LG14_18753dipeptidyl peptidase 4-likedpp43.081.90 × 10−21up
SC7-LG16_20581angiotensin-converting enzyme 2ace23.244.90 × 10−12up
SC7-LG16_20935chymotrypsin A-likectra5.761.31 × 10−39up
SC7-LG16_20936chymotrypsin Bctrb5.236.54 × 10−28up
SC7-LG17_21412trypsinogen-like protein 3trp34.251.34 × 10−41up
SC7-LG17_21428trypsin-likeprss59.15.172.94 × 10−47up
SC7-LG17_21430trypsin-1prss59.16.111.86 × 10−49up
SC7-LG17_21862chymotrypsin-like protease CTRL-1ctrl4.611.35 × 10−3up
SC7-LG17_21865chymotrypsin-like protease CTRL-1ctrl6.397.98 × 10−6up
SC7-LG17_21899pancreatic trypsintry4.651.79 × 10−39up
SC7-LG19_24660dipeptidyl peptidase 4-likefap1.697.34 × 10−5up
SC7-LG20_25447chymotrypsin-like elastase family member 3Bcela3b4.627.14 × 10−12up
SC7-LG21_26716xaa-Pro aminopeptidase 2xpnpep21.863.14 × 10−13up
SC7-LG24_30459carboxypeptidase Bcpb11.301.02 × 10−3up
fat digestion
SC7-LG03_04160group XIIB secretory phospholipase A2-like proteinpla2g12b4.304.77 × 10−52up
SC7-LG13_17222bile salt-activated lipase-likecel−1.571.86 × 10−3down
SC7-LG13_17255phospholipase A2-likepla2g1b2.991.46 × 10−12up
SC7-LG13_17854group 3 secretory phospholipase A2-likepla2g31.431.30 × 10−3up
SC7-UN_52_31480bile salt-activated lipase-likecel1.623.33 × 10−2up
carbohydrate digestion
SC7-LG18_23440pancreatic alpha-amylase-likeamy2a1.692.15 × 10−4up
SC7-LG19_24913lactase-phlorizin hydrolase-likelct1.999.21 × 10−5up
Table 4. Representative DEGs between the mandarin fish larvae unfed and fed with brine shrimp.
Gene IDDescriptionGene SymbolLog2FCPadjustRegulation
protein digestion
SC7-LG04_05415anionic trypsin-1-likeprss15.234.46 × 10−23up
SC7-LG05_06178carboxypeptidase A1cpa14.301.41 × 10−21up
SC7-LG05_06203carboxypeptidase A2-likecpa25.708.36 × 10−7up
SC7-LG07_09459chymotrypsin-like elastase family member 2Acela2a4.305.07 × 10−8up
SC7-LG08_10790trypsin-3-liketry5.764.92 × 10−12up
SC7-LG09_12234Neprilysinmme1.198.21 × 10−9up
SC7-LG10_13776chymotrypsin-like elastase family member 2Acela2a1.918.19 × 10−3up
SC7-LG12_16603meprin A subunit alpha-likemep1a.12.912.92 × 10−23up
SC7-LG12_16604meprin A subunit alpha-likemep1a.23.194.46 × 10−29up
SC7-LG14_18622carboxypeptidase B2cpb24.128.56 × 10−12up
SC7-LG14_18753dipeptidyl peptidase 4-likedpp42.448.45 × 10−10up
SC7-LG16_20581angiotensin-converting enzyme 2ace22.871.54 × 10−7up
SC7-LG16_20935chymotrypsin A-likectra6.161.80 × 10−26up
SC7-LG16_20936chymotrypsin Bctrb5.604.95 × 10−22up
SC7-LG17_21412trypsinogen-like protein 3trp34.487.89 × 10−60up
SC7-LG17_21428trypsin-likeprss59.15.972.44 × 10−27up
SC7-LG17_21430trypsin-1prss59.16.878.66 × 10−31up
SC7-LG17_21862chymotrypsin-like protease CTRL-1ctrl5.455.81 × 10−5up
SC7-LG17_21865chymotrypsin-like protease CTRL-1ctrl7.193.37 × 10−7up
SC7-LG17_21899pancreatic trypsintry4.901.30 × 10−19up
SC7-LG20_25299meprin A subunit beta-likemep1b−1.873.39 × 10−3down
SC7-LG20_25447chymotrypsin-like elastase family member 3Bcela3b3.943.14 × 10−7up
SC7-LG21_26716xaa-Pro aminopeptidase 2xpnpep21.839.35 × 10−16up
SC7-LG23_29643elastase-1-likezgc:1122852.354.83 × 10−10up
SC7-LG24_30459carboxypeptidase Bcpb11.501.73 × 10−3up
fat digestion
SC7-LG03_04160group XIIB secretory phospholipase A2-like proteinpla2g12b3.941.15 × 10−24up
SC7-LG13_17222bile salt-activated lipase-likecel−2.154.31 × 10−7down
SC7-LG13_17223bile salt-activated lipase-likecel1.713.40 × 10−2up
SC7-LG13_17255phospholipase A2-likepla2g1b3.192.44 × 10−6up
SC7-UN_52_31480bile salt-activated lipase-likecel1.673.53 × 10−2up
carbohydrate digestion
SC7-LG18_23440pancreatic alpha-amylase-likeamy2a2.883.21 × 10−7up
Disclaimer/Publisher’s Note: The statements, opinions and data contained in all publications are solely those of the individual author(s) and contributor(s) and not of MDPI and/or the editor(s). MDPI and/or the editor(s) disclaim responsibility for any injury to people or property resulting from any ideas, methods, instructions or products referred to in the content.