Article

Effects of Different Oxytocin and Temperature on Reproductive Activity in Nile tilapia (Oreochromis niloticus): Based on Sex Steroid Hormone and GtHR Gene Expression

Key Laboratory of Freshwater Fisheries and Germplasm Resources Utilization, Ministry of Agriculture and Rural Affairs, Freshwater Fisheries Research Center, Chinese Academy of Fishery Sciences, Wuxi 214081, China
*
Author to whom correspondence should be addressed.
Fishes 2022, 7(6), 316; https://doi.org/10.3390/fishes7060316
Submission received: 30 September 2022 / Revised: 26 October 2022 / Accepted: 28 October 2022 / Published: 31 October 2022

Abstract

:
Luteinizing hormone receptor (LHR) and follicle-stimulating hormone receptor (FSHR) belong to the gonadotropic hormone receptors (GtHR), which are highly expressed in fish gonads and participate in the regulation of fish reproductive activities. Fish gonadal development and gamete maturation are not only regulated by their BPG axis but also affected by natural environmental factors (such as temperature, salinity, pH, nutrients, light, etc.). Nile tilapia (Oreochromis niloticus) is a farmed fish with a short reproductive cycle, fast growth, and high economic value. To study the relationship between gonadotropic hormone receptors (GtHR) and the reproductive activity of Nile tilapia, different oxytocin injection experiments and different temperature treatment experiments were set up, and the expression changes of the GtHR gene in the gonads and the concentration changes of the estradiol (E2) in the female serum and testosterone (T) in the male serum were determined employing a quantitative RT-PCR assay and enzyme-linked immunosorbent assay (ELISA), respectively. After the injection of oxytocin, with the change of E2 in females and T in males, the FSHR showed an expression pattern of first increase, then decrease, and the LHR showed an expression pattern of first increase, then decrease, and finally increase in the gonads, and the expression level of FSHR and LHR in the injection group was significantly higher than that in the control group at multiple time points; in addition, the expression level of FSHR and LHR in the oxytocin-combination injection group was higher than that in the single injection group. During 28 days of treatment at different temperatures, the sex steroid hormones and GtHR genes also showed regular changes, and the relationship between each group was 28 °C > 32 °C > 24 °C at most time points. According to the research results, it is speculated that FSHR and LHR play an important role in the development of Nile tilapia gonads and participate in the reproductive activities of Nile tilapia. By comparing and analyzing the changes in the sex steroid hormones and GtHR genes in each experimental group, it is speculated that different oxytocin injections could affect the expression of FSHR and LHR genes in Nile tilapia, and the combined effect of oxytocin was better than single oxytocin; the optimum temperature for the reproduction of Nile tilapia is between 28–32 °C. This study provides a theoretical basis for further elucidating the physiological functions and molecular mechanisms of FSHR and LHR and also provides a reference for the research of reproductive regulation in Nile tilapia.

1. Introduction

The reproductive activities of fish, such as gonad development and gamete maturation, are regulated by the brain–pituitary–gonad (BPG) axis. Gonadotropic hormone (GtH) produced in the pituitary reaches the gonads and binds to the gonadotropic hormone receptor (GtHR) in the gonads to initiate downstream signaling to produce sex steroid hormones, such as progesterone, testosterone, and estradiol (17α-Estradiol, E2), etc., thereby promoting gonadal development [1,2]. The gonadotropic hormone receptors (GtHR) in the gonads include the luteinizing hormone receptor (LHR) and the follicle-stimulating hormone receptor (FSHR), both of which are G protein-coupled receptors expressed in fish gonads and participate in regulating the reproductive activities of fish [3,4,5]. It has been reported that FSHR is highly expressed in the early and middle stages of oocyte growth and yolk formation in female ovaries, while LHR is highly expressed during the stage of oocyte maturation to ovulation [6]. The expression of FSHR in the zebrafish (Danio rerio) ovary gradually increased as the oocyte entered the yolk-formation stage. When the oocyte matured, the expression of FSHR decreased, and the expression of LHR reached the maximum at this time [7]. A similar expression change pattern of FSHR and LHR during ovarian development was found in Hippoglossus hippoglossus [8]. However, some studies have shown that FSHR and LHR are highly expressed during oocyte maturation and ovulation. In Oncorhynchus mykiss, the expression of FSHR and LHR gradually increases with the development of the ovary [9]. In the male testis, FSHR also has different expression patterns. In Atlantic salmon (Salmo salar), the expression of FSHR gradually decreased with the development of the testis [10]; but in the testis of Oncorhynchus mykiss, the expression of FSHR gradually increased with the development of the testis [11]. The LHR expression level is usually high in the stage of sperm maturation and ejaculation [3,5,7,12]. In zebrafish (Danio rerio), FSH and LH deficiencies have different effects on gonad development and between males and females [2]. In the European hake (Merluccius merluccius) testis, the highest level of LHR was detected during spermiation, while the level of FSHR was constant [5]. In addition, in medaka, a deficiency of either LHR or FSHR resulted in abnormal or stalled ovarian development but had little effect on testis development and spermatogenesis [13]. These studies reported that the regulation of reproduction by GtHR differs between different fish and between males and females.
Oxytocin functions similarly to reproductive hormones in the BPG axis. Domperidone (DOM), as a new type of oxytocin, can inhibit the formation of dopamine (DA), thereby promoting the release of gonadotropin-releasing hormone (GnRH) in the brain, and GnRH can act on the pituitary, thereby promoting or inhibiting the release of GtH from the pituitary gland, which binds to the GtHR of the gonad and participates in the regulation of fish reproduction. Luteinizing hormone-releasing hormone A2 (LRH-A2) can stimulate the pituitary to synthesize and release GtH, and the GtH combines with GtHR in the gonad to promote gonadal development [14].
Fish gonadal development and gamete maturation are not only regulated by their BPG axis but also affected by natural environmental factors (such as temperature, salinity, pH, nutrients, light, etc.), of which temperature is one of the most important [15,16,17]. Previous studies have found that temperature directly or indirectly affects the synthesis and release of GtH in the BPG axis of fish; in addition, under suitable temperature conditions, the concentration of sex steroid hormones (E2, P, T) increases with temperature [18]. A too-high or too-low temperature is not conducive to the development of gonads [17]. Solea senegalensis females exposed to high temperatures for a long time have lower serum gonadal steroid hormone concentrations and less mature vitellogenin in oocytes. The gonad development of Epinephelus akaara, kept in an environment below 18 °C or above 30 °C, slows down or even stops [18,19].
As a freshwater fish recommended by the Food and Agriculture Organization of the United Nations (FAO), Tilapia has the characteristics of fast growth, early sexual maturity (4 to 5 months to sexual maturity), and a short reproductive cycle (reproducing once in 25 to 35 days during the breeding season) [20,21,22]. Tilapia is easy to reproduce under natural conditions, but artificial reproduction is inefficient, and large-scale artificial reproduction is even more difficult. Appropriate environmental conditions can promote gonadal development, ovulation, and spermatogenesis in Tilapia, but there are few reports on the combined study of exogenous hormones, temperature, and Nile tilapia gonadotropic hormone receptor genes. In the current study, taking Nile tilapia as the research object, by analyzing the expression changes after the oxytocin injection and under different temperature treatments, the association between GtHRs and the reproductive activity of Nile tilapia was investigated to further clarify the physiological functions and regulatory mechanisms of FSHR and LHR and provide basic data for the research of reproductive regulation in Nile tilapia.

2. Materials and Methods

2.1. Animal Experiments and Sampling

The present research was approved by the Animal Care and Use Committee of the Freshwater Fisheries Research Center (Wuxi, China). All the fish were reared following the Guideline for the Care and Use of Laboratory Animals in China.
The Nile tilapia (Oreochromis niloticus) used in this experiment were obtained from the Tilapia Genetics and Breeding Center of the Freshwater Fisheries Research Center, Chinese Academy of Fishery Science. A total of 200 male and female fish with good vitality were selected for the experiment, with an average weight of the female fish of 83.2 ± 7.6 g, and an average weight of the male fish of 110 ± 9.4 g. The fish were then transferred to 200-L tanks with a continuous flow of fresh water (water temperature 22 ± 0.1 °C, dissolved oxygen 7.0 ± 0.3 mg/L) for temporary acclimation. The fish were fed with a special compound feed for Nile tilapia (30% of crude protein) twice per day, once in the morning and once in the late afternoon.
For the oxytocin injection experiments, the male and female Nile tilapia were randomly divided into four groups with 25 fish in each group. Control group A was injected with normal saline; experimental group B was injected with DOM (9 mg/kg body weight); experimental group C was injected with LRH-A2 (15 μg/kg body weight); experimental group D was injected with DOM (9 mg/kg body weight) + LRH-A2 (15 μg/kg body weight). The injection dose was 200 μL per fish, and the male fish dose was halved. Samples were collected at 0, 6, 12, 24, 36, 48, and 72 h after injection. Three parallels were collected for each group. After MS-222 anesthesia treatment (200 mg/L, 10 min), about 1 mL of blood was drawn from the caudal peduncle and stored at 4 °C for about 6 h, centrifuged at 5000 r/min for 20 min at 4 °C, and the serum was collected and stored at −20 °C; the gonads were then dissected and immediately stored in liquid nitrogen until use.
For the different temperature treatment experiments, the male and female Nile tilapia were divided into three groups, with 21 fish in each group, and reared in recirculating aquaculture tanks with water temperatures of 24 °C, 28 °C, and 32 °C, respectively. Samples were collected at 0, 7, 14, 21, and 28 days of the treatment. Three parallels were collected from each group. After MS-222 anesthesia treatment, about 1 mL of blood was drawn from the caudal peduncle and stored at 4 °C, centrifuged at 5000 r/min for 20 min at 4 °C, and the serum was collected and stored at −20 °C; the gonads were then dissected and immediately stored in liquid nitrogen until use.

2.2. Total RNA Extraction and First-Strand cDNA Synthesis

Total RNA was extracted from the Nile tilapia tissues (gonads, 100 mg per sample) using TRIzol reagent (Invitrogen, Life Technologies, Carlsbad, CA, USA), according to the manufacturer’s protocol. The genomic DNA was removed by using RQ1 RNase-Free DNase (Promega, Madison, WI, USA). The RNA purity and integrity were assessed using the NANODROP 2000 spectrophotometer (Thermo Scientific, Waltham, MA, USA) and agarose gel electrophoresis, respectively. The synthesis of first-strand cDNA (total volume 20 μL) was performed using 2 μg of total RNA from the Nile tilapia tissues. The synthesis reactions were performed using an RT-PCR kit (Promega, Madison, WI, USA), according to the manufacturer’s protocol. The absence of genomic DNA contamination was confirmed using a PCR.

2.3. Determination of GtHR Genes Expression

A quantitative RT-PCR assay was implemented to detect the expression of GtHR genes. Complete coding sequences of Nile tilapia GtHRs were obtained from the NCBI Website (http://www.ncbi.nlm.nih.gov/ (accessed on 2 February 2021)); the accession numbers are MW353713 (FSHR) and MW353714 (LHR). The primers for the quantitative RT-PCR were designed using Primer Premier 5.0 software (Premier, Markham, ON, Canada; Table 1). For each pair of primers, a standard curve was created to estimate the amplification efficiencies on the basis of known cDNA quantities (four-fold serial dilutions corresponding to cDNA transcribed from 100 to 0.1 ng of total RNA). The amplification reactions for the GtHRs were performed using a 20-μL reaction volume: 1 μL of cDNA template, 0.5 μL of each specific forward and reverse primer (10 μM), and 10 μL of the THUNDERBIRD SYBR qPCR Mix (TOYOBO, Osaka, Japan). A PCR was performed in duplicate by using the ABI 7900HT Fast Real-Time PCR instrument (Applied Biosystems, Foster City, CA, USA): initial denaturation at 95 °C for 1 min, followed by 40 cycles at 95 °C for 20 s and 60 °C for 20 s.
The internal standard used to normalize the cDNA concentration was β-actin because this transcript had a constant expression over the tissues studied. For each pair of primers, a standard curve was created to estimate the amplification efficiencies based on the known cDNA quantities (four-fold serial dilutions corresponding to cDNA transcribed from 100 to 0.1 ng of total RNA). The 2−ΔΔCT method [23] was used to measure the relative mRNA expression for the GtHRs. The comparisons between the groups were determined using a one-way analysis of variance (ANOVA; SPSS statistics 17.0, IBM, Armonk, NY, USA), and the differences were statistically significant at p < 0.05.

2.4. Determination of Estradiol (E2) and Testosterone (T) Content

The E2 and T levels in the Nile tilapia tissues were assessed using the enzyme-linked immunosorbent assay (ELISA) with the Fish Estradiol (E2) ELISA Kit (MLBIO, Shanghai, China) and Fish Testosterone (T) ELISA Kit (MLBIO, Shanghai, China). The hormone concentrations were measured from homogenates made from the tissues sampled as follows. The frozen samples were homogenized in precooled phosphate-buffered saline and centrifuged at 4 °C, 5000× g for 10 min. The supernatant was collected for further use. The sample detection was carried out in accordance with the manufacturer’s protocols on the Synergy H1 Hybrid Reader (BioTek, Winooski, VT, USA). The sample extraction and detection were performed in duplicate. One-way ANOVA was used to perform comparisons between the groups, and the differences were statistically significant at p < 0.05.

3. Results

3.1. Template Preparation for Quantitative RT-PCR

Both the A260/A280 and A260/A230 values for all the RNA samples were between 2 and 2.2, and all the RNA sample concentrations were above 1000 ng/μL. The results showed the high quality of the extracted RNA.

3.2. Oxytocin Injection and Variation of Serum Steroid Hormone Level and GtHR Genes

The serum E2 of the female fish and T of the male fish in the different oxytocin injection groups showed a similar variation trend during the experiment: rising slowly at first and then decreasing. The peak values of both E2 and T appeared at 24 h after injection in both oxytocin groups, and the peak values were significantly different from those of the control group (Table 2 and Table 3; p < 0.05); then, they gradually decreased to a relatively low level at 72 h and were close to the control group levels at 0 h. From 12 h to 72 h after injection, the concentration levels of E2 and T among the three injection groups showed a relationship of D > C > B; among them, the level of E2 was significantly different between the D group and B group at 24 h, and significant differences between all three experimental injection groups appeared at 36 h (Table 2; p < 0.05).
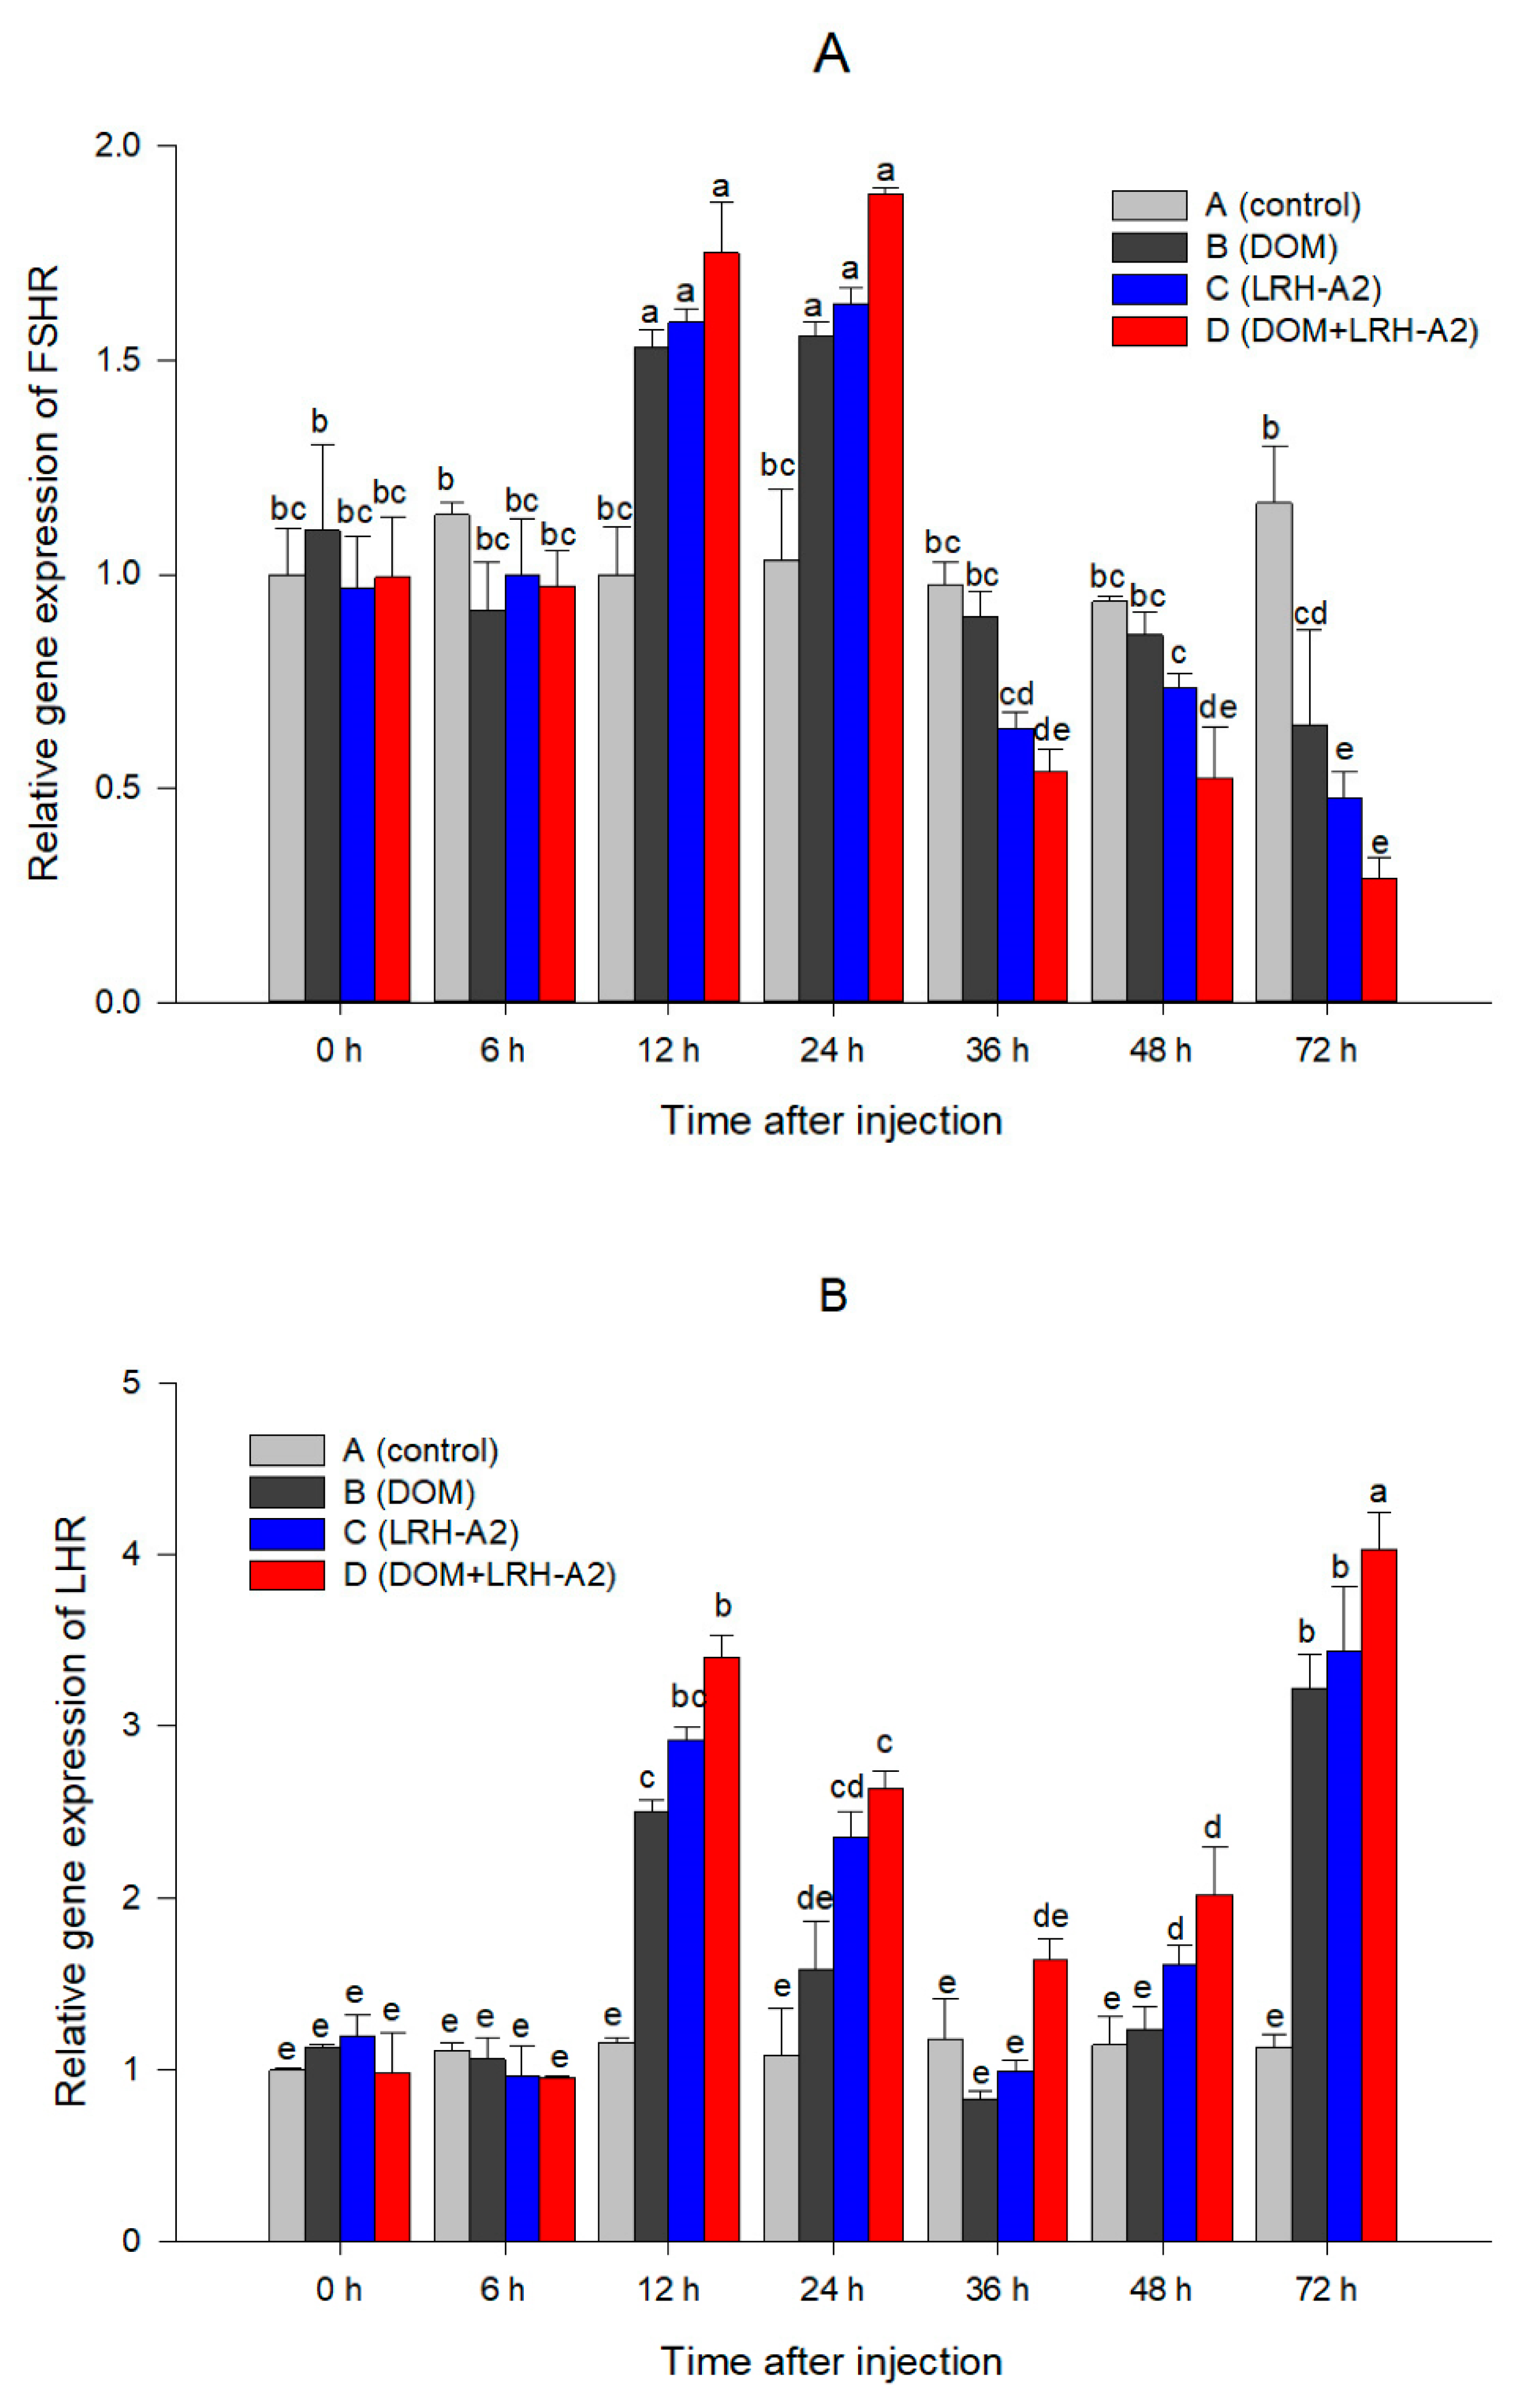
As shown in Figure 1, in the ovary of the female fish, the expression of FSHR in the three oxytocin injection groups showed a maximum value at 12 h (Figure 1A; p < 0.05); the relationship between the three injection groups was D > C > B, and they were all significantly higher than those in the control group (A) (Figure 1A; p < 0.05); the expression level stabilized at 24–36 h after injection and reached the minimum at 72 h after injection (Figure 1A). The expression level of LHR increased rapidly 12 h after injection, and the difference between the injection groups and the control group was significant (Figure 1B; p < 0.05); then, they began to down-regulate and stabilized at 24–36 h after injection, and began to increase again at 48 h; finally they reached the maximum at 72 h, and, at this time, the relationship between the expression levels of LHR in the three injection groups was D > C > B, and was significantly higher than that in the control group (A) (Figure 1B; p < 0.05).
As shown in Figure 2, in the testis of the male fish, the expression of FSHR in the three oxytocin injection groups showed a trend of first increasing and then decreasing after injection; the expression increased rapidly at 12 h after injection and reached the maximum at 24 h; the relationship between the three injection groups was D > C > B at this time point; moreover, their values were all significantly higher than those in the control group (A) (Figure 2A; p < 0.05), and then they tended to be stable at 36–48 h and reached the lowest level at 72 h (Figure 2). The expression of LHR began to increase at 12 h after injection, which was significantly different from the control group (Figure 2B; p < 0.05); then the levels began to decrease at 24–48 h and reached the maximum at 72 h after injection. At this time, the relationship between the three injection groups was D > C > B, all of which were significantly higher than the control group (A) (Figure 2B; p < 0.05).

3.3. Different Temperature Treatments and Variations of Serum Steroid Hormone Level and GtHR Genes

During 28 days of treatment at different temperatures, the serum E2 and T concentrations in each group showed a rising trend and reached the maximum after 21 days (Table 4 and Table 5; p < 0.05). The relationship among the concentrations of E2 and T in the different temperature treatment groups was 28 °C > 32 °C > 24 °C, but the differences were not statistically significant before 14 d. On the 14th day, the T concentration in the 28 °C group was significantly higher than that in the 24 °C and 32 °C groups (Table 5; p < 0.05); on the 21st day, the E2 and T contents in the 28 °C group were significantly higher than that in the 24 °C group, and the T content in the 32 °C group was significantly higher than that in the 24 °C group (p < 0.05); on the 28th day, the E2 and T in the 28 °C treatment group were significantly higher than those in the 24 °C group, and the content of E2 in the 32 °C group was significantly higher than that in the 24 °C group (Table 4; p < 0.05).
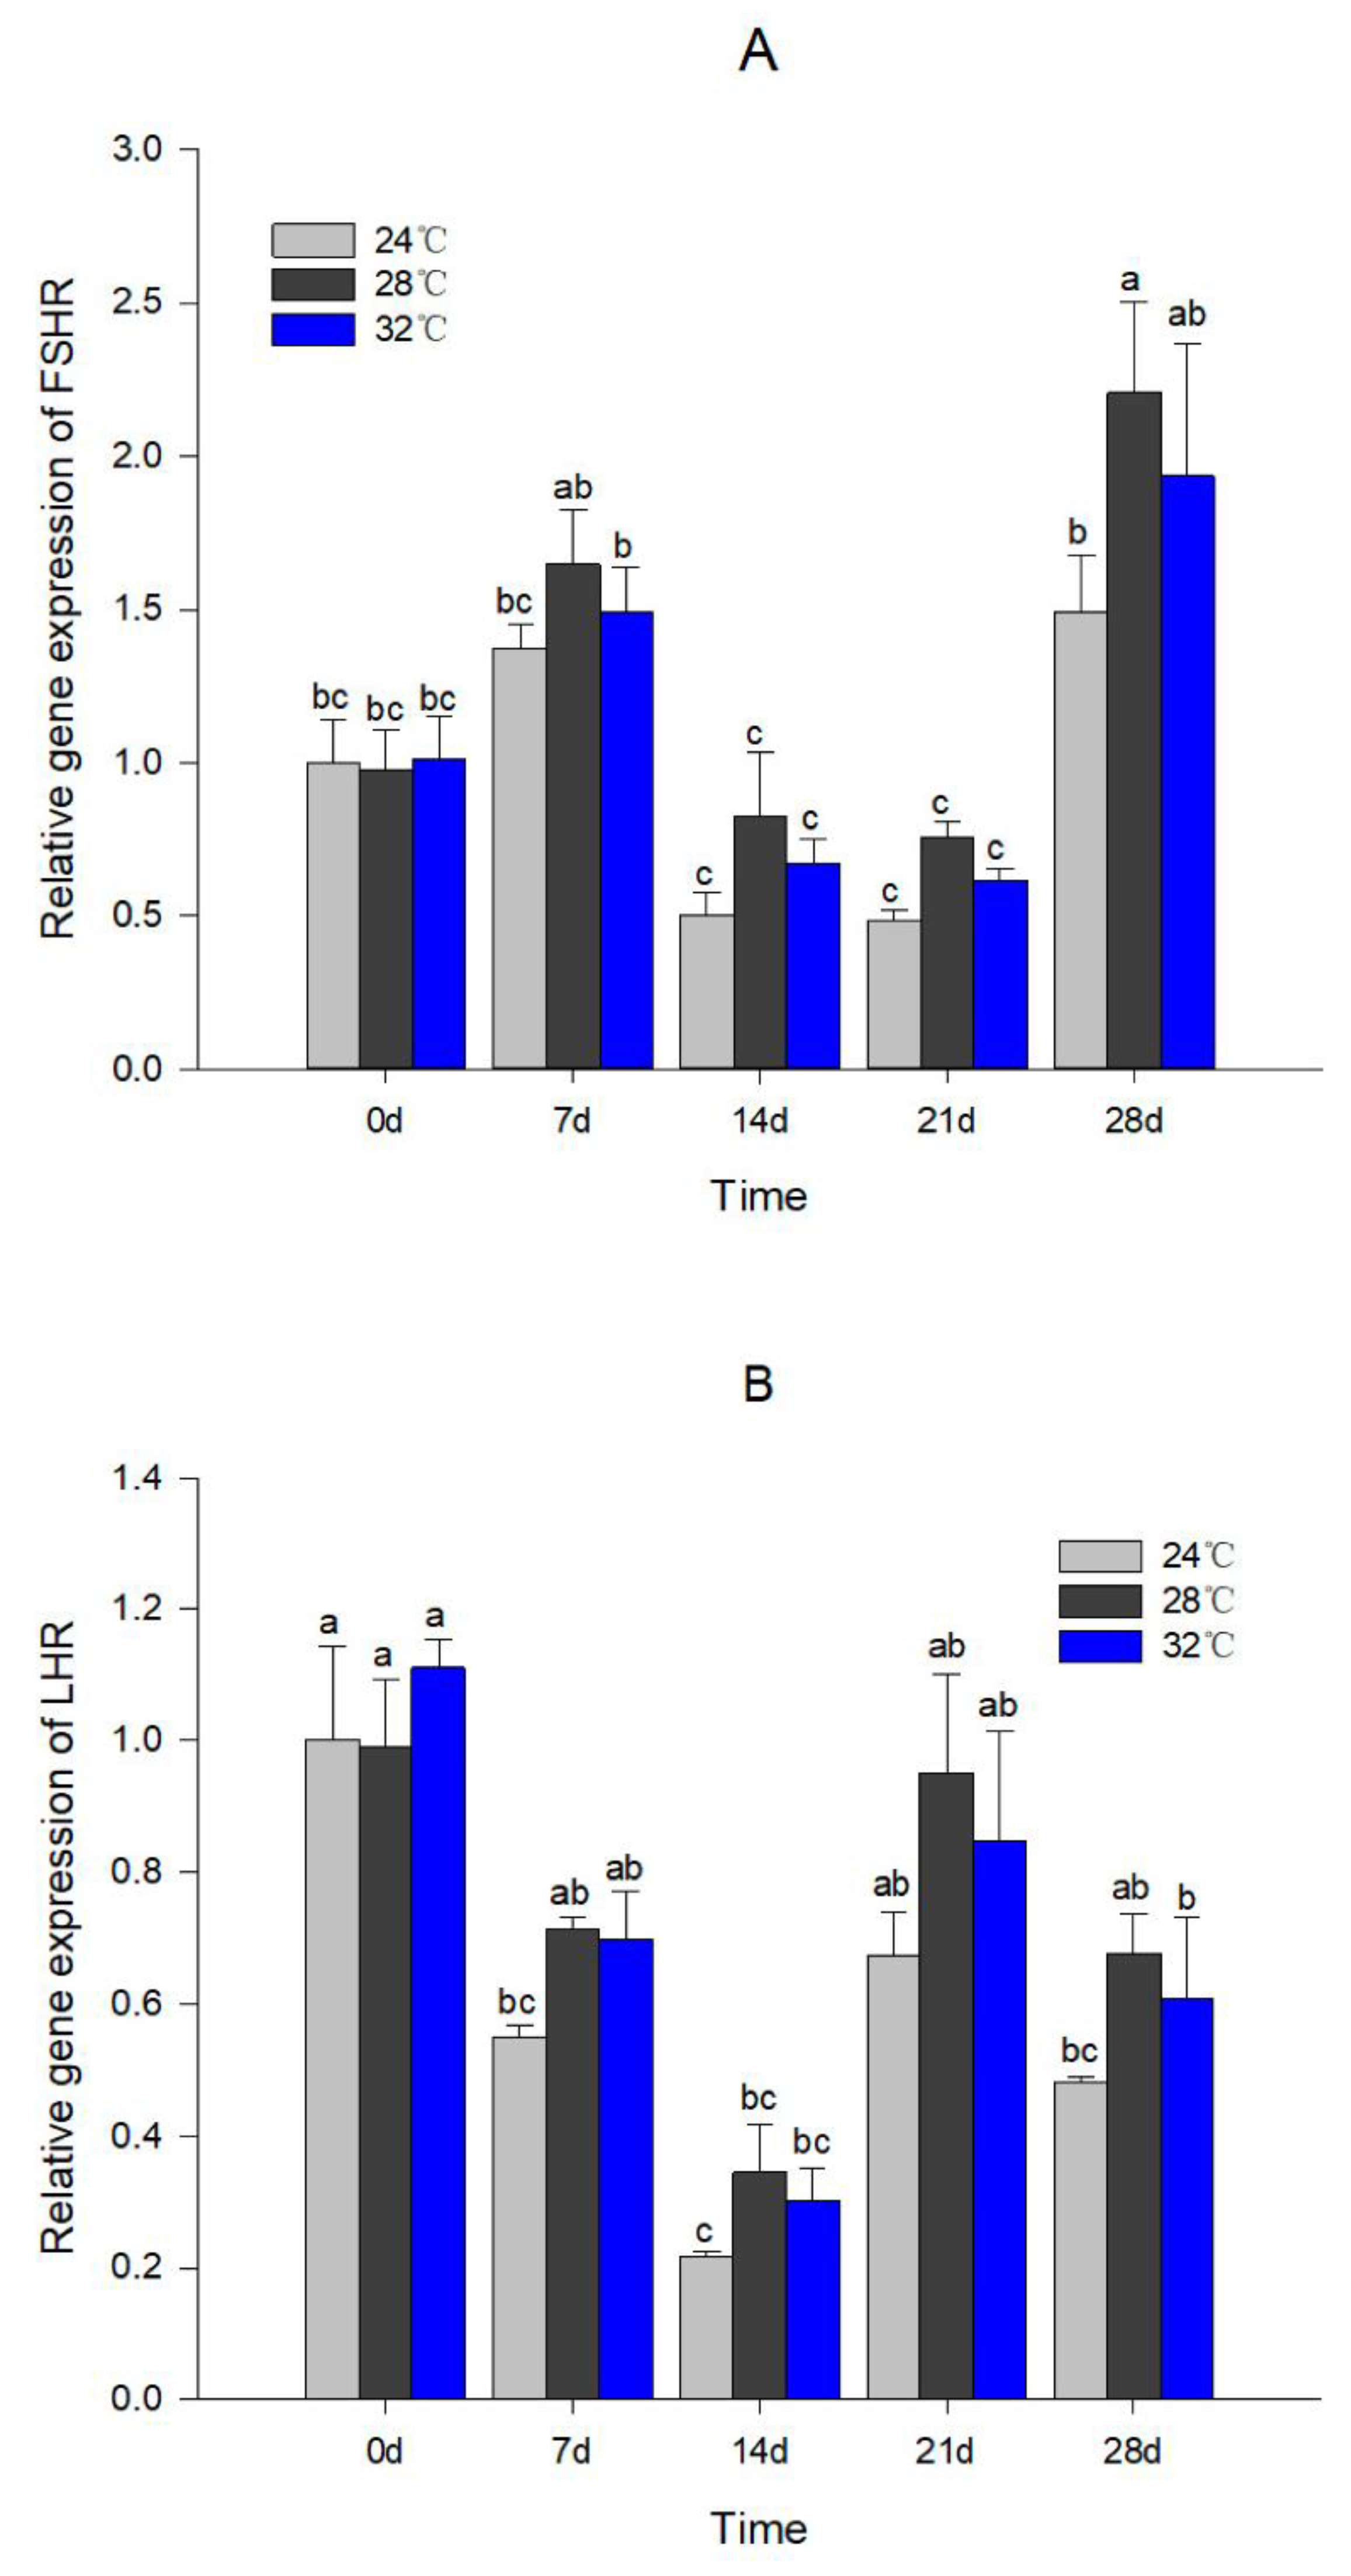
As shown in Figure 3, in the ovary of the female fish, the expression of FSHR showed a trend of slightly rising at the early stage of the experiment, then falling, and finally rising; the relationship of FSHR expression among the three temperature treatment groups was 28 °C > 32 °C > 24 °C, and the 28 °C group was significantly higher than the 24 °C group at 28 d (Figure 3A; p < 0.05). The LHR in the ovary of the female fish showed a trend of first decreasing, then increasing, and finally decreasing; the relationship between the LHR expression in each group during treatment was consistent with the FSHR, that is, 28 °C > 32 °C > 24 °C, but the difference was not statistically significant (Figure 3B).
As shown in Figure 4, in the testis of the male fish, the expression of FSHR showed a slow downward trend during the temperature treatments experiment, and the expression of FSHR of each treatment group at each stage was significantly lower than that on 0 d (Figure 4A; p < 0.05); the relationship of the testis FSHR expression between groups was 28 °C > 32 °C > 24 °C, but there was no significant difference (Figure 4A). The expression of LHR in the testis showed a trend of first decreasing and then increasing; there was no significant difference between the groups before 28 d. At 28 d, the expression of LHR in the 28 °C group was significantly higher than that in the 24 °C group (Figure 4B; p < 0.05).

4. Discussion

4.1. Variations of E2 and T Levels in Nile tilapia after Oxytocin Injection and Treatment at Different Temperatures

Studies have shown that GtH plays an important role in the regulation of fish reproduction. GtH promotes the production of hormones such as E2 and T in the early gonadal development of fish. E2 plays an important role in the yolk development stage of the ovary, and its function is to promote the development and maturation of oocytes [24,25,26,27,28]. As a kind of androgen expressed in the male reproductive organs and playing a role in sex regulation, T is mainly synthesized and secreted in the testis and is one of the important regulatory hormones in teleost sperm production [26,28]. There must be a high level of T in the final mature stage of male sperm; the concentration of T in the serum will reach a peak when male animals reach the stage of spermatogenesis or ejaculation [27,28]. In the present study, the concentrations of E2 and T in the serum of Nile tilapia showed a trend of first increasing and then decreasing after the injection of oxytocin. Under three different temperature conditions (24 °C, 28 °C, 32 °C), the concentrations of E2 and T in the serum of Nile tilapia gradually increased with the progress of the experiment. The variations of the T in male serum and the E2 in female serum and GtHRs in the gonads indicated the physiological effects of the oxytocin injection and different temperatures on Nile tilapia. This is consistent with the research results in eel (Anguilla japonica), yellow eel (Monopterus albus), and loach (Misgurnus anguillicaudayus) [29,30].
The reproductive activity of fish is regulated by the BPG axis. DOM can play a role in inhibiting dopamine (DA), thereby promoting the release of GnRH in the brain. GnRH can act on the pituitary to release GtH, and the GtH acts on the gonad to participate in the reproductive activity of fish [28,31]. LRH-A2 can cause the pituitary to synthesize and release GtH to act on the gonads and participate in fish reproduction [14]. Different oxytocins have different effects on E2 and T. In this study, the effect of the DOM+LRH-A2 combined injection is better than that of the single DOM or LRH-A2, and the effect of the LRH-A2 is slightly better than the DOM; this may be because the LRH-A2 acts more quickly from the pituitary level to the gonad level than the DOM from the brain level to the gonad level. Fish gonadal development and gamete maturation are not only regulated by their BPG axis but also affected by natural environmental factors (such as temperature, salinity, pH, nutrients, light, etc.), of which temperature is one of the most important [15,32]. In this study, the E2 and T concentrations in the three different temperature experimental groups showed a relationship of 28 °C > 32 °C > 24 °C in different periods. Within the appropriate range, the concentration of sex steroid hormones (E2, T) will increase with temperature. A too-high or too-low temperature is not conducive to the gonad development of broodstock [18], and it can be seen that Nile tilapia has the optimal sex steroid hormone level at 28 °C in this study.

4.2. Effects of Oxytocin Injection and Different Temperature Treatments on the Expression of GtHR Genes in Nile tilapia

The realization of the GtH function depends on the combination with the GtHR [13,33,34,35]. In the present study, the expression of FSHR in the ovary reached a peak at 12 h (D > C > B > A, p < 0.05, Figure 1A) and then decreased; under different temperatures, the FSHR in the ovary showed irregular fluctuations over time and reached the maximum value at 28 d; significant differences appeared between the groups simultaneously (28 °C > 32 °C > 24 °C, Figure 3A). In the Channel Catfish (Letalrus Punetaus) ovary, the expression of FSHR gradually increased and reached a peak in stages II to IV (the medium and late stages of vitellogenesis); after that, the expression level decreased significantly in the period of V~VI (ovulation period and ovarian regression absorption period) [12]; a similar trend was observed in the ovaries of Hippoglossus hippoglossus [8]. In this study, after oxytocin injection, the expression of FSHR in the testis of the male fish reached the maximum at 24 h (D > C > B > A, p < 0.05, Figure 2A) and then decreased; under different temperatures, the expression of the testis FSHR gradually decreased with time, and significant differences appeared between the groups at 28 d (28 °C > 32 °C > 24 °C, Figure 4A). In the process of the testis development of Sebastes schlegeli, the expression of FSHR increased and reached a maximum value in stages II to III (spermatocytes growing to maturity); at stage V (sperm maturity), the expression level of FSHR is extremely low [36]. FSHR also showed a similar expression trend in the rainbow trout testis [11]. Combined with the variations of E2 and T levels, it is speculated that the testis or ovary of Nile tilapia develops faster after oxytocin injection and at an appropriate temperature, which changes the expression of FSHR in the testis and ovary. FSHR is highly expressed in the prophase and metaphase of testis and ovary development [8,11,12,36]. Considering the results of this study, it is speculated that FSHR may play an important role in the middle and early stages of testis and ovary development in Nile tilapia and participate in spermatogenesis and yolk formation.
The expression of ovarian LHR reached the maximum at 72 h (D > C > B > A, p < 0.05, Figure 1B); the expression of ovarian LHR fluctuated irregularly under different temperatures but was always lower than the initial level at 0 d (Figure 3B). During the ovarian development of Pelteobagrus fulvidraco, the expression of LHR also presented a trend of first increasing and then decreasing during stages II to IV (the middle and late stages of yolk formation), reaching the maximum at stage V (ovulation) [37]. The expression of testis LHR after the oxytocin injection showed a dynamic trend consistent with that of the ovary, and also reached the maximum at 72 h after injection; significant differences appeared between the groups simultaneously (D > C > B > A, Figure 2B). This is consistent with the results of Scatophagus argus [38]. LHR is often highly expressed during gamete maturation and expulsion [3,7,39]. Considering the results of this study, it is speculated that LHR may play a role in the later stages of gonad development and may be involved in gamete maturation in Nile tilapia.

5. Conclusions

Changes in the GtHR gene mRNA and sex steroid hormones abundance were detected and analyzed under different oxytocin injections and different temperature treatments in this study. We found that different oxytocin injections and different temperature treatments could affect the expression of FSHR and LHR and the levels of sex steroid hormones in Nile tilapia. Combining the results of the current study with previous studies, it is speculated that FSHR and LHR play important but different roles in the development of Nile tilapia gonads and participate in the reproductive activities of Nile tilapia. By comparing and analyzing the changes in sex steroid hormones and the GtHR genes in each experimental group, it was found that the effect of two oxytocin combination injections was better than that of a single oxytocin injection, and the optimum temperature for Nile tilapia reproduction was between 28–32 °C. This study provides a theoretical basis for further elucidating the physiological functions and molecular mechanisms of FSHR and LHR and also provides a reference for the reproductive regulation of Nile tilapia.

Author Contributions

Conceptualization, J.Y. and J.Z.; methodology, J.Y. and D.L.; software, Z.Z.; validation, J.Y. and W.X.; formal analysis, J.Y.; investigation, J.Y. and D.L.; resources, B.C.; data curation, J.Y. and Z.Z.; writing—original draft preparation, J.Y.; writing—review and editing, J.Y. and H.Y.; visualization, J.Z.; supervision, J.Z.; project administration, H.Y.; funding acquisition, H.Y. All authors have read and agreed to the published version of the manuscript.

Funding

This research was supported by Central Public-interest Scientific Institution Basal Research Fund, Freshwater Fisheries Research Center, CAFS (NO. 2021JBFM04), Central Public-interest Scientific Institution Basal Research Fund, CAFS (NO. 2020TD37/2019ZY20), China Agriculture Research System of MOF and MARA (CARS-46).

Institutional Review Board Statement

The animal study protocol was approved by the Ethics Committee of Freshwater Fisheries Research Centre of the Chinese Academy of Fishery Sciences (2021JBFM04, 202103).

Data Availability Statement

Not applicable.

Acknowledgments

We thank Chengliang Wei from the Freshwater Fisheries Research Center, Chinese Academy of Fishery Sciences for his contribution to the tilapia culture.

Conflicts of Interest

The authors declare no conflict of interest.

References

  1. Gharib, S.D.; Wierman, M.E.; Shupnik, M.A.; Chin, W.W. Molecular Biology of the Pituitary Gonadotropins. Endocr. Rev. 1990, 11, 177–199. [Google Scholar] [CrossRef] [PubMed]
  2. Zhang, Z.; Zhu, B.; Ge, W. Genetic Analysis of Zebrafish Gonadotropin (FSH and LH) Functions by TALEN-Mediated Gene Disruption. Mol. Endocrinol. 2015, 29, 76–98. [Google Scholar] [CrossRef] [PubMed] [Green Version]
  3. Kwok, H.-F.; So, W.-K.; Wang, Y.; Ge, W. Zebrafish gonadotropins and their receptors: I. Cloning and characterization of zebrafish follicle-stimulating hormone and luteinizing hormone receptors—Evidence for their distinct functions in follicle development. Biol. Reprod. 2005, 72, 1370–1381. [Google Scholar] [CrossRef] [PubMed]
  4. Jia, Y.D.; Lei, J.L. Molecular function of gonadotrophins and their receptors in the ovarian development of turbot (Scophthalmus maximus). Gen. Comp. Endocrinol. 2019, 277, 17–19. [Google Scholar] [CrossRef]
  5. Candelma, M.; Dalla Valle, L.; Colella, S.; Santojanni, A.; Carnevali, O. Cloning, characterization, and molecular expression of gonadotropin receptors in European hake (Merluccius merluccius), a multiple-spawning species. Fish Physiol. Biochem. 2018, 44, 895–910. [Google Scholar] [CrossRef]
  6. Levavi-Sivan, B.; Bogerd, J.; Mananos, E.L.; Gomez, A.; Lareyre, J.J. Perspectives on fish gonadotropins and their receptors. Gen. Comp. Endocrinol. 2010, 165, 412–437. [Google Scholar] [CrossRef]
  7. So, W.K.; Kwok, H.F.; Ge, W. Zebrafish gonadotropins and their receptors: II. Cloning and characterization of zebrafish follicle-stimulating hormone and luteinizing hormone subunits their spatial-temporal expression patterns and receptor specificity. Biol. Reprod. 2005, 72, 1382–1396. [Google Scholar] [CrossRef] [Green Version]
  8. Kobayashi, T.; Andersen, O. The gonadotropin receptors FSH-R and LH-R of Atlantic halibut (Hippoglossus hippoglossus), 1: Isolation of multiple transcripts encoding full-length and truncated variants of FSH-R. Gen. Comp. Endocrinol. 2008, 156, 584–594. [Google Scholar] [CrossRef]
  9. Sambroni, E.; Gac, F.L.; Breton, B.; Lareyre, J.J. Functional specificity of the rainbow trout (Oncorhynchus mykiss) gonadotropin receptors as assayed in a mammalian cell line. J. Endocrinol. 2007, 195, 213–228. [Google Scholar] [CrossRef] [Green Version]
  10. Maugars, G.; Schmitz, M. Molecular cloning and characterization of FSH and LH receptors in Atlantic salmon (Salmo salar L.). Gen. Comp. Endocrinol. 2006, 149, 108–117. [Google Scholar] [CrossRef]
  11. Kusakabe, M.; Nakamura, I.; Evans, J.; Swanson, P.; Young, G. Changes in mRNAs encoding steroidogenic acute regulatory protein, steroidogenic enzymes and receptors for gonadotropins during spermatogenesis in rainbow trout testes. J. Endocrinol. 2006, 189, 541–554. [Google Scholar] [CrossRef] [PubMed]
  12. Kumar, R.S.; Ijiri, S.; Trant, J.M. Molecular biology of channel catfish gonadotropin receptors: 1. Cloning of a functional luteinizing hormone receptor and preovulatory induction of gene expression. Biol. Reprod. 2001, 64, 1010–1018. [Google Scholar] [CrossRef] [PubMed] [Green Version]
  13. Kitano, T.; Takenaka, T.; Takagi, H.; Yoshiura, Y.; Kazeto, Y.; Hirai, T.; Mukai, K.; Nozu, R. Roles of Gonadotropin Receptors in Sexual Development of Medaka. Cells 2022, 11, 387. [Google Scholar] [CrossRef] [PubMed]
  14. Qin, Q.B.; Liu, Q.W.; Zhou, Y.W.; Wang, C.Q.; Qin, H.; Zhao, C.; Liu, S.J. Differential expression of HPG-axis genes in autotetraploids derived from red crucian carp Carassius auratus red var., female x blunt snout bream Megalobrama amblycephala, male. J. Fish Biol. 2018, 93, 1082–1089. [Google Scholar] [CrossRef] [PubMed] [Green Version]
  15. Fjelldal, P.G.; Hansen, T.; Huang, T.S. Continuous light and elevated temperature can trigger maturation both during and immediately after smoltification in male Atlantic salmon (Salmo salar). Aquaculture 2011, 321, 93–100. [Google Scholar] [CrossRef]
  16. Dadras, H.; Dzyuba, B.; Cosson, J.; Golpour, A.; Siddique, M.A.M.; Linhart, O. Effect of water temperature on the physiology of fish spermatozoon function: A brief review. Aquac. Res. 2017, 48, 729–740. [Google Scholar] [CrossRef]
  17. Mahanty, A.; Purohit, G.K.; Mohanty, S.; Mohanty, B.P. Heat stress-induced alterations in the expression of genes associated with gonadal integrity of the teleost Puntius sophore. Fish Physiol. Biochem. 2019, 45, 1409–1417. [Google Scholar] [CrossRef]
  18. Garcia-Lopez, A.; Couto, E.; Canario, A.V.M.; Sarasquete, C.; Martinez-Rodriguez, G. Ovarian development and plasma sex steroid levels in cultured female Senegalese sole Solea senegalensis. Comp. Biochem. Physiol. Part A-Mol. Integr. Physiol. 2007, 146, 342–354. [Google Scholar] [CrossRef]
  19. Li, G.L.; Liu, X.C.; Lin, H.R. Seasonal changes of serum sex steroids concentration and aromatase activity of gonad and brain in red-spotted grouper (Epinephelus akaara). Anim. Reprod. Sci. 2007, 99, 156–166. [Google Scholar] [CrossRef]
  20. Beardmore, J.A.; Mair, G.C.; Lewis, R.I. Monosex male production in finfish as exemplified by tilapia: Applications, problems, and prospects. Aquaculture 2001, 197, 283–301. [Google Scholar] [CrossRef]
  21. Yu, J.; Yang, H. Genetic basis of sex determination and application of sex control in fish: A review. J. Dalian Ocean. Univ. 2020, 35, 161–168. [Google Scholar] [CrossRef]
  22. Zhu, J.; Zou, Z.; Li, D.; Xiao, W.; Yu, J.; Chen, B.; Xue, L.; Yang, H. Transcriptome Profiling Revealed Basis for Growth Heterosis in Hybrid Tilapia (Oreochromis niloticus ♀ × O. aureus ♂). Fishes 2022, 7, 43. [Google Scholar] [CrossRef]
  23. Livak, K.J.; Schmittgen, T.D. Analysis of relative gene expression data using real-time quantitative PCR and the 2−ΔΔCT method. Methods 2001, 25, 402–408. [Google Scholar] [CrossRef] [PubMed]
  24. Bhattacharyya, S.; Sen, U.; Bhattacharyya, S.P.; Mukherjee, D. High performance liquid chromatographic separation of steroids from ovarian follicles of fresh water perch Anabas testudineus: Identification and characterization of the maturation-inducing hormone. J. Exp. Zool. 2002, 292, 565–572. [Google Scholar] [CrossRef]
  25. Comeau, L.A.; Campana, S.E.; Chouinard, G.A.; Hanson, J.M. Timing of Atlantic cod Gadus morhua seasonal migrations in relation to serum levels of gonadal and thyroidal hormones. Mar. Ecol. Prog. 2001, 221, 245–253. [Google Scholar] [CrossRef]
  26. Holland, M.C.; Hassin, S.; Zohar, Y. Gonadal development and plasma steroid levels during pubertal development in captive-reared striped bass, Morone saxatilis. J. Exp. Zool. 2000, 286, 49–63. [Google Scholar] [CrossRef]
  27. Kitano, H. Steroid hormones in fish reproduction. Nippon. Suisan Gakkaishi 2009, 75, 860–861. [Google Scholar] [CrossRef] [Green Version]
  28. Tokarz, J.; Moller, G.; de Angelis, M.H.; Adamski, J. Steroids in teleost fishes: A functional point of view. Steroids 2015, 103, 123–144. [Google Scholar] [CrossRef] [Green Version]
  29. Qin, Z.B.; Feng, J.; Sun, T.; He, Z.; Luo, B.; Pang, W. Change discioline of sex steroid hormoones in seum of loach (misgurnus anguillicaudayus) infected chorionic gonadotropin analogue (LHRHa). Acta Hydrobiol. Sin. 2009, 33, 1168–1174. [Google Scholar] [CrossRef]
  30. Sudo, R.; Tosaka, R.; Ijiri, S.; Adachi, S.; Suetake, H.; Suzuki, Y.; Horie, N.; Tanaka, S.; Aoyama, J.; Tsukamoto, K. Effect of temperature decrease on oocyte development, sex steroids, and gonadotropin beta-subunit mRNA expression levels in female Japanese eel Anguilla japonica. Fish. Sci. 2011, 77, 575–582. [Google Scholar] [CrossRef]
  31. Lin, H.R. Regulation mechanism of gonadotropin secretion in fish and a new efficient fish oxytocin. Life Sci. 1991, 003, 24–25. [Google Scholar]
  32. Qiang, L.; Lu, J.; Gao, Y.; Li, S.; Luo, J. The effect of temperature on gonad, embryonic development and survival rate of juvenile seahorses, Hippocampus kuda Bleeker. Aquaculture 2006, 254, 701–713. [Google Scholar]
  33. Rahman, M.A.; Ohta, K.; Yamaguchi, A.; Chuda, H.; Hirai, T.; Matsuyama, M. Gonadotropins, gonadotropin receptors and their expressions during sexual maturation in yellowtail, a carangid fish. Fish Physiol. Biochem. 2003, 28, 81–83. [Google Scholar] [CrossRef]
  34. Jia, Y.D.; Meng, Z.; Niu, H.X.; Hu, P.; Lei, J.L. Molecular cloning, characterization, and expression analysis of luteinizing hormone receptor gene in turbot (Scophthalmus maximus). Fish Physiol. Biochem. 2014, 40, 1639–1650. [Google Scholar] [CrossRef]
  35. Chi, M.L.; Ni, M.; Li, J.F.; He, F.; Qian, K.; Zhang, P.; Chai, S.H.; Wen, H.S. Molecular cloning and characterization of gonadotropin subunits (GTHα, FSHβ and LHβ) and their regulation by hCG and GnRHa in Japanese sea bass (Lateolabrax japonicas) in vivo. Fish Physiol. Biochem. 2015, 41, 587–601. [Google Scholar] [CrossRef]
  36. Mu, W.J.; Wen, H.S.; He, F.; Li, J.F.; Liu, M.; Zhang, Y.Q.; Hu, J.; Qi, B.X. Cloning and expression analysis of follicle-stimulating hormone and luteinizing hormone receptor during the reproductive cycle in Korean rockfish (Sebastes schlegeli). Fish Physiol. Biochem. 2013, 39, 287–298. [Google Scholar] [CrossRef]
  37. Liu, M.; Wen, H.S.; He, F.; Li, J.F.; Ma, R.Q.; Hu, J.; Mu, W.J.; Zhang, Y.Q.; Qi, B.X. Cloning of LHR and expression analysis during the reproductive cycle in female yellow catfish (Pelteobagrus fulvidraco). J. Fish. China 2011, 35, 1770–1779. [Google Scholar]
  38. Zhang, G.; Wang, W.; Duan, Z.Y.; Gui, L.; Su, M.L.; Mu, X.J.; Zhang, J.B. Gene cloning of gonadotropic hormone receptors and their mRNA expressions at different development stages of the gonad in Scatophagus argus. J. Fish. China 2017, 41, 993–1005. [Google Scholar]
  39. Gen, K.; Yamaguchi, S.; Okuzawa, K.; Kumakura, N.; Tanaka, H.; Kagawa, H. Physiological roles of FSH and LH in red seabream, Pagrus major. Fish Physiol. Biochem. 2003, 28, 77–80. [Google Scholar] [CrossRef]
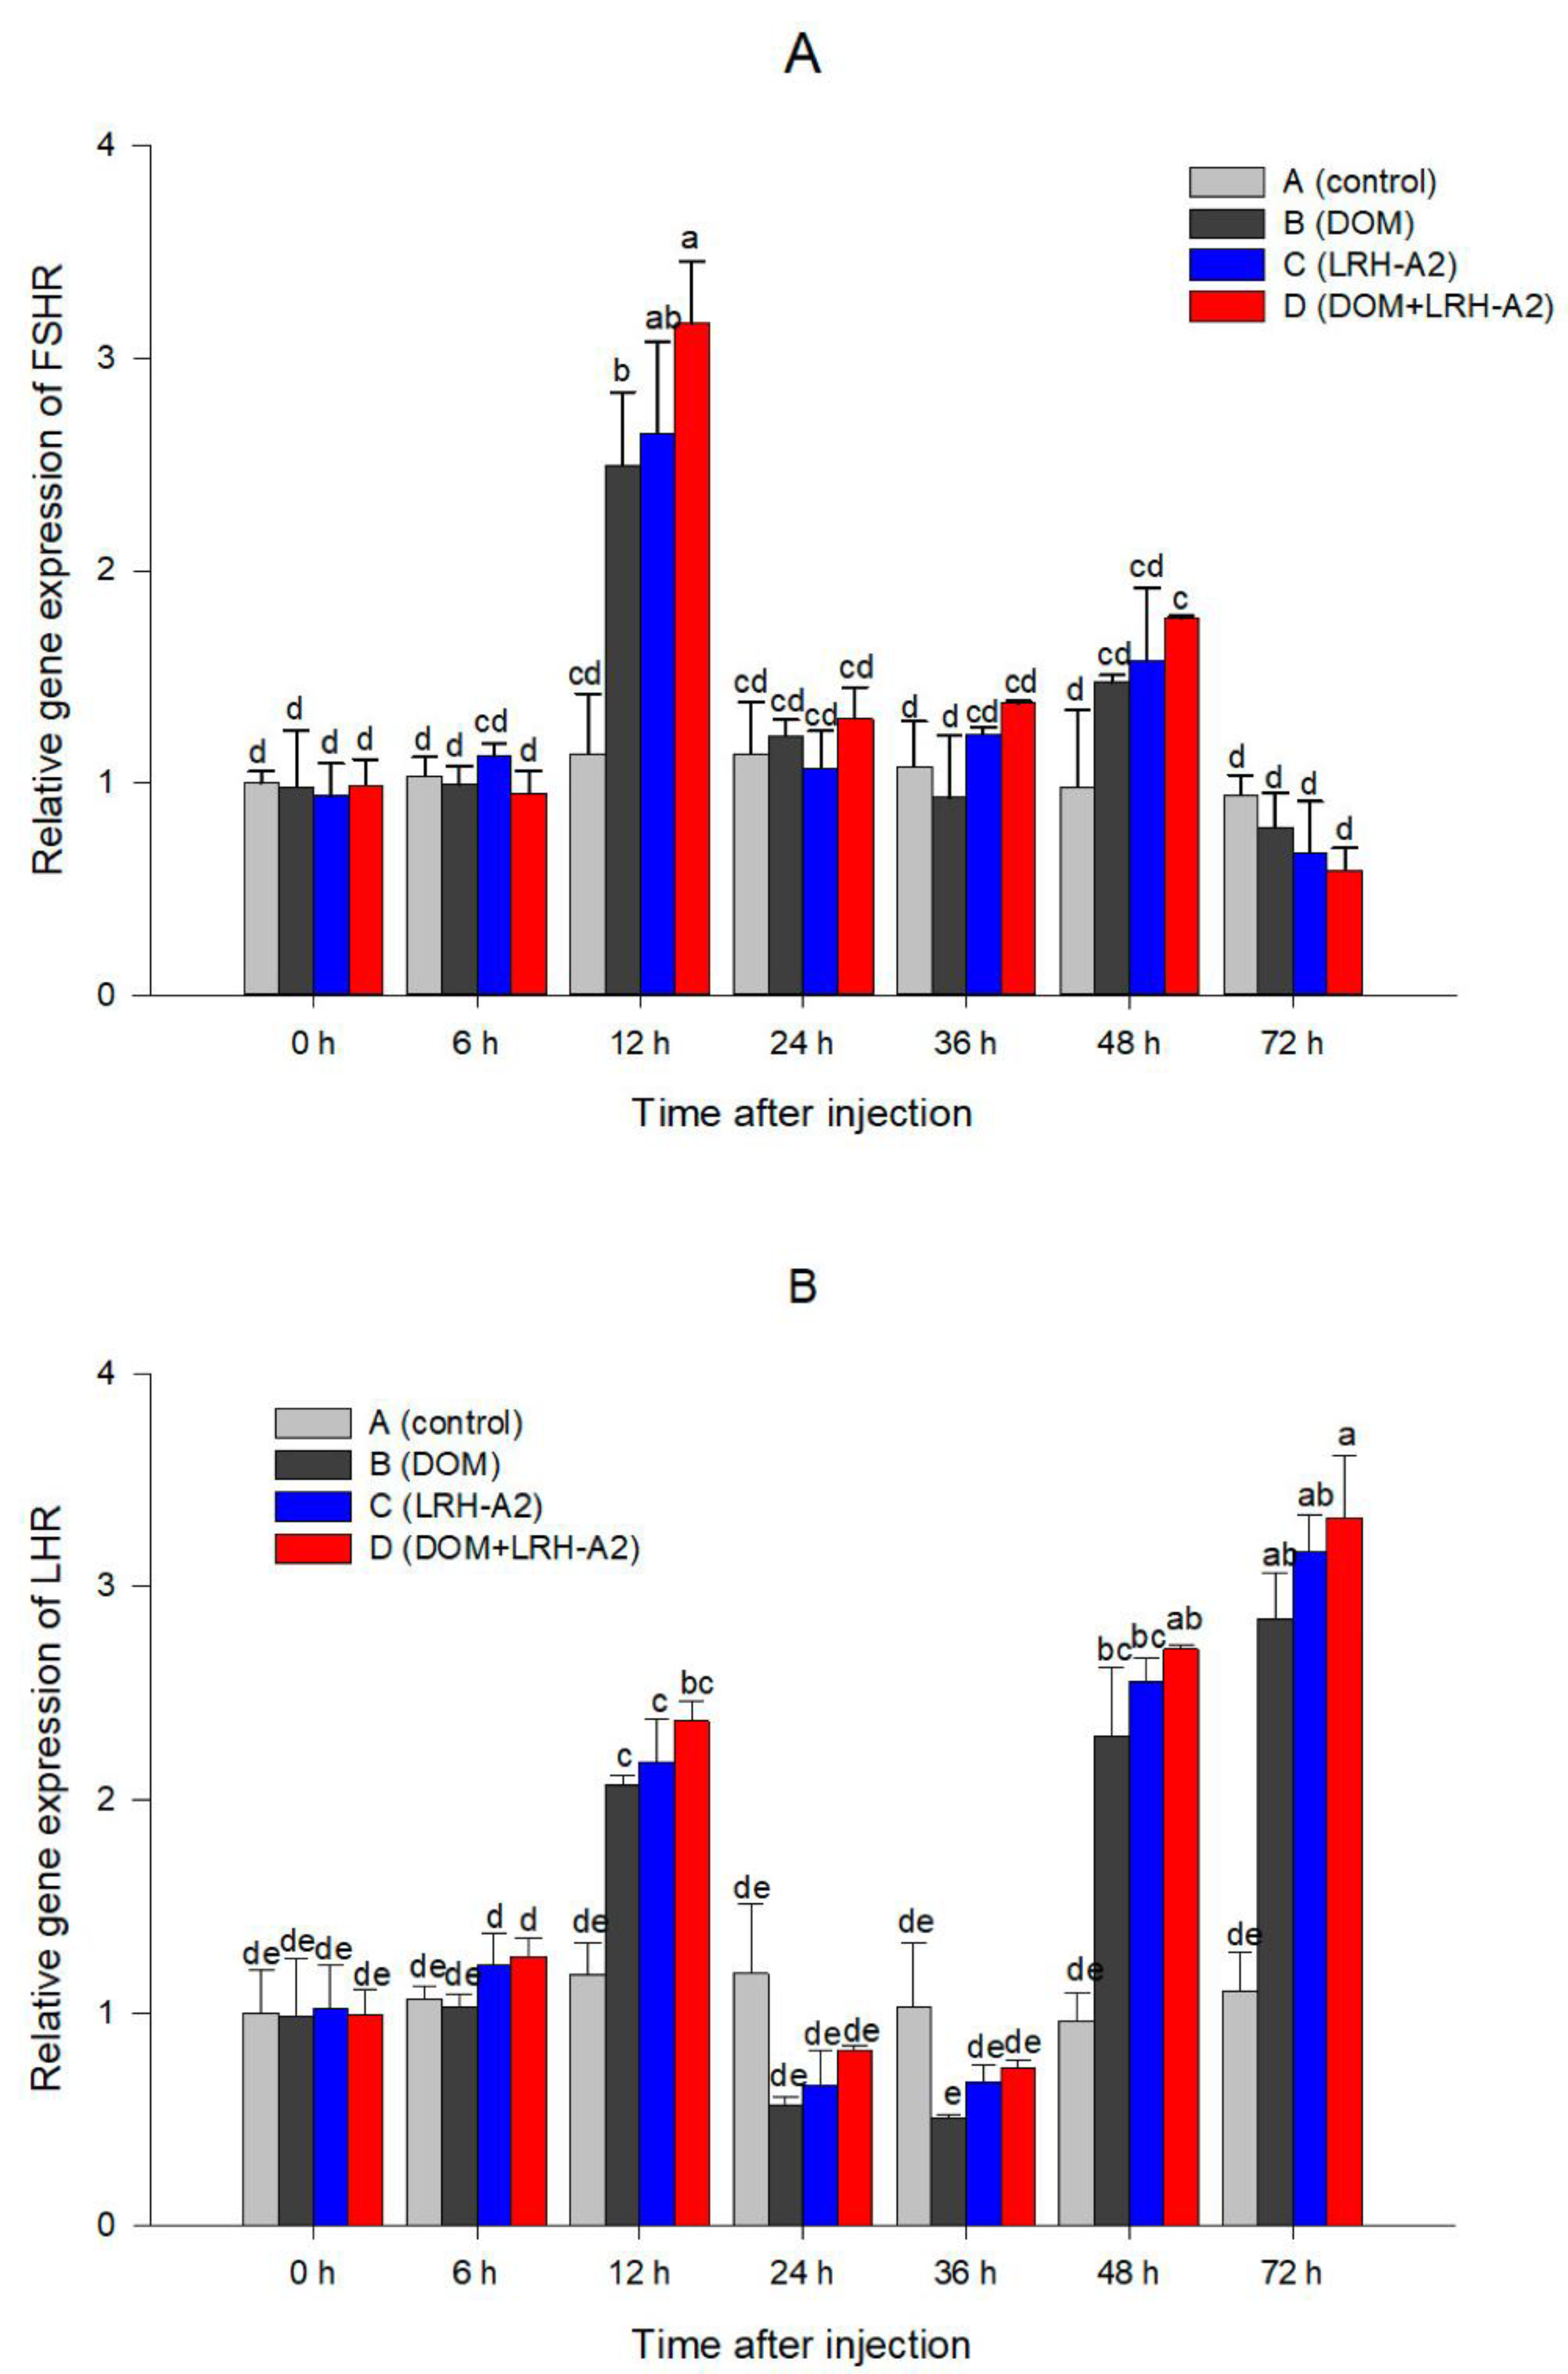
Figure 1. Expression analysis of FSHR gene (A) and LHR gene (B) in the ovary after injecting different oxytocin. Note: Different lowercase letters represent significant differences between the experimental groups at various time points (p < 0.05); Reference gene: β-actin; n = 3.
Fishes 07 00316 g001
Figure 2. Expression analysis of FSHR gene (A) and LHR gene (B) in testis after injecting different oxytocins. Note: Different lowercase letters represent significant differences between the experimental groups at various time points (p < 0.05); Reference gene: β-actin; n = 3.
Fishes 07 00316 g002
Figure 3. Expression analysis of FSHR gene (A) and LHR gene (B) in the ovary after different temperature treatments. Note: Different lowercase letters represent significant differences between the experimental groups at various time points (p < 0.05); Reference gene: β-actin; n = 3.
Fishes 07 00316 g003
Figure 4. Expression analysis of FSHR gene (A) and LHR gene (B) in testis after different temperature treatments. Note: Different lowercase letters represent significant differences between the experimental groups at various time points (p < 0.05); Reference gene: β-actin; n = 3.
Fishes 07 00316 g004
Table 1. Primers used in this study.
Primer NamePrime SequenceGeneBank No.
RT-FSHR-F5′-TGTGACAACCCCGAGGCTAAAAATA-3′MW353713
RT-FSHR-R5′-GGCGAGGACAGAGATGATCCAGAT-3′
RT-LHR-F5′-CTCTGAGGTCTCTCCCCCCTAATG-3′MW353714
RT-LHR-R5′-AGGCACTTTCCCTTTGTTTCCG-3′
β-actin-F5′-GTTGCCATCCAGGCTGTGCT-3′XM_003441527
β-actin-R5′-TCTCGGCTGTGGTGGTGAAG-3′
Table 2. Change of serum E2 content in Nile tilapia serum after oxytocin injection.
E2 Content (ng·mL−1)Time after Injection
(hour)
Group0 h6 h12 h24 h36 h48 h72 h
A6.4814 c6.2128 c6.5640 c6.5012 c6.4854 c6.5144 c6.4304 c
B6.3012 c6.2812 c6.1342 c7.6543 b6.9559 c6.4344 c6.2458 c
C6.3256 c6.3309 c6.2311 c8.7172 ab7.7369 b6.9167 c6.6169 c
D6.2927 c605665 c6.9203 bc9.4563 a8.6621 a7.5422 bc7.0136 c
Note: Different lowercase letters represent significant differences between the experimental groups at various time points (p < 0.05; n = 3).
Table 3. Change of serum T content in Nile tilapia serum after oxytocin injection.
T Content (nmol·mL−1)Time after Injection
(hour)
Group0 h6 h12 h24 h36 h48 h72 h
A15.8679 c16.3434 c16.8554 c16.5557 c16.1926 c15.8144 c17.3772 c
B16.2301 c16.5360 c17.2495 c22.1971 ab19.4445 bc18.7310 bc17.9607 c
C16.8832 c16.5583 c18.4922 c23.4629 a20.1876 bc19.1990 bc18.0240 c
D17.1265 c16.3253 c19.0393 c24.7363 a21.2823 b20.0361 b18.8451 c
Note: Different lowercase letters represent significant differences between the experimental groups at various time points (p < 0.05; n = 3).
Table 4. Changes of serum E2 content in Nile tilapia serum after different temperature treatments.
E2 Content (pmol·mL−1)Time Point
(day)
Group0 d7 d14 d21 d28 d
24 °C18.4712 d26.0892 c28.7227 c42.2353 b53.7043 b
28 °C18.7891 d31.4140 c34.2748 c50.5566 a56.1360 a
32 °C18.4713 d29.2065 c31.3694 c48.8420 ab55.0063 a
Note: Different lowercase letters represent significant differences between the experimental groups at various time points (p < 0.05; n = 3).
Table 5. Changes of serum T content in Nile tilapia serum after different temperature treatments.
T Content (pg·mL−1)Time Point
(day)
Group0 d7 d14 d21 d28 d
24 °C99.0988 d105.4493 d115.4272 cd132.1870 c169.0778 b
28 °C99.3287 d118.3062 cd151.9149 b192.5650 a195.8710 a
32 °C99.1389 d115.2353 cd130.5893 c166.1675 ab172.3760 ab
Note: Different lowercase letters represent significant differences between the experimental groups at various time points (p < 0.05; n = 3).
Publisher’s Note: MDPI stays neutral with regard to jurisdictional claims in published maps and institutional affiliations.