Article

Comprehensive Utilization of Land Resources for Photovoltaic Power Generation to Culture Chinese Mitten Crab (Eriocheir sinensis): Growth Performance, Nutritional Composition and Tissue Color

1
National Demonstration Center for Experimental Fisheries Science Education, Key Laboratory of Freshwater Aquatic Genetic Resources, Ministry of Agriculture, Engineering Research Center of Aquaculture, Shanghai Ocean University, Shanghai 201306, China
2
Tongwei New Energy Co., Ltd., Chengdu 610041, China
3
Tongwei Co., Ltd., Chengdu 610041, China
4
School of Wetlands, Yancheng Teachers University, Yancheng 224007, China
*
Authors to whom correspondence should be addressed.
These authors contributed equally to this work.
Fishes 2022, 7(4), 207; https://doi.org/10.3390/fishes7040207
Submission received: 25 July 2022 / Revised: 13 August 2022 / Accepted: 16 August 2022 / Published: 18 August 2022
(This article belongs to the Special Issue Recent Advances in Crab Aquaculture)

Abstract

:
The assertive growth of photovoltaics (PV) will occupy a lot of land resources. There is also a needed land resource to expand the culturing area of Eriocheir sinensis. The aquavoltaic systems offer a potential solution to integrate PV power and E. sinensis culturing. In this study, we cultured E. sinensis in an area of PV panels (PV group) and an area with no PV panels (control group), respectively. The results showed that the weight gain rate, body length, body width, and meat yield of male crabs in the PV group significantly increases. In addition, the moisture of muscles, hepatopancreas, and testes in the PV group has significantly increased, and the total lipids of the hepatopancreas and muscles in the PV group were significantly decreased. Moreover, the PV panels affected the content of eight amino acids in different tissues, including Met, Arg, Cys, Pro, Gly, Leu, Tyr, and His. In addition, several saturated fatty acids (SFA), monounsaturated fatty acids (MUFA), and polyunsaturated fatty acids (PUFA) had been significantly influenced by the PV panels. ∑MUFA, docosahexaenoic acid (DHA), ∑n-3 PUFA, ∑n-6 PUFA, and n-3/n-6 PUFA ratio (p < 0.05) in the PV group had significantly decreased. The results of tissue color showed that the L* value of ovaries was significantly higher than in the control group, and a* and b* values of hepatopancreas were significantly lower. In conclusion, PV panels could promote growth performance and amino acid nutrition of crabs. However, the PV panels had a few negative influences on the fatty acid composition and tissue color.

1. Introduction

Photovoltaic (PV) power generation, which can replace fossil energy, is essential to mitigate climate change. According to reports, the global annual PV generation level will reach 6970 TWh in 2030 from 820 TWh in 2020, the average generation growth needs 24% during 2020–2030 [1]. By the end of 2021, the installed capacity of PV power generation in China had reached 306 million KW, ranking first in the world for seven consecutive years [2]. However, the assertive growth of photovoltaics will occupy a lot of land resources [3]. This is in contradiction with agricultural development and food production. As an important economic crab, the Chinese mitten crab (Eriocheir sinensis) is widely cultured in China, and the pond culture of E. sinensis has developed rapidly in the past years. There is also a need to expand the culturing area. However, in recent years, the government has controlled the excavation of culturing ponds in China. Therefore, the aquavoltaic systems, which integrate aquaculture and PV power generation, offer a potential solution to this problem [4,5]. In recent years, more and more individuals have considered using aquaculture ponds to carry out PV power generation. For example, the floating photovoltaic (FPV) systems on aquaculture ponds could promote the production of the giant freshwater prawn (Macrobrachium rosenbergii), tilapia (Oreochromis niloticus) and milkfish (Chanos chanos) [6]. However, there is a lack of research on the feasibility of E. sinensis culturing under PV panels.
As we know, the PV panels covering the pond will affect the light intensity and the air circulation on the surface of the water body and, in addition, the water temperature and dissolved oxygen (DO) can be influenced by the PV panels [6,7]. The light intensity, temperature, and DO have a direct impact on the growth and development of animals [8,9,10]. For example, Tigan et al. (2020) confirmed that the larval Delta Smelt (Hypomesus transpacificus) has a minimum threshold of light to generate its exogenous feeding response [11]. However, this did not mean that the higher the light intensity, the better the growth of animals. Another study showed that the peak value of weight gain (WG) and specific growth rate (SGR) of juvenile mud crab (Scylla paramamosain) is 10 W m−2 rather than the higher light intensity [9]. In the study, the WG and SGR of S. paramamosain displayed a curvilinear response to light treatments [9]. In addition, there is a positive correlation between water temperature and light intensity and the high temperature was not conducive to animal feeding and growth [12]. In the hot summer season, PV panels could block sunlight and reduce the intensity of light and temperature rise [13,14]. However, we also need to consider the possible adverse effects of PV panels on animal growth in the spring and continuous rainy weather. After all, the low water temperature will also affect the growth of animals [15]. Moreover, the PV panels may affect the photosynthesis of aquatic plants, resulting in the reduction of DO [7]. In aquaculture, yield is an important measure of the success of aquavoltaic systems. Therefore, we must pay attention to the impact of PV panels on the growth of E. sinensis.
The edible tissues (muscle, gonad, and hepatopancreas) of E. sinensis usually attract consumers with their unique flavor, delicious taste, and rich nutrition. The nutrients, aromatic flavor, and umami flavor of cooked crabs are mainly derived from a large number of enriched amino acids and fatty acids [16,17]. Therefore, the amino acid composition, fatty acid composition, and proximate composition in edible tissues are important indicators to judge the quality of crabs. According to one report, light intensity could affect the biosynthesis of amino acids and unsaturated fatty acids in S. paramamosain [18]. Liu et al. (2020) also suggested that the amino acid composition and polyunsaturated fatty acids of muscles are influenced by the light intensity in giant clams (Tridacna crocea) [19]. Considering the potential impact of PV panels, we needed to analyze the amino acid, fatty acid, and proximate composition of the crabs, to ensure the final crab quality.
Moreover, the carapace, hepatopancreas, and ovaries color of crustaceans is also an important factor to attract customers [20]. For example, consumers usually prefer the light grey and grey raw shrimp (Litopenaeus vannamei), and orange and intense orange cooked shrimp [21]. Therefore, the color of crabs directly affects consumers’ purchase decisions and becomes one of the important indicators to evaluate the value of crabs [20]. According to the report, constant darkness treatment darkened the body color of L. vannamei [22]. Another study also confirmed that light intensity with 434 lux which is the highest in the study can darken the skin color of catfish (Leiocassis longirostris Gunther) [23]. The mentioned studies suggested that changes in light intensity may affect the color of crustaceans. Therefore, the effect of PV panels on the crabs’ color is needed to be further evaluated.
In this study, we integrated PV power generation and crab culturing for the first time. Previously, we had published some data from this study in another journal, including the effect of PV panels on the light intensity, water temperature, dissolved oxygen, and aquatic plant growth in the ponds culture of E. sinensis [24]. In this paper, we mainly focused on the effect of PV panels on the growth performance, amino acid, fatty acid, proximate composition, and tissue color of E. sinensis. We aimed to evaluate the potential value of the aquavoltaic system to solve the competition for land resources between PV power generation and aquaculture.

2. Materials and Methods

2.1. Construction of Experimental Facilities

In this study, two large surface ponds (more than 66,690 m2) were randomly chosen to construct the photovoltaic modules and net enclosures in Tongwei Provincial Boutique Fishery Park (32.229° N, 119.035° E, Nanjing, China). In each pond, about half of the area was covered by photovoltaic panels (PV area), and the other half of the water surface was free of any shelter (non-PV area). Each photovoltaic module consisted of one PV panel (area: 1661 × 995 mm; dip angle: 28°; power: 275/280 Wp) and one support column (height: 5.2 m). The left and right distance between each two PV panels were 1000 mm, and the front and rear distance were 6200 mm. Then, we built two net enclosures (length:width:height = 25 m:20 m:2 m) under PV panels of each pond, and the other two identical net enclosures were placed in the non-PV area. Therefore, there was a total of four net enclosures under PV panels of two ponds, and four net enclosures in the non-PV area. In addition, two microporous aeration plates were placed on the bottom of each enclosure in order to increase the dissolved oxygen (DO). The Elodea nuttallii was planted in the whole area of the two ponds (density: 15 kg/m2) including net enclosure areas and non-enclosure areas.

2.2. Animal Culture

From 10–15 April 2019, the juvenile crabs (density: 3.2 individuals/m2) with body weights of 8.56 ± 0.87 g were put into the enclosure areas and non-enclosure areas of ponds. All crabs were divided into the net enclosures in the non-PV area (named as the control group, four repetitions) and the net enclosures under PV panels (named as the PV group, four repetitions). In the control and PV groups, the animals only moved in the enclosed area of the net enclosures, the difference being that the PV panels covered the PV group, while the control group were not. The water depth of the ponds was kept at 0.8 m. The crabs were fed the pellet feed (BADA FEED, Nan Tong, Jiangsu Province, China) daily once in the afternoon. The feeding amount was a ration of approximately 2–3% of the total crab biomass. The DO and water temperature were recorded every day using the handheld multiparameter meter (HQ40d, HACH, Loveland, CO, USA) and the temperature recorder (RC-4, Jiangsu Jingchuang Electronics Co., Ltd., Xu Zhou, China). The light intensity of control and photovoltaic groups were also recorded using a digital lux meter (AS823, HIMA, China). The data on the DO, water temperature, and light intensity were published in another journal [24]. Taking the data of May as an example, the average DO in the water bottom of the control and PV groups were 12.2 ± 0.4 mg/L and 11.1 ± 0.5 mg/L, respectively, and the average water temperature in the PV group (23 ± 0.8 °C) was significantly lower than in the control group (24.5 ± 0.7 °C). In addition, the average light intensity in the PV group (3255 ± 124 Lux) was also significantly lower than in the control group (20,685 ± 2368.6 Lux) in the water bottom [24].

2.3. Animal Growth Investigation and Sample Collection

On 16 November 2019, all crabs from the control and photovoltaic groups were caught. Then, some crabs (15 male and 15 female) were randomly chosen from each net enclosure to monitor the growth performance. A total of 120 crabs from the control group and 120 crabs from the PV group were used to monitor the growth performance. These crabs were weighed (precision = 0.01 g) by an electronic balance. The body length and width of crabs were also measured using a vernier caliper (precision = 0.02 mm). The weight gain rate (WGR, %) of each crab was calculated. Then, a total of 10 male and 10 female crabs from each group were randomly selected and dissected, and the muscles, hepatopancreas, and gonads were collected to calculate the meat yield (MY), hepatosomatic index (HSI), gonadosomatic index (GSI), and total edible yield (TEY). The WGR, HSI, GSI, MY, and TEY were calculated using the following formulas:
WGR (%) = 100 × (Wf − Wi)/Wi
HSI (%) =100 × Hepatopancreas wet weight/Body wet weight
GSI (%) = 100 × Gonad wet weight/Body wet weight
MY (%) = 100 × Meat wet weight/Body wet weight
TEY (%) = MY + HIS + GSI
Wf means the crab body weight at the final point of sampling, Wi means the crab body weight of the initial sampling point.

2.4. Biochemical Analysis

The muscles, hepatopancreas, and gonads were used to analyze the moisture, crude protein, and ash according to AOAC procedures [25]. Oxidative acid hydrolysis was used to hydrolyze the Cystine, and another 16 amino acids were hydrolyzed by acid hydrolysis [26]. After pretreatment, all samples were detected by an automatic amino acid analyzer (S-433D, Sykam, Eresing, Germany). In addition, the total lipids of these samples were extracted using a method of chloroform-methanol [27]. The total lipids of muscles, hepatopancreas and ovaries were esterified with boron tri-fluoride/methanol. Then, the hexane was used to extract the fatty acid methyl esters (FAMEs). Following this, FAMEs were analyzed by the gas chromatograph chromatograph-mass spectrometer (GC–MS, 5977A, Agilent 7890B-5977A, Santa Clara, CA, USA) [28].

2.5. Color Measurement

The hepatopancreas (wet) and ovaries (wet) were freeze-dried for 24 h using a freeze dryer (FD5508, ilShin BioBase, Kinki do, Korea). Then, the color of hepatopancreas (wet and dry) and ovaries (dry) were detected by the CIE 1976 L*a*b* Imaging and a Lovibond RT200 spectrophotometer (Salisbury, England) [20]. Each sample was tiled on a circular flat plate, then tested, and there were three readings on each sample surface. The degree of parameter lightness (L*) is that L* > 0 means white and L* < 0 means black. At the same time, the redness (a*) > 0 indicates that colors are red, and a* < 0 indicates that colors are green. In addition, the yellowness (b*) > 0 means yellow, and b* < 0 means blue.

2.6. Statistical Analysis

The data are expressed as the mean ± SD. A one-way analysis of variance was used for multiple group comparisons along with post hoc Duncan multiple range tests. Before analysis, all data were tested for variance homogeneity. All analyses were performed using SPSS 22.0 (SPSS Statistics Base 22.0.0.0, IBM, Armonk, NY, USA). p values of < 0.05 indicated statistically significant differences.

3. Results

3.1. Growth Performance and Edible Indices

As shown in Figure 1A, the male crabs’ body weight in the control group was significantly lower than the PV group at the final sampling point (the end of net enclosure culture, 16 November 2019) (p < 0.05). The WGR showed the same trend (Figure 1B), i.e., the male crab in the PV group was significantly higher than the control group (p < 0.05). As for the final body length and width, the male crabs in the PV group were also significantly higher than the control group (p < 0.05, Figure 1C,D). However, there was no significant difference in females’ body length and width between the control and PV groups (Figure 1C,D). Therefore, we could find that the PV panels can promote the growth of E. sinensis, especially in male crabs. In addition, we found that the MY of male crabs in the control group was significantly lower than in the PV group (p < 0.05, Figure 2C), and there was no significant difference in the HIS, GSI, and TEY between the two groups (p > 0.05, Figure 2A,B,D).

3.2. Proximate Composition

The moisture of female crabs’ muscles in the control group was significantly lower than that in the PV group (p < 0.05, Table 1). Similarly, the moisture of male and female crabs’ hepatopancreas in the control group also was the lowest when compared with the PV group. Therefore, the PV panels could significantly increase the moisture of muscles and hepatopancreas in this study. In addition, the total lipids of the male hepatopancreas and the female muscles and hepatopancreas in the control group were significantly higher than in the PV groups (p < 0.05). These results indicated that the PV panels may decrease the total lipids of muscles and hepatopancreas. More than these, we also focused on the ash content in different tissues. From the results, the ash content in male muscles and testes in the control group was significantly higher than in the PV group (p < 0.05, Table 1). However, the male hepatopancreas’ ash in the control group was significantly lower than in the photovoltaic group (p < 0.05). These results suggested that the PV panels can significantly affect the ash of tissues in E. sinensis, and there was no significant change in the crude protein content between the two groups.

3.3. Amino Acid Composition

In the male crabs’ muscles, the Met (methionine), His (histidine), and Pro (proline) in the control group were higher than in the PV group (p < 0.05, Table 2). On the contrary, the Gly (glycine) in the PV group was higher than in the control group (p < 0.05, Table 2). As for the female muscles, the Arg (arginine) and Gly in the PV group were also higher than in the control group (p < 0.05, Table 2). In addition, the EAA/NEAA of the control group was significantly higher than the PV group (p < 0.05, Table 2). According to the results, we could find the PV panels can affect the Met, His, Pro, Arg, and Gly levels in the crabs’ muscles, and the Tyr (tyrosine), Met, Arg, Cys (cysteine), and Pro in the PV group were significantly higher than in the control group in male crabs’ hepatopancreas (p < 0.05, Table 3). Meanwhile, there was a significant difference in the Arg of hepatopancreas between the control and the PV group (p < 0.05, Table 3). In addition, we also detected the amino acid composition of the testes and ovaries. From the results, the Gly of testes in the photovoltaic was significantly higher than in the control group (p < 0.05, Table 4). In the ovaries, the Leu (leucine) and His in the control group were all significantly lower than in the PV group (p < 0.05, Table 4). On the contrary, the Pro, Try, Cys, and AAA in the control group were all significantly higher than in the PV group (p < 0.05, Table 4). To sum up, the PV panels might have little effect on most amino acids, but still have a significant effect on a few amino acids.

3.4. Fatty Acid Composition

In the male crabs’ muscles, the C14:0, C18:0, C18:1n-9, C20:1n-9, C22:1n-9, ∑MUFA, and n-3/n-6 PUFA in the control group were significantly higher than in the PV group (p < 0.05, Table 5). By contrast, the ∑n-6 PUFA in the control group was significantly lower than in the PV group (p < 0.05). In addition, the fatty acid composition in male crabs’ hepatopancreas changed greatly in this study. According to the results, the C14:0, C18:1n-9, C20:1n-9, C20:3n-6, C22:5n-3, C22:6n-3 (DHA), and ∑n-3 PUFA in the PV group decreased significantly when compared with the control group (p < 0.05, Table 5). On the contrary, the C20:0 and C22:0 in the control group were significantly lower than in the PV group (p < 0.05). Therefore, we found that the PV panels have a significant effect on the fatty composition of the male crabs’ muscles and hepatopancreas, mainly including the saturated fatty acids (SFA), monounsaturated fatty acids (MUFA), and highly unsaturated fatty acids (HUFA).
As for the female crabs, we also analyzed the fatty acid composition of the muscles, hepatopancreas, and ovaries. According to the results, we found that the C15:0 C20:4n-6 (ARA), and ∑n-6 PUFA of muscles in the control group are significantly lower than in the PV group (p < 0.05, Table 6). On the contrary, the C18:1n-9, ∑MUFA, and n-3/n-6 PUFA of muscles in the control group were significantly higher than in the PV group (p < 0.05). In the hepatopancreas, we found that the C15:0, C17:0, C17:1n-7, C20:1n-9, and C20:2n-6 in the PV group were significantly higher than in the control group (p < 0.05, Table 6). However, the C20:3n-3 in the PV group was lower than in the control group (p < 0.05). Finally, Table 6 exhibits the fatty acid composition of ovaries. The results showed that the C17:1n-7, C20:1n-9, C22:0, LA, and C20:2n-6 in the PV group were significantly higher than in the control group (p < 0.05). When compared with the male crabs, the effect of PV panels on fatty acids was reduced in females.

3.5. Hepatopancreas and Ovarian Color

According to the results, the a* and b* of female crabs’ hepatopancreas (wet) in the PV group were significantly lower than in the control group (p < 0.05, Table 7). Therefore, the PV panels might affect the yellow and red of the female crabs’ hepatopancreas. However, the L* and b* of ovaries (dry) in the photovoltaic group were higher than in the control group (p < 0.05, Table 7, Figure 3). Therefore, the PV panels could improve the brightness and yellow color of the ovaries in this study.

4. Discussion

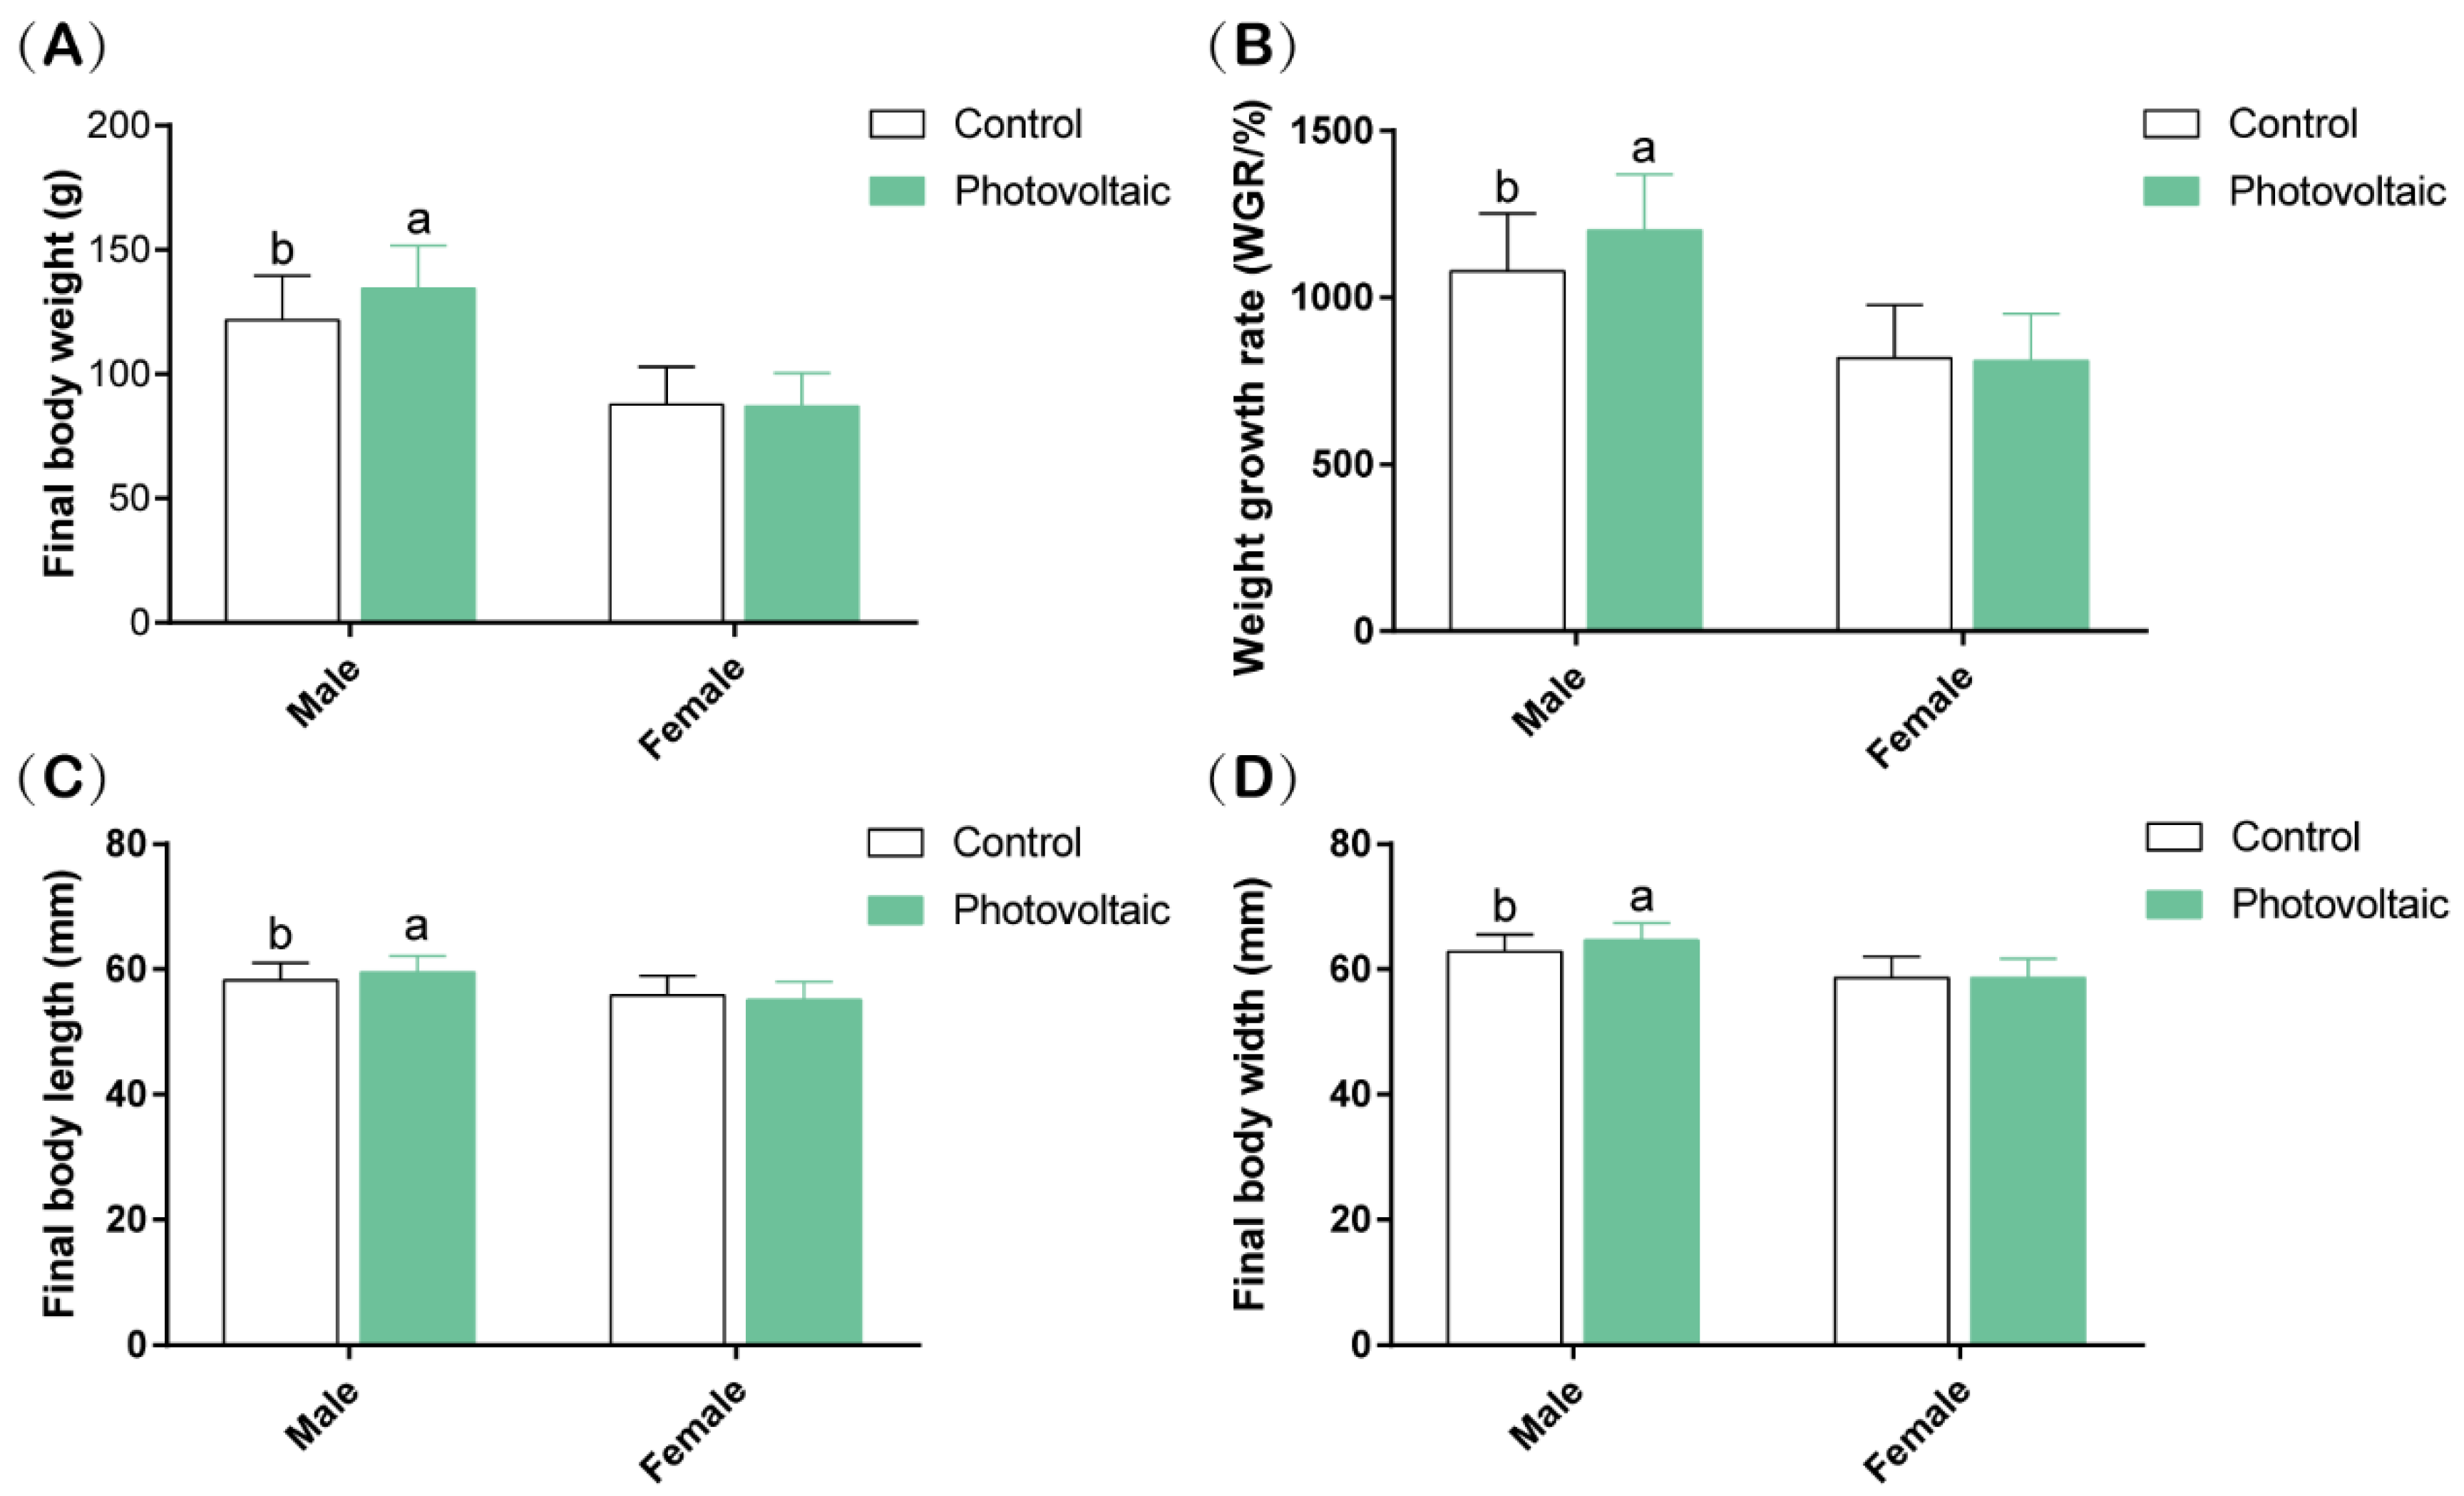
According to our results, the PV panels promoted the growth of E. sinensis, especially the male crabs. Not coincidentally, Wang et al. (2022) reported that the FPV systems significantly improve the production of M. rosenbergii, O. niloticus, and C. chanos. Moreover, another research also suggested that PV panels do not affect the growth of fish (Pelteobagrus fulvidraco), and the proportion of 75% panels can increase fish production compared with the unshaded areas [7]. Therefore, the aquavoltaic system has been proved to be beneficial to the increase of aquaculture production. The demand for light from aquatic animals is generally not high. For example, light (500 lux) lasting for 8 h could significantly improve the survival rate of larval fish (Argyrosomus regius) rather than stronger light lasting longer [29]. As for crustaceans, most of them are active at night [30]. Not only that, Li et al. (2020a) also confirmed that S. paramamosain has a higher survival under low light (1.43 μmol.m−2·s−1, white LED lights). According to our published data, the average underwater light intensity of the photovoltaic group during the daytime is 3255 ± 124 lux in this study [24]. Therefore, the light intensity under the PV panels could meet the regular needs of E. sinensis. In addition, the optimum growth temperature of E. sinensis is generally 22–28 °C [31]. However, the water temperature in summer is often higher than 30 °C. In this study, the water temperature of the photovoltaic group was significantly lower than that of the control group [24]. That was very helpful for crabs to survive the hot summer season and might also be one of the reasons why the PV panel area is conducive to the growth of crabs. Moreover, the average OD in the PV area was more than 5 mg/L in this study [24]. Generally, OD more significant than 3 mg/L can meet the average growth of E. sinensis [32]. According to this research, we suggested that the PV panels system can keep the regular needs of OD in the ponds culture of the crabs, and the PV panels could improve the animal growth in this study.
We should not only pay attention to the growth of crabs but also focus on whether the PV panels system affects the nutritional composition of edible tissues. A previous study reported that temperature is the strongest influencing factor that affects the fat (R = 0.73; p < 0.001) and moisture (R = −0.73; p < 0.001) of rainbow trout (Oncorhynchus mykiss) [33]. It could be seen that the temperature has a negative correlation with body moisture and a positive correlation with fat. In our study, the water temperature in the PV group was significantly lower than in the control group [24]. According to our results, the moisture of muscles, hepatopancreas, and testes in the PV group significantly increased compared with the control group (Table 1). At the same time, the total lipids of the hepatopancreas and muscles in the PV group significantly decreased. Therefore, we suggested that the PV panels affected the water temperature and then regulated the tissues’ moisture and total lipids. On the other hand, the light intensity could have induced an increase in triacylglycerols to avoid photochemical damage [34]. Thus, the increase in total lipid might reduce cell damage in the control group. In addition, Güroy et al., (2011) suggested that much of the energy requirement of fish during starvation was satisfied from the fat or protein reserves [35]. As we described in the previous paragraph that the crabs living in the PV group have a larger physique. Therefore, the lipids of the hepatopancreas and muscles might be more used to support body development in the PV group. In addition, we also found that the ash can be affected by the PV panels. However, there was no regular change in different groups. We needed further to explore the mechanism of the effect of light shading on the ash and other proximate compositions in the crabs.
This study found a significant difference in amino acid composition between males and females. This gender difference was also reflected in the growth performance as described in Section 3.1. So far, there was no evidence that light intensity can lead to gender differences in animal growth and amino acid composition. However, a study has shown that high water temperature can accelerate the sexual maturation of hermaphrodite compared with male shrimp (Eulimnadia braueriana Ishikawa) [36]. In aquaculture, earlier sexual maturity is not conducive to individual growth [37,38]. From our results, the water temperature in the control group was significantly higher than in the PV group. Therefore, we conjectured that the effect of PV panels on the growth performance of different sexes may be related to the water temperature. In addition, there was also evidence suggesting that the hepatopancreas and gonads of male and female E. sinensis have different developmental states in the same periods. For example, the GSI and gonad-hepatopancreas index (100 × Gonad wet weight/Hepatopancreas wet weight) of male E. sinensis was significantly higher than the female in August–September but lower in October–November [39]. Therefore, the difference in amino acid composition between males and females might be related to the developmental state of crabs at the sampling point (16 November) in this study. In fact, the amino acid composition in the freedom group has a significant difference compared with the control group or PV group (Table 2, Table 3 and Table 4). According to a report, the Arg, Leu, Met, Pro, and Gly could be influenced by the change of light intensity in giant clams (Tridacna crocea) [19]. Li et al. (2020) confirmed that the light promoted the biosynthesis of Cys in S. paramamosain, and previous studies also suggested that the photoperiod can regulate the content of Tyr in the Malaysian red tilapia and His in the shrimp (Branchinecta orientalis) [40,41]. Our results also showed that the PV panels affected the content of eight amino acids in different tissues of E. sinensis compared with the control group, including Met, Arg, Cys, Pro, Gly, Leu, Tyr, and His. Among these amino acids, the Gly content in the PV group increased in almost all tissues. As we know, Gly is a generally recognized sweet substance and can mask bitter flavors and saltiness [42,43]. The content of ∑EAA, ∑SEAA, ∑NEAA, and TAA had no significant difference between the control and the PV groups. Therefore, our results indicated that the PV panels have little effect on the total amino acid nutrition of E. sinensis and can even improve the flavor of edible tissues.
In addition, the light intensity and water temperature also can affect the fatty acid composition in animals [44,45]. A previous study suggested that organism exposure to overheated water can promote the ∑MUFA content [46]. In this study, the ∑MUFA in male and female muscles also significantly increased without the PV panels. The theory of homeoviscous adaptation suggests that a lower temperature means a greater degree of unsaturation of lipid [47,48], but this theory is still debated [49]. The effect of environmental temperature on fatty-acid unsaturation may be influenced by the different animal species and tissues [50]. The lack of significant change in ∑PUFA between the control and PV groups seemed to confirm this point. However, the n-3/n-6 PUFA ratio of muscle in the PV group was lower than in the control group. Speers-Roesch et al. (2008) confirmed that the n-3/n-6 ratios in tropical marine elasmobranchs are significantly higher than in the temperate marine elasmobranchs [51]. At the same time, the decrease of DHA and EPA in hepatopancreases resulted in the reduction of the DHA/EPA ratio in the PV group. Miliou et al., 2006 also observed that EPA and DHA decrease with increasing body weight at the low temperature. It is not unique, the growth performance of E. sinensis in the PV group was also better than in the control group (Figure 1). Therefore, the decreases in DHA and EPA observed in the PV group might reflect higher demand for EPA and DHA at a lower temperature for membrane synthesis of faster crabs rather than the response for maintaining membrane permeability and plasticity [50]. Generally, an increase in human dietary n-3/n-6 PUFA is beneficial to prevent coronary heart disease [52,53]. Therefore, the PV panels reduced the nutritional value of E. sinensis to a certain extent.
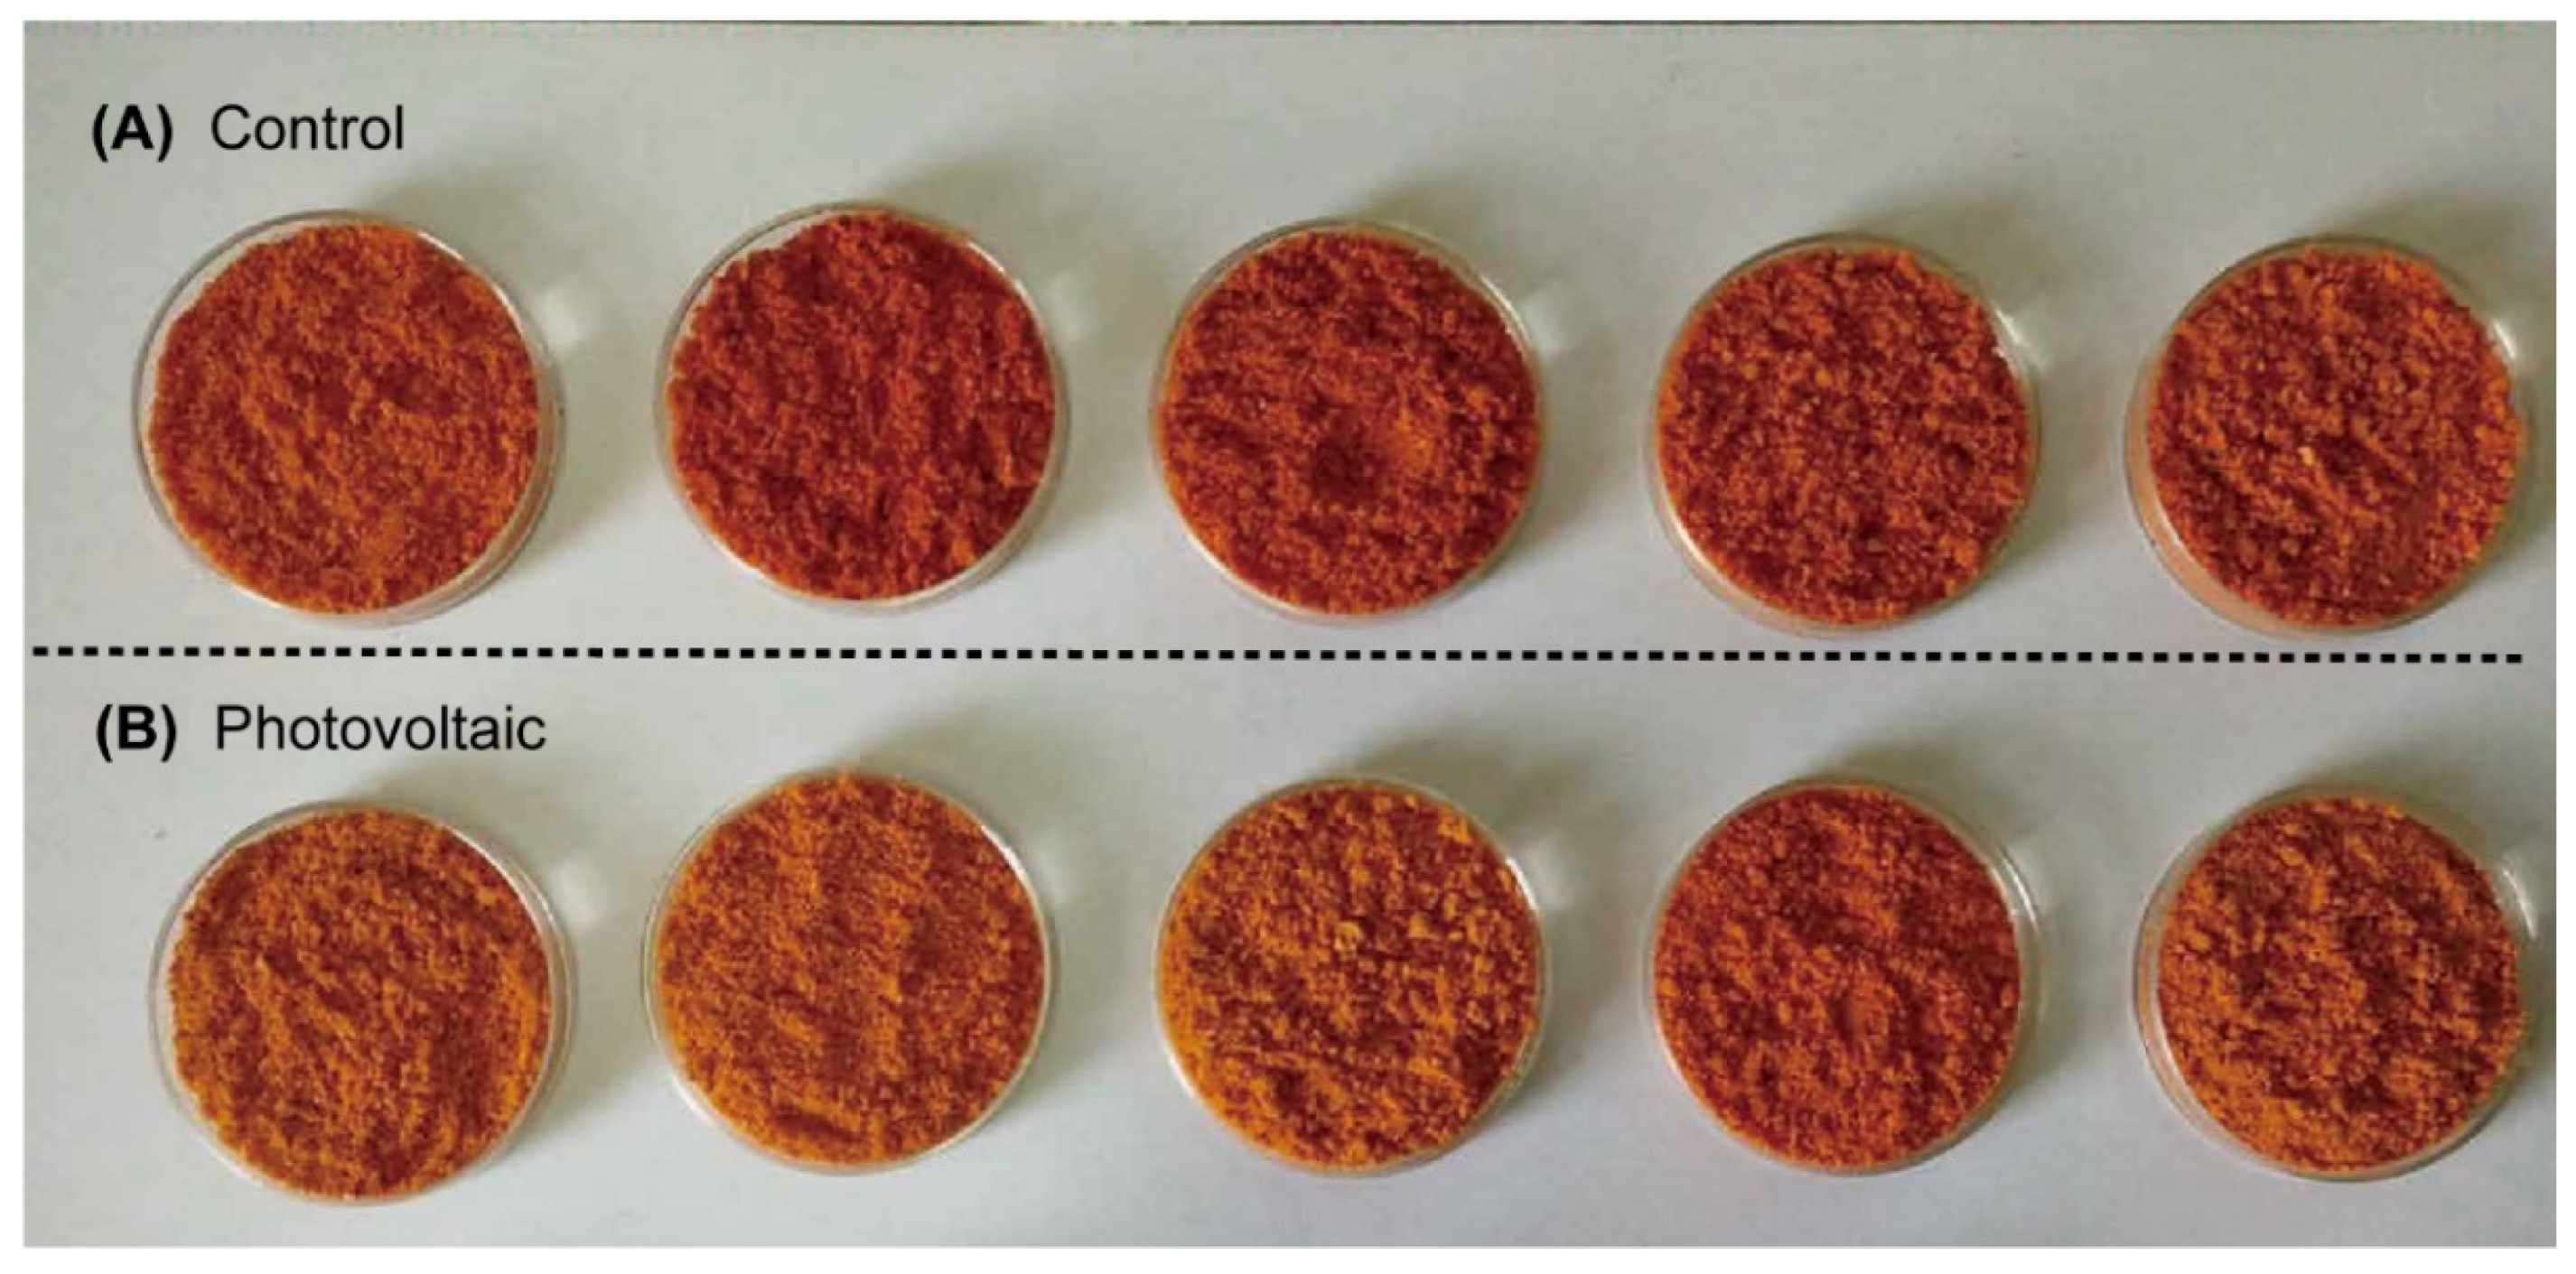
In crustaceans, the coloration is related to the various carotenoids [54]. According to a report, light intensity can affect carotenoid distribution through hormone regulation [55]. For example, the low light level (250–500 lux) has the highest carotenoid level and brighter skin color in marine smoke angelfish (Apolemichthys xanthurus) compared with the high light level (750–1000 or 1500–2000 lux) [56]. In addition, Pavlidis et al. (2008) proved that the low light intensity induced an increase in skin brightness of red porgy (Pagrus pagrus). They suggested that the change in skin color is related to melanophore motility and/or skin melanin concentration [57]. Our study also found that the ovaries (dry) color in the PV group is significantly brighter than in the control group. Therefore, the low light level might be related to the brightness of animals by regulating the carotenoid levels and melanin levels. However, the red (a*) and yellow (b*) color of female crabs’ hepatopancreas (wet) in the control group was lower than in the PV group (Table 7). According to reports, the carotenoid pigment levels were increased at a higher water temperature in European catfish (Silurus glanis) and Atlantic salmon (Salmo salar), and then the coloration of the fish fillets had a more intense increase [58,59]. Therefore, the intense yellow and red color of the hepatopancreas might be related to the higher water temperature in the control group.

5. Conclusions

In this study, we explored the feasibility of integrating PV power generation and E. sinensis culturing in a pond for the first time. The results showed that culturing under PV panels could promote the growth performance of the crabs and amino acid nutrition in edible tissues. However, the PV panels had a few negative influences on the fatty acid composition and tissue color. We suggest that there is a need to improve the mode of E. sinensis culturing under PV panels to improve the nutritional value of crabs in the aquavoltaic system.

Author Contributions

The experiments were designed by Y.C., Z.-w.W. and B.T., Y.P., Y.S., X.S. (Xiaozhe Song), X.S. (Xingliang Shi), A.-y.S. and L.W. assisted C.N. to complete several of the animal experiments. Analysis of the results and the manuscript writing were carried out by Y.P. The manuscript was reviewed and edited by X.Y. The funding resources came from Y.C. All authors have read and agreed to the published version of the manuscript.

Funding

We are grateful for the support of the National Key R&D Program of China (2019YFD0900105), the earmarked fund for CARS-48, the training plan for applied talents integrating industry and education—Collage of Future Technology, the National Natural Science Foundation of China (No. 41876190), the Aquaculture Engineering Research Platform in Shanghai Established by Shanghai Science and Technology Commission (19DZ2284300), the industry leading talent project of Yellow River Delta (DYRC20190210), and the program for Shanghai Collaborative Innovation Center for Cultivating Elite Breeds and Green-culture of Aquaculture Animals (No. 2021-KJ-02-12).

Institutional Review Board Statement

The study was conducted according to the guidelines of the Declaration of Helsinki and approved by the Institutional Review Board of Shanghai Ocean University for the care and use of laboratory animals (protocol code SHOU-DW-2019-056, 25 March 2019).

Informed Consent Statement

Not applicable.

Data Availability Statement

Data available on request due to restrictions eg privacy or ethical.

Conflicts of Interest

The authors declare no conflict of interest.

References

  1. IEA. Solar PV; IEA: Paris, France, 2021; Available online: https://www.iea.org/reports/solar-pv (accessed on 24 July 2022).
  2. NEA. The Installed Capacity of Photovoltaic Power Generation in China Has Exceeded 300 Million kW; National Energe Administration: Beijing, China, 2022. Available online: http://www.nea.gov.cn/2022-01/20/c_1310432517.htm (accessed on 24 July 2022).
  3. Calvert, K.; Pearce, J.M.; Mabee, W.E. Toward renewable energy geo-information infrastructures: Applications of GIScience and remote sensing that build institutional capacity. Renew. Sustain. Energy Rev. 2013, 18, 416–429. [Google Scholar] [CrossRef]
  4. Mamun, M.A.A.; Dargusch, P.; Wadley, D.; Zulkarnain, N.A.; Aziz, A.A. A review of research on agrivoltaic systems. Renew. Sustain. Energy Rev. 2022, 161, 112351. [Google Scholar] [CrossRef]
  5. Pringle, A.M.; Handler, R.M.; Pearce, J.M. Aquavoltaics: Synergies for dual use of water area for solar photovoltaic electricity generation and aquaculture. Renew. Sustain. Energy Rev. 2017, 80, 572–584. [Google Scholar] [CrossRef]
  6. Wang, T.-W.; Chang, P.-H.; Huang, Y.-S.; Lin, T.-S.; Yang, S.-D.; Yeh, S.-L.; Tung, C.-H.; Kuo, S.-R.; Lai, H.-T.; Chen, C.-C. Effects of floating photovoltaic systems on water quality of aquaculture ponds. Aquac. Res. 2022, 53, 1304–1315. [Google Scholar] [CrossRef]
  7. Li, P.; Gao, X.; Jiang, J.; Yang, L.; Li, Y. Characteristic analysis of water quality variation and fish impact study of fish-lighting complementary photovoltaic power station. Energies 2020, 13, 4822. [Google Scholar] [CrossRef]
  8. Arendt, J.D. Size-fecundity relationships, growth trajectories, and the temperature-size rule for ectotherms. Evolution 2011, 65, 43–51. [Google Scholar] [CrossRef] [PubMed]
  9. Chen, S.; Migaud, H.; Shi, C.; Song, C.; Wang, C.; Ye, Y.; Ren, Z.; Wang, H.; Mu, C. Light intensity impacts on growth, molting and oxidative stress of juvenile mud crab Scylla paramamosain. Aquaculture 2021, 545, 737159. [Google Scholar] [CrossRef]
  10. Yannicelli, B.; Castro, L. Ecophysiological constraints on the larvae of Pleuroncodes monodon and the implications for its reproductive strategy in poorly oxygenated waters of the Chile-Peru undercurrent. J. Plankton Res. 2013, 35, 566–581. [Google Scholar] [CrossRef]
  11. Tigan, G.; Mulvaney, W.; Ellison, L.; Schultz, A.; Hung, T.-C. Effects of light and turbidity on feeding, growth, and survival of larval Delta Smelt (Hypomesus transpacificus, Actinopterygii, Osmeridae). Hydrobiologia 2020, 847, 2883–2894. [Google Scholar] [CrossRef]
  12. Loisel, A.; Isla, A.; Daufresne, M. Variation of thermal plasticity in growth and reproduction patterns: Importance of ancestral and developmental temperatures. J. Therm. Biol. 2019, 84, 460–468. [Google Scholar] [CrossRef] [PubMed]
  13. Nebgen, E.L.; Herrman, K.S. Effects of shading on stream ecosystem metabolism and water temperature in an agriculturally influenced stream in central Wisconsin, USA. Ecol. Eng. 2019, 126, 16–24. [Google Scholar] [CrossRef]
  14. Wawrzyniak, V.; Allemand, P.; Bailly, S.; Lejot, J.; Piegay, H. Coupling LiDAR and thermal imagery to model the effects of riparian vegetation shade and groundwater inputs on summer river temperature. Sci. Total Environ. 2017, 592, 616–626. [Google Scholar] [CrossRef] [PubMed]
  15. Azra, M.N.; Aaqillah-Amr, M.A.; Ikhwanuddin, M.; Ma, H.; Waiho, K.; Ostrensky, A.; dos Santos Tavares, C.P.; Abol-Munafi, A.B. Effects of climate-induced water temperature changes on the life history of brachyuran crabs. Rev. Aquac. 2020, 12, 1211–1216. [Google Scholar] [CrossRef]
  16. Guo, Y.-R.; Gu, S.-Q.; Wang, X.-C.; Zhao, L.-M.; Zheng, J.-Y. Comparison of fatty acid and amino acid profiles of steamed Chinese mitten crab. Fish. Sci. 2014, 80, 621–633. [Google Scholar] [CrossRef]
  17. Wang, Z.; Zu, L.; Li, Q.; Jiang, X.; Xu, W.; Soyano, K.; Cheng, Y.; Wu, X. A comparative evaluation of the nutritional quality of Eriocheir sinensis and Eriocheir japonica (Brachyura, Varunidae). Crustaceana 2020, 93, 567–585. [Google Scholar] [CrossRef]
  18. Li, N.; Zhou, J.; He, C.; Fu, Y.; Wang, C.; Liu, L.; Meng, K.; Li, Y.; Zhu, Z.; Huang, L.; et al. GC-MS-based metabolomics reveal that light intensity during indoor overwintering affects the metabolism of Scylla paramamosain. Aquac. Res. 2020, 52, 1013–1025. [Google Scholar] [CrossRef]
  19. Liu, C.; Li, X.; Wu, C.; Wang, A.; Gu, Z. Effects of three light intensities on the survival, growth performance and biochemical composition of two size giant clams Tridacna crocea in the Southern China Sea. Aquaculture 2020, 528, 735548. [Google Scholar] [CrossRef]
  20. Li, Q.; Liu, Q.; Zhang, C.; Cheng, Y.; Wu, X. Can color-related traits in the Chinese mitten crab (Eriocheir sinensis) be improved through quantitative genetic inheritance? Aquaculture 2019, 512, 734355. [Google Scholar] [CrossRef]
  21. Parisenti, J.; Beirao, L.H.; Tramonte, V.L.C.G.; Ourique, F.; da Silveira Brito, C.C.; Moreira, C.C. Preference ranking of colour in raw and cooked shrimps. Int. J. Food Sci. Technol. 2011, 46, 2558–2561. [Google Scholar] [CrossRef]
  22. Jiao, L.; Dai, T.; Tao, X.; Lu, J.; Zhou, Q. Influence of light/dark cycles on body color, hepatopancreas metabolism, and intestinal microbiota homeostasis in Litopenaeus vannamei. Front. Mar. Sci. 2021, 8, 1741. [Google Scholar] [CrossRef]
  23. Han, D.; Xie, S.Q.; Lei, W.; Zhu, X.M.; Yang, Y.X. Effect of light intensity on growth, survival and skin color of juvenile Chinese longsnout catfish (Leiocassis longirostris Gunther). Aquaculture 2005, 248, 299–306. [Google Scholar] [CrossRef]
  24. Niu, C.; Wu, L.; Pang, Y.; Yang, X.; Song, Y.; Song, X.; Shi, A.; Shi, X.; Cheng, Y.; Wu, Z. Research on the effect of photovoltaic panels on the water environment and growth performance of Eriocheir sinensis. J. Fudan Univ. Nat. Sci. 2021, 60, 253–261. [Google Scholar]
  25. AOAC. Official Methods of Analysis; Association of Official Analytical Chemists: Gaithersburg, MD, USA, 2000. [Google Scholar]
  26. Blackburn, S. Amino Acid Determination. In Methods and Techniques; Marcel Dekker Inc.: New York, NY, USA; London, UK, 1968. [Google Scholar]
  27. Folch, J. A simple method for the isolation and purification of total lipides from animal tissues. J. Bid. Chem. 1957, 226, 497–509. [Google Scholar] [CrossRef]
  28. Jiang, X.; Wang, H.; Cheng, Y.; Wu, X. Growth performance, gonad development and nutritional composition of Chinese mitten crab Eriocheir sinensis selected for growth and different maturity time. Aquaculture 2020, 523, 735194. [Google Scholar] [CrossRef]
  29. Valles, R.; Estevez, A. Light conditions for larval rearing of meagre (Argyrosomus regius). Aquaculture 2013, 376, 15–19. [Google Scholar] [CrossRef]
  30. Esaka, Y.; Yoshioka, E.; Takeuchi, Y.; Hur, S.-P.; Takemura, A. Effect of light intensity and wavelength on diurnal activity of the banded coral shrimp Stenopus hispidus (Decapoda, Stenopodidae): A possible adaptation for a cleaner shrimp in reef environments. Pac. Sci. 2016, 70, 191–200. [Google Scholar] [CrossRef]
  31. Tan, B.Q. Production technology of preventing high temperature of Chinese mitten crab (Eriocheir sinensis) in summer. Fish. Guide Be Rich 2010, 17, 42. [Google Scholar]
  32. Cheng, Y.X.; Wu, X.G.; Li, J.Y. Chinese mitten crab culture: Current status and recent progress towards sustainable development. In Aquaculture in China; Gui, J.F., Tang, Q.S., Li, Z.J., Liu, J.S., Silva, S.S.D., Eds.; John and Wiley and Sons: Hoboken, NJ, USA, 2018; pp. 197–217. [Google Scholar]
  33. Martinez, F.J.; Garcia, M.P.; Canteras, M.; De Costa, J.; Zamora, S. Effect of simultaneous variation of weight, density, temperature and O2 concentration on rainbow trout (Oncorhynchus mykiss) body composition. Reprod. Nutr. Dev. 1992, 32, 105–112. [Google Scholar] [CrossRef] [PubMed]
  34. Roessler, P.G. Environmental control of glycerolipid metabolism in microalgae: Commercial implications and future research directions. J. Phycol. 2004, 26, 393–399. [Google Scholar] [CrossRef]
  35. Güroy, D.; Güroy, B.; Merrifield, D.L.; Ergün, S.; Tekinay, A.A.; Yiğit, M. Effect of dietary Ulva and Spirulina on weight loss and body composition of rainbow trout, Oncorhynchus mykiss (Walbaum), during a starvation period. J. Anim. Physiol. Anim. Nutr. 2011, 95, 320–327. [Google Scholar] [CrossRef] [PubMed]
  36. Huang, W.-P.; Chou, L.-S. Temperature effect on development and reproduction of the androdioecious clam shrimp, Eulimnadia braueriana (Branchiopoda: Spinicaudata). J. Crustacean Biol. 2015, 35, 330–338. [Google Scholar] [CrossRef]
  37. Dong, X.; Wang, G.; Hu, T.; Li, J.; Li, C.; Cao, Z.; Shi, M.; Wang, Y.; Zou, P.; Song, J.; et al. A novel virus of flaviviridae associated with sexual precocity in Macrobrachium rosenbergii. Msystems 2021, 6, e0000321. [Google Scholar] [CrossRef] [PubMed]
  38. Li, X.; Li, Z.; Liu, J.; De Silva, S.S. Advances in precocity research of the Chinese mitten crab Eriocheir sinensis. Aquac. Int. 2011, 19, 251–267. [Google Scholar] [CrossRef]
  39. Li, S.F.; Wang, C.H.; Zhao, N.G. Studies on gonad developmental rule of lake stocked mitten crab of Yangtze population. Acta Hydrobiol. Sin. 2001, 25, 350–357. [Google Scholar]
  40. Malambugi, A.; Yu, Z.; Zhu, W.; Wang, L.; Song, F.; Limbu, S.M.; Dong, Z. Effects of photoperiod on growth performance and melanogenesis pathway for skin pigmentation of Malaysian red tilapia. Aquac. Res. 2020, 51, 1824–1833. [Google Scholar] [CrossRef]
  41. Farhadi, S.; Kangarloei, B.A.; Imani, A.; Moghanlou, K.S. Biological impact of photoperiod on fairy shrimp (Branchinecta orientalis): Life history and biochemical composition. Biology 2021, 10, 695. [Google Scholar] [CrossRef]
  42. Anon. Sweet Tasting Amino Acid, Glycine, Enhances Flavor and Provides Functional Properties; Food Processing: San Francisco, CA, USA, 1983; Volume 44, p. 90. [Google Scholar]
  43. Meyer, S.; Dunkel, A.; Hofmann, T. Sensomics-assisted elucidation of the tastant code of cooked crustaceans and taste reconstruction experiments. J. Agric. Food Chem. 2016, 64, 1164–1175. [Google Scholar] [CrossRef] [PubMed]
  44. Li, N.; Zhou, J.; Wang, H.; Wang, C.; Mu, C.; Shi, C.; Liu, L. Effects of light intensity on growth performance, biochemical composition, fatty acid composition and energy metabolism of Scylla paramamosain during indoor overwintering. Aquac. Rep. 2020, 18, 100443. [Google Scholar] [CrossRef]
  45. Sushchik, N.N.; Zuev, I.V.; Kalachova, G.S.; Ageev, A.V.; Gladyshev, M.I. Content of highly unsaturated fatty acids in fish from rivers of contrasting temperature. River Res. Appl. 2018, 34, 565–574. [Google Scholar] [CrossRef]
  46. Maazouzi, C.; Masson, G.; Izquierdo, M.S.; Pihan, J.-C. Midsummer heat wave effects on lacustrine plankton: Variation of assemblage structure and fatty acid composition. J. Therm. Biol. 2008, 33, 287–296. [Google Scholar] [CrossRef]
  47. Fadhlaoui, M.; Couture, P. Combined effects of temperature and metal exposure on the fatty acid composition of cell membranes, antioxidant enzyme activities and lipid peroxidation in yellow perch (Perca flavescens). Aquat. Toxicol. 2016, 180, 45–55. [Google Scholar] [CrossRef]
  48. Hazel, J.R. The effect of temperature acclimation upon succinic dehydrogenase activity from the epaxial muscle of the common goldfish (Carassius auratus L.)—II. Lipid reactivation of the soluble enzyme. Comp. Biochem. Physiol. Part B Comp. Biochem. 1972, 43, 863–882. [Google Scholar] [CrossRef]
  49. Olsen, R.E.; Lie, E.L. The influence of temperature, dietary polyunsaturated fatty acids, α-tocopherol and spermine on fatty acid composition and indices of oxidative stress in juvenile Arctic char, Salvelinus alpinus (L.). Fish Physiol. Biochem. 1999, 20, 13–29. [Google Scholar] [CrossRef]
  50. Miliou, H.; Fintikaki, M.; Tzitzinakis, M.; Kountouris, T.; Verriopoulos, G. Fatty acid composition of the common octopus, Octopus vulgaris, in relation to rearing temperature and body weight. Aquaculture 2006, 256, 311–322. [Google Scholar] [CrossRef]
  51. Speers-Roesch, B.; Ip, Y.K.; Ballantyne, J.S. Plasma non-esterified fatty acids of elasmobranchs: Comparisons of temperate and tropical species and effects of environmental salinity. Comp. Biochem. Physiol. A Mol. Integr. Physiol. 2008, 149, 209–216. [Google Scholar] [CrossRef] [PubMed]
  52. Ozparlak, H. Effect of seasons on fatty acid composition and n-3/n-6 ratios of muscle lipids of some fish species in Apa Dam Lake, Turkey. Pak. J. Zool. 2013, 45, 1027–1033. [Google Scholar]
  53. Zhang, T.-T.; Xu, J.; Wang, Y.-M.; Xue, C.-H. Health benefits of dietary marine DHA/EPA-enriched glycerophospholipids. Prog. Lipid Res. 2019, 75, 100997. [Google Scholar] [CrossRef]
  54. Maoka, T. Carotenoids in marine animals. Mar. Drugs 2011, 9, 278–293. [Google Scholar] [CrossRef] [PubMed]
  55. Van der Salm, A.L.; Martínez, M.; Flik, G.; Wendelaar Bonga, S.E. Effects of husbandry conditions on the skin colour and stress response of red porgy, Pagrus pagrus. Aquaculture 2004, 241, 371–386. [Google Scholar] [CrossRef]
  56. Rajeswari, M.V.; Rajasree, S.R.R.; Balasubramanian, T. Effect of light levels on growth, survival and skin colour enhancement of marine angelfish, Apolemichthys xanthurus (Bennett, 1833). Turkish J. Fish. Aquat. Sci. 2017, 17, 1083–1087. [Google Scholar]
  57. Pavlidis, M.; Karkana, M.; Fanouraki, E.; Papandroulakis, N. Environmental control of skin colour in the red porgy, Pagrus pagrus. Aquac. Res. 2008, 39, 837–849. [Google Scholar] [CrossRef]
  58. Hallier, A.; Chevallier, S.; Serot, T.; Prost, C. Influence of farming conditions on colour and texture of European catfish (Silurus glanis) flesh. J. Sci. Food Agric. 2007, 87, 814–823. [Google Scholar] [CrossRef]
  59. Einen, O.; Thomassen, M.S. Starvation prior to slaughter in Atlantic salmon (Salmo salar): II. White muscle composition and evaluation of freshness, texture and colour characteristics in raw and cooked fillets. Aquaculture 1998, 169, 37–53. [Google Scholar] [CrossRef]
Figure 1. The mean body weight (A), weight gain rate (B), body length (C), and body width (D) of male and female crabs at the final sampling point (16 November 2019). The data are expressed as the means ± SD. The different lowercase letter above bars indicates significant difference between groups (p < 0.05).
Fishes 07 00207 g001
Figure 2. The mean hepatosomatic index (A), gonadosomatic index (B), meat yield (C), and total edible yield (D) of male and female crabs at the final sampling point (16 November 2019). The data are expressed as the means ± SD. The different lowercase letter above bars indicates significant difference between groups (p < 0.05).
Fishes 07 00207 g002
Figure 3. The ovaries of control group (A) and photovoltaic group (B) were photographed after freeze drying at the final sampling point (16 November 2019).
Fishes 07 00207 g003
Table 1. The proximate composition (% wet weight) of muscles, hepatopancreas, and gonads of the adult E. sinensis were analyzed. The data are expressed as the means ± SD. The different lowercase indicates significant difference between groups (p < 0.05).
TissuesItems (%)MaleFemale
ControlPhotovoltaicControlPhotovoltaic
MusclesMoisture79.46 ± 3.9581.46 ± 1.2177.44 ± 1.54 b80.39 ± 0.45 a
Crude Protein15.85 ± 3.3415.47 ± 1.1317.55 ± 1.4416.07 ± 0.33
Total Lipids0.79 ± 0.170.75 ± 0.130.97 ± 0.13 a0.78 ± 0.13 b
Ash1.70 ± 0.08 a1.55 ± 0.08 b1.98 ± 0.182.09 ± 0.11
HepatopancreasMoisture49.20 ± 6.34 b64.64 ± 7.07 a46.40 ± 5.8848.89 ± 3.50
Crude Protein6.35 ± 0.765.62 ± 0.366.67 ± 0.686.39 ± 0.44
Total Lipids45.03 ± 2.95 a20.13 ± 2.28 b43.51 ± 3.43 a19.44 ± 3.55 b
Ash1.11 ± 0.08 b1.57 ± 0.24 a1.01 ± 0.151.08 ± 0.14
GonadsMoisture72.47 ± 0.8173.09 ± 0.5950.74 ± 0.9652.92 ± 1.94
Crude Protein16.99 ± 0.5316.89 ± 0.0528.89 ± 0.6828.18 ± 0.92
Total Lipids0.75 ± 0.100.67 ± 0.1313.67 ± 1.2013.28 ± 1.31
Ash1.71 ± 0.12 a1.47 ± 0.04 b2.15 ± 0.242.03 ± 0.16
Table 2. The amino acid composition (% of total amino acids) in the muscles of adult crabs in the control, photovoltaic and freedom groups, respectively. The data are expressed as the means ± SD. The different lowercase indicates significant difference between groups (p < 0.05).
TissueAmino AcidsMaleFemale
ControlPhotovoltaicControlPhotovoltaic
MusclesThr3.96 ± 0.243.79 ± 0.152.71 ± 0.102.71 ± 0.08
Val4.23 ± 0.104.06 ± 0.192.94 ± 0.102.95 ± 0.08
Ile4.01 ± 0.133.92 ± 0.162.76 ± 0.102.78 ± 0.09
Leu6.64 ± 0.196.44 ± 0.254.65 ± 0.184.69 ± 0.15
Tyr3.73 ± 0.163.42 ± 0.312.65 ± 0.122.66 ± 0.06
Phe3.86 ± 0.103.65 ± 0.212.77 ± 0.132.75 ± 0.10
Met2.46 ± 0.10 a2.20 ± 0.29 b1.72 ± 0.071.70 ± 0.08
Lys6.59 ± 0.096.40 ± 0.174.00 ± 0.184.14 ± 0.16
Trp----
∑EAA35.47 ± 1.0433.88 ± 1.6324.18 ± 0.8824.37 ± 0.51
Arg8.82 ± 0.438.97 ± 0.358.23 ± 0.14 b8.75 ± 0.42 a
His2.43 ± 0.10 a2.23 ± 0.09 b1.85 ± 0.111.82 ± 0.09
∑SEAA11.26 ± 0.4411.20 ± 0.4210.07 ± 0.2010.58 ± 0.49
Asp8.76 ± 0.228.55 ± 0.496.04 ± 0.286.08 ± 0.20
Ser3.63 ± 0.203.64 ± 0.122.46 ± 0.052.52 ± 0.09
Glu14.03 ± 0.6013.64 ± 0.559.08 ± 0.309.30 ± 0.26
Ala6.01 ± 0.336.04 ± 0.404.45 ± 0.144.43 ± 0.08
Cys0.94 ± 0.040.80 ± 0.330.69 ± 0.030.73 ± 0.05
Pro4.56 ± 0.14 a3.59 ± 0.25 b4.04 ± 0.403.72 ± 0.39
Gly5.64 ± 0.18 b6.81 ± 0.50 a4.01 ± 0.17 b4.96 ± 0.27 a
∑NEAA43.56 ± 1.4443.07 ± 1.9630.77 ± 0.9931.75 ± 1.06
TAA90.28 ± 2.8488.15 ± 3.9565.03 ± 1.9766.69 ± 2.00
Note: ∑EAA: essential amino acids; ∑SEAA: semi-essential amino acids; ∑NEAA: non-essential amino acids; TAA: total content of 17 amino acids.
Table 3. The amino acid composition (% of total amino acids) in the hepatopancreas of adult crabs in the control, photovoltaic and freedom groups, respectively. The data are expressed as the means ± SD. The different lowercase indicates significant difference between groups (p < 0.05).
TissueAmino AcidsMaleFemale
ControlPhotovoltaicControlPhotovoltaic
HepatopancreasThr0.74 ± 0.121.18 ± 0.230.61 ± 0.140.71 ± 0.18
Val0.86 ± 0.131.30 ± 0.220.55 ± 0.360.83 ± 0.19
Ile0.67 ± 0.101.03 ± 0.180.56 ± 0.130.65 ± 0.17
Leu1.15 ± 0.191.82 ± 0.321.03 ± 0.241.18 ± 0.30
Tyr0.59 ± 0.12 b1.03 ± 0.26 a0.49 ± 0.140.60 ± 0.15
Phe0.78 ± 0.131.16 ± 0.200.67 ± 0.140.77 ± 0.17
Met0.08 ± 0.09 b0.46 ± 0.08 a0.13 ± 0.140.31 ± 0.11
Lys0.96 ± 0.141.45 ± 0.232.62 ± 0.343.33 ± 0.39
Trp----
∑EAA5.83 ± 1.029.42 ± 1.706.66 ± 1.418.35 ± 1.56
Arg1.03 ± 0.11 b1.59 ± 0.27 a1.30 ± 0.41 a0.01 ± 0.01 b
His0.64 ± 0.080.85 ± 0.120.66 ± 0.130.72 ± 0.12
∑SEAA7.55 ± 0.337.41 ± 0.246.10 ± 0.266.28 ± 0.13
Asp1.37 ± 0.252.15 ± 0.401.20 ± 0.281.41 ± 0.37
Ser0.60 ± 0.111.00 ± 0.200.53 ± 0.120.64 ± 0.18
Glu1.66 ± 0.282.74 ± 0.511.40 ± 0.351.67 ± 0.49
Ala0.89 ± 0.171.42 ± 0.220.72 ± 0.170.86 ± 0.20
Cys0.18 ± 0.08 b0.46 ± 0.11 a0.23 ± 0.060.23 ± 0.08
Pro0.83 ± 0.15 b1.22 ± 0.15 a0.88 ± 0.230.97 ± 0.29
Gly0.90 ± 0.171.44 ± 0.270.72 ± 0.200.86 ± 0.25
∑NEAA6.43 ± 1.2010.44 ± 1.825.57 ± 1.396.63 ± 1.83
TAA13.93 ± 2.4022.30 ± 3.9013.87 ± 3.2615.73 ± 3.48
Note: ∑EAA: essential amino acids; ∑SEAA: semi-essential amino acids; ∑NEAA: non-essential amino acids; TAA: total content of 17 amino acids.
Table 4. The amino acid composition (% of total amino acids) in the testis and ovaries of adult crabs in the control, photovoltaic and freedom groups, respectively. The data are expressed as the means ± SD. The different lowercase indicates significant difference between groups (p < 0.05).
TissueAmino AcidsMaleFemale
ControlPhotovoltaicControlPhotovoltaic
GonadsThr5.62 ± 0.365.75 ± 0.422.44 ± 0.122.32 ± 0.04
Val2.40 ± 0.182.22 ± 0.172.82 ± 0.112.92 ± 0.06
Ile2.84 ± 0.282.95 ± 0.282.13 ± 0.052.20 ± 0.08
Leu4.15 ± 0.434.26 ± 0.343.58 ± 0.13 b3.90 ± 0.11 a
Tyr2.12 ± 0.422.16 ± 0.192.13 ± 0.06 a1.41 ± 0.07 b
Phe2.51 ± 0.432.55 ± 0.222.25 ± 0.072.26 ± 0.07
Met0.55 ± 0.130.55 ± 0.051.35 ± 0.04 a0.95 ± 0.23 b
Lys2.96 ± 0.292.88 ± 0.213.98 ± 0.184.23 ± 0.57
Trp----
∑EAA23.14 ± 2.0823.31 ± 1.1820.69 ± 0.6620.18 ± 1.11
Arg2.83 ± 0.272.71 ± 0.124.57 ± 0.184.54 ± 0.10
His4.71 ± 0.194.70 ± 0.231.53 ± 0.08 b1.74 ± 0.06 a
∑SEAA7.55 ± 0.337.55 ± 0.337.55 ± 0.337.55 ± 0.33
Asp8.02 ± 0.378.22 ± 0.454.04 ± 0.163.99 ± 0.16
Ser2.98 ± 0.203.09 ± 0.132.62 ± 0.102.59 ± 0.06
Glu8.83 ± 0.268.85 ± 0.275.70 ± 0.275.52 ± 0.10
Ala3.97 ± 0.224.36 ± 0.312.18 ± 0.072.20 ± 0.03
Cys1.41 ± 0.211.60 ± 0.270.51 ± 0.04 a0.44 ± 0.07 b
Pro8.43 ± 0.778.85 ± 1.002.94 ± 0.20 a2.66 ± 0.05 b
Gly2.31 ± 0.13 b2.52 ± 0.11 a2.07 ± 0.092.09 ± 0.03
∑NEAA35.96 ± 1.7937.49 ± 2.1620.05 ± 0.8619.49 ± 0.35
TAA66.65 ± 3.9168.21 ± 3.2746.84 ± 1.7645.94 ± 1.58
Note: ∑EAA: essential amino acids; ∑SEAA: semi-essential amino acids; ∑NEAA: non-essential amino acids; TAA: total content of 17 amino acids.
Table 5. Fatty acid composition (% total fatty acids) in muscle and hepatopancreas of male crabs in the control, photovoltaic and freedom groups. The data are expressed as the means ± SD. The different lowercase indicates significant difference between groups (p < 0.05).
Fatty AcidsMusclesHepatopancreas
ControlPhotovoltaicControlPhotovoltaic
C14:00.09 ± 0.02 a0.07 ± 0.01 b0.78 ± 0.05 a0.60 ± 0.10 b
C15:00.10 ± 0.030.09 ± 0.010.38 ± 0.020.37 ± 0.07
C16:05.86 ± 0.126.08 ± 0.3510.66 ± 0.2911.00 ± 0.55
C17:00.45 ± 0.090.37 ± 0.020.70 ± 0.100.63 ± 0.06
C18:04.99 ± 0.43 a4.46 ± 0.35 b2.67 ± 0.172.24 ± 0.37
C20:00.41 ± 0.090.40 ± 0.050.24 ± 0.01 b0.45 ± 0.07 a
C22:00.46 ± 0.100.50 ± 0.030.22 ± 0.05 b0.38 ± 0.08 a
∑SFA12.37 ± 0.5211.97 ± 0.1715.60 ± 0.2615.74 ± 0.22
C16:1n-71.79 ± 0.331.90 ± 0.778.37 ± 0.917.96 ± 2.44
C17:1n-70.34 ± 0.080.28 ± 0.030.80 ± 0.080.78 ± 0.26
C18:1n-916.89 ± 0.97 a15.17 ± 0.73 b29.58 ± 0.37 a26.64 ± 0.82 b
C18:1n-72.54 ± 0.05 a1.79 ± 0.16 b1.53 ± 0.261.96 ± 0.18
C20:1n-90.94 ± 0.06 a0.79 ± 0.04 b3.20 ± 0.68 a2.26 ± 0.27 b
C22:1n-90.29 ± 0.09 a0.05 ± 0.02 b0.61 ± 0.070.82 ± 0.04
∑MUFA22.67 ± 1.34 a20.02 ± 1.45 b44.08 ± 0.8138.78 ± 4.26
C18:2n-6 (LA)11.27 ± 2.3013.53 ± 1.6417.22 ± 1.2317.07 ± 3.59
C18:3n-3 (LNA)1.74 ± 0.222.26 ± 0.873.30 ± 0.522.51 ± 0.87
C20:2n-62.75 ± 0.412.75 ± 0.191.81 ± 0.282.43 ± 0.61
C20:3n-60.19 ± 0.050.21 ± 0.100.63 ± 0.20 a0.37 ± 0.03 b
C20:3n-30.92 ± 0.371.03 ± 0.180.73 ± 0.200.80 ± 0.15
C20:4n-6 (ARA)9.07 ± 2.3010.07 ± 1.531.87 ± 0.362.16 ± 0.94
C20:5n-3 (EPA)18.69 ± 1.8416.98 ± 1.512.30 ± 1.611.61 ± 0.38
C22:5n-30.63 ± 0.090.71 ± 0.050.72 ± 0.14 a0.46 ± 0.02 b
C22:6n-3 (DHA)15.11 ± 0.9614.88 ± 0.853.70 ± 0.35 a2.02 ± 0.15 b
∑PUFA60.37 ± 1.3762.42 ± 1.5932.35 ± 0.8030.22 ± 2.74
∑n-6 PUFA23.28 ± 0.40 b26.56 ± 1.16 a21.53 ± 0.8823.19 ± 1.44
∑n-3 PUFA37.09 ± 1.4835.87 ± 1.5910.82 ± 1.04 a7.72 ± 0.84 b
n-3/n-6 PUFA1.59 ± 0.08 a1.35 ± 0.10 b0.50 ± 0.060.32 ± 0.04
DHA/EPA0.82 ± 0.110.88 ± 0.051.61 ± 0.101.32 ± 0.38
Note: ∑SFA: sum of saturated fatty acids; ∑MUFA: sum of monounsaturated fatty acids; ∑PUFA: sum of polyunsaturated fatty acids; ∑n-6 PUFA: sum of n-6 long-chain polyunsaturated fatty acids; ∑n-3 PUFA: sum of n-3 long-chain polyunsaturated fatty acids; ∑HUFA: sum of highly unsaturated fatty acids; ∑n-3 HUFA: sum of n-3 very long-chain polyunsaturated fatty acids; ∑n-3 HUFA: sum of n-3 very long-chain polyunsaturated fatty acids. n-3/n-6 PUFA: ratio of ∑n-3 PUFA to ∑n-6 PUFA; DHA/EPA: ratio of C22:6n-3 to C20:5n-3.
Table 6. Fatty acid composition (% total fatty acids) in muscle and hepatopancreas of male crabs in the control, photovoltaic and freedom groups. The data are expressed as the means ± SD. The different lowercase indicates significant difference among the three groups (p < 0.05).
Fatty AcidsMusclesHepatopancreasOvaries
ControlPhotovoltaicControlPhotovoltaicControlPhotovoltaic
C14:00.10 ± 0.010.09 ± 0.010.79 ± 0.090.83 ± 0.090.41 ± 0.050.39 ± 0.03
C15:00.09 ± 0.005 b0.10 ± 0.01 a0.37 ± 0.06 b0.51 ± 0.09 a0.20 ± 0.020.27 ± 0.05
C16:06.32 ± 0.206.23 ± 0.2811.07 ± 0.6711.26 ± 0.388.04 ± 0.237.87 ± 0.45
C17:00.37 ± 0.050.43 ± 0.070.60 ± 0.12 b0.93 ± 0.31 a0.33 ± 0.100.37 ± 0.04
C18:04.46 ± 0.064.30 ± 0.252.02 ± 0.412.25 ± 0.252.86 ± 0.342.69 ± 0.16
C20:00.40 ± 0.050.39 ± 0.040.12 ± 0.03 b0.11 ± 0.01 b0.17 ± 0.03 b0.18 ± 0.05 b
C22:00.46 ± 0.090.52 ± 0.100.21 ± 0.030.33 ± 0.080.07 ± 0.01 b0.30 ± 0.003 a
∑SFA12.20 ± 0.1812.07 ± 0.3015.33 ± 0.6716.28 ± 0.8712.04 ± 0.2511.99 ± 0.37
C16:1n-72.63 ± 0.262.51 ± 0.208.95 ± 1.889.10 ± 0.908.73 ± 1.929.41 ± 0.65
C17:1n-70.33 ± 0.040.36 ± 0.070.81 ± 0.12 b1.03 ± 0.17 a0.62 ± 0.07 b0.78 ± 0.08 a
C18:1n-918.91 ± 0.49 a17.18 ± 1.19 b29.63 ± 0.6227.07 ± 2.1523.29 ± 1.6323.41 ± 0.81
C18:1n-72.37 ± 0.062.22 ± 0.212.07 ± 0.171.99 ± 0.222.90 ± 0.24 a2.80 ± 0.26 a
C20:1n-90.92 ± 0.080.91 ± 0.082.40 ± 0.16 b2.91 ± 0.42 a0.51 ± 0.08 b1.18 ± 0.12 a
C22:1n-90.05 ± 0.0030.07 ± 0.010.51 ± 0.100.43 ± 0.130.13 ± 0.020.15 ± 0.03
∑MUFA25.27 ± 0.72 a23.26 ± 1.45 b43.28 ± 3.7542.53 ± 2.8436.29 ± 3.5737.59 ± 0.56
C18:2n-6 (LA)12.56 ± 0.5112.76 ± 0.8717.27 ± 2.4815.86 ± 1.7614.74 ± 0.33 c16.38 ± 1.03 b
C18:3n-3 (LNA)1.70 ± 0.231.94 ± 0.163.01 ± 0.352.77 ± 0.403.24 ± 1.044.12 ± 0.75
C20:2n-62.45 ± 0.452.58 ± 0.292.06 ± 0.16 b2.81 ± 0.68 a1.52 ± 0.04 b2.42 ± 0.75 a
C20:3n-60.15 ± 0.020.17 ± 0.350.45 ± 0.080.46 ± 0.110.24 ± 0.030.31 ± 0.10
C20:3n-30.77 ± 0.110.80 ± 0.100.76 ± 0.07 a0.13 ± 0.01 b0.73 ± 0.180.93 ± 0.07
C20:4n-6 (ARA)7.42 ± 0.69 b8.73 ± 1.03 a1.58 ± 0.171.66 ± 0.554.47 ± 0.544.63 ± 0.50
C20:5n-3 (EPA)16.19 ± 0.6216.24 ± 0.46 1.84 ± 0.281.63 ± 0.637.44 ± 1.407.22 ± 1.17
C22:5n-30.78 ± 0.050.84 ± 0.140.54 ± 0.040.45 ± 0.110.77 ± 0.110.78 ± 0.11
C22:6n-3 (DHA)14.47 ± 1.4413.68 ± 0.922.57 ± 0.232.38 ± 0.516.45 ± 1.215.55 ± 0.85
∑PUFA56.49 ± 1.2357.75 ± 1.9231.04 ± 2.0929.75 ± 1.7741.13 ± 2.0642.34 ± 1.93
∑n-6 PUFA22.58 ± 0.80 b24.25 ± 1.35 a22.33 ± 2.5821.09 ± 2.0322.50 ± 1.5023.75 ± 0.48
∑n-3 PUFA33.91 ± 1.7533.50 ± 1.108.71 ± 0.737.28 ± 1.4618.64 ± 3.5118.59 ± 1.87
n-3/n-6 PUFA1.55 ± 0.06 a1.36 ± 0.06 b0.40 ± 0.070.34 ± 0.040.84 ± 0.200.78 ± 0.08
DHA/EPA0.89 ± 0.080.84 ± 0.051.41 ± 0.161.42 ± 0.270.87 ± 0.100.77 ± 0.05
Note: ∑SFA: sum of saturated fatty acids; ∑MUFA: sum of monounsaturated fatty acids; ∑PUFA: sum of polyunsaturated fatty acids; ∑n-6 PUFA: sum of n-6 long-chain polyunsaturated fatty acids; ∑n-3 PUFA: sum of n-3 long-chain polyunsaturated fatty acids; ∑HUFA: sum of highly unsaturated fatty acids; ∑n-3 HUFA: sum of n-3 very long-chain polyunsaturated fatty acids; ∑n-3 HUFA: sum of n-3 very long-chain polyunsaturated fatty acids. n-3/n-6 PUFA: ratio of ∑n-3 PUFA to ∑n-6 PUFA; DHA/EPA: ratio of C22:6n-3 to C20:5n-3.
Table 7. The hepatopancreas and ovary coloration of adult Eriocheir sinensis. The data are expressed as the means ± SD. The different lowercase indicates significant difference among the three groups (p < 0.05).
SexSamplesItemsControlPhotovoltaic
MaleHepatopancreas (wet)L*53.55 ± 0.4752.03 ± 2.13
a*22.98 ± 2.2724.63 ± 4.29
b*53.39 ± 1.5553.92 ± 2.15
Hepatopancreas (dry)L*39.04 ± 1.9238.77 ± 1.67
a*20.43 ± 2.221.79 ± 1.49
b*32.33 ± 6.3132.28 ± 2.97
FemaleHepatopancreas (wet)L*53.55 ± 2.3253.28 ± 3.44
a*24.35 ± 2.03 a21.64 ± 0.85 b
b*52.92 ± 0.54 a48.08 ± 2.65 b
Hepatopancreas (dry)L*37.17 ± 1.7136.33 ± 1.41
a*18.27 ± 1.8818.89 ± 2.21
b*30.45 ± 2.8330.07 ± 2.20
Ovaries (dry)L*62.13 ± 1.55 b64.41 ± 1.13 a
a*29.61 ± 0.7928.19 ± 1.45
b*50.35 ± 1.9251.33 ± 2.05
Note: L* represents the luminance value from 0 (black) to 100 (white); a* represents the color saturation of red and green axes, where −a* is green and +a* is red; b* represents the color saturation of blue and yellow axes, where −b* is blue and +b* is yellow.
Publisher’s Note: MDPI stays neutral with regard to jurisdictional claims in published maps and institutional affiliations.

