Article

Automatic Fish Age Determination across Different Otolith Image Labs Using Domain Adaptation

1
Norwegian Computing Center, 0373 Oslo, Norway
2
Institute of Marine Research, 9294 Tromsø, Norway
3
Marine and Freshwater Research Institute, 220 Hafnarfjordur, Iceland
*
Author to whom correspondence should be addressed.
Fishes 2022, 7(2), 71; https://doi.org/10.3390/fishes7020071
Submission received: 14 February 2022 / Revised: 15 March 2022 / Accepted: 17 March 2022 / Published: 18 March 2022
(This article belongs to the Special Issue Otoliths and Their Applications in Fishery Science)

Abstract

:
The age determination of fish is fundamental to marine resource management. This task is commonly done by analysis of otoliths performed manually by human experts. Otolith images from Greenland halibut acquired by the Institute of Marine Research (Norway) were recently used to train a convolutional neural network (CNN) for automatically predicting fish age, opening the way for requiring less human effort and availability of expertise by means of deep learning (DL). In this study, we demonstrate that applying a CNN model trained on images from one lab (in Norway) does not lead to a suitable performance when predicting fish ages from otolith images from another lab (in Iceland) for the same species. This is due to a problem known as dataset shift, where the source data, i.e., the dataset the model was trained on have different characteristics from the dataset at test stage, here denoted as target data. We further demonstrate that we can handle this problem by using domain adaptation, such that an existing model trained in the source domain is adapted to perform well in the target domain, without requiring extra annotation effort. We investigate four different approaches: (i) simple adaptation via image standardization, (ii) adversarial generative adaptation, (iii) adversarial discriminative adaptation and (iv) self-supervised adaptation. The results show that the performance varies substantially between the methods, with adversarial discriminative and self-supervised adaptations being the best approaches. Without using a domain adaptation approach, the root mean squared error (RMSE) and coefficient of variation (CV) on the Icelandic dataset are as high as 5.12 years and 28.6%, respectively, whereas by using the self-supervised domain adaptation, the RMSE and CV are reduced to 1.94 years and 11.1%. We conclude that careful consideration must be given before DL-based predictors are applied to perform large scale inference. Despite that, domain adaptation is a promising solution for handling problems of dataset shift across image labs.

1. Introduction

Otoliths are small calcium carbonate structures that form part of the balance organ in the inner ear of fish [1]. Due to their rich content of various information, they could be referred to as the “tachograph” of the fish. Fish otolith sciences have evolved in a range of research fields, from paleontology to stock discrimination and fish age determination. For example, the isotopic fingerprints of fish otoliths have proven to give insight into the water bodies which have been previously occupied by fish [2]. In this area, fish otoliths as old as 172 million years have been used [3]. Otoliths have also been used to distinguish different species. This has been, for instance, useful for studying the diet of sea mammals [4] or seabirds [5] by examining otoliths from feces samples. Other interesting studies have been carried out for long-lived fish in the Pacific [6], where radio-carbon data obtained from otoliths have provided valuable information on carbon flux in the oceans and have also been used to validate fish age.
When it comes to fish age determination, otolith images from captured fish are manually read, with in the order of a million images read every year [7]. Age-readers count age zones analogous to counting age rings in a tree, typically using a microscope or high-resolution images. However, this process is challenging and time-consuming [8]. During the last decades, automatic techniques have been proposed to automate this tedious activity (e.g., [9]). More recently, the use of deep learning (DL) has received more and more attention with promising results shown for Greenland halibut [10,11], snapper and hoki [12], red mullet [13] and Atlantic salmon [14].
However, the construction of DL systems can be challenged and hindered by several factors. The developed system trained at one otolith image lab where it works well, may not necessarily work well when applied to otolith images from another lab for the same species. In such cases, the system may have trouble generalizing to unseen data from another lab, due to data characteristics that are different from those at the training stage.
The discrepancy between data coming from different labs may have a range of explanations. From personal communication with reader experts the following was noted: different countries manage stocks that might have otoliths with varying readabilities due to different fish environments and catch seasons. Ages may also be read using thin sectioning of otoliths in some labs instead of reading the whole otolith (e.g., for Greenland halibut). The conservation and preparation of the otoliths might influence the age readability as well, one option being the storage of the otolith in an envelope and another being to freeze the otolith in water [15]. Camera quality, lighting conditions and other imaging setup conditions may also affect image characteristics, in addition to the magnifying glass equipment.
Acquiring new annotations such that it is possible to train the DL system with a more diverse dataset can also be challenging, both in terms of effort and availability of expertise. This process requires trained age-reading experts. Multiple methods are employed to minimize error, such as age-reading workshops where age determined by different readers from various labs are compared [16]. Reference otoliths are also used in training and are periodically reread by readers to ensure consistency [17]. Lack of highly trained age-reading experts can nevertheless lead to backlogs of otoliths that have not been annotated.
To address those challenges and increase the willingness to automate the age-reading using DL, it could be of interest to show that an already trained system could generalize to novel otolith images coming from other labs, while not requiring extra annotation effort.
The challenging situation where we observe different characteristics between the data the model was trained on and the data used at test stage is often referred to as dataset shift [18,19]. Training a classifier which performs well in this scenario can be addressed using domain adaptation (DA) [20], i.e., adapting models trained on data from a source domain to a different domain, known as the target domain. DA is typically carried out in a setting where the training data from the source domain is labelled, but little or no labels are available from the target domain. The case where we do not have labels at all in the target domain is commonly described as unsupervised domain adaptation (UDA). As we could more frequently face the scenario where we would like to test trained models on unlabeled otolith images, in this paper, we will consider solving a UDA task for automating fish age determination across different image labs, using DL.
There has been an effort made to develop deep neural networks that could handle UDA. In a recent review study, Zhao et al. [21] divided UDA approaches into four categories: (i) discrepancy-based, (ii) adversarial discriminative methods, (iii) adversarial generative methods and (iv) self-supervised methods. The approaches from the two adversarial categories were said to score best on performance and have been very popular. The discrepancy-based approaches were said to have lower performance and be less applicable to complex datasets, while the self-supervision-based methods represented a class of newer approaches that were shown to be robust and applicable to complex datasets.
Based on this, the aim of this work has been to investigate different UDA approaches from categories (ii)–(iv). We intended to see how they performed for the problem of generalizing a model trained for fish age prediction on otolith images from a lab in one country, to do prediction on images from a different lab in a different country, without new manual annotation.
The experiments were carried out based on otolith images from Greenland halibut acquired by the Institute of Marine Research (Norway) and the Marine and Freshwater Research Institute (Iceland). We adapted a trained network using otolith images and labels from the Norwegian lab (source domain) to otolith images coming from the Icelandic lab (target domain).

2. Materials and Methods

2.1. Data

The source and target datasets were collected by the Institute of Marine Research (Norway) and by the Marine and Freshwater Research Institute (Iceland), respectively.
The source dataset was a subset of the one described in Moen et al. [10], it consisted of 4109 images of paired right and left otoliths (collected between 2006 and 2017) having a resolution of 2596 × 1944 pixels. Each otolith pair was separated leading to 8218 single right and left otolith images, with labeled ages ranging from 1 to 26 years. Only ages read by two experienced readers from the same lab were used and only one reader for each otolith. Co-readings between the two readers revealed a negligible between-reader bias, independent of age.
The target dataset was composed of 3501 right otolith images, that were obtained from images of paired right and left otoliths having a resolution of 2048 × 1536 pixels. The otoliths were collected between 2015 and 2020 from the Icelandic autumn ground fish survey [22] and labeled ages ranged from 1 to 20 years. The ages were determined by a single reader.
Examples of image variation across the Norwegian and the Icelandic lab are shown in Figure 1, where one can observe some differences in terms of background, lighting conditions and magnification. The age distribution estimated by readers for the Icelandic dataset was such that the age label space was inside the range of the label space estimated by the Norwegian lab (Figure 2).

2.2. UDA for Age Classification

We considered three different UDA approaches (Figure 3) to adapt an existing age classification system for otolith images to a new target domain, such that we could still have a suitable classification performance. For that, we exploited images from a source domain D S and a target domain D T as well as labels only from D S . Common for the three approaches was a weight sharing constraint between a feature extractor for the D S images and the D T images, allowing us to learn a domain-invariant feature space. Another common module was the classifier learned from the D S data. Since the output of the feature extractor was supposed to be domain-invariant after being optimized during the training process, we expected that using that module together with the classifier could produce meaningful age predictions on images from D T .

2.2.1. Adversarial Generative Adaptation

The first method we used was a generative adversarial adaptation (Figure 3a), based on the coupled generative adversarial networks (CoGAN) proposed by Liu and Tuzel [23]. It consists of a pair of GANs and the idea of using more than one GAN was compelling to us by its originality. Moreover, the method showed promising results on UDA tasks when it was introduced [23].
Our CoGAN had generators that synthesized images by taking as input a 100-dimensional noise vector. We used the same networks as proposed in the implementation taken from [24].
Feature extractors were used to output feature representations for the discriminators. The architecture of the feature extractors was based on the commonly used convolutional neural network (CNN) ResNet [25] and took images with the default input size of 224 × 224 pixels. Those networks were initialized using the weights from the source-CNN (excluding the last classification layer), i.e., the CNN model trained to classify otolith ages using images and labels from D S . The discriminator models were simply estimating the probabilities that the generated images were real or synthesized for each of the domains.
Following [23], we tied the weights of the first few layers of the generators as well as the weights from the feature extractors. This weight sharing allowed us to learn a domain-invariant feature space, without requiring the existence of any pairs of corresponding images in the two domains. For classifying otolith ages, the classifier was added to the feature extractor and corresponded to the last layer of the ResNet model.
We trained the whole architecture by jointly solving the CoGAN learning problem (CoGAN related loss [23]), involving images from D S and D T and the age classification problem in D S (cross-entropy classification loss).

2.2.2. Adversarial Discriminative Adaptation

The second method was an adversarial discriminative adaptation (Figure 3b) and differed from the previous approach in that it did not require generators. The implementation followed the state-of-the-art method conditional adversarial domain adaptation (CDAN) proposed by Long et al. [26]. As in the previous approach, the feature extractor was initialized with the weights of the source-CNN model (taking input images of size 224 × 224) and therefore shared the same architecture (excluding the last classification layer). The classifier predictor corresponded to the last layer of the ResNet model. The discriminator was a multilayer perceptron with two hidden layers having ReLU as a non-linear activation function. It received an input x defined as a joint variable of the extracted feature representations and the classifier predictions. This network architecture ( x 1024   1024   2 ) was used to classify whether the input was coming from D S or D T . The size of the hidden layers was chosen to match the default implementation of CDAN available from [27].
This architecture was trained to solve a minimax optimization problem. The term to be minimized included the cross-entropy classification loss (using data and labels from D S ), combined with the adversarial loss derived from the discriminator which tried to match the distribution of the source and target domains involving images from D S and D T (we followed [26] and fixed the combination parameter to 1). This last term relating to the discriminator was the one that was also maximized in the minimax optimization problem (see [26] for further details).

2.2.3. Self-Supervised Adaptation

The last method we chose to test for UDA used self-supervision (Figure 3c) and differed from the previous approach in that the discriminator component was replaced by a pretext network. In self-supervised learning, a supervised task is created out of the unlabeled original data. Typically, the original images are transformed and the pretext network needs to learn how to predict certain aspects related to the transformations. Predicting image rotations [28], solving a jigsaw puzzle [29], retrieving colors from grayscale images [30] are examples of pretext tasks. The idea of including the pretext network was to be able to learn again a domain invariant feature representation using unlabeled otolith images from the source and target domains.
We based our implementation on the generic method proposed by Xu et al. [31] and available from [32]. As carried out in [31], we initially experimented with image rotation prediction as a pretext task. However, the pretext network was rapidly finding the solution during training and the learned feature representations from the otolith images did not help for DA. We decided instead to select a more challenging pretext task, using the simple framework for contrastive learning of visual representation (SimCLR) proposed by Chen et al. [33]. This method was chosen for its simplicity of implementation and its good performance that achieved significant advances in state-of-the-art self-supervised learning. In SimCLR, the pretext network is trained to recognize positive samples, i.e., different augmented views of the same image and distinguish them from the negatives, i.e., augmented views of other images from the dataset. We followed the recommendations from [33] and used random cropping, resizing, color distortions and Gaussian blur as data augmentations. The pretext network was a multilayer perceptron with one hidden layer having a ReLU as non-linearity. The network received as input extracted features x from the ResNet model feature extractor and outputted a 26-dimensional feature representation ( x 512   512   26 ). The size of the hidden layer and the output were chosen to match the default implementation of SimCLR available from [34]. As for the adversarial approaches, the feature extractor was initialized with the weights of the source-CNN model.
The architecture of the self-supervised adaptation was trained to learn jointly the pretext task (using unlabeled images from D S and D T ) and the age classification task, where the classifier predictor received images and labels from D S . The losses relating to each of the tasks were added and minimized during training. The pretext task loss was the InfoNCE loss [35], which is a popular choice of loss function for contrastive learning aiming to pull feature representations that are close and push away representations that are different. As pointed out by [33], learning such a task benefits from having large batch sizes such that a large number of negative samples is obtained for comparison with every single positive sample. To be able to use contrastive learning to our advantage for DA, the feature extractor took as input images of size 96 × 96 pixels (instead of 224 × 224), ensuring a sufficiently large batch size.

2.2.4. Implementation Details

We implemented the above methods using the PyTorch framework on a single GTX 1080 Ti GPU with 11 GB memory. For a fair comparison, we used the same ResNet architecture for the feature extractors. Given our hardware resources, we chose a ResNet18 to be able to choose a large batch size for the self-supervised adaptation. For the layers that were not part of the feature extractors (initialized using the Source-CNN), the initialization was done using random values scaled according to the method proposed in [36]. For each of the models, we ran five trials where different random number generators were used for the initialization. This helped in building a certain confidence in the performance of the different algorithms when comparing them, by checking whether or not the results were obtained by chance (consistency of the model).
For all the approaches, we followed Moen et al. [10] and used a constant learning rate of 0.0004 and the Adam optimizer [37]. For adversarial DA approaches, we checked the default parameters from the CoGAN implementation taken from [38] and chose a batch size of 64. As self-supervised learning benefits from large batch sizes [33], we chose a batch size of 512 (according to our computing resources). For all the methods, a number of 200 epochs was selected.

2.3. Other Considered Classifiers

To better understand how the three UDA approaches performed, we considered comparing them with other classifiers, all defined by a ResNet18 architecture that was trained either on image data acquired from the Norwegian lab or the Icelandic lab.
First, we considered ResNet18 networks trained on otolith images acquired and annotated by the Norwegian lab. The models classified ages into one of the 26 categories (from 1 to 26 years as defined by the labels from the source dataset) and the classification was performed on two versions of resized images: 224 × 224 and 96 × 96. We directly deployed these models on otolith images from the Icelandic lab, without any adaptation or finetuning. These experiments were referred to as the lower performance bound, as we expected them not to perform that well on the target data given the observed image variation across the Norwegian and the Icelandic lab (Figure 1). We also applied these models on the Norwegian source data and we denoted the experiments as the Norwegian bound.
Next, we considered ResNet18 networks trained on the Icelandic data, where during training, we used the age labels provided by Iceland. This provided us with a higher performance bound, as we expected to have better results than not using labels from Iceland at all. These models classified ages into one of the 20 categories (from 1 to 20 years as defined by the labels from the target dataset).
Finally, we considered a model where we performed a simpler domain adaptation via a standardization preprocessing step. This was a semi-automatic approach derived by practitioners with the aim of reducing the variability in background and resolution between labs. The approach was based on a semi-automatic thresholding to remove the background. Then, images were resized so that the vertical extension of the otolith covered 90% of the vertical extension of the image. After standardizing the otolith images, we trained the ResNet18 models on the Norwegian dataset (images of size 224 × 224 and 96 × 96) and deployed them on the preprocessed images from Iceland. This provided us with another domain adaptation approach denoted standardization. It was simpler than the three other considered UDA methods (Figure 3) that required both images from the Norwegian and the Icelandic labs when training. Examples of standardized images are shown in Figure 4.
For all the above models, a small validation set was used to choose the batch size (128) and to control when to terminate the training process, setting a maximum number of epochs of 150, as done in Moen et al. [10]. For the experiments denoted as lower performance bound, Norwegian bound and the standardization approach, the validation set was extracted from the source dataset, whereas for the higher performance bound we used a validation set extracted from the target data. We chose the same learning rate/optimizer as for the UDA approaches and we ran five trials for each of the models. For each trial, different random number generators were used for the initialization of the networks that also followed the method from [36].
A summary of the different experiments carried out in this study, with their corresponding characteristics is reported in Table 1.

2.4. Performance Measurement

For assessing the performance of the different classifiers, we considered as carried out in [11] the root mean squared error (RMSE) between age prediction and read age, as well as the mean coefficient of variation (CV) of independent estimators (human and DL system) calculated for each given otolith. For both metrics, the lower the values the better.

3. Results

The results from our experiments are summarized in Table 2 and Table 3 and also illustrated in Figure 5, Figure 6 and Figure 7. Rows 1 and 2 of Table 2 report the performance of age prediction by experimenting with the Norwegian bound, where models were trained and tested on otolith images acquired and annotated by the Norwegian lab. The classification was performed on the two versions of resized images: 224 × 224 and 96 × 96. Reasonably good RMSE/CV results were obtained considering five different trials (with relatively low variation over these splits 0.10 for the RMSE) and were comparable to the earlier study of Moen et al. [10] (RMSE = 1.65 years. and CV = 9%), although they tested on a smaller dataset. Resizing the images to different resolutions had a very limited effect on the performance.
Rows 3 and 4 of Table 2 report the results on the lower performance bound experiments, showing that without any DA involved, the performance on the Icelandic data was considerably lower than for the Norwegian data. In addition, a larger variation in performance was observed over the different trials ( 0.5 for the RMSE). The last two rows of Table 2 correspond to the higher performance bound. They demonstrated the potential for using a DL system to predict ages on the target data from the Icelandic lab, where good levels of RMSE/CV together with low variations over the five trials ( 0.04 for the RMSE) were achieved when training on these data. These observations were supported by the age-bias plots of Figure 5 displaying the age predictions (median over the five trials) of the lower and higher performance bounds (using images of size 224 × 224) against the human annotated age for the Icelandic data. We could observe that the lower performance bound (Figure 5a) completely overestimated the ages. The higher performance bound results were satisfactory (Figure 5b), although we noticed an underestimation for the older age groups, similar to that which was previously observed for the Norwegian data [10,11].
In Table 3, we report the performance results obtained for the DA task, i.e., involving models trained on otolith images and labels from the Norwegian lab adapted to images from the Icelandic lab. For the different methods, we also visualize in Figure 6 the spread of the results for each of the five trials, represented as black dots. To be able to visualize the gap between domain adaptation methods and the higher and lower performance bounds that were tested on Icelandic images, each experiment was represented inside a gray bar. This was delimited to the left by the averaged RMSE/CV from the higher performance bound and to the right by the averaged results of the lower performance bound. In addition to this, a closer inspection of the age predictions for the different methods is presented in the age-bias plots of Figure 7.
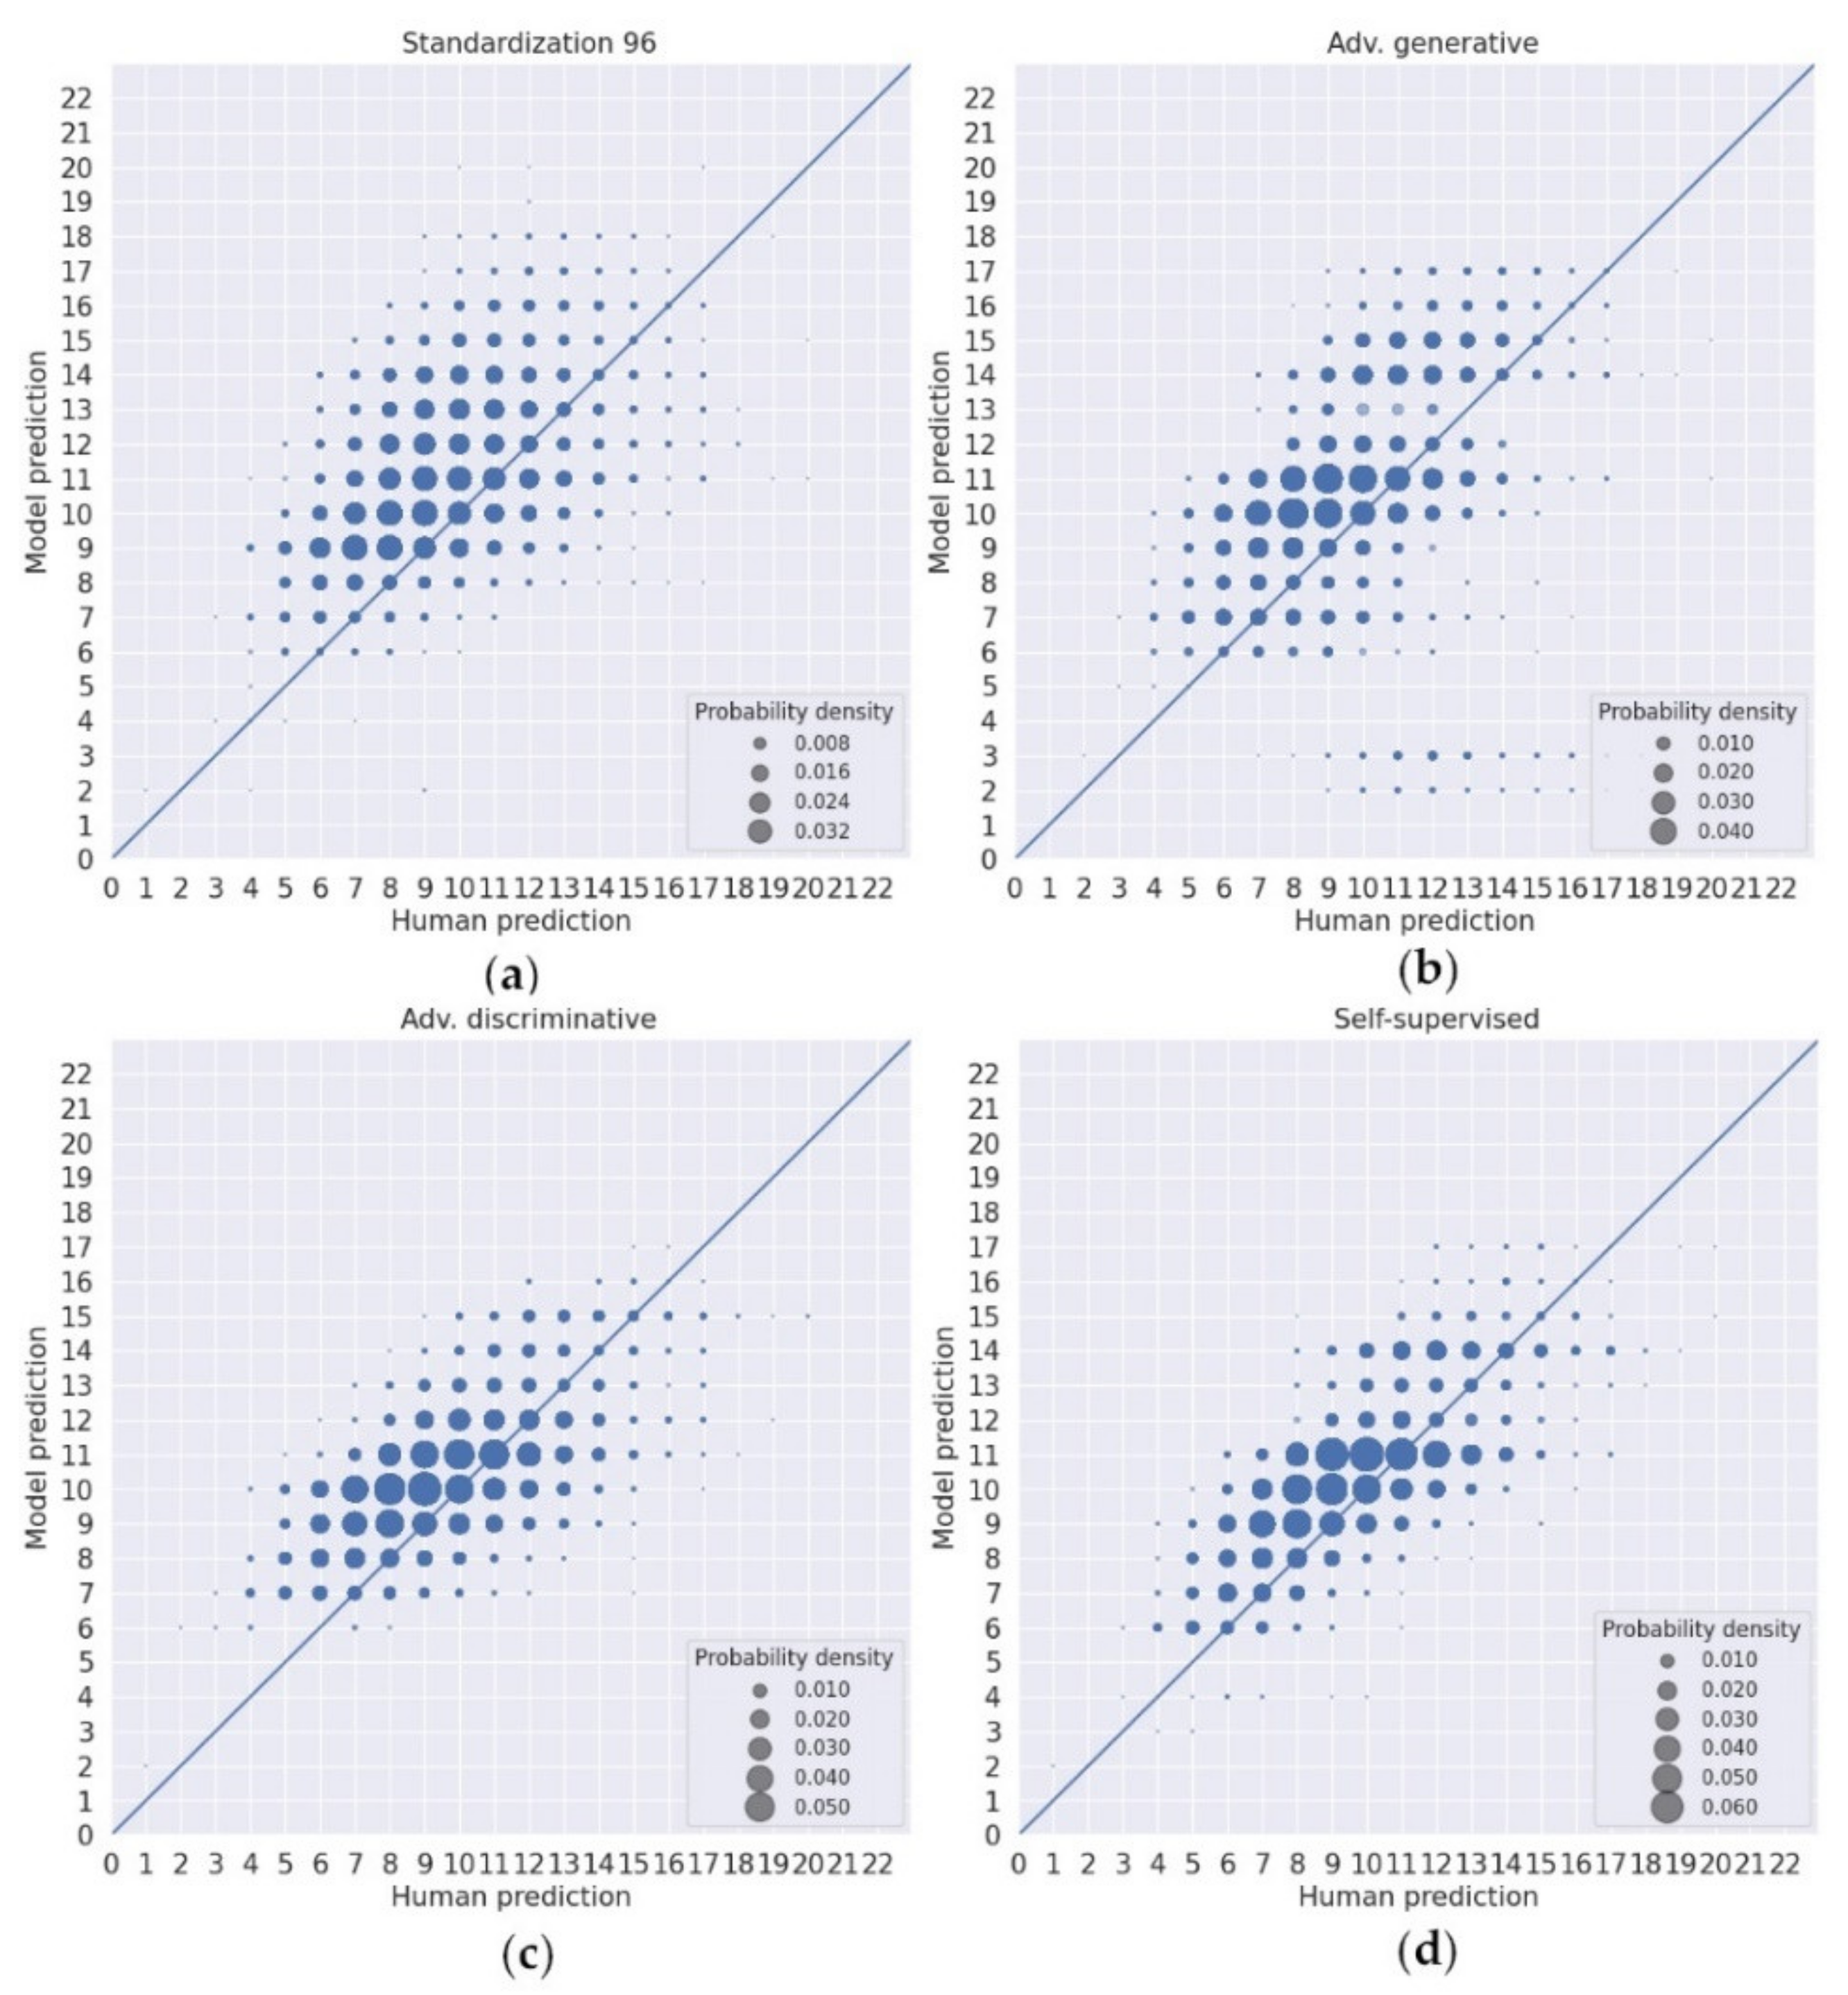
From both Table 3 and Figure 6, we observed that the simple standardization approach improved on the lower performance bound and the results were comparable to those from the more complex adversarial generative approach. Similar patterns of age predictions were noticed when comparing the two approaches (Figure 7a,b). However, we found that the variation in performance was much lower for the standardization approach. For this case, we also noted that the performance for the low-resolution images was slightly better than for the high-resolution images.
The method based on the adversarial discriminative approach showed better performances than the generative approach both in terms of average RMSE/CV and associated variations. The best results were nonetheless obtained with self-supervised adaptation. It achieved the lowest average RMSE/CV and got closest to the higher performance bound, while the variations were on a level with that of the adversarial discriminative approach (Figure 6). When comparing the predicted ages from the two approaches (Figure 7c,d), less underestimation was observed with the self-supervised adaptation. This, despite the fact we used a resolution of only 96 × 96 pixels compared to the 224 × 224 used by adversarial approaches.

4. Discussion

Since the emergence of DL, several studies have been demonstrated to perform well on automatically predicting fish age from otolith images [10,11,12,13,14]. An important topic of this work was to assess whether a suitable performance from a DL system could be maintained on data from the same species but acquired in a different lab.
Using otolith images from Greenland halibut, we showed evidence in this paper that a DL system trained on data from a lab in Norway had difficulties, at test stage (Table 2, Figure 5a), for generalizing to novel otolith images from another lab in Iceland (lower performance bound model). The reason was a dataset shift, i.e., the images across the labs had different characteristics, although with a simple visual inspection (Figure 1) one could not have expected the bad performance obtained at test stage. By directly training a new system with data and labels from Iceland (higher performance bound model), we obtained a suitable classification performance (Table 2, Figure 5b). However, this required asking for manual annotations, which was not the optimal solution as the process had a cost in terms of effort and expertise.
For both lower and higher performance bounds, reducing the input image size from 224 × 224 to 96 × 96 pixels did not affect the performance. This finding was consistent with a previous study [11] showing that the internal structure of the otolith was not an important attribute for DL systems to determine accurately most of the ages. Thus, using lower-resolution images in those models was not problematic.
To address the performance challenges due to dataset shift, we investigated three different strategies of UDA to adapt the existing classifier trained on the Norwegian data to the Icelandic data, without requiring extra labeling effort from Iceland when training. The performance of the adversarial generative approach (CoGAN, Figure 7b) varied quite substantially compared to the adversarial discriminative approach (CDAN, Figure 7c) and the self-supervised approach (SimCLR, Figure 7d). The results from CoGAN were the worst and exhibited a higher variation across different runs of the model (Table 3, Figure 6), indicating the instability of this GAN-based approach. This contrasted with the review study of Zhao et al. [21] where generative approaches scored well in terms of performance. A possible explanation could be that in this study, the method was challenged when trying to generate images resembling the ones from the source and target domains, where perhaps high focus was dedicated to compensating for background differences observed across labs. More recent adversarial generative methods do not use the concept of training two GANs anymore and trying a more recent state-of-the art approach could be considered in future work. The other adversarial approach, CDAN, came closer to the higher performance bound and little variation across the different runs was observed (Table 3, Figure 6). SimCLR also provided stable results and led to the best performance on the target domain compared to the other two methods. In Zhao et al. [21], self-supervised approaches did not have the best performance score, but in our case it seemed that the pretext task of recognizing positive samples from negative samples was sufficiently good to make the model learn invariant representations across source and target domains. As suggested in [39], with the chosen pretext task, the attention was probably focused on low- and mid-level network representations that might have captured brightness and contrast characteristics. Those characteristics could be found with low-resolution images, that is why operating on images of size 96x96 pixels was not a problem.
Applying a standardization preprocessing to the images from the Norwegian lab, training a model with these data and deploying it on preprocessed data from the Icelandic lab performed worse than the CDAN and the SimCLR approaches (Table 3, Figure 7a). Moreover, slightly higher variations across the runs were observed (Figure 6). This reflected that finding a solution solely based on data preprocessing was not enough to handle the dataset shift. There was a need for more elaborate adjustments in the deep neural network architecture and UDA using self-supervised learning (SimCLR) seemed the most promising alternative.
Finding an approach for automatic age determination across labs without requiring additional human expertise when training could have implications in two major respects. First, since acquiring otolith image data is less cost demanding than the human interpretation, the present study could raise the possibility of carrying out age determination of backlogs of otoliths that have not yet been annotated in other labs. Second, having a tool for adapting age-reading from one lab to another could help reduce the observed between-lab differences. This may streamline comparisons conducted in age-reading workshops such as [15,16]. In this context, it could also be interesting to combine age readings from different methods and estimate the relative merits of each. By using the approach proposed in [40], one could combine estimated ages while accounting for the biases and imprecisions of the different used methods. In this case, the results would be properly weighted before using them for stock assessment population models. Those could possibly be improved by combining the predictions of independent estimators, which is the case of manual predictions, based on analysis of otolith age zones and DL predictions, which are triggered by other aspects [11].
The results presented in this paper must be seen nonetheless in light of some limitations. We considered adapting a classifier that was trained on images from the right and left otoliths to images only belonging to the right otolith. The reason was that in the earlier phase of the study, we decided to use the same paired data as in Moen et al. [10] (including right and left otoliths) but when we prepared the training data for Iceland, we limited ourselves to the right-separated pair that we resized to 224 × 224 pixels and dismissed the rest of the image. This decision was not reviewed at the later stage of the results evaluation, but we plan in the future to analyze what would happen when including the left otolith images as well. Furthermore, the correspondence with sex and length could also be examined. The age distribution for Greenland halibut females and males is known to differ, with females tending to live longer and with a growth that exceeds that of males [41]. Incorporating information about the sex and length in the DL network as proposed in [42] may also be helpful.
To compare the performance of the different DL approaches, we used the CV, the RMSE and the age-bias plots. However, in the context of stock assessment, these quantities might be too limiting measures. Analyzing age distributions and examining the final stock assessment results would be important tasks for the future. It might happen when comparing methods (including different manual age readings) that the stock assessment results appear virtually the same, despite possible large differences in CV, RMSE, age-bias plots or vice-versa.
Finally, we considered adapting a classifier from a source to a target domain where the target age categories were included in the source label space (Figure 2). In the proposed UDA methods, we tried to match the whole source and target domains as if they fully shared the label space, which was not the case. This could have led to a suboptimal transferability of source examples, where in our study some age categories could have been over-represented (e.g., ages 10–12 as seen in Figure 7b–d). Looking for solutions to handle this, as proposed for instance in [43,44], will be an important task in the future. Another realistic scenario to be examined would be when the target label space has age categories that are not present in the source label space (e.g., transferring the age classifier trained on Icelandic data to Norwegian data). It could then happen that the techniques investigated in this paper would not perform that well. In that case, alternative solutions as proposed in [45] should be taken into consideration.

5. Conclusions

In this work, the dataset shift across otolith images acquired from labs in Norway and Iceland was handled using domain adaptation strategies. We were able to adjust a DL model to provide satisfactory predictions on the Icelandic data. However, the performance depended strongly on the selected strategy. We observed that the CDAN and SimCLR approaches resulted in better performances, compared to the CoGAN or the simple adaptation method via standardization.
Even though common practice consists of validating a DL model on a holdout dataset during training, this step is not sufficient to guarantee that the model will have a well-defined behavior for unseen data. Hence, before DL-based predictors are considered to perform large scale inference on otolith images, a proper handling of dataset shift across different image labs is needed. The insights from this study pointed out that domain adaptation was a promising direction to consider, although analyzing model performance based on information shared between the source and target label spaces deserves further exploration. The hope is that such findings will contribute to the further development of DL techniques that could aid in reducing effort and availability of expertise in the otolith age-reading process.

Author Contributions

Conceptualization, A.O., L.E. and A.-B.S.; data curation, A.H. and B.Þ.E.; formal analysis, A.O.; funding acquisition, A.-B.S. and L.E.; investigation, A.O.; methodology, A.O., L.E. and A.-B.S.; project administration, A.-B.S.; resources, A.-B.S.; supervision, A.-B.S. and L.E; validation, A.H. and B.Þ.E.; writing—original draft, A.O., L.E., A.-B.S., A.H. and B.Þ.E.; writing—review and editing, A.O. and A.H. All authors have read and agreed to the published version of the manuscript.

Funding

This research was funded by the Research Council of Norway as part of the COGMAR project, grant number 270966.

Institutional Review Board Statement

Ethical review and approval were waived for this study as the otolith images were obtained from dead individuals that were not endangered or protected.

Data Availability Statement

The Norwegian otolith data presented in this study are openly available through the Norwegian Marine Data Center under the DOI https://doi.org/10.21335/NMDC1949633559. The Icelandic otolith data can be made available upon request to the Marine and Freshwater Research Institute (Iceland).

Acknowledgments

We thank the Researach Council of Norway for funding, but also Auður Súsanna Bjarnadóttir and Sigurlína Gunnarsdóttir from the Marine and Freshwater Research Institute for their involvement in preparing the otolith dataset from Iceland (photography and age-reading) that was used in this study.

Conflicts of Interest

The authors declare no conflict of interest.

References

  1. Schulz-Mirbach, T.; Ladich, F.; Plath, M.; Heß, M. Enigmatic Ear Stones: What We Know about the Functional Role and Evolution of Fish Otoliths. Biol. Rev. Camb. Philos. Soc. 2019, 94, 457–482. [Google Scholar] [CrossRef] [PubMed]
  2. Patterson, W.P.; Smith, G.R.; Lohmann, K.C. Continental Paleothermometry and Seasonality Using the Isotopic Composition of Aragonitic Otoliths of Freshwater Fishes. Wash. DC Am. Geophys. Union Geophys. Monogr. Ser. 1993, 78, 191–202. [Google Scholar] [CrossRef]
  3. Patterson, W.P. Oldest Isotopically Characterized Fish Otoliths Provide Insight to Jurassic Continental Climate of Europe. Geology 1999, 27, 199–202. [Google Scholar] [CrossRef]
  4. Enoksen, S.; Haug, T.; Lindstrøm, U.; Nilssen, K. Recent Summer Diet of Hooded Cystophora Cristata and Harp Pagophilus Groenlandicus Seals in the Drift Ice of the Greenland Sea. Polar Biol. 2016, 40, 931–937. [Google Scholar] [CrossRef]
  5. Polito, M.J.; Trivelpiece, W.Z.; Karnovsky, N.J.; Ng, E.; Patterson, W.P.; Emslie, S.D. Integrating Stomach Content and Stable Isotope Analyses to Quantify the Diets of Pygoscelid Penguins. PLoS ONE 2011, 6, e26642. [Google Scholar] [CrossRef] [Green Version]
  6. Kalish, J.M. Pre- and Post-Bomb Radiocarbon in Fish Otoliths. Earth Planet. Sci. Lett. 1993, 114, 549–554. [Google Scholar] [CrossRef]
  7. Campana, S.; Thorrold, S. Otoliths, Increments, and Elements: Keys to a Comprehensive Understanding of Fish Populations? Can. J. Fish. Aquat. Sci. 2001, 58, 30–38. [Google Scholar] [CrossRef]
  8. Morison, A.; Burnett, J.; McCurdy, W.; Moksness, E. Quality Issues in the Use of Otoliths for Fish Age Estimation. Mar. Freshw. Res. 2005, 56, 773–782. [Google Scholar] [CrossRef]
  9. Fablet, R.; Josse, N. Automated Fish Age Estimation from Otolith Images Using Statistical Learning. Fish. Res. 2005, 72, 279–290. [Google Scholar] [CrossRef] [Green Version]
  10. Moen, E.; Handegard, N.O.; Allken, V.; Albert, O.T.; Harbitz, A.; Malde, K. Automatic Interpretation of Otoliths Using Deep Learning. PLoS ONE 2018, 13, e0204713. [Google Scholar] [CrossRef] [Green Version]
  11. Ordoñez, A.; Eikvil, L.; Salberg, A.-B.; Harbitz, A.; Murray, S.M.; Kampffmeyer, M.C. Explaining Decisions of Deep Neural Networks Used for Fish Age Prediction. PLoS ONE 2020, 15, e0235013. [Google Scholar] [CrossRef]
  12. Moore, B.; Maclaren, J.; Peat, C.; Anjomrouz, M.; Horn, P.L.; Hoyle, S.D. Feasibility of Automating Otolith Ageing Using CT Scanning and Machine Learning; New Zealand Fisheries Assessment Report 2019/58; New Zealand Fisheries Assessment: Wellington, New Zealand, 2019; ISBN 978-1-990008-66-5. [Google Scholar]
  13. Politikos, D.V.; Petasis, G.; Chatzispyrou, A.; Mytilineou, C.; Anastasopoulou, A. Automating Fish Age Estimation Combining Otolith Images and Deep Learning: The Role of Multitask Learning. Fish. Res. 2021, 242, 106033. [Google Scholar] [CrossRef]
  14. Vabø, R.; Moen, E.; Smoliński, S.; Husebø, Å.; Handegard, N.O.; Malde, K. Automatic Interpretation of Salmon Scales Using Deep Learning. Ecol. Inform. 2021, 63, 101322. [Google Scholar] [CrossRef]
  15. ICES. Report of the Workshop on Age Reading of Greenland Halibut (WKARGH); ICES CM 2011/ACOM:41; International Council for Exploration of the Seas: Vigo, Spain, 2011. [Google Scholar]
  16. ICES. Report of the Workshop on Age Reading of Greenland Halibut 2 (WKARGH2); ICES CM 2016/SSGIEOM:16; International Council for Exploration of the Seas: Reykjavik, Iceland, 2016. [Google Scholar]
  17. Morison, A.K.; Robertson, S.G.; Smith, D.C. An Integrated System for Production Fish Aging: Image Analysis and Quality Assurance. N. Am. J. Fish. Manag. 1998, 18, 587–598. [Google Scholar] [CrossRef]
  18. Quiñonero-Candela, J. Dataset Shift in Machine Learning. In Neural Information Processing Series; MIT Press: Cambridge, MA, USA, 2009; ISBN 978-0-262-17005-5. [Google Scholar]
  19. Torralba, A.; Efros, A.A. Unbiased Look at Dataset Bias. In CVPR 2011; IEEE: Colorado Springs, CO, USA, 2011; pp. 1521–1528. [Google Scholar]
  20. Ben-David, S.; Blitzer, J.; Crammer, K.; Kulesza, A.; Pereira, F.; Vaughan, J.W. A Theory of Learning from Different Domains. Mach. Learn. 2010, 79, 151–175. [Google Scholar] [CrossRef] [Green Version]
  21. Zhao, S.; Yue, X.; Zhang, S.; Li, B.; Zhao, H.; Wu, B.; Krishna, R.; Gonzalez, J.E.; Sangiovanni-Vincentelli, A.L.; Seshia, S.A.; et al. A Review of Single-Source Deep Unsupervised Visual Domain Adaptation. IEEE Trans. Neural Netw. Learn. Syst. 2020, 33, 473–493. [Google Scholar] [CrossRef]
  22. Sólmundsson, J.; Kristinsson, K.; Steinarsson, B.; Jonsson, E.; Karlsson, H.; Björnsson, H.; Palsson, J.; Bogason, V.; Sigurdsson, T.; Hjörleifsson, E. Manuals for the Icelandic Bottom Trawl Surveys in Spring and Autumn; Hafrannsóknir nr. 156: Reykjavík, Iceland, 2010. [Google Scholar]
  23. Liu, M.-Y.; Tuzel, O. Coupled Generative Adversarial Networks. In Advances in Neural Information Processing Systems; Curran Associates, Inc.: Barcelona, Spain, 2016. [Google Scholar]
  24. Linder-Norén, E. PyTorch CoGAN. Available online: https://github.com/eriklindernoren/PyTorch-GAN (accessed on 2 March 2022).
  25. He, K.; Zhang, X.; Ren, S.; Sun, J. Deep Residual Learning for Image Recognition. In Proceedings of the IEEE Conference on Computer Vision and Pattern Recognition (CVPR), Las Vegas, NV, USA, 27–30 June 2016; IEEE: Las Vegas, NV, USA, 2016; pp. 770–778. [Google Scholar]
  26. Long, M.; CAO, Z.; Wang, J.; Jordan, M.I. Conditional Adversarial Domain Adaptation. In Advances in Neural Information Processing Systems; Curran Associates, Inc.: Montréal, QC, Canada, 2018; pp. 1647–1657. [Google Scholar]
  27. Jiang, J.; Chen, B.; Fu, B.; Long, M. Transfer-Learning-Library. Available online: https://github.com/thuml/Transfer-Learning-Library (accessed on 31 January 2022).
  28. Gidaris, S.; Singh, P.; Komodakis, N. Unsupervised Representation Learning by Predicting Image Rotations. arXiv 2018, arXiv:1803.07728. [Google Scholar]
  29. Noroozi, M.; Favaro, P. Unsupervised Learning of Visual Representations by Solving Jigsaw Puzzles. In European Conference on Computer Vision; Springer International Publishing: Amsterdam, The Netherlands, 2016. [Google Scholar]
  30. Zhang, R.; Isola, P.; Efros, A.A. Colorful Image Colorization. In European Conference on Computer Vision; Springer International Publishing: Amsterdam, The Netherlands, 2016; pp. 649–666. [Google Scholar]
  31. Xu, J.; Xiao, L.; Lopez, A.M. Self-Supervised Domain Adaptation for Computer Vision Tasks. IEEE Access 2019, 7, 156694–156706. [Google Scholar] [CrossRef]
  32. Jiaolong, X. Self-Supervised Domain Adaptation. Available online: https://github.com/Jiaolong/self-supervised-da (accessed on 1 February 2022).
  33. Chen, T.; Kornblith, S.; Norouzi, M.; Hinton, G. A Simple Framework for Contrastive Learning of Visual Representations. In Proceedings of the 37th International Conference on Machine Learning, Virtual Event, 12–18 July 2020; pp. 1597–1607. Available online: http://proceedings.mlr.press/v119/chen20j.html (accessed on 13 March 2022).
  34. Silva, T. PyTorch SimCLR: A Simple Framework for Contrastive Learning of Visual Representations. Available online: https://github.com/sthalles/SimCLR/blob/1848fc934ad844ae630e6c452300433fe99acfd9/models/resnet_simclr.py (accessed on 1 February 2022).
  35. Van den Oord, A.; Li, Y.; Vinyals, O. Representation Learning with Contrastive Predictive Coding. arXiv 2019, arXiv:Abs/1807.03748. [Google Scholar]
  36. He, K.; Zhang, X.; Ren, S.; Sun, J. Delving Deep into Rectifiers: Surpassing Human-Level Performance on ImageNet Classification. In Proceedings of the IEEE International Conference on Computer Vision (ICCV), Santiago, Chile, 7–13 December 2015; IEEE: Santiago, Chile, 2015; pp. 1026–1034. [Google Scholar]
  37. Kingma, D.P.; Ba, J. Adam: A Method for Stochastic Optimization. arXiv 2015, arXiv:1412.6980. [Google Scholar]
  38. Liu, M. CoGAN. Available online: https://github.com/mingyuliutw/CoGAN (accessed on 31 January 2022).
  39. Zhao, N.; Wu, Z.; Lau, R.W.H.; Lin, S. What Makes Instance Discrimination Good for Transfer Learning. arXiv 2021, arXiv:Abs/2006.06606. [Google Scholar]
  40. Punt, A.E.P.E.; Smith, D.C.S.C.; KrusicGolub, K.K.; Robertson, S.R. Quantifying Age-Reading Error for Use in Fisheries Stock Assessments, with Application to Species in Australia’s Southern and Eastern Scalefish and Shark Fishery. Can. J. Fish. Aquat. Sci. 2008, 65, 1991–2005. [Google Scholar] [CrossRef]
  41. Nedreaas, K.; Soldal, A.V.; Bjordal, Å. Performance and Biological Implications of a Multi-Gear Fishery for Greenland Halibut (Reinhardtius Hippoglossoides). J. Northwest Atl. Fish. Sci. 1996, 19, 59–72. [Google Scholar] [CrossRef]
  42. Martinsen, I. Deep Learning Applied to FIsh Otolith Images. Master’s Thesis, The Arctic University of Norway, Tromsø, Norway, 2021. [Google Scholar]
  43. Cao, Z.; Ma, L.; Long, M.; Wang, J. Partial Adversarial Domain Adaptation. In Proceedings of the European Conference on Computer Vision (ECCV), Munich, Germany, 8–14 September; Springer International Publishing: Munich, Germany, 2018. [Google Scholar]
  44. Cao, Z.; You, K.; Long, M.; Wang, J.; Yang, Q. Learning to Transfer Examples for Partial Domain Adaptation. In Proceedings of the IEEE/CVF Conference on Computer Vision and Pattern Recognition (CVPR), Long Beach, CA, USA, 15–20 June 2019; IEEE: Long Beach, CA, USA, 2019; pp. 2980–2989. [Google Scholar]
  45. Busto, P.P.; Gall, J. Open Set Domain Adaptation. In Proceedings of the IEEE International Conference on Computer Vision (ICCV), Venice, Italy, 22–29 October 2017; IEEE: Venice, Italy, 2017; pp. 754–763. [Google Scholar]
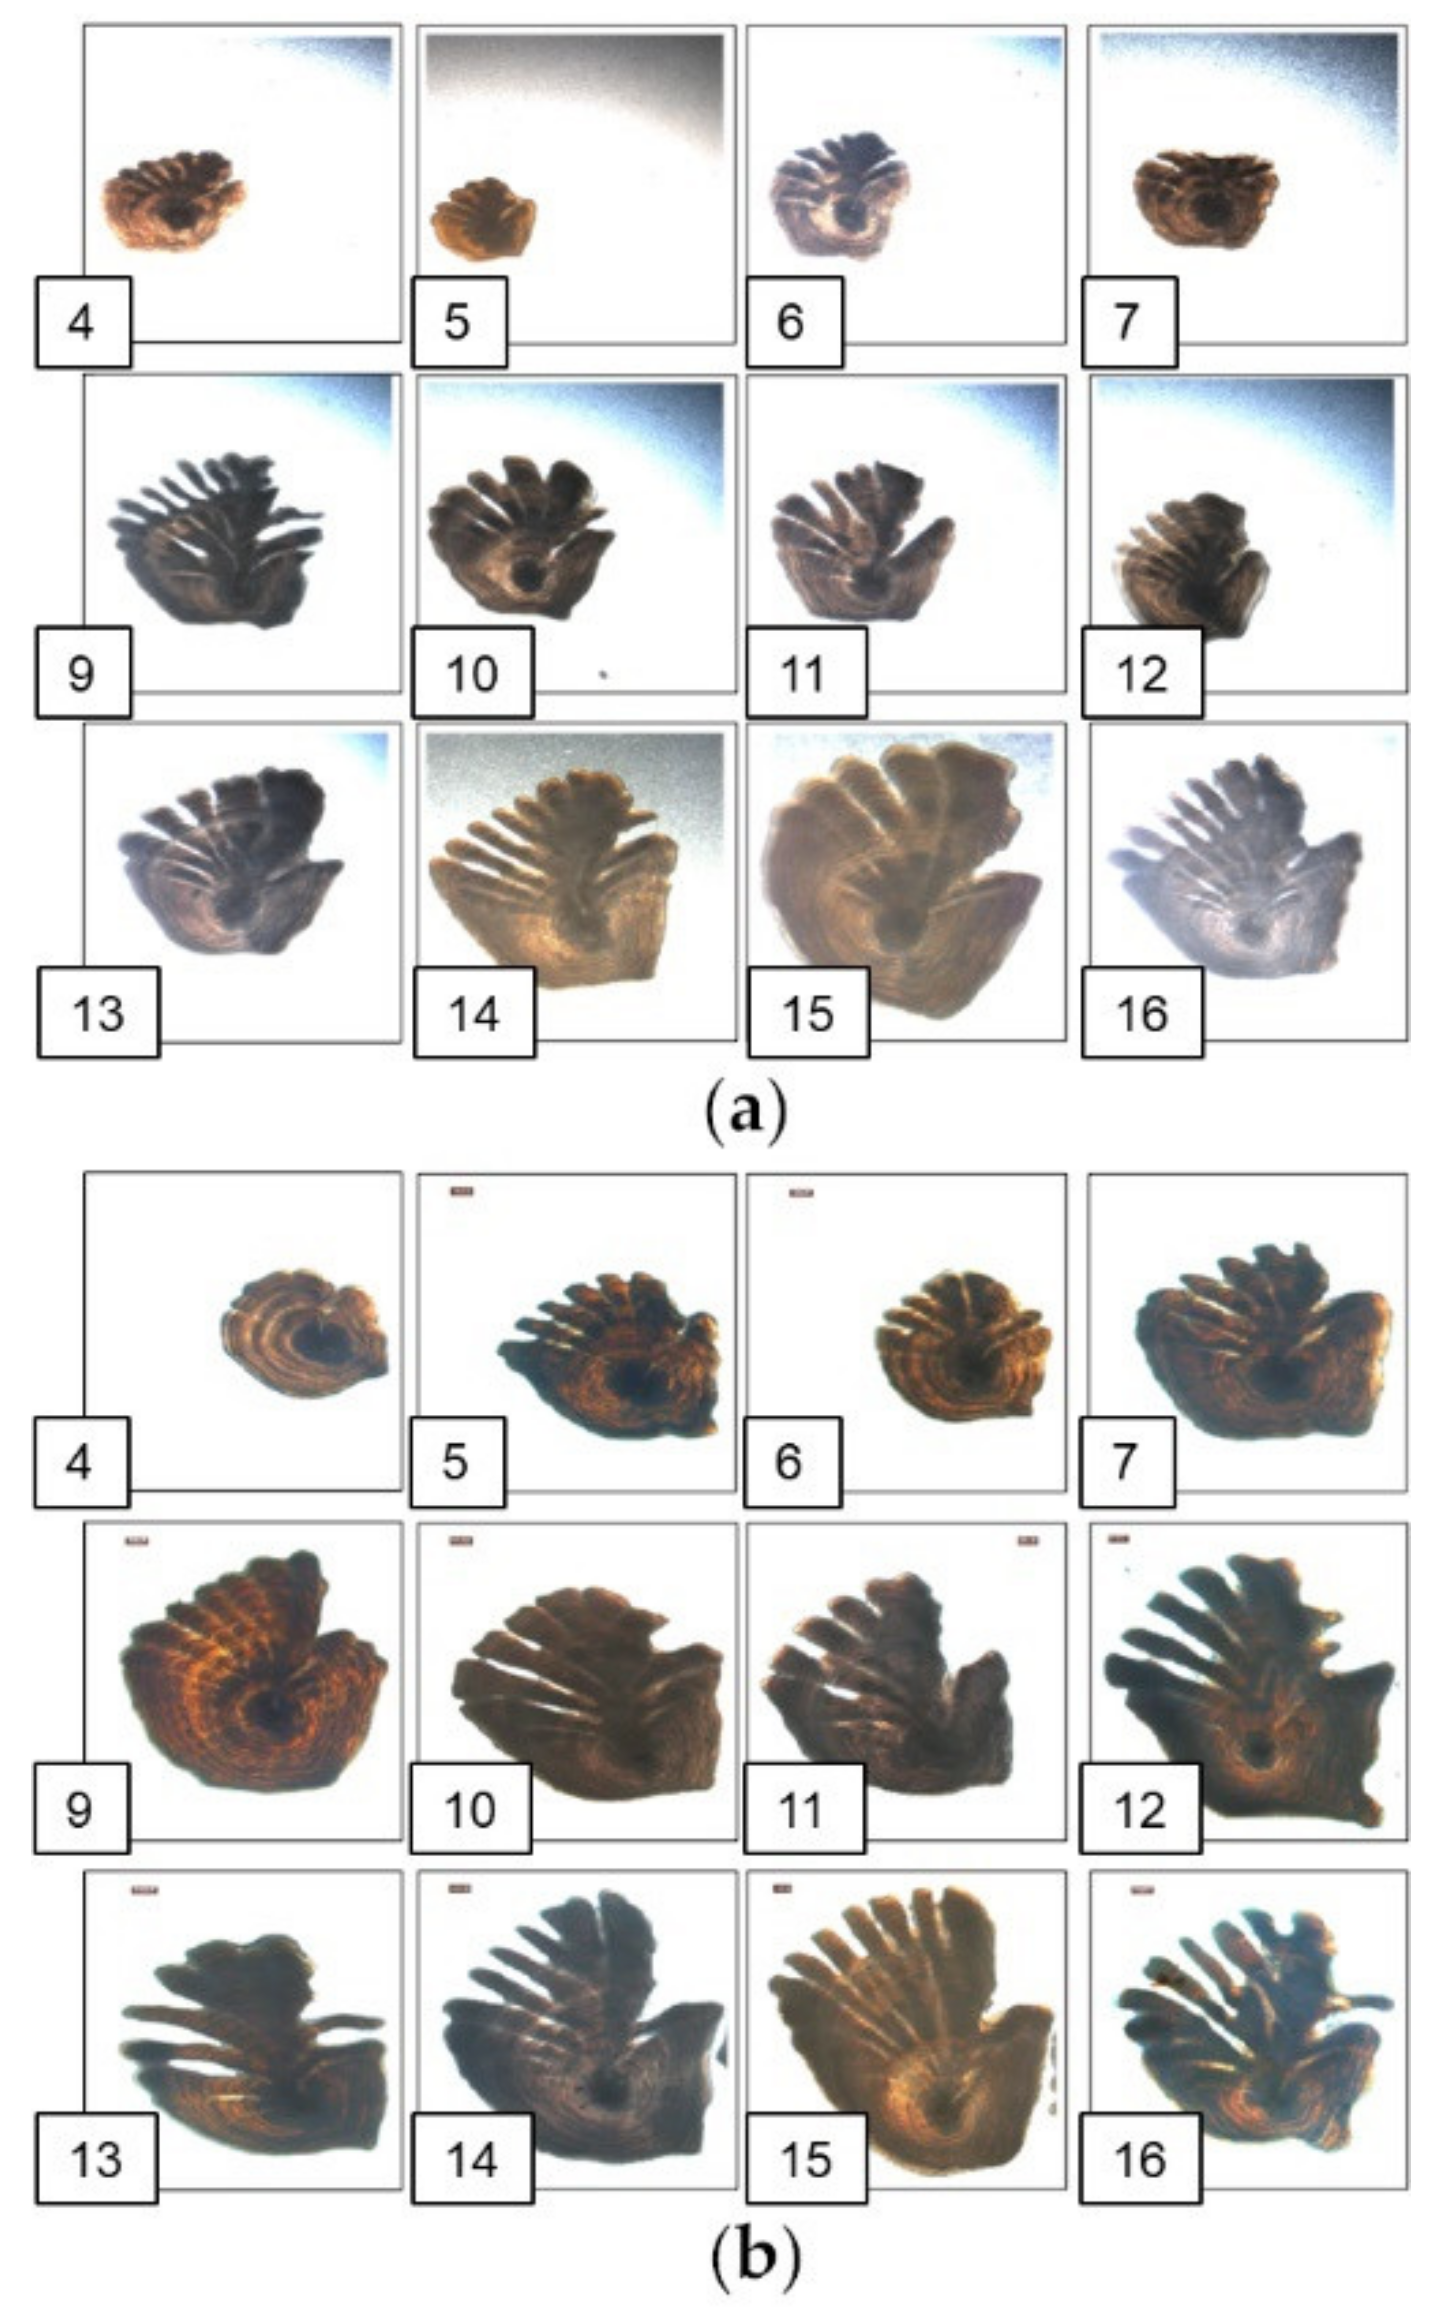
Figure 1. Examples of otolith images (resized to 224 × 224 pixels) corresponding to different ages (4–16 years) predicted by human readers. (a) Images acquired and annotated by the Norwegian lab; (b) Images acquired and annotated by the Icelandic lab.
Fishes 07 00071 g001
Figure 2. Age frequency distribution of predicted ages by human readers in the Norwegian dataset (gray) and the Icelandic dataset (blue).
Fishes 07 00071 g002
Figure 3. Illustration of the different UDA architectures utilized for automatic age determination of otoliths across Norwegian (source) and Icelandic (target) labs. (a) Adversarial generative adaptation (CoGAN); (b) Adversarial discriminative adaptation (CDAN); (c) Self-supervised adaptation (SimCLR).
Fishes 07 00071 g003
Figure 4. Examples of otolith images where the standardization preprocessing step was applied. (a) Standardized version of images from Figure 1a acquired and annotated by the Norwegian lab; (b) Standardized version of images from Figure 1b acquired and annotated by the Icelandic lab.
Fishes 07 00071 g004
Figure 5. Model age predictions vs. human annotated age obtained on the Icelandic data for the lower and higher performance experiments (using images of size 224 × 224). For each model, the age predictions correspond to the calculated median from the predicted ages obtained over the 5 different trials. The scatters have an area proportional to the probability density of data. (a) Age predictions for the lower performance bound; (b) age predictions for the higher performance bound.
Fishes 07 00071 g005
Figure 6. Visualization of the spread of the performance results obtained on the Icelandic data for the methods that are considered as domain adaptation. Each dot corresponds to one of the 5 trials. The red dashed lines delimiting the gray bars correspond to the higher (left) and lower (right) averaged performance bounds obtained with designated resolution (depending on the experiment). (a) Performance measured in terms of RMSE (years); (b) performance measured in terms of CV (%).
Fishes 07 00071 g006
Figure 7. Age predictions of different adaptation models vs. human annotated age obtained from the Icelandic data. For each model, the age predictions correspond to the calculated median from the predicted ages obtained over 5 different trials. The scatters have an area proportional to the probability density of data. (a) Age predictions for the simple standardization approach (image resolution 96 × 96 pixels); (b) age predictions for the adversarial generative adaptation; (c) age predictions for the adversarial discriminative adaptation; (d) age predictions for the self-supervised adaptation.
Fishes 07 00071 g007
Table 1. Summary of the different experiments with their associated characteristics.
ExperimentTraining LabelsTraining ImagesTest ImagesResolutionImage PreprocessingConsidered as DA
Norwegian bound 224Nor.Nor.Nor.224NoNo
Norwegian bound 96Nor.Nor.Nor.96NoNo
Lower performance 224Nor.Nor.Ice.224NoNo
Lower performance 96Nor.Nor.Ice.96NoNo
Higher performance 224Ice.Ice.Ice.224NoNo
Higher performance 96Ice.Ice.Ice.96NoNo
Standardization 224Nor.Nor.Ice.224YesYes
Standardization 96Nor.Nor.Ice.96YesYes
Adv. generative (CoGAN)Nor.Nor. and Ice.Ice.224NoYes
Adv. discriminative (CDAN)Nor.Nor. and Ice.Ice.224NoYes
Self-supervised (SimCLR)Nor.Nor. and Ice.Ice.96NoYes
Table 2. Summary of the performances achieved on the experiments that are not considered as domain adaptation, i.e., Norwegian bound and lower/higher performance bounds. For each experiment, the ResNet18 model was trained 5 times (using 5 different random number generators) and we reported the averaged RMSE/CV together with standard deviation over the 5 trials (quantity after ± sign).
ExperimentRMSE (Years)CV (%)
Norwegian bound 224 2.08   ±   0.05 10.09   ±   0.63
Norwegian bound 96 2.18   ±   0.10 10.4   ±   0.35
Lower performance 224 5.12   ±   0.58 28.6   ±   2.3
Lower performance 96 5.95   ±   1.3 31.3   ±   4.9
Higher performance 224 1.50   ±   0.036 8.14   ±   0.12
Higher performance 96 1.48   ±   0.037 7.99   ±   0.28
Table 3. Summary of the performances achieved on the experiments that are considered as domain adaptation, i.e., simple standardization approach and the UDA methods. For each experiment, the model was trained 5 times (using 5 different random number generators) and we reported the averaged RMSE/CV and standard deviation over the 5 trials.
ExperimentRMSE (Years)CV (%)
Standardization 224 3.57   ±   0.26 19.6   ±   1.2
Standardization 96 3.18   ±   0.28 17.1   ±   1.4
Adv. generative (CoGAN) 3.57   ±   0.72 21   ±   6.0
Adv. discriminative (CDAN) 2.18   ±   0.08 12.7   ±   0.54
Self-supervised (SimCLR) 1.94   ±   0.11 11.1   ±   0.62
Publisher’s Note: MDPI stays neutral with regard to jurisdictional claims in published maps and institutional affiliations.