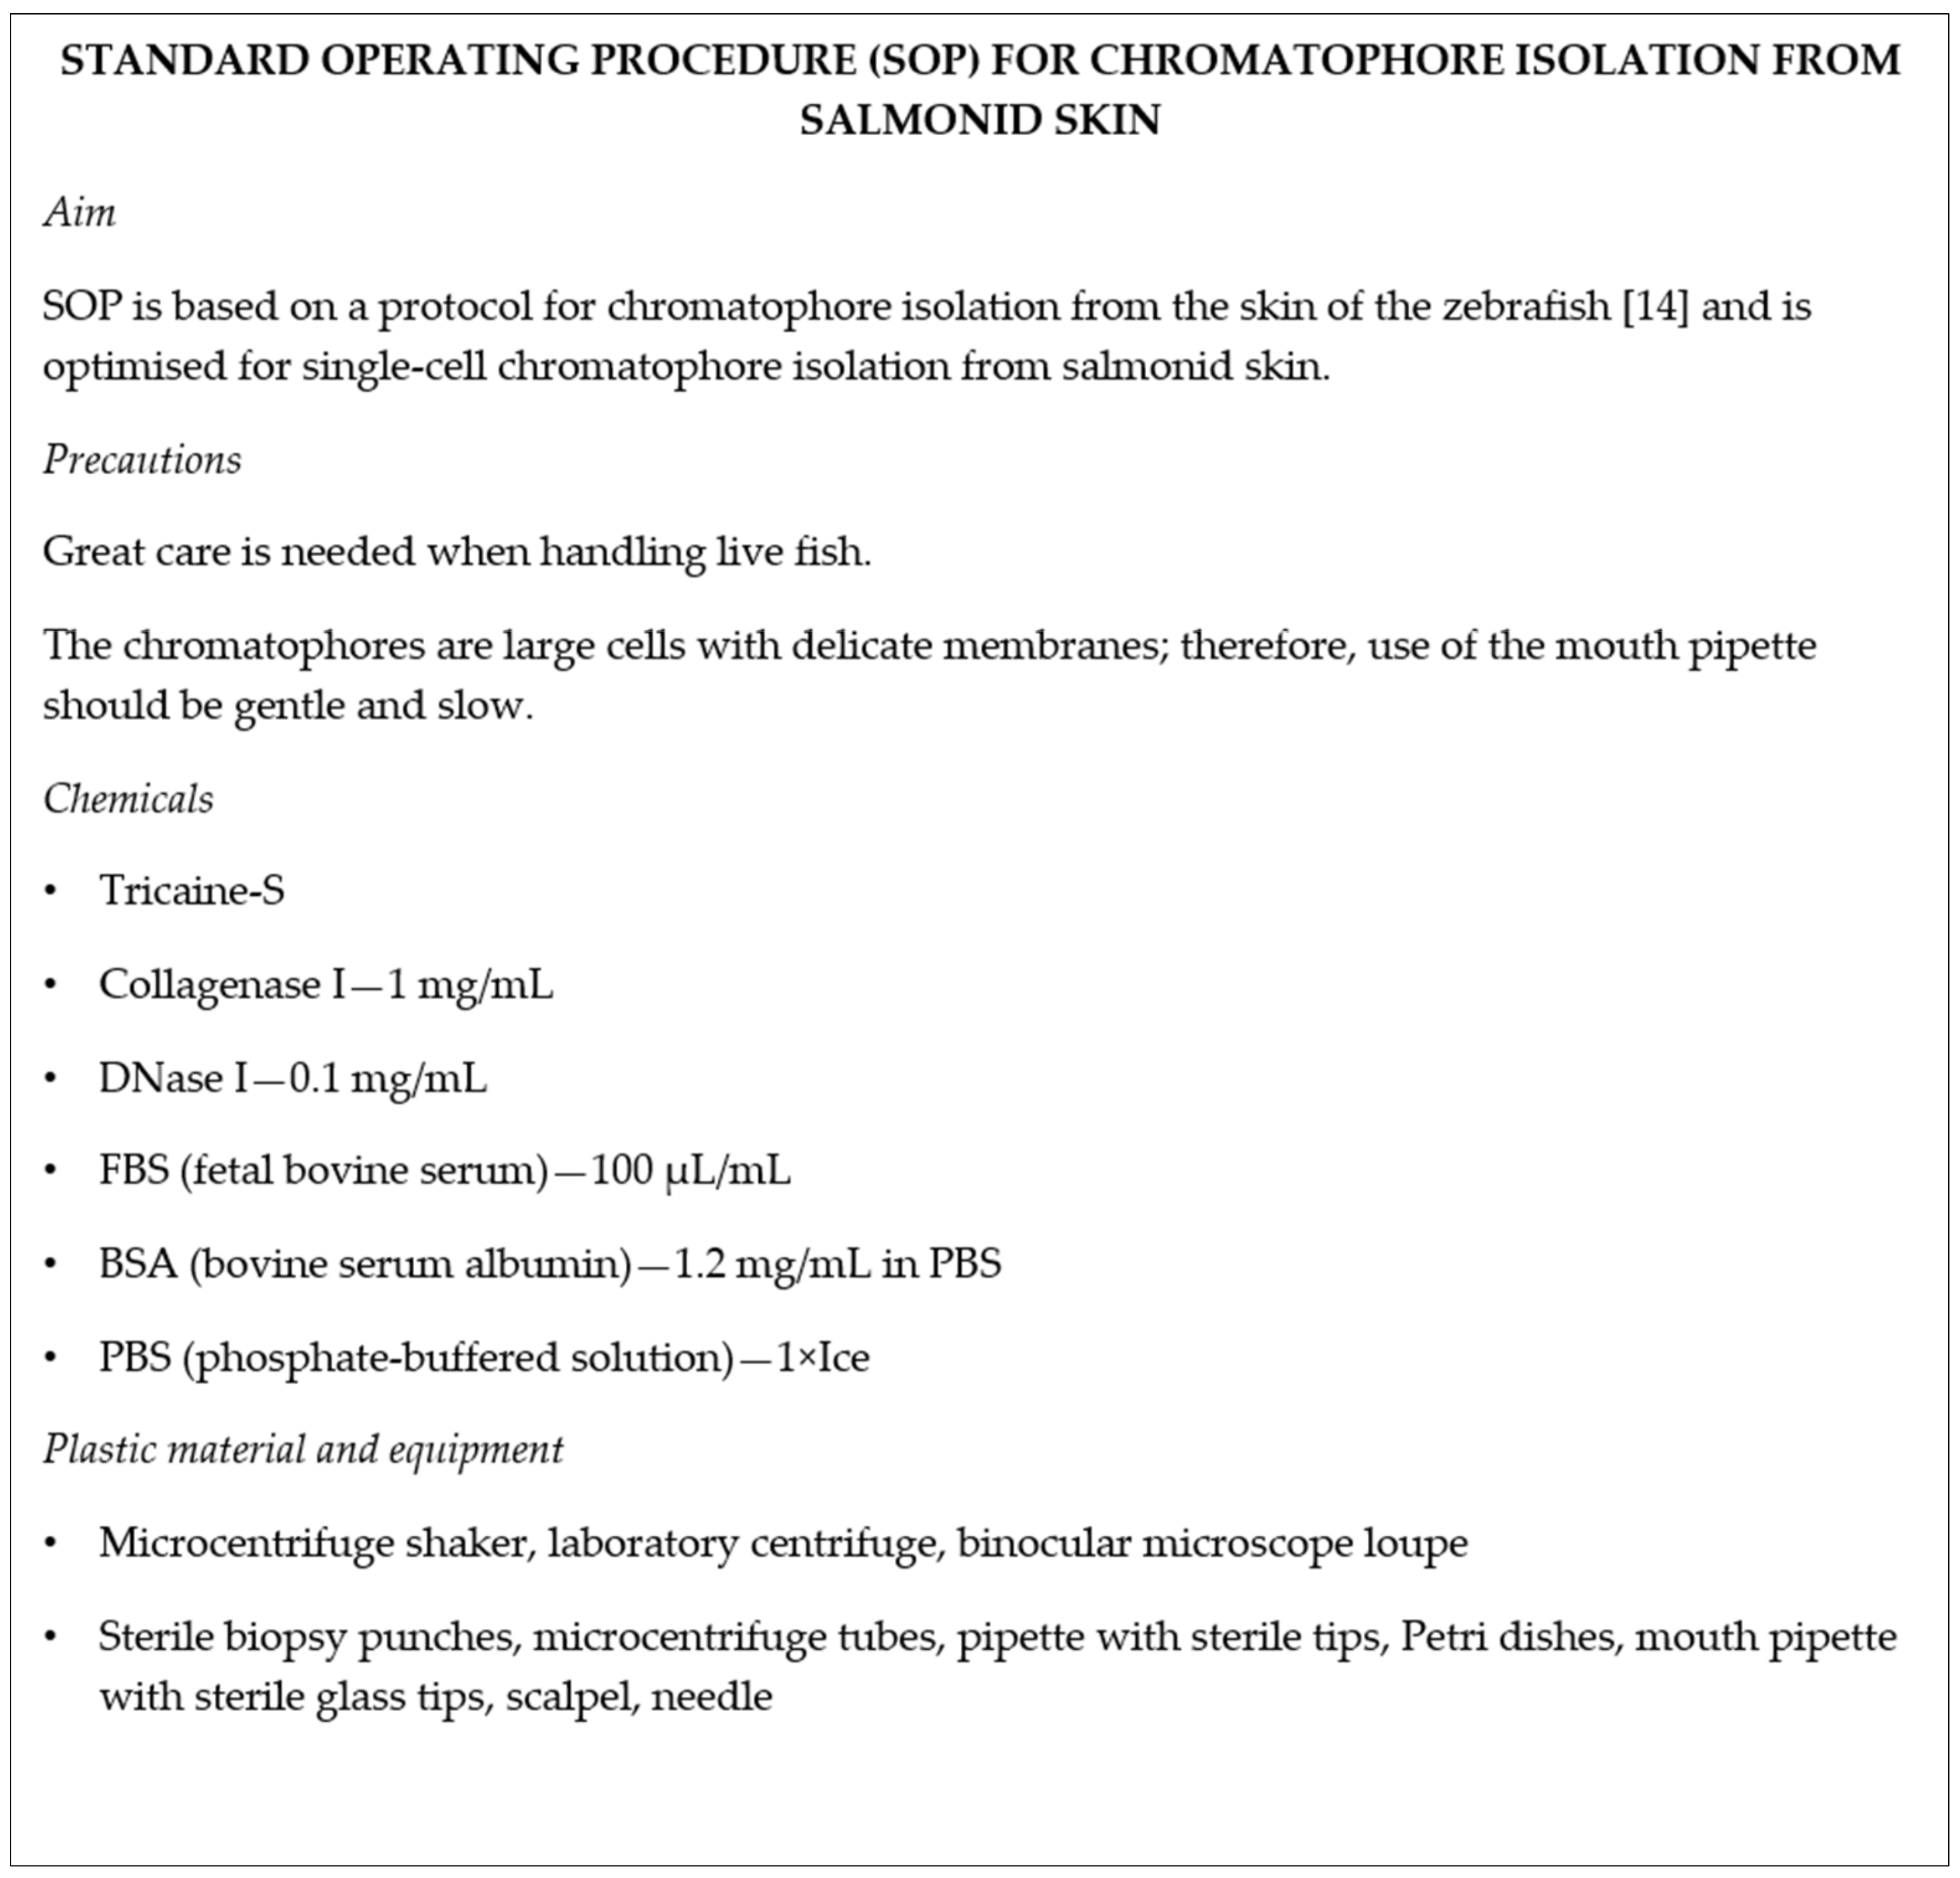
1. Introduction
Brown trout (
Salmo trutta) is one of the most widely distributed freshwater fish species, found not only in its native waters of Europe, North Africa and parts of Asia, but also in many waters around the world where it has been stocked [
1]. Different populations, separated over time by palaeohydrological dynamics, have formed specific ecotypes and even subspecies of brown trout. Many differ from each other in the pattern formed by characteristic red and black spots scattered throughout the trout’s skin [
1]. The role and function of spots and their distribution on the body, especially red spots, is a topic of much debate [
2]. Red coloration is often associated with mate selection during spawning, the more dominant males exhibiting more vivid coloration [
2,
3,
4]. Red spawning colours could be connected to carotenoid scarcity and, as such, could be a sign of fitness [
4]. Furthermore, it has also been suggested that red coloration is a form of communication between individuals or that it could help with predator avoidance. Regardless, none of the theories has, up to now, been scientifically proven. With forthcoming novel methods based on single-cell analysis, it is envisioned that research into the primary building blocks of pigmentation—chromatophores (pigment cells)—will help unravel the mysteries of fish coloration regarding both their function and the formation and maintenance of the skin pigment pattern.
The plethora of colours in the animal kingdom is mainly the result of different types of chromatophores. The vast range of colours is most evident in fishes. Unlike mammals, whose coloration depends solely on melanocytes, the coloration of fish can be the product of as many as six different types of chromatophores. Chromatophores differ mainly with respect to the colour of the pigment they accumulate (melanophores—black pigment, xanthophores—yellow pigment, erythrophores—red pigment, leucophores—white pigment, cyanophores—blue pigment) or in their ability to reflect light (iridophores) [
5]. Many authors have described new types, subtypes or states of chromatophores [
6,
7,
8], further increasing the complexity of pigment patterns in fish. In brown trout, besides melanophores, xanthophores and iridophores, two subtypes of erythrophores have been described [
6,
9]: subtype 1, which forms black spots together with abundant melanophores; and subtype 2, the main chromatophore present in red spots. Although the origin and differentiation of chromatophore types and subtypes in brown trout is not yet known, few hypotheses have been proposed for erythrophore subtypes [
9]. To test them and to further define cell types, subtypes and states in detail, to follow their developmental origin and cell (trans)differentiation in vitro, single-cell assays are required [
9].
Single chromatophore types and interactions among different types have been well studied in zebrafish (
Danio rerio), with a focus on deciphering chromatophore differentiation and pigment pattern formation [
10,
11,
12,
13,
14]. Protocols for single-cell suspension preparation and single-cell isolation from skin are therefore optimised for zebrafish [
14,
15]. The opposite is true for most salmonid species. Due to physiological and morphological differences between taxa, protocols developed for model species have not been shown to be directly transferable to other fish species. In this study, we present an optimised protocol for single-cell suspension preparation and single-cell isolation of chromatophores from brown trout skin. The method is designed to be rapid, simple and versatile and provides a solid structure for further modifications depending on the selected source material and required cell characteristics. The major advantage of the method is the ethical use of experimental animals, as fish do not need to be sacrificed for cell isolation. Using an optimised protocol, a single-cell suspension from brown trout skin was prepared and chromatophore types and subtypes present in spots on brown trout skin were individually collected and used for gene expression analyses to evaluate the quality of cell isolation.
2. Materials and Methods
Mature brown trout (older than two years) were randomly selected from a population kept in a recirculating aquaculture system (RAS) at the Biotechnical Faculty, University of Ljubljana. They were fed with Biomar INICIO Plus (Brande, Denmark) in the early stages and later with Biomar EFICO Enviro 920. Overall, 20 fish were used in the experimental protocol optimisation. Five of them were humanely killed and their skin tissue and scales were used for skin sampling optimization (see
Section 2.1). The rest of the fish were used for further optimisation steps of cell suspension preparation and cell isolation from skin biopsy samples taken directly from live fish.
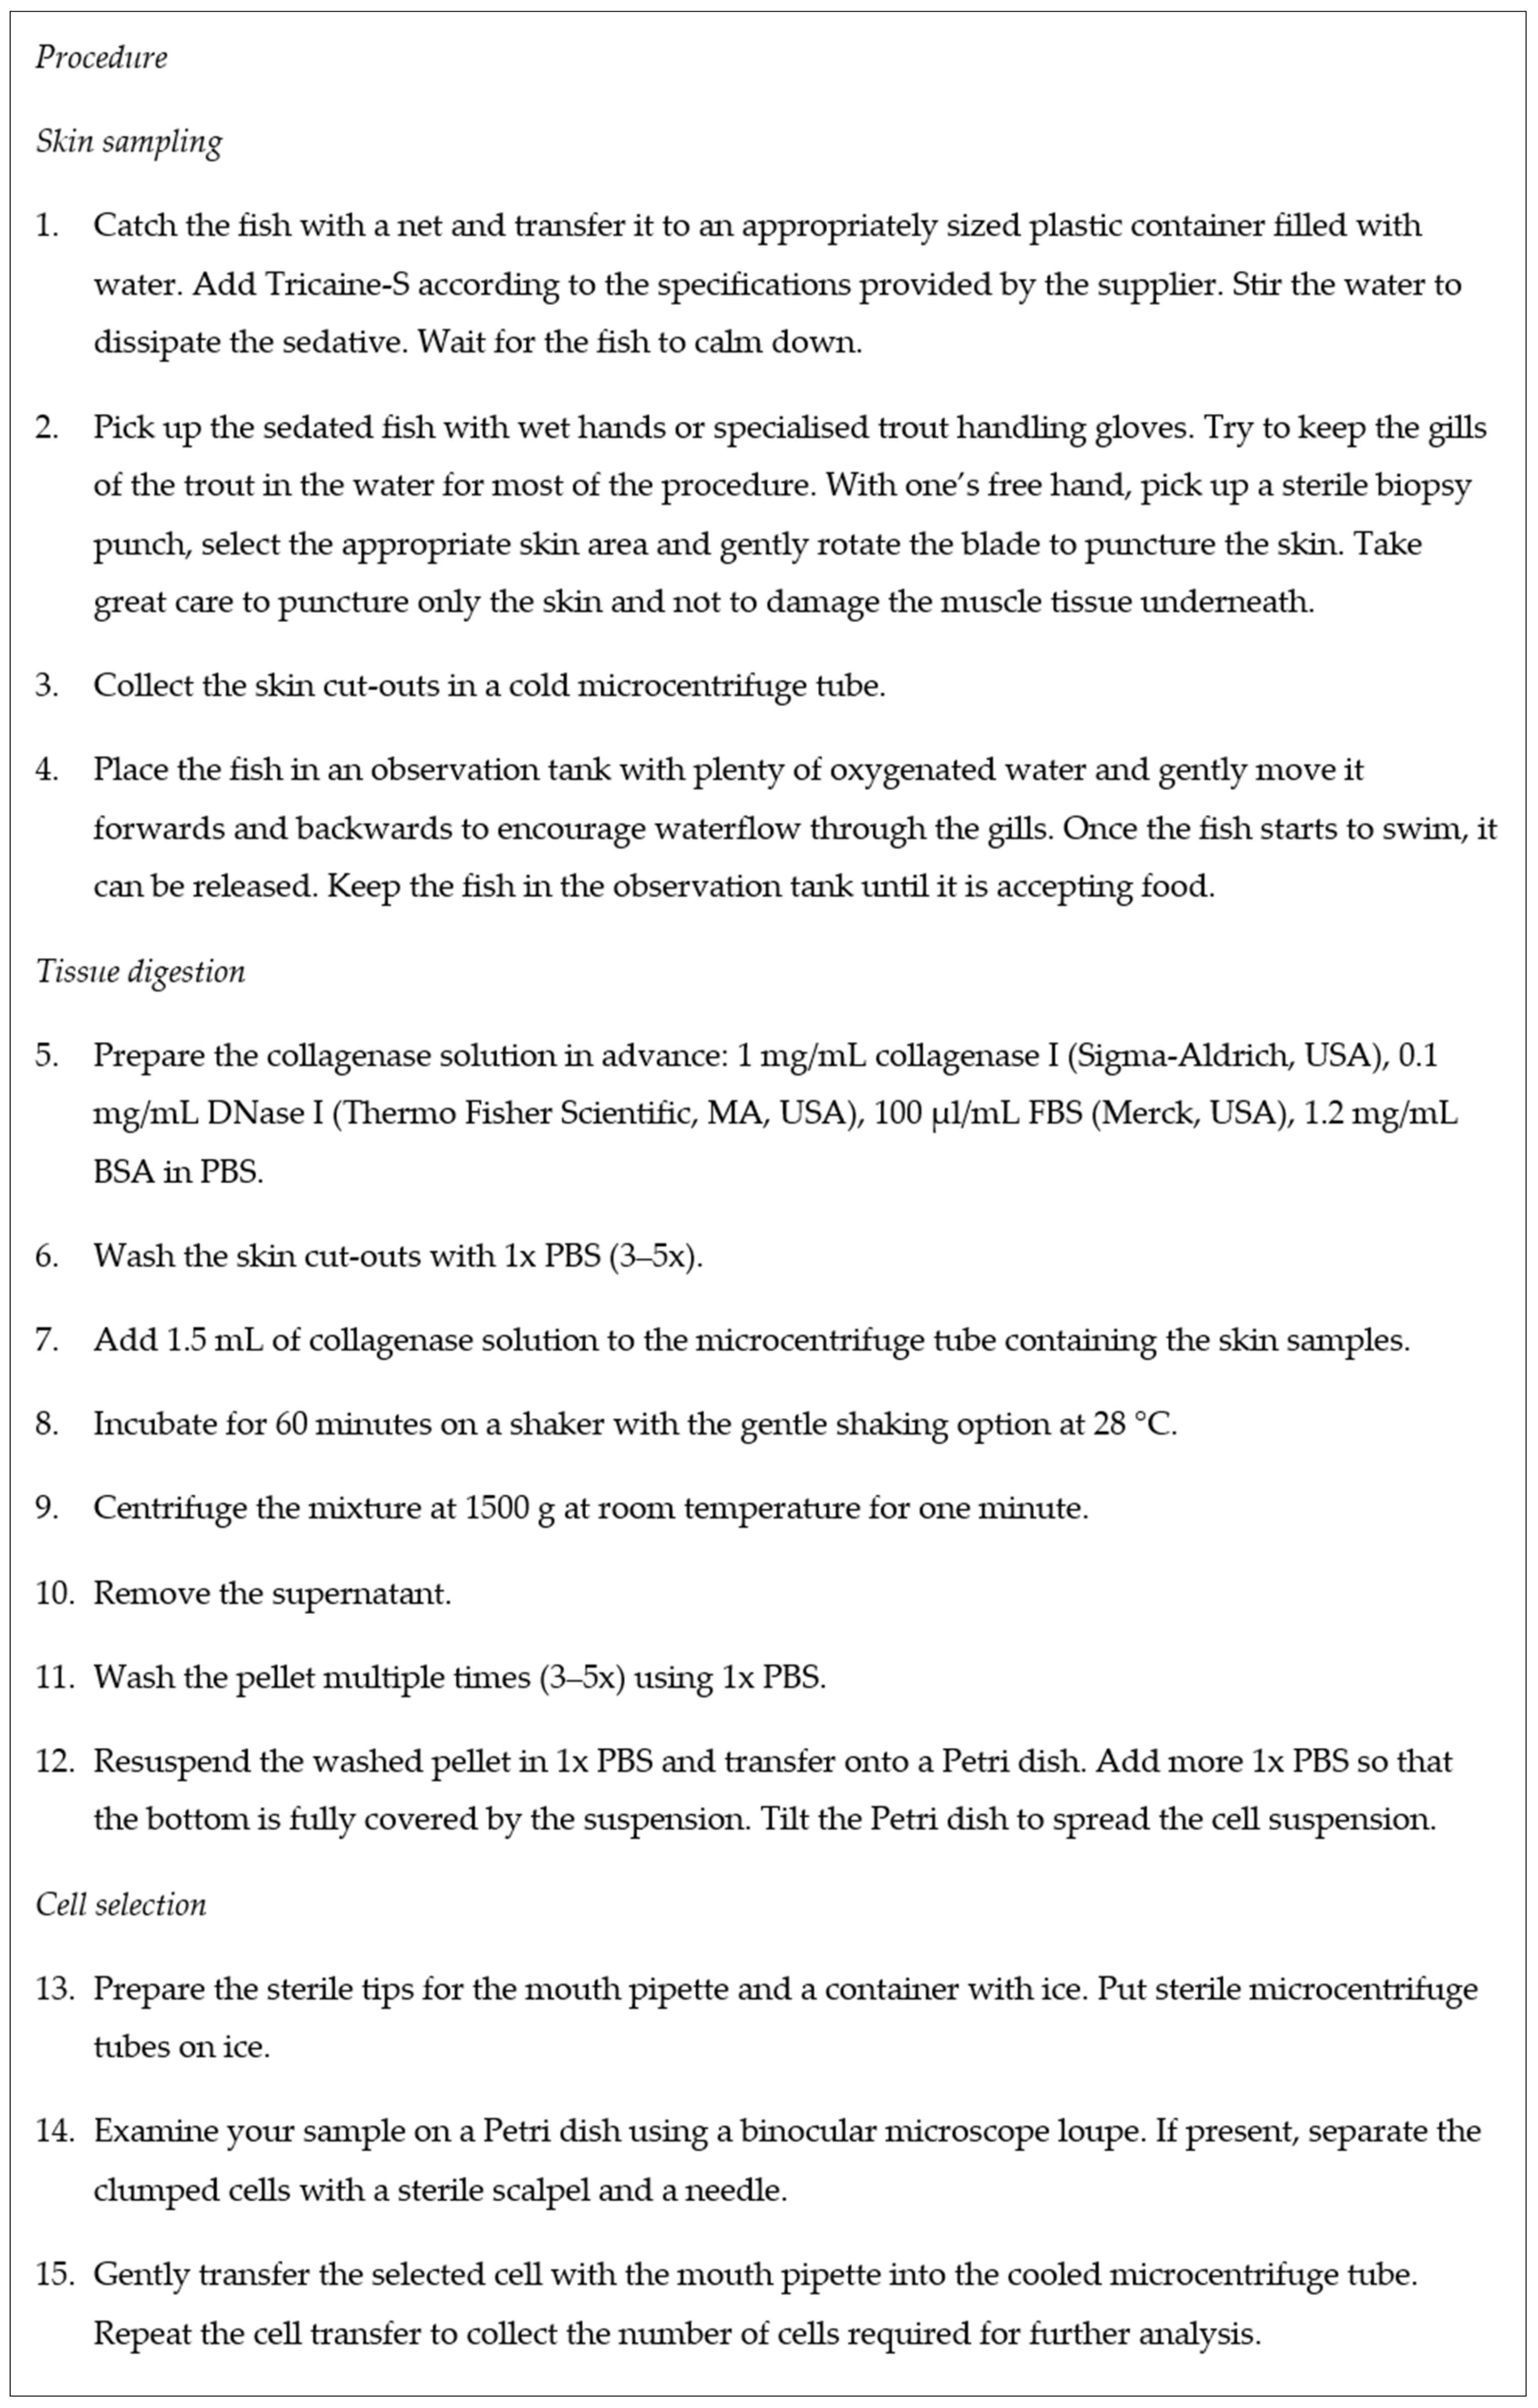
2.1. Skin Sampling
Fish were transferred to a vessel with 5 L of water and sedated with the addition of 5 mL of Tricaine-S (MS −222, Western Chemical, Inc., Ferndale, CA, USA). Each fish was left in the water for 5 min until rapid respiration subsided and the fish was handleable. Several methods for collecting skin and skin chromatophores from fish were tested: (1) using biopsy punches directly on the fish; (2) removal of scales; (3) removal of a larger piece of tissue. After sampling with non-lethal methods, the fish were placed in an observation tank with plenty of oxygenated water and gently moved back and forth to promote water flow through the gills. Once a fish started to swim, it was released into the observation tank. The fish was kept in the observation tank for several days to ensure that the injured skin did not become infected after sampling.
For each of the skin sampling methods tested, digestion of collected tissue (skin punches or scales) started within 5 to 10 min after the sampling (or death of the fish).
2.1.1. Skin Sampling Using Biopsy Punches Directly on the Fish
While holding the fish with wet hands, the skin was punctured by gently rotating the circular blade of the 1 mm biopsy punch (Kai Group, Tokyo, Japan). Great care was taken to puncture only the skin and not to injure the underlying muscle tissue. Three to six spots on each side of the fish were selected and punctured. Skin pieces from each of the sampled skin regions (red and black spots) were separately grouped in a 2 mL microcentrifuge tube.
2.1.2. Removal of the Scales with Chromatophores Attached
Using sterile forceps, we carefully plucked the scales from different skin regions (red and black spots) of the sedated fish. The scales with chromatophores attached were stored in sterile microcentrifuge tubes until further processing.
2.1.3. Removal of a Larger Piece of Skin Tissue
The fish was sedated, humanely killed with a blow to the neck and immediately washed with distilled water to remove the mucous. The skin was sprayed with 70% ethanol and wiped with a paper towel. Using scalpel and forceps, a piece of skin of approximate size 1 cm × 5 cm with red and black spots was removed from one side of the fish. Special care was taken to scrape off most of the muscle and fat tissue from the skin. The strip of skin was then placed in a Petri dish and the selected areas (red and black spots) were sampled using 1 mm biopsy punches (Kai Group, Tokyo, Japan). The skin samples were stored in microcentrifuge tubes for further processing.
2.2. Digestion of Skin Tissue
The isolation protocol was based on a protocol for chromatophore isolation from the skin of the zebrafish [
14]. Multiple optimisation steps were performed to optimise the protocol for the isolation of brown trout chromatophores.
All traces of muscle tissue were removed from skin samples with a scalpel and washed three to five times with 1× phosphate-buffered solution—PBS.
Samples were immersed in trypsin solution (2.5 mg/mL trypsin; 1.2 mg/mL bovine serum albumin—BSA; 1 mM EDTA in PBS; all Sigma-Aldrich, St. Louis, MO, USA) and shaken for 60 min at 20 °C and 1000 rpm. After incubation, samples were washed five times with 1× PBS.
For the purposes of optimisation, we doubled the trypsin concentration (5 mg/mL) and extended the incubation time to 100 and 120 min (
Table 1). All other parameters remained the same.
After trypsin digestion, the samples were further incubated in 1.5 mL of collagenase solution (1 mg/mL collagenase I (Sigma-Aldrich, St. Louis, MO, USA), 0.1 mg/mL DNase I (Thermo Fischer Scientific, Waltham, MA, USA), 100 μL/mL fetal bovine serum—FBS (Merck, Kenilworth, NJ, USA), 1.2 mg/mL bovine serum albumin—BSA in PBS). The effect of higher collagenase concentration (2 mg/mL) was also tested (
Table 1).
The microcentrifuge tubes were placed on a thermal shaker for 20 to 100 min at 28 °C with continuous gentle shaking. Tissue or cell status (condition) after different incubation times was observed with a binocular microscope loupe (Nikon SMZ1000, Nikon Corporation, Tokyo, Japan) or light microscope (Nikon Eclipse, TE-2000U, Nikon Corporation, Tokyo, Japan) (
Table 1).
Filtration with a 50 μm mesh filter (Sysmex Partec GmbH, Münster, Germany) was tested as an option for sample purification.
Digested mixture was centrifuged at 1500× g at room temperature for one minute. The supernatant was discarded, and the pellet was washed three to five times with 1× PBS. A short spin was used to collect the pellet at the bottom of the microcentrifuge tube.
The cells were resuspended in 1× PBS and carefully transferred to the top of an isotonic solution of Histopaque-1077 (Sigma Aldrich, St. Louis, MO, USA). The isotonic solution was prepared by combining nine parts of Histopaque-1077 and one part of 10× PBS buffer. The solution was centrifuged at 10,000× g for 15 min at 4 °C. Cell suspension was transferred onto the formed gradient. The gradient centrifugation was performed at 30× g for 5 min at 20 °C. The fractions were collected in separate microcentrifuge tubes and observed under the microscope.
2.3. Cell Selection
After the final wash and centrifugation step or after gradient centrifugation, the cells were resuspended in 1 mL of 1× PBS and spread on a Petri dish. We tilted the dish to distribute the cells over the entire surface.
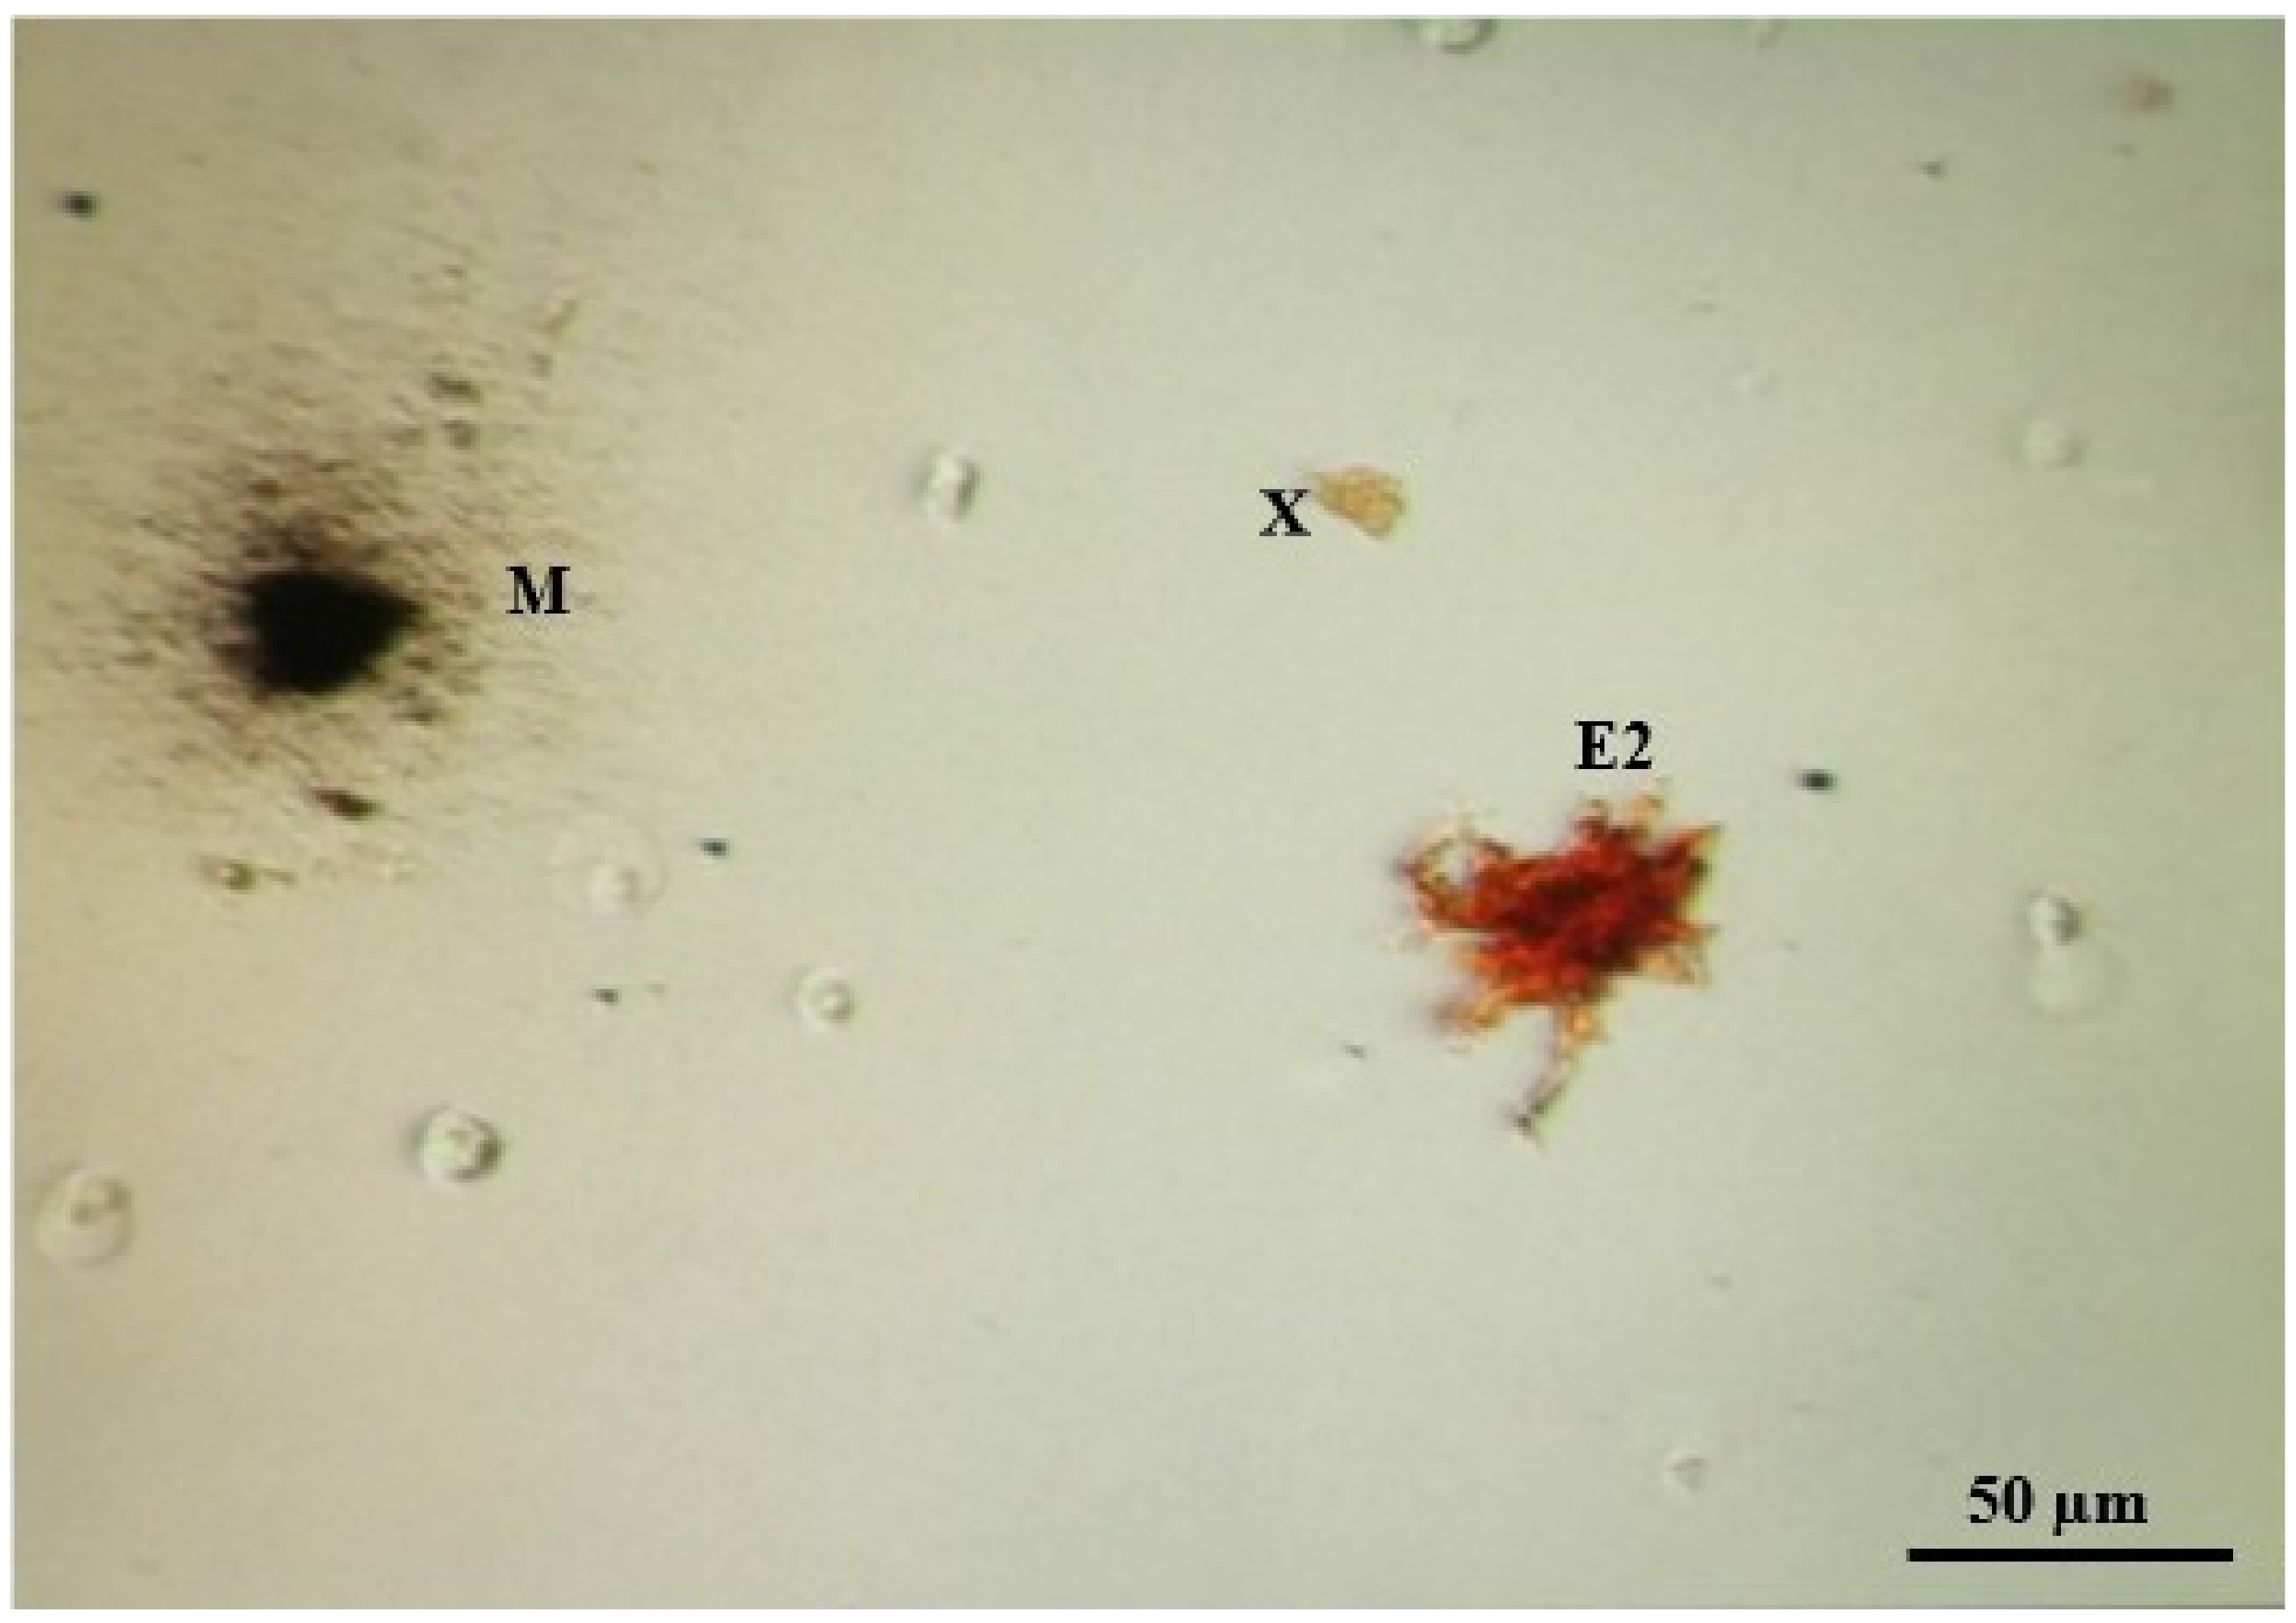
The Petri dish was examined under a binocular microscope loupe. When present, larger clumps of cells were separated into smaller clumps with more homogeneous cell populations using a sterile needle. The chromatophore types, with the exception of iridophores, can easily be distinguished from other cells and chromatophore types under a light microscope because they contain different pigments (see [
6]). Homogeneous cells (one type/subtype of chromatophores) were collected in cold microcentrifuge tubes using a mouth pipette or micromanipulator. Great care was taken to work quickly and accurately. Melanophores and subtype 1 erythrophores were collected from the cell suspension originating from black spots, and subtype 2 erythrophores from the cell suspension originating from red spots.
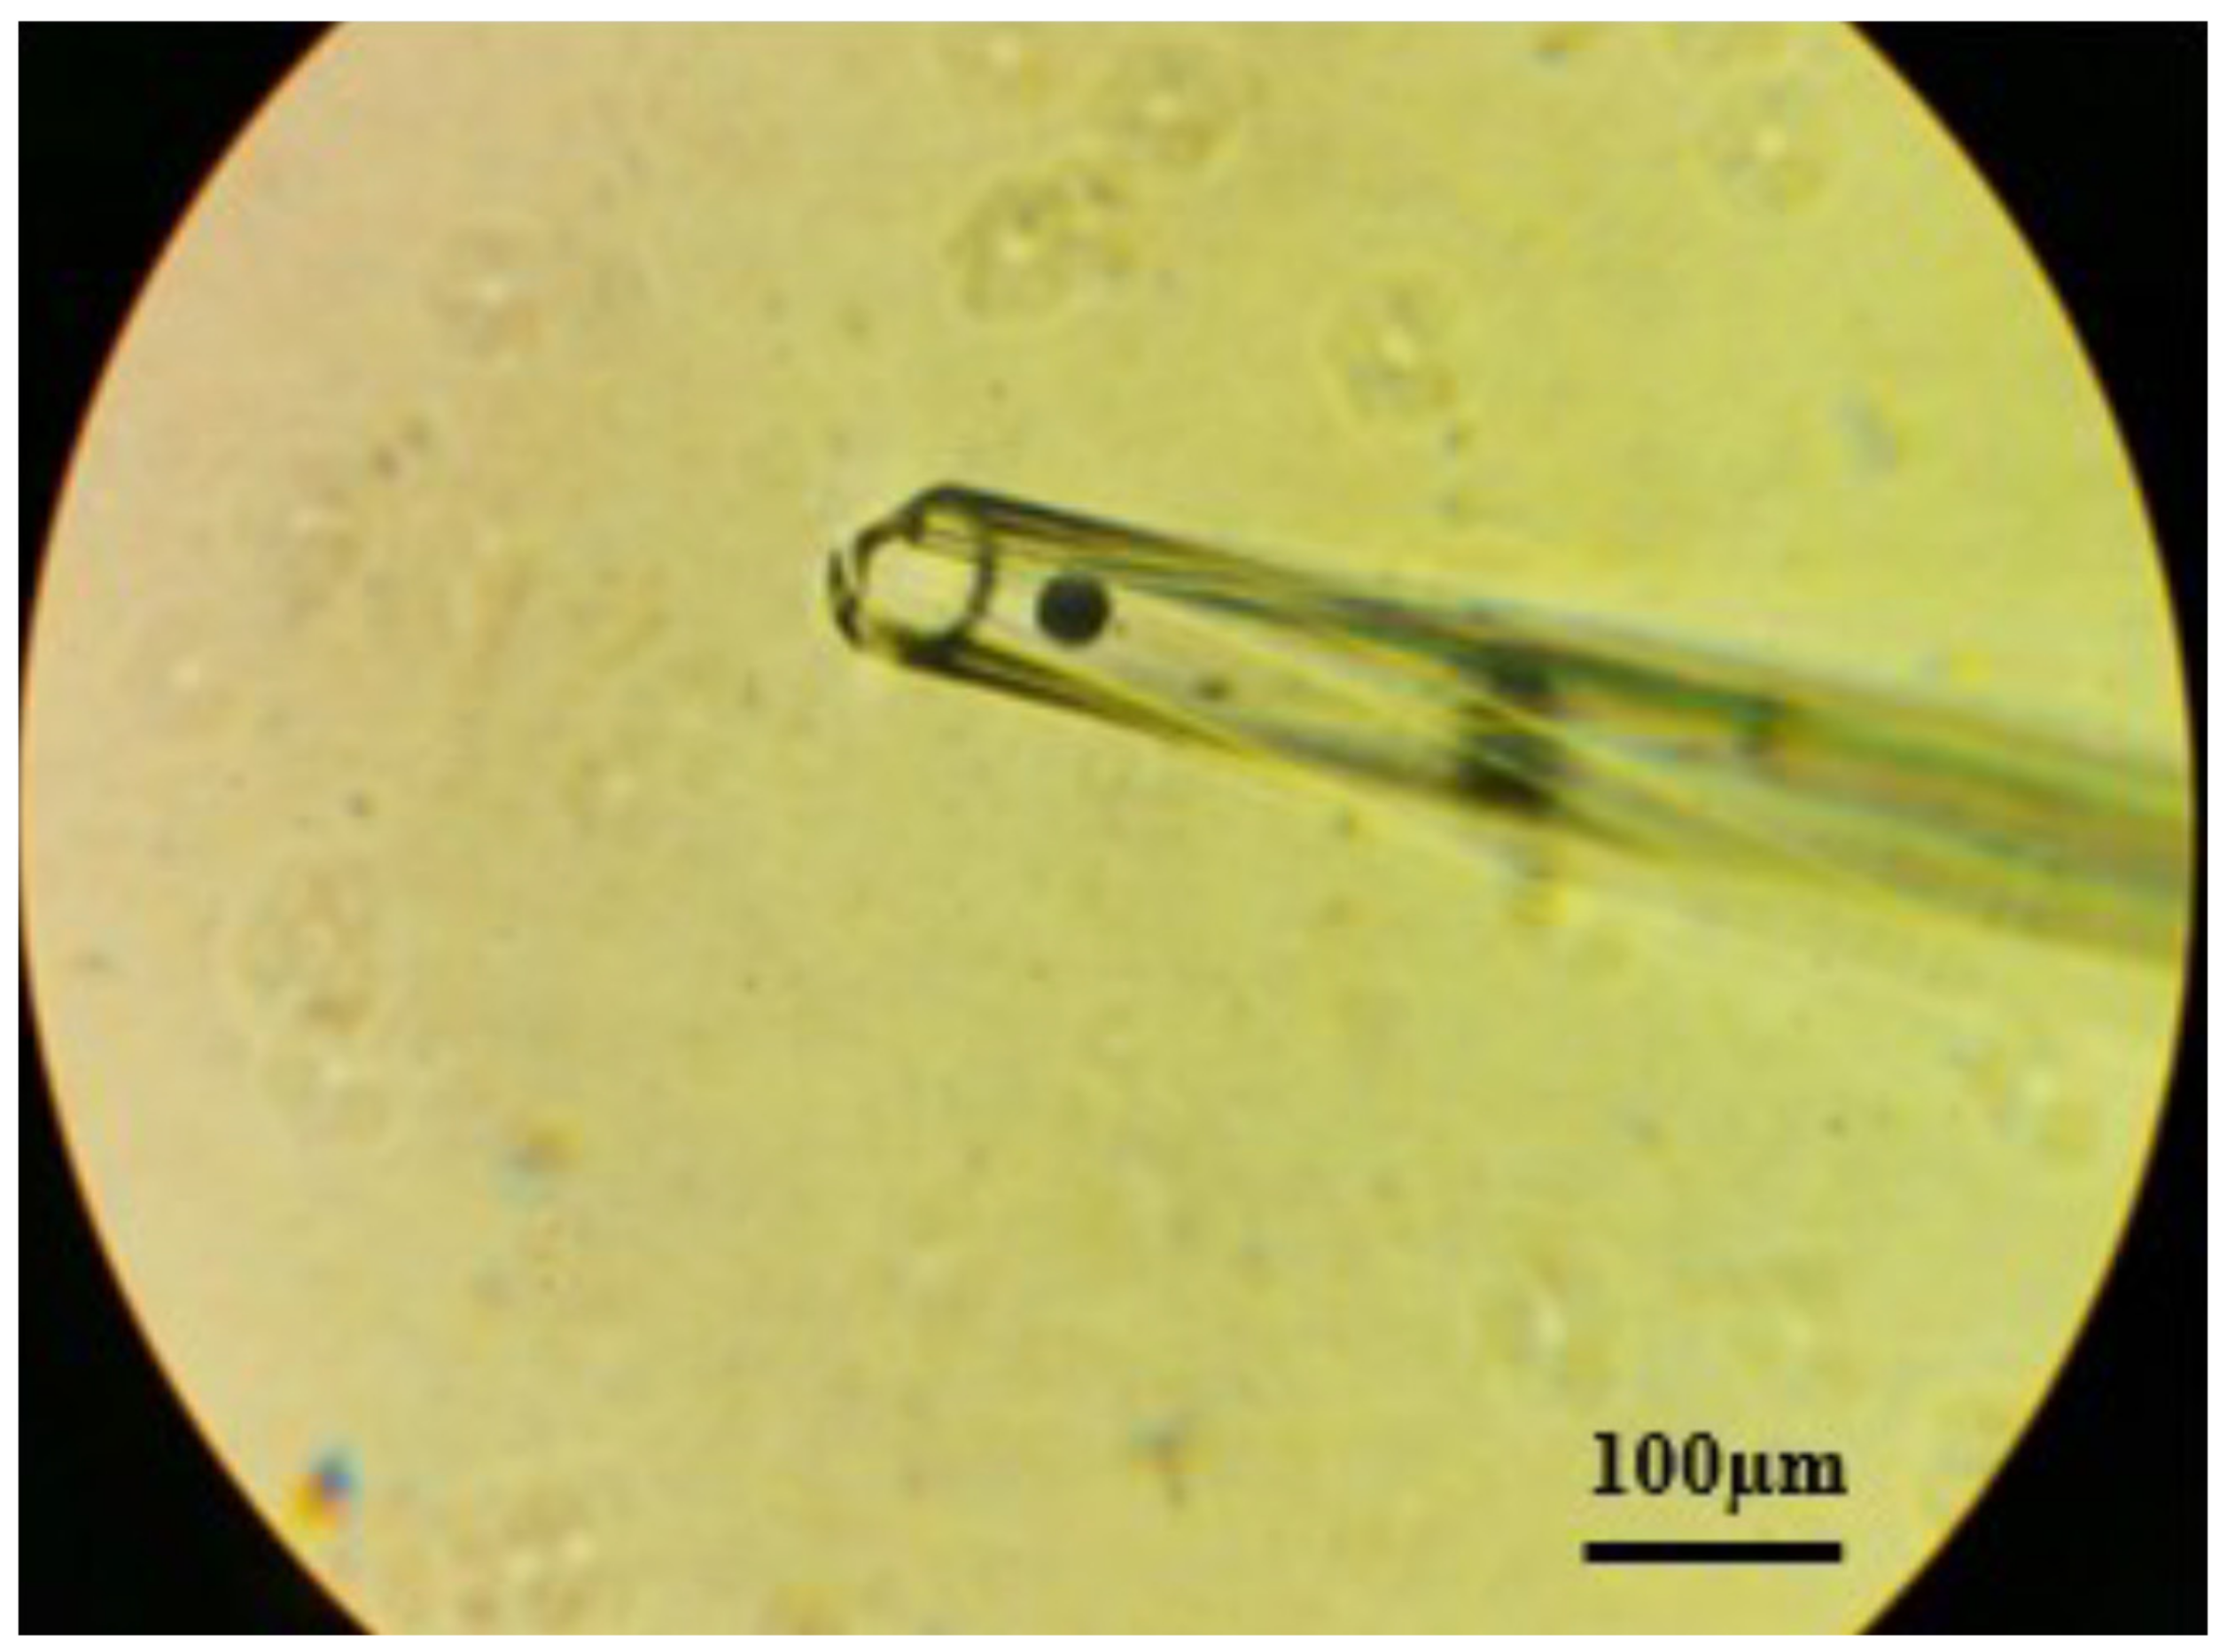
A mouth retransfer pipette with sterile tips (ID range of 92–99 µm; BioMedical Instruments, Zöllnitz, Germany) was used to individually collect single chromatophores under the binocular microscope loupe. By altering the air pressure with the mouth, a single cell or a small clump of cells was drawn into the pipette tip and immediately transferred into the cooled microcentrifuge tube containing 5 µL of PBS.
Single cells were also collected with a micromanipulator (Nikon Eclipse, TE-2000U NT-88-V3, Nikon Corporation, Tokyo, Japan). The micromanipulator tube was first filled with mineral oil. The glass pipettes were prepared by stretching the glass through a Bunsen burner. The tip was broken off and rounded with sandpaper. The circumference of the pipette tip was about 100 μm (measured under the microscope). The pipette was treated with trypsin (2.5 mg/mL trypsin in PBS) to avoid cell adhesion. The cell suspension in the Petri dish was also treated with trypsin at a final concentration of 2 mg/mL, 1 mg/mL and 0.5 mg/mL. Individual cells or small clumps of cells containing one type/subtype of chromatophore were selected and transferred to a cold microcentrifuge tube containing 5 µL PBS.
2.4. RNA Isolation
In order to test candidate gene expression from a specific chromatophore cell type, a complete cell lysate system designed for gene expression analysis directly from a small number of cells without RNA purification, SYBR™ Green Fast Advanced Cells-to-CT™ Kit (Thermo Fisher Scientific Baltics UAB, Vilnius, Lithuania), was used. The optional step of DNase I treatment was also performed. The RNA concentration in the isolate was checked using a NanoVue spectrometer (GE Healthcare, Buckinghamshire, UK). Equimolar concentrations between samples were ensured and RNA was transcribed into complementary DNA—cDNA. Gene expression analysis was performed, using components from the same kit and following the manufacturer’s instructions. Amplification was performed on the Viia7 Real Time PCR System (Applied Biosystem, Thermo Fischer Scientific).
The expression of the following nine genes previously described as being upregulated in red-spotted skin regions in brown trout, containing mainly subtype 2 erythrophores, and downregulated in black spotted skin regions, where melanophores predominate [
9,
16,
17], were analysed:
acana,
gja5,
pax7,
scarb1,
csf1r1,
coch,
sox10,
mitf Ch1. The expression of two paralogues of
sox10 was evaluated (
sox10 Ch1 and
sox10 Ch32). Primer sequences can be found in [
9,
16]. The internal reference gene
rps20, previously determined to exhibit stable expression in brown trout skin, was used [
16]. The expression of the candidate genes was analysed with a single biological sample performed in duplicates. A no-template control was used to exclude possible external contamination. Due to the small amount of RNA obtained with the kit, data from previous studies were used for standard curve analysis [
15,
16] of the reference and target genes to assess amplification efficiency, which was comparable between genes. The conditions for all reactions were 50 °C for 2 min, 95 °C for 10 min, followed by 40 cycles of 95 °C for 15 s and 60 °C for 1 min. At the end of each run, a melting curve analysis was performed to confirm a unique amplicon reaction. Differential gene expression results were calculated using the Pfaffl method [
18], normalised to the above-mentioned reference gene and using amplicon-specific efficiency.
Cell isolation procedure might affect RNA quality and quantity; therefore, the second part of the protocol, cell selection and isolation using a mouth pipette, was applied to collect brown trout blood cells from blood taken non-invasively. These cells, unlike chromatophores, were not subjected to any cell suspension preparation protocol.
3. Results and Discussion
3.1. Tissue Sampling Method
Tissue sample collection is one of the most important steps in cell isolation protocols. No significant differences in the quality of the isolated cells were found between the two methods of tissue collection: (1) the less invasive biopsy of the skin directly from the live, sedated fish and (2) the method in which the fish was sacrificed and a larger piece of skin tissue was removed. The scale-removal method is the least invasive of all the methods tested, but the amount of chromatophores obtained by this method was very low. In addition, the number of chromatophores adhering to the scales was highly variable, with some peeled scales having no chromatophores. The chromatophores on the scales also tended to clump together, making it difficult to isolate a single cell. The method of skin biopsy directly from live, sedated fish proved to be suitable with respect to the ethical standards maintained in animal research and also in terms of the quality and quantity of cells obtained through the further protocol of cell isolation.
The scars left after skin biopsy punches were only minor and all experimental animals recovered completely. Just one week later, the scars were barely visible and completely healed. Nevertheless, it is very important that the fish are handled with care and that the number of biopsy punches is minimal; in our case, a maximum of six cut-outs per fish were taken. Sampling with this non-lethal method also opens up the possibility of taking several skin samples during the lifetime of the animal or during the time of pigment pattern development and chromatophore differentiation.
3.2. Tissue Digestion
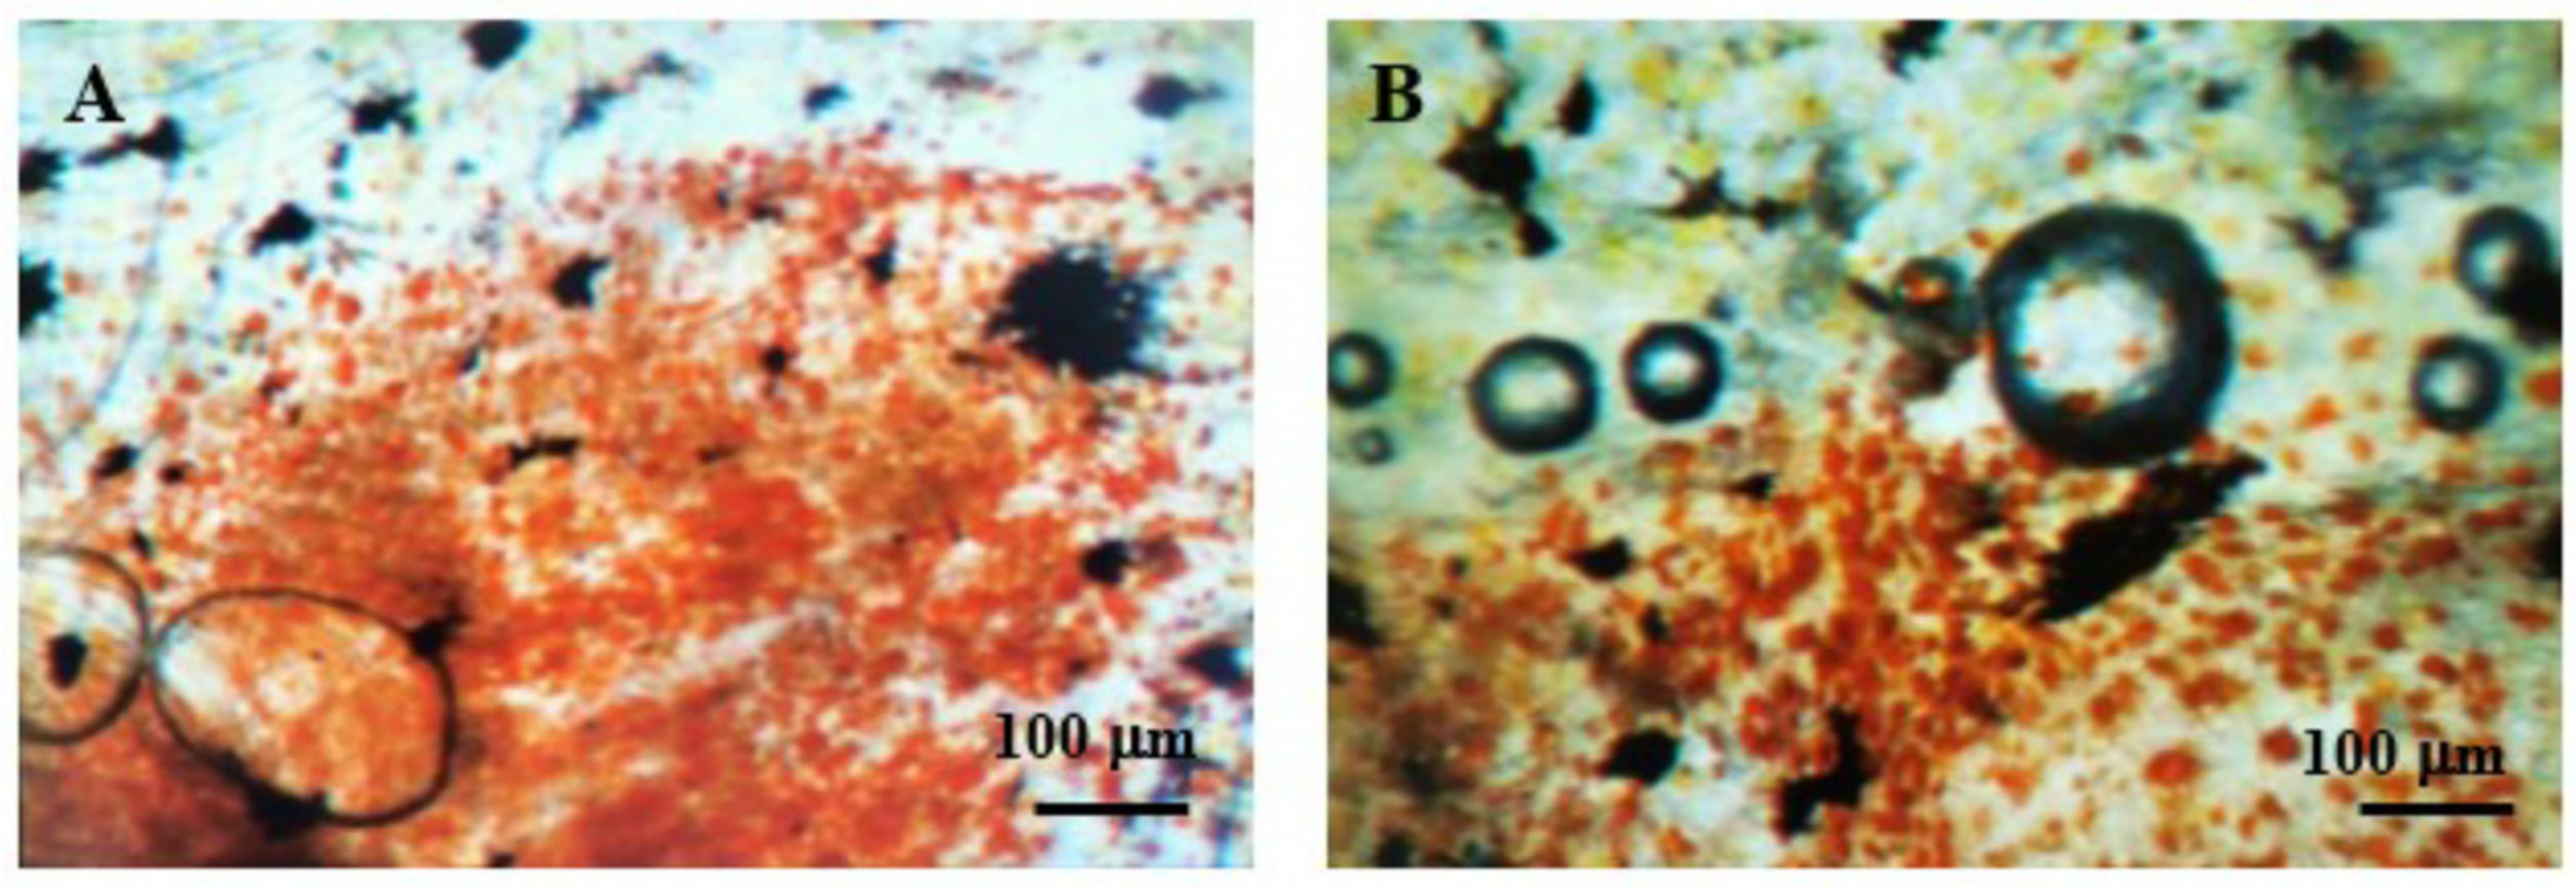
While testing for the optimal digestion time and concentration of trypsin, we observed that the digestion state was the same for both concentrations tested and all the different digestion times. The samples after the trypsin treatment showed almost no digestion compared to the samples before the treatment (
Figure 1). The samples with a different trypsin concentration and different digestion times were also observed under the microscope after the collagenase digestion. Again, there was no difference from the samples without the trypsin step (
Table 1).
The optimal time for digestion in the collagenase solution was 60 min (
Figure 2;
Table 1). A longer digestion time destroyed the cell membranes in a number of cells (
Figure 3), while a shorter digestion time resulted in undigested tissue without individual cells in the solution (melanophores remained connected to other cells of the dermis and other melanophores; while erythrophores were easily separated from other cells, they remained clumped together).
After the 60 min incubation period, the cells retained their morphology, which was very important for the later steps of cell identification and selection. The stronger collagenase solution (2 mg/mL) proved to be as effective as the more dilute one (1 mg/mL); therefore, we used the 1 mg/mL concentration of collagenase I (
Table 1).
We observed the same level of digestion when using both enzymes compared to using collagenase alone. Even when we tested different concentrations of trypsin and incubation times and a different batch of trypsin, the digestion of the tissue remained the same. We noticed that trypsin negatively affected the morphology of the chromatophores. After the digestion, the chromatophores appeared shrunken and much smaller, making identification difficult. Similar results have been reported in studies with glial and nerve cells, which share a common progenitor with chromatophores [
19,
20]. Based on these results, the trypsin step was omitted from the final protocol for cell isolation from brown trout skin. The protocol is thus based on only one-step enzyme digestion with collagenase, which halves the time required to isolate cells from a live fish (from about 2.5 h to 1.5 h).
Digestion of skin pieces was very effective; therefore, filtration of the cell solution proved to be unnecessary, since almost no undigested tissue remained in solution.
3.3. Gradient Centrifugation
After gradient centrifugation in Histopaque-1077, we obtained and collected three cell fractions, which were examined under the light microscope for the presence of specific cell types (
Table 2). A small amount of melanophores were mainly found in the sediment, while the supernatant contained the digested parts of the cells and pigment droplets. Erythrophores were not found in any of the cell fractions. Since the droplets contained red and orange pigments, it can be concluded that the gradient centrifugation destroyed the cell membrane of the erythrophores.
On paper, Histopaque gradient centrifugation seems to be an elegant solution to concentrate cells of similar size together, but when it comes to chromatophores it proves to be an unnecessary effort. Chromatophores, with their distinct elongated morphology and many pigment-containing inclusions, did not survive the forces of centrifugation through a dense solution of Histopaque. Not only did gradient centrifugation prove fatal for some chromatophores, the samples after gradient centrifugation still had to be selected with a mouth pipette or micromanipulator, so the same result could be achieved with serial dilutions of the enzyme-digested sample. By omitting this isolation step, another half an hour of the total time for cell isolation could be saved.
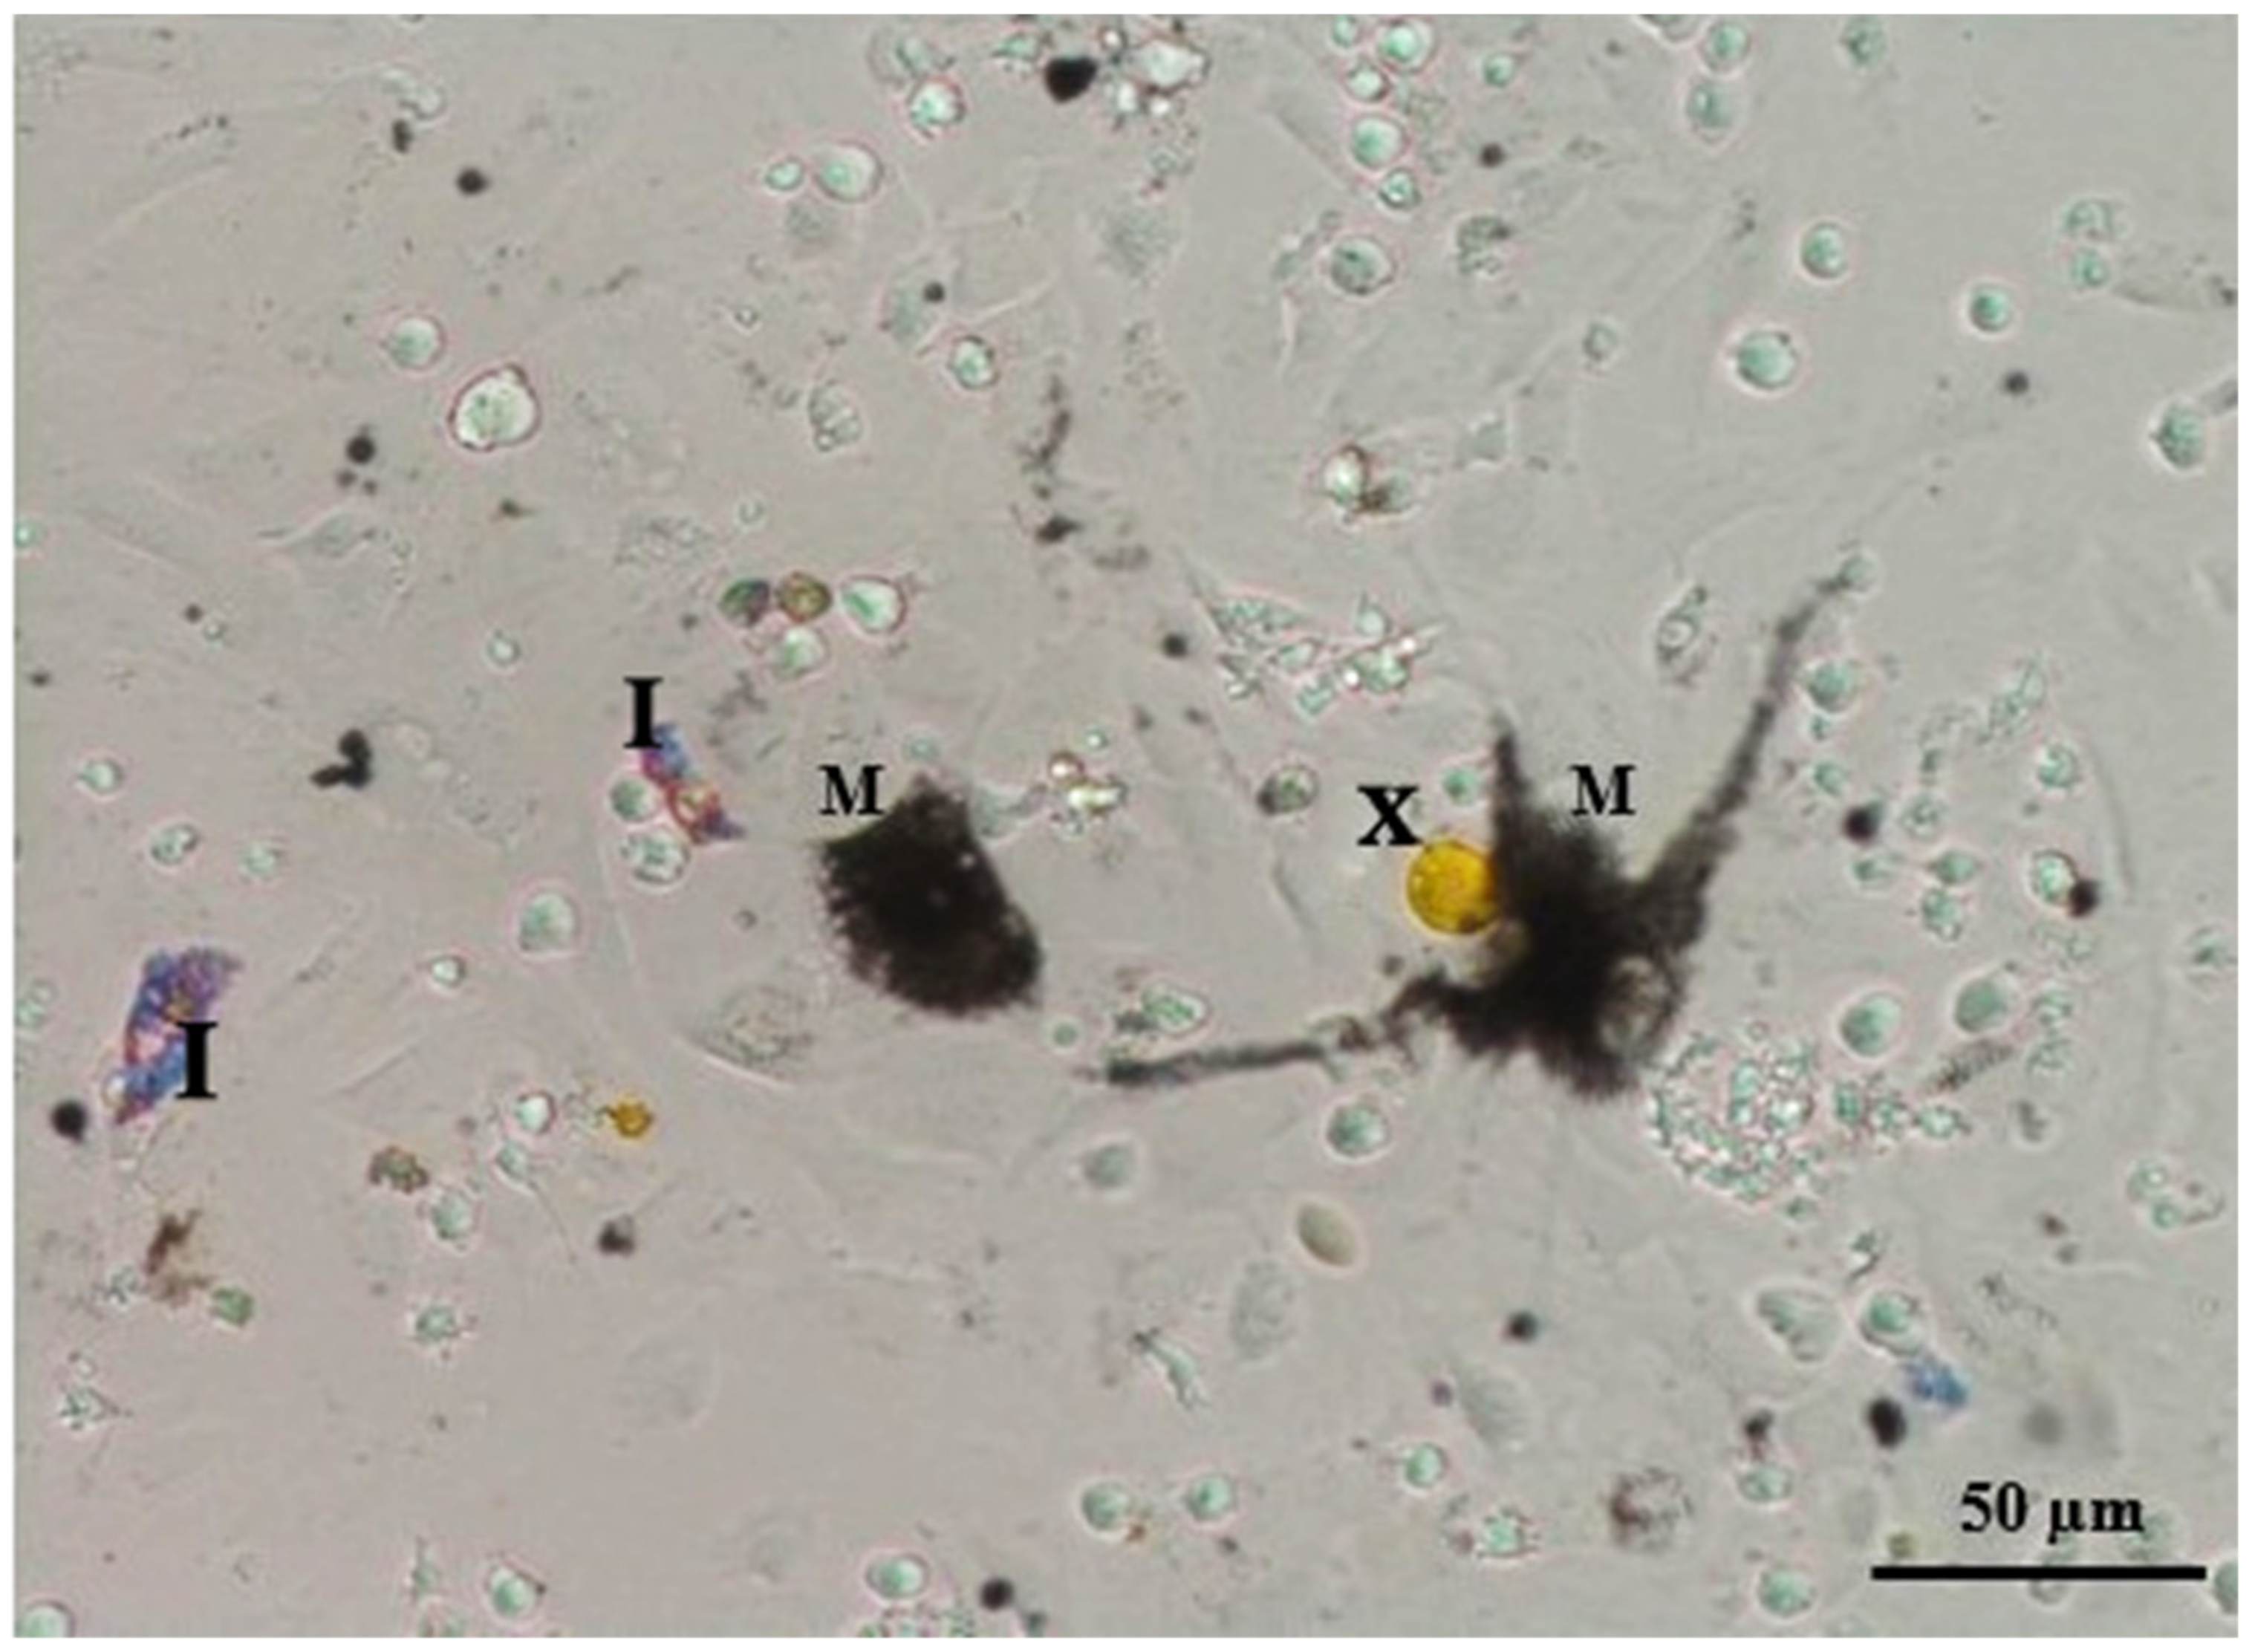
3.4. Cell Selection/Isolation
A mouth pipette proved to be the most appropriate tool for cell selection and collection, although the micromanipulator is more precise and easier to use for an unexperienced person (
Figure 4). However, it requires much more time to collect the same number of cells compared to using a mouth pipette, which could affect the quality of the cells and their further processing. When using the micromanipulator, cells often attached to the walls of the pipette, even when the pipette was coated with trypsin, making this approach even less suitable for rapid cell selection and transfer. Mastering the mouth pipette requires time and effort, but this technique is cost-effective and powerful for single-cell isolation.
3.5. Gene Expression Analyses
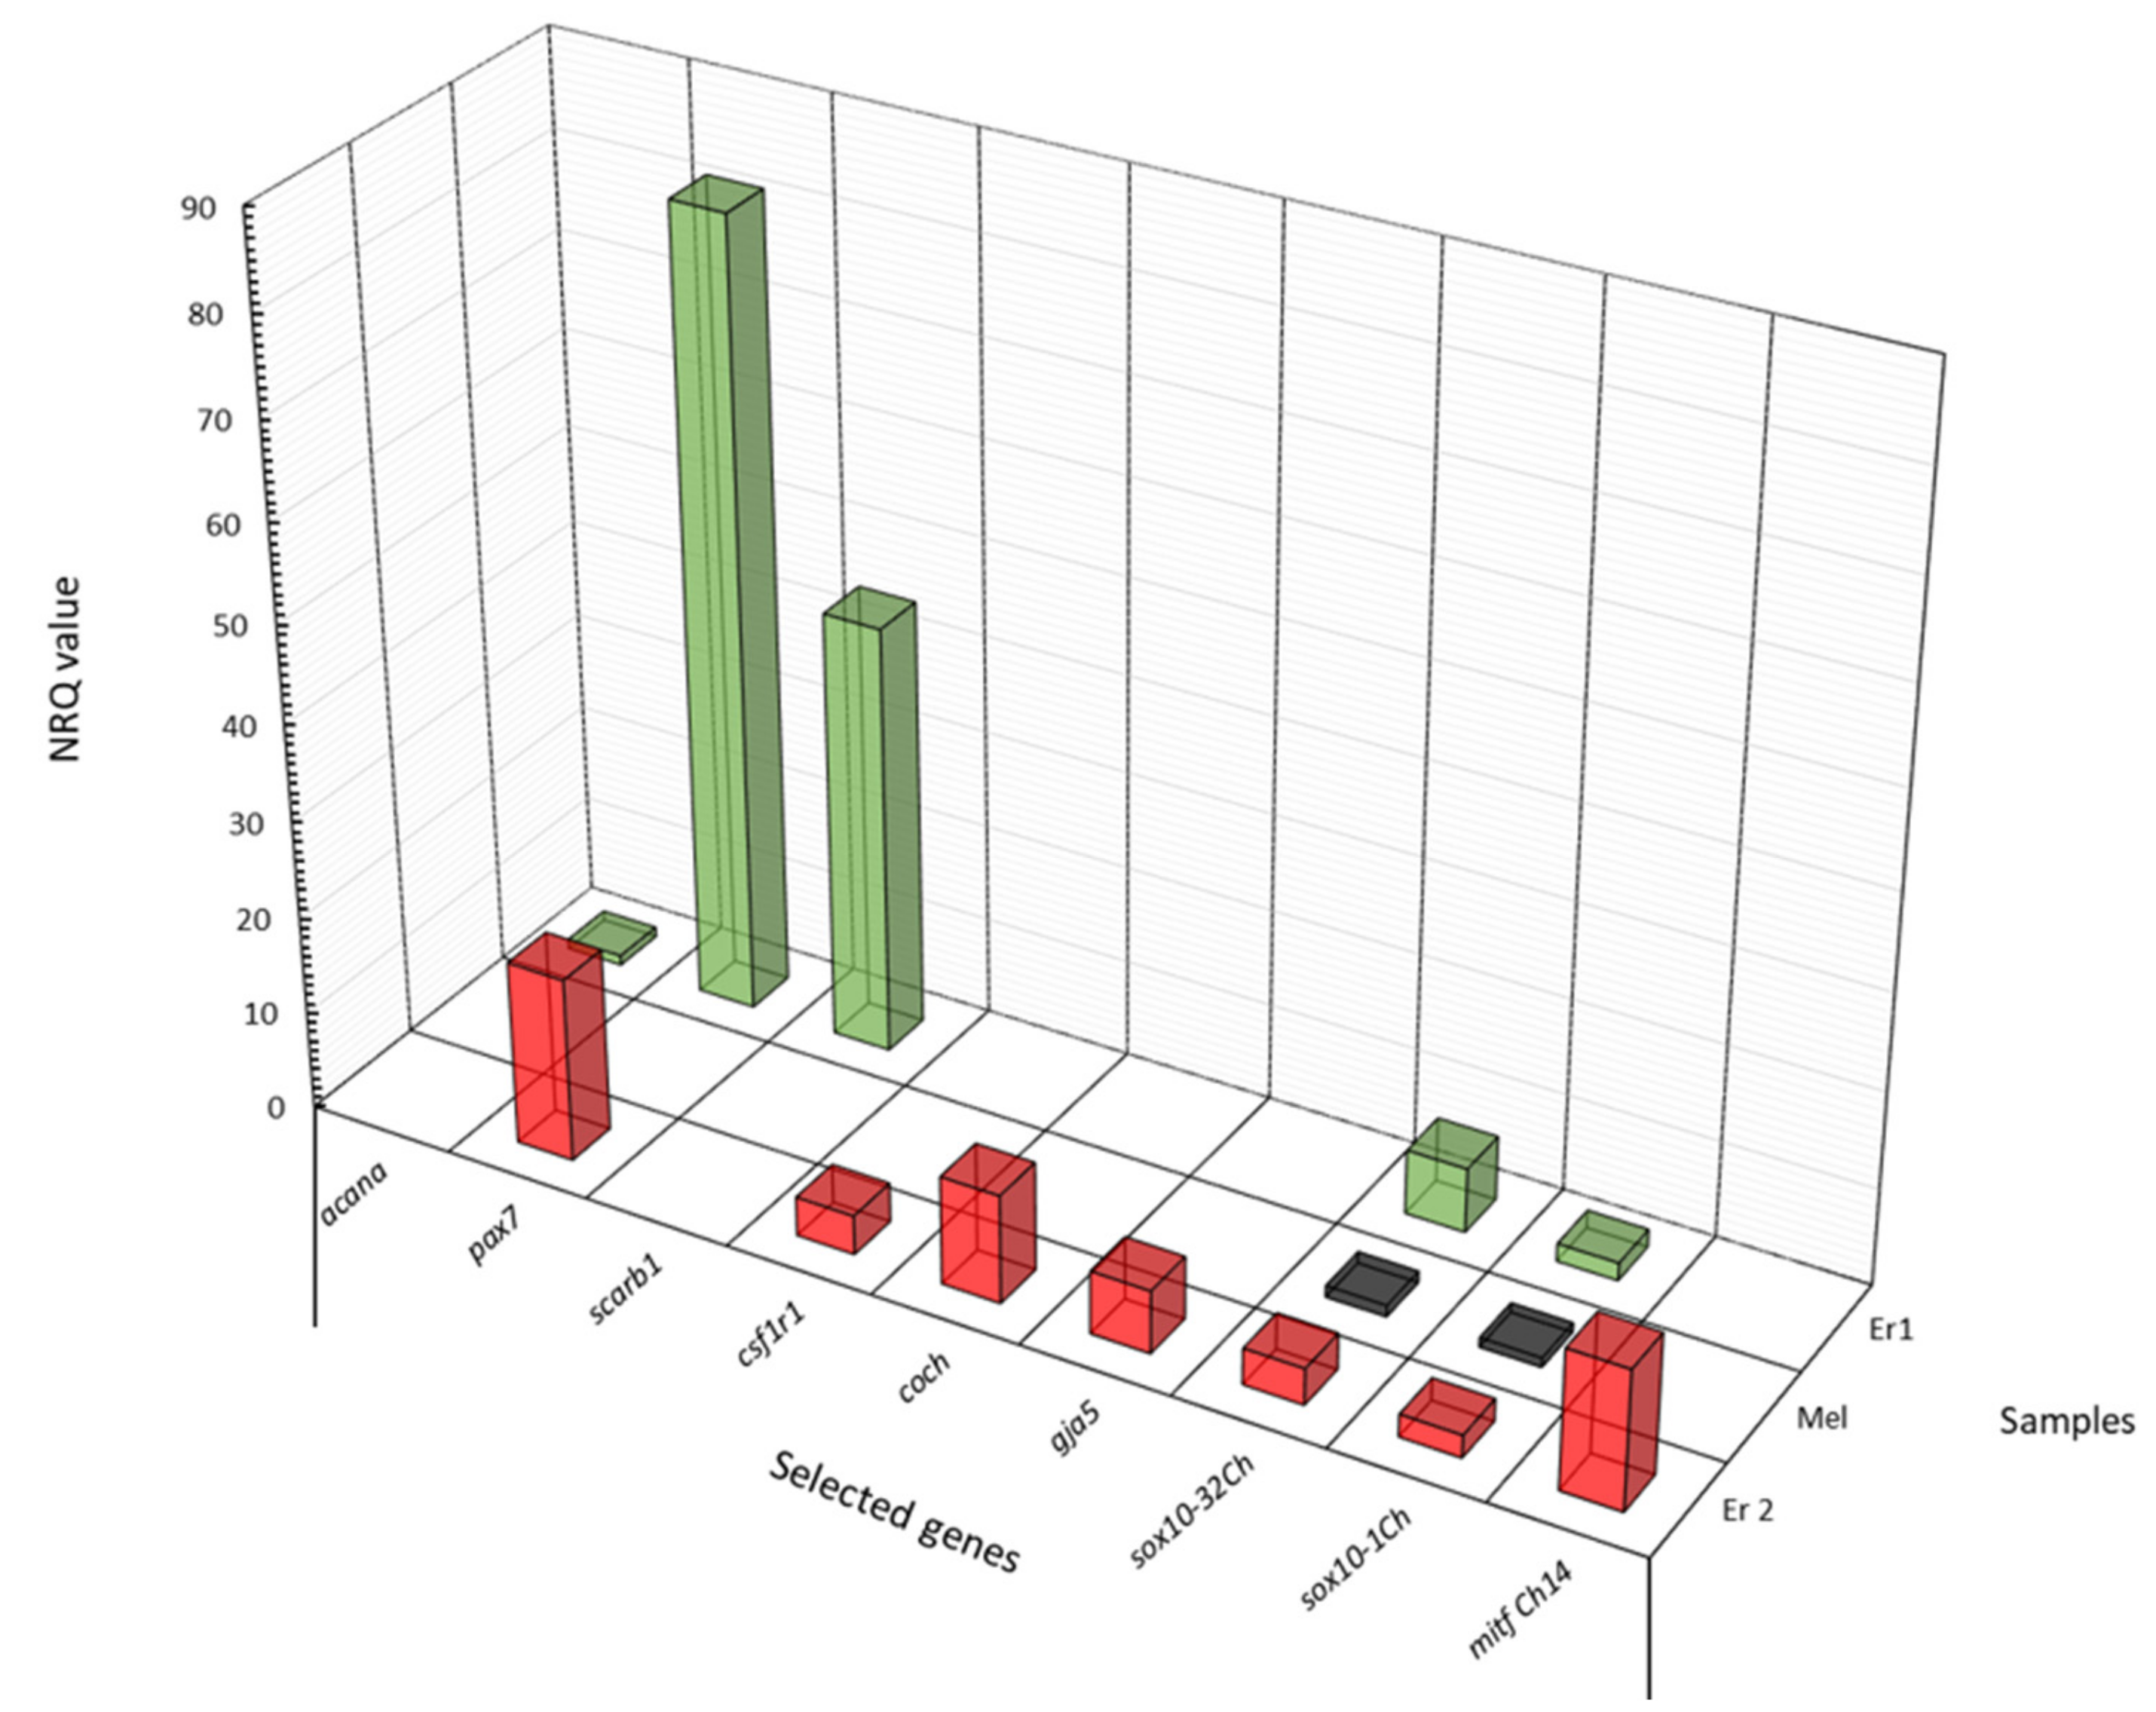
To evaluate the cell isolation protocol, i.e., the specificity of cell selection and the quality of isolated cells, the expression profile of several genes was determined in three multiple-cell samples of the same cell type from brown trout skin, each one containing 15–20 cells, isolated one by one and pooled in a microcentrifuge tube: Er1—subtype 1 erythrophores; Mel—melanophores; Er2—subtype 2 erythrophores.
The expression profiles of nine genes in three cell samples are presented in
Figure 5.
Selected genes have previously been shown to be strongly upregulated in brown trout red-spotted skin regions compared to black-spotted and background skin regions [
16]. Even though the results are based on only one biological sample, they indicate that the expression profiles of isolated chromatophores from red- and black-spotted skin regions are very different and cell type/subtype-specific. These results suggest that all cell samples consisted of only one selected chromatophore type/subtype and that the cells maintained their mRNA integrity after isolation.
The expression profiles are mostly concordant with previous results, showing upregulation in erythrophores and almost no expression signals in melanophores (sample Mel), with the exception of
sox10, which was downregulated in melanophores compared to both erythrophore subtypes (
Figure 5). Not all the results agree with earlier reports on candidate gene expression of the whole skin sample [
9,
16]. It might be speculated that these genes are also expressed in other cells present in red-spotted skin that may influence the formation and maintenance of red spots. These preliminary results for gene expression analysed in samples of only one cell type/subtype support previous evidence for a unique differentiation pathway of subtype 2 erythrophores in brown trout skin [
9]. The results further indicate the importance of the analysis of separate cell types compared to a diverse cell population present in a whole-tissue sample. The latter can give erroneous results, as it shows the expression of a large number of cells of different types which might not be involved in the particular trait studied.
The effect of the procedure on the overall RNA quality and quantity was tested with a direct comparison of RNA isolated from chromatophores and blood cells. The latter cells were not subjected to any enzyme treatment. RNA was of the same concentration (54 ± 9.5 ng/μL from blood cells and 49.7 ± 22.8 ng/μL from chromatophores, p = 0.8171), as was the CT for the rps20 housekeeping gene (30.72 ± 2.65 for blood cells and 31.55 ± 3.42 for chromatophores, p = 0.7072), demonstrating that the quantity and quality of RNA were not affected by the protocol of cell suspension preparation.
3.6. Applications and Potential Limitations of the Optimised Protocol for Single-Cell Suspension Preparation and Single-Cell Isolation
The preparation of single-cell suspensions is an important and indispensable first step for a wealth of new methods specifically designed for single-cell studies. Lately, gene expression within a single cell is of most interest. While droplet digital PCR (ddPCR) technology, similar to classical qPCR, uses pre-validated primers or primer/probe assays and, when using a single-cell suspension as a starting material, could be performed on a single-cell level [
21], an optimized next-generation sequencing—single-cell RNA sequencing—provides the whole expression panel of a cell at higher resolution for the purpose of cellular difference detection and a better understanding of the function of an individual cell in the context of its microenvironment [
22].
One of the possible downstream applications, presented in this study, includes single-cell selection and isolation from a single-cell suspension. Candidate gene expression could be tested within multiple cells of the same cell type and compared among samples of different cell types.
The presented protocol using the mouth pipette is particularly promising, considering the speed of selection and the flexibility in collecting different cell types. With in vitro culturing of isolated chromatophores, cell behaviour and migration analysis, as performed by [
14], could be studied.
All mentioned downstream applications rely on intact viable cells isolated from the target tissue. To further validate the cell isolation protocol and to test its effect on cell viability, isolated and selected cells were grown in in vitro culture in serum-free L15 medium (Thermo Fisher Scientific, Waltham, MA, USA) at 10 °C for two days (data not shown). The isolated chromatophores were found to be viable by observing membrane expansion and light reactivity under the microscope.
Although it has proven to be very successful, the protocol also has some limitations that could be further improved. One limitation concerns the selection and collection of single cells, which might become time-consuming when multiple cells (n > 30) of the same cell type are to be collected. In such cases, a cooling system for cell suspension during the cell collection procedure would be necessary to prevent heating under a microscope or microscope loupe. In addition, when cells are to be used for expression analyses, other kits for RNA isolation from low cell numbers should be tested, preferentially including RNA purification, which would improve the RNA quality.
4. Conclusions
The final protocol for single-cell suspension preparation and single-cell isolation from brown trout skin is presented in
Figure 6.
The presented optimised protocol for single-cell suspension preparation and single-cell isolation from brown trout skin is short (about 90 min), easy to carry out, requires no special equipment and is consistent with the high ethical standards required in animal research, as it does not require the sacrificing of animals. Furthermore, the skin biopsy can be taken from the same fish at multiple time points, allowing the study of chromatophore differentiation and their involvement in pigment pattern formation.
Most salmonid species reach similar sizes at maturity [
1]. In addition, skin morphology has been found to be comparable among them [
23,
24,
25]. Therefore, it can be assumed that the presented protocol can also be used for the isolation of chromatophores or other cells from skin in other salmonid species. We can conclude that the presented protocol enables single-cell suspension preparation from salmonid skin which can then serve as the basis for the selection and isolation of individual cells that are viable, with preserved expression profiles, and which could be used in a variety of downstream applications [
26]. As such, this protocol could greatly contribute to the understanding of the variety of pigment patterns which adorn salmonid fishes.


