Abstract
The longnose darter Percina nasuta is a rare and cryptic fish that recently disappeared from much of its historic range. We developed and used an environmental DNA (eDNA) assay for longnose darter paired with visual surveys to better determine the species’ range and compare detection probability between sampling approaches in an occupancy modeling framework. We detected longnose darter eDNA further upstream in the mainstem St. Francis River than previously reported and in a tributary for the first time. Our multi-scale occupancy approach compared models where detection was constant against a model that allowed detection to vary by survey method. The constant model received the most support indicating survey method was not a strong predictor and detection was estimated at 0.70 (0.45–0.86; 95% CI) across both methods. Our study produced effective longnose darter eDNA primers and demonstrated the application of eDNA for sampling small-bodied, cryptic fish. We detected longnose darter eDNA 27 km upstream of their known range and determined that snorkel surveys are the most efficient sampling method if water clarity allows. We recommend target sample sizes to achieve various detection goals for both sample methods and our results inform future design of distributional and monitoring efforts.
1. Introduction
Selecting a sampling technique to maximize the probability of detection is an important aspect of distributional surveys for rare aquatic species. Improper selection or application of sampling gear can result in low detection rates and incomplete knowledge of species distribution [1,2]. This error could be detrimental to conservation efforts and result in misguided management and policy decisions including erroneous listing under the federal Endangered Species Act [3]. Other situations could arise whereby populations essential to maintain representation, redundancy, and resiliency are undetected resulting in improper protection or management [4]. Thus, it is important to understand the detection capabilities of sampling methods to select the proper sampling approach and interpret results with an understanding of potential biases.
One increasingly common sampling approach for aquatic species is environmental DNA (eDNA). Environmental DNA is shed by an organism into its environment in the form of cells from skin, saliva, blood, excrement, gametes, or body decomposition [5]. This genetic material can be collected from the environment and used to detect the presence of an organism at or near the collection site [6]. Researchers designed a polymerase chain reaction (PCR) assay with primers that target a segment of a genetic region, commonly from the mitochondrial genome (mtDNA), the sequence of which should be unique to a single species and not highly variable within a species [7,8]. An alternative approach to eDNA analysis incorporates eDNA metabarcoding, which uses conserved primers specific to taxa at higher levels of organization and nearby variable regions of DNA that are specific to lower-level taxa, often unique to species [9,10,11,12]. When combined with high-throughput sequencing, eDNA metabarcoding can provide evidence of species presence for numerous species from a single water sample [12]. Although preferable in many circumstances, eDNA metabarcoding often results in lower detection for single species than the PCR approach designed with species-specific primers [13]. Regardless of approach, eDNA methodology has advanced as a detection method for small bodied aquatic organisms and provides scientists with promising tools for species detection [9].
The probability of species detection by eDNA sampling is influenced by factors, such as biomass of target organisms, the activity level of target organisms, the distance of the sample from nearest target organisms, stream discharge, water temperature, location of the sample in the water column, the volume of water filtered, filter pore size and PCR inhibitors present in the sampled water [14,15,16]. A significant correlation between total organismal biomass and eDNA concentration exists [14,17,18], though many factors influence this relationship in natural environments which complicates inference regarding organism abundance [16,19]. Contamination issues (false positives) are also possible but can be assessed by using control samples and following best practices in the field and laboratory [20,21,22].
The longnose darter Percina nasuta (Bailey) is a small-bodied (<100 mm total length), benthic fish that primarily occurs in mid-sized rivers in the Ozark regions of Missouri, Arkansas, and Oklahoma, USA [23,24]. They likely spawn from March through May, but little is known about their life history or reproductive ecology [25]. One of the rarest fishes in Missouri, USA, it is state endangered, classified as threatened by the American Fisheries Society [26], and was petitioned for listing under the U. S. Endangered Species Act in 2010 with no final listing recommendation made as of the publication of this study. The only known extant population of longnose darter in Missouri occurs upstream of Lake Wappapello in the mainstem St. Francis River, where only 46 individuals were observed prior to 2017 [27]. Longnose darters had never been captured in tributaries of the St. Francis River, but adequate sampling had not occurred to confidently support their absence and other darter species in the region that primarily use mainstem systems often use the lower end of tributaries near the confluence [28]. At a fine spatial scale, longnose darters select habitats containing large rock substrate in areas of slow water velocity [29]. These habitats are not conducive to traditional fish sampling methods (e.g., electrofishing, seining, trawling) which may have contributed to the paucity of records for this species. In addition to occurring at low densities in difficult to sample habitats [23], longnose darters almost never swim up in the water column and instead seek shelter in the substrate when disturbed (lead author, personal observation). Researchers have had recent success in locating longnose darters resulting from visual surveys using mask and snorkel [29]. However, effective visual surveys typically require underwater visibility above 70 cm [30], a condition that is uncommon in sections of the mainstem St. Francis River during warm season months, suggesting that the use of eDNA as an additional survey method may be beneficial.
Our goal was to develop an effective single-species eDNA sampling methodology to detect the presence of longnose darter in the St. Francis River located in Missouri, USA and compare that method to traditional visual survey methods. Our objectives were to (1) design a qPCR assay to selectively amplify longnose darter DNA, (2) further refine the distributional extent of longnose darter populations in the St. Francis River watershed, and (3) compare the detection probability for longnose darters between eDNA sampling methodology and visual survey methods.
2. Materials and Methods
2.1. Study Aera
The St. Francis River is a southerly flowing stream in the St. Francois Mountains in southeastern Missouri (Figure 1). It reaches sixth order [31] before becoming impounded by Wappapello Reservoir. This portion of the watershed is dominated by Precambrian igneous rock, except in the southern part of the drainage where it resembles nearby Ozark upland geology dominated by sandstone, dolomite, and cherty limestone [32]. The bed of the St. Francis River is dominated by bedrock formations creating long (often >500 m) pools connected by short areas of high gradient drop characterized by bedrock runs and cobble-dominated riffles. The drainage is characterized by a mostly (77%) forested landscape, with lesser amounts of grassland (10%), cropland (7%), and urban areas (6%) [32].
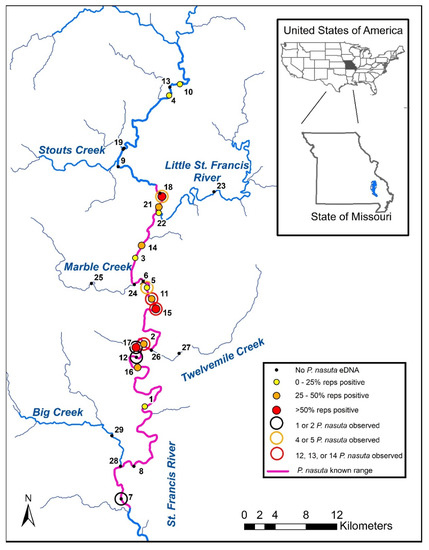
Figure 1.
Locations of the 28 sample sites in the St. Francis River drainage of Missouri, including Site 6 which was not sampled. There was no Site 20. Sampling outcomes are indicated by solid circles (eDNA) and open circles (visual surveys). Sites with no eDNA or visual detections are shown as black dots. The prior known range of longnose darter Percina nasuta is shown as a purple line.
We randomly selected sites along a 108 km reach of the mainstem St. Francis River (UTM Zone 15S, 729238, 4177093 to 723587, 4116401). This sampling extent covered the entire known range of longnose darter in the St. Francis River (76 km) and included approximately 32 km of the river upstream of their most upstream known location. Potential sampling points (address points) were plotted at 2 km increments along the extent of the defined reach and 19 of those points were randomly selected as sample sites. The exact location and extent of a given sample site was determined in the field by navigating to the pre-selected address point and then locating the nearest habitat consisting of a riffle-run complex.
We surveyed nine additional sites spanning four tributaries to the St. Francis River (Big Creek, Twelvemile Creek, Marble Creek, Little St. Francis River) to further define the distribution of the species and inform our ability to detect them. Tributary sites were split into two categories where downstream tributary sites (Sites 21, 24, 26, 28) were located on the tributary but within 200 m of the confluence with the mainstem. Upstream tributary sites (Sites 22, 23, 25, 27, 29) were further upstream in each of the tributaries, with two of those locations occurring on the Little St. Francis River (Site 22 was 1 km above the confluence and Site 23 was 16 km above the confluence). Upstream tributary sites were not selected randomly, rather based on accessibility and logistics. However, we followed the same sampling protocol and fine-scale site selection as defined for the mainstem sites. Survey results from upstream tributary sites were not included in analyses beyond describing distributional extent because they were not randomly chosen. Downstream tributary surveys were included in all analyses, thus defining the spatial extent of inference for our models and predictions as the 108 km of mainstem St. Francis River and the lower 200 m of its four major tributaries.
2.2. Assay Development
We designed primer-probe sets for the cytochrome b, mitochondrial (mt-cyb) region of the mitochondrial genome due to the availability of sequence information in this region for the Percina genus [33]. Using a complete list of the fish community within the St. Francis River collected from state natural history records, we collected cytb sequences from GenBank (National Center for Biotechnology Information) to make use of EcoPrimers v. 4.0 [34], which finds primers with length and mismatch parameters that may amplify P. nasuta while excluding the other taxa in the community. Given close relationships and taxonomic uncertainty among longnose darter and sister taxa, we also aligned longnose darter cytb sequences to available sequences from P. phoxocephala, P. brucethomsoni, P. evides, P. maculata, P. caprodes, and P. sciera (Supplemental Table S1). In an attempt to include local genetic variants in our selection of primer/probes, we sequenced and aligned mt-cyb from P. phoxocephala, P. evides, P. caprodes, and P. sciera using locally collected specimens. Waterbody of collection, amplification and sequencing details and accession numbers of these sequences can be found in Supplemental Table S1.
Parameters were set to search for primers 18–22 base pairs in length, having a maximum of three mismatched nucleotides with the target taxon, and amplifying a product of 100–400 base pairs [34]. Using a list of primers that were predicted to exclude non-target taxa, we examined non-overlapping primer sets with Geneious v. 10.2.3 [35] by aligning them to unique cytb sequences for the St. Francis fish community and visualizing primer binding and mismatches. Given close relationships and taxonomic uncertainty among longnose darter and sister taxa, we also aligned longnose darter mt-cyb sequences to available sequences from P. phoxocephala, P. brucethomsoni, P. evides, P. maculata, P. caprodes, and P. sciera (Table S1). We designed qPCR probes using candidate primer sequences from the EcoPrimers output and visual inspection of an alignment with sympatric Percina to exclude (≥1 probe-sequence mismatch) non-target Percina spp. Longnose darter from the Arkansas River grouped with P. phoxocephala [24] so they were also considered non-target taxa. We selected four assays, unique combinations of forward primers, reverse primers, and probes, for further testing with qPCR. Candidate assays were tested with genomic DNA extracts of longnose darter for sensitivity and were tested for specificity with genomic DNA extracts from seven sympatric and closely related Etheostoma and Percina species (E. caeruleum, E. nigrum, E. stigmaeum, P. caprodes, P. evides, P. maculata, and P. sciera), as well as eight available unrelated sympatric fish (Cottus carolinae, Ictalurus punctatus, Lepomis macrochirus, L. microlophus, Micropterus dolomieu, M. punctulatus, Moxostoma duquesnei, and Sander vitreus) based on distributional information by Pflieger [23]. Missouri Department of Conservation personnel collected all tissue sample sources for the genomic extracts from within the state of Missouri and no permits were required.
We performed a limit of detection (LOD) and limit of quantification (LOQ) test by running qPCR using the selected assay on a 2-fold standard dilution series of 8, 16, 32, 64, 128, 256, and 512 copies per reaction, and 24 replicates for each dilution [36]. We used the qPCR.-LoD-calculator.R script [37] for analysis. Here, we determined LOD to be where >95% of replicates of a standard copy number dilution amplified [36]. LOQ was determined by the highest copy number dilution with <35% coefficient of variation (C.V.) [36]. A CV threshold of 25–35% has been shown to be a good working standard for qPCR data [38,39]. We considered longnose darter present in a survey if at least one qPCR replicate was positive (i.e., amplified before 50 cycles).
2.3. eDNA Collection Protocol
We collected eDNA samples and conducted visual surveys during July and August, a time of year when stream discharge is typically near the lowest level and when many state conservation agencies have available field personnel to conduct sampling. Once at a randomly selected site, we identified an area of river at the downstream edge of a run/glide habitat where water was visibly moving. We approached the water collection site from the downstream direction and obtained water samples by filling one previously unused 3.8-L sealable polyethylene bag with 1.5 L water from the surface at each of three locations (25, 50, and 75% of the way across the wetted channel) to serve as three spatial replicates. Spatial replicates were used in occupancy modeling when temporal replicates were not obtainable or result in less informative results [40]. In our case, spatial replicates allowed us to sample a greater source area of DNA than temporal replicates would have allowed and provided inference to our focal unit of the entire riffle/run complex. Spatial replicates work if the conditions among replicates are similar such that the occupancy state is assumed to be consistent, which we contend was true given the turbulent mixing of water flowing through the focal area and close proximity (<10 m) of each replicate to one another.
Water samples were pumped through either 1.2 or 3.0-µm cellulose nitrate filters at the sample site using a peristaltic pump (Masterflex E/S portable sampler) or a hand operated vacuum pump (Mityvac model MV8255). Filters were housed in filter funnels (Nalgene Analytical Test Filter Funnels, 47-mm diameter). All filter funnels were sterilized off-site by full submersion in a 50% bleach solution for 10 min, soaked/rinsed in de-ionized (DI) or tap water for 10 min, and allowed to air dry in a clean environment for eight hours prior to reuse. Metal forceps used to handle filters were sterilized by soaking in a 50% bleach solution for a minimum of 5 min and rinsed in DI water. All personnel handling eDNA samples wore sterile nitrile gloves, which were changed between each replicate. If the filtering process took over 20 min for a single 1.5-L sample, a second filter was used to finish the replicate. Each filter was analyzed independently and not combined with other filters from the same replicate.
We were unable to filter samples in the field for several sites and instead maintained them on ice, transported them off-site, and filtered them within 24 h. Used sample filters were stored in 95% ethanol and held at −20° C until DNA isolation. We transported a 20-L container of DI water among sites and filled bags at each site to serve as a negative control (field blank). Each negative control was 1.0 L of DI water and was filtered following the collection and filtering of the three stream water samples for each site.
2.4. Fish Surveys
Immediately following the collection of water samples for eDNA analysis, a team of researchers sampled upstream of the eDNA sample collection site by conducting visual surveys with mask and snorkel. When visibility was adequate to snorkel, we conducted visual surveys using sight counts obtained by two snorkelers. To sample a site, each snorkeler was randomly assigned to either the right- or left-hand longitudinal half of the site. Moving upstream, they thoroughly searched all potentially suitable habitats on their half of the channel in a zigzag pattern at an approximate rate of 3 m/min. After completing sampling in half the site, snorkelers switched sides and surveyed the other half of the site with the result that each snorkeler sampled the entire site. A brief delay was observed before commencing the second pass to allow snorkelers to synchronize efforts, for water clarity to return to pre-sample conditions, and for longnose darters to resume normal behavior. Snorkelers did not communicate between passes to not bias each other and longnose darters rarely flee or stay hidden for more than a minute or two when encountering snorkelers (lead author, personal observation). The presence or non-detection of longnose darter at the site was defined individually for each snorkeler and served as two independent surveys of the site. Sites were typically defined by searching from the water collection point upstream for 25–80 m throughout the riffle/run habitat complex, but not into the pool habits bounding the upstream or downstream extent of the site. Snorkelers recorded the presence/absence of darter species and counted longnose darters observed. Final longnose darter counts for a site were determined by the two snorkelers comparing observations and agreeing on the number of unique individuals observed. For each site, snorkelers recorded wetted stream width and total area searched, percent composition by habitat type, average depth, temperature, lateral Secchi distance (m; 30 cm diameter Secchi disk), and turbidity (Nephelometric turbidity units [NTU]; Hach 2100P Turbidimeter) to assess sampling conditions and habitat characteristics.
At some sites, the water was too turbid to effectively snorkel (lateral Secchi distance was <70 cm and/or turbidity >7.00 NTU). At these sites, we assumed snorkelers would be unable to observe longnose darter based on experience and published relationships between detection probability for fish and turbidity [41]. Thus, we considered longnose darter as “undetected” for both snorkel passes in our analysis despite not actually snorkeling. However, to gain an additional understanding of longnose darter presence at turbid sites, we completed two sets of three hand-pulled Missouri trawl samples [42] for a total of six trawl samples per site. Trawl pulls were always between 10 and 50 m in length and targeted the areas from 0.5–1.5 m in depth. Trawl results were not included in further analysis but did allow further context in which to consider eDNA results.
2.5. eDNA Extraction and qPCR
We processed sample filters by removing them from original tubes and tearing them into several smaller pieces with forceps previously cleaned of DNA using a 50% bleach solution and rinsed them with nuclease free ultra-pure water. Filter pieces were placed in new microcentrifuge tubes and left open overnight in a hood to allow residual ethanol to evaporate. DNA from dried filters was extracted using the DNeasy Blood and Tissue kit (Qiagen, Inc., Ann Arbor, MI, USA) alongside 1–2 DNA extraction blanks. We used a larger volume of lysis buffer than described in the manufacturer’s protocol so the filters would be fully submerged during digestion. We added 610 µL of lysis buffer to filters with proteinase K at a concentration of 0.06 mAU/mL and placed them in a 65 °C water bath for 1 h to digest. Next, we added 600 µL of the buffer AL and 600 µL of 100% ethanol and mixed thoroughly. We transferred the supernatant to the kit spin columns and discarded flow-through in three separate steps to process the entire volume. Subsequent steps followed the manufacturer’s protocol, except samples were eluted in 50 µL to concentrate DNA samples. Each filter was extracted and analyzed independently, so extracts of filters from the same water sample were not recombined.
Quantitative PCR analysis was performed on a C1000 Touch thermal cycler with a CFX96 optical head (Bio-Rad Laboratories, Inc., Hercules, CA, USA). Reactions in a total volume of 20 µL contained 1X TaqMan Environmental master mix 2.0 (Thermo Fisher Scientific, Waltham, MA, USA), 800 nM each of the target forward and reverse primers, 100 nM of target probe with FAM fluorophore, 125 nM of internal positive control (IPC) forward and reverse primers, 93.75 nM of IPC probe with Cy5 fluorophore, 4200 copies of IPC template, and 3 µL extracted eDNA sample. Reactions were carried out under the following conditions: initial 95 °C for 10 min, followed by 50 cycles of 95 °C for 15 s, and 60 °C for 1 min with a fluorescence plate read at the end of each 60°C cycle. We analyzed three qPCR replicates for each filter sample and control, and ran positive and negative controls on each qPCR plate, including a 10-fold standard dilution series (3.0 × 10⁶–3.0 × 100 copies/reaction), genomic DNA (gDNA) positive control, and a negative template control (NTC). Because some field replicates required two filters, the number of total qPCR replicates per site varied from nine (if only a single filter was needed per field replicate) to 18 (if all three field replicates required two filters each). We reanalyzed plates if any template controls failed. Samples were considered inhibited if the IPC in the sample amplified 3 or more cycles later than the average IPC in the NTC wells. All extractions in qPCR work were conducted by U.S. Geological Survey staff at the Columbia Environmental Research Center in Columbia, MO, USA.
2.6. Analysis
We used multi-scale occupancy (multi-method option in program PRESENCE) which allows for simultaneous use of data from both methods performed at a site to inform method-specific detection [43]. Multi-scale occupancy includes parameters for site-scale occupancy (psi), detection (p), and subreach-scale occupancy (theta) which is the probability a species is present in the direct vicinity of the gear at the time of sampling [2]. We considered the three replicate eDNA field samples from a site and the two visual surveys as five independent surveys. Longnose darter were considered present in an eDNA survey if at least one qPCR replicate was positive. We modeled occupancy as a constant given our focus was on comparing detection methods and not an assessment of drivers of occupancy. We also used constant values of theta because they better fit the data. We modeled detection as constant across both methods, independently for each survey (i.e., gear type), and based on the covariates of turbidity (NTU), wetted width, and sampled area. Model support was assessed using Akaike Information Criterion to account for small sample sizes (AICc) and we set effective sample size as 17, which was the number of sites used in the analysis after upstream tributaries and contaminated sites from Plate 5 were removed. Candidate models with ΔAICc values ≤ 2 were considered to have similar, high support [44]. Modeling was done in program PRESENCE (version 2.12.10; U.S. Geological Survey, Patuxent, MD, USA).
We further assessed agreement between the two sampling methods (eDNA and visual surveys) using Cohen’s Kappa whereby each method was considered an independent rater [45]. A kappa value of one indicated perfect agreement between the two methods regarding the presence of longnose darter at a site. A kappa value of zero indicates any agreement is equivalent to chance alone. Finally, we plotted cumulative detection probabilities to determine, based on estimated detection probabilities, how many surveys of a given gear (either eDNA sample or visual survey) are required to reach desired detection probabilities [46,47]. We plotted the cumulative detection probabilities using the detection estimates and their 95% confidence interval (CI) from our multi-scale occupancy analysis using the model that estimated separate detection probabilities for each of the two gear types.
3. Results
3.1. Assay Development
Of the four primer and probe combinations tested, we successfully identified one specific to longnose darter (primers LND-f1 (TTTTAGGCTTCGCTGTTC), LND-r1 (AGAGCGTAAAATTGCATAG), and probe LND_probe1(5′-/56-FAM/TAACCCCTT/ZEN/AGTTACACCCCCACACATT/3IABkFQ-3′)). Although this assay was specific to the target species, initial tests showed that when run against a standard dilution of synthetic DNA (gBlock from IDT, Inc., Coralville, IA, USA) standards below 3.0 × 10² did not amplify within 40 cycles reliably. Thus, we conducted 50 cycles of the qPCR assay which resulted in all standards amplifying reliably. The LOD of the assay was 8 copies/reaction. However, the standard curves had a low PCR efficiency (52.4–84.0%) and because the qPCR efficiency was not constant over the entire standard curve, an LOQ could not be determined and reliable estimates of target concentration could not be made in the environmental samples. Thus, we did not attempt to explore the relationship between the number of DNA copies and the number of longnose darters observed at a site.
All gDNA positive controls and IPC’s amplified as expected suggesting no sample inhibition. Plates, where NTC wells had amplification, were reanalyzed until no amplification occurred to rule out contamination by the standard or positive control. However, one plate (Plate 5) had to be analyzed five times because of repeated false positive contamination in the NTC. The sample volumes on this plate were exhausted before a negative NTC result could be observed, thus we could not rule out possible contamination of Plate 5.
3.2. Distributional Sampling
We sampled 27 sites over a two-week period from 23 July–2 August 2018 (Table 1). Site 6 was excluded due to logistical reasons. River discharge during this period ranged from 0.8 to 1.2 cubic meters per second (USGS Gage 07036100, Saco, MO, USA), which was near seasonal lows for the system. Actual sampled locations ranged from 1.5–14.0 km apart. The average area sampled was 967 (±613 standard deviation) m2 and the average time spent snorkeling or trawling was 50 (±17 standard deviation) min for each of two people.

Table 1.
Results from environmental DNA (eDNA) and visual surveys for longnose darter Percina nasuta in the St. Francis River, Missouri surveyed in July and August 2018. The eDNA detection history is shown as “0” (negative) and “1” (positive) such that “010” is a positive detection in the second survey and negatives in the first and third surveys. A “..” represents a sample where visual surveys via snorkeling were not conducted but assumed to be zero. Upstream tributary sites are indicated by “U” and downstream by “D”. Site 6 was not sampled and there was no site 20. Sites used in occupancy analysis are bolded. NTU = Nephelometric turbidity units.
DNA in field control blanks amplified in four (15%) of our 27 sites (3, 4, 9, and 11) indicating that longnose darter DNA contamination was present in these field blank samples. Of these four sites, longnose darter DNA was detected in the field replicated eDNA samples at three of the sites, but not at site 9. Of those possibly contaminated samples, only site 11 had visual confirmation of longnose darter. Two of the failed controls were from Plate 5, which may have suffered from laboratory contamination issues as identified above. Sites 1–5 were all on this potentially contaminated plate, including a positive detection of longnose darter eDNA at site 4 which was outside the known range of the species. We retained eDNA results from sites 9 and 11 in our analyses despite potential field contamination and explained the likely source of contamination in the discussion. Sites 1–5, which were run on Plate 5, were all excluded from analyses where we investigated eDNA because of potential laboratory and field contamination, but visual survey results for these sites were retained.
We detected longnose darter eDNA at the upstream-most sampled site (Site 10) on the mainstem St. Francis River, thus extending the known range of the species by 27 km (Figure 1). Most detections and the highest abundances of longnose darters occurred in the middle section of the river (Figure 1). Longnose darters were also detected at the two locations farthest downstream (Sites 21 and 22) on the Little St. Francis River, which were the only positive detections on any tributary.
3.3. Comparison of Survey Methods
We collected eDNA samples from 27 sites and detected longnose darter at 14 of them (Table 1, Figure 1). Longnose darters were never captured while trawling (five sites) but were observed during visual surveys (eight of 22 sites; Figure 1). We visually observed longnose darter at two sites (7 and 12) where we did not detect their eDNA. We detected longnose darter eDNA at four sites (1, 16, 21, 22) where we did not visually observe them while snorkeling and from another four sites (3, 4, 10, 14) where we did not capture them while trawling (Table 1).
Our multi-scale occupancy analysis showed the greatest support for the model in which detection was constant (AICc weight = 0.58; Table 2). The occupancy estimate for the top model was 0.66 (0.34–0.88; 95% CI), the estimate for theta was 0.73 (0.35–0.94; 95% CI), and the detection probability was 0.70 (0.45–0.86; 95%CI). The next highest model allowed detection to vary by survey type and had a ΔAICc value of 2.15 (AICc weight = 0.20) where the detection estimate for eDNA was 0.80 (0.46–0.95; 95% CI) and was 0.62 (0.34–0.83; 95% CI) for visual surveys. The candidate models including covariates on detection were least supported (Table 2) and thus not discussed further. Naïve occupancy (no correction for incomplete detection) estimated from those same sites was 0.59 (10 of 17 sites).
Table 2.
Model selection results for multi-scale single season occupancy models comparing models where occupancy (psi) was held constant. Sub-reach scale occupancy (theta) was held constant. Detection probability (p) estimates were either held constant, varied between eDNA and visual surveys, or modeled with a covariate. Data used in this analysis included the 13 mainstem sites that were not on the contaminated Plate 5 and the four downstream tributary sites. AICc = Akaike Information Criterion for small sample sizes.
The Cohen’s Kappa estimate was derived from the same 17 sites used in the occupancy analysis and showed substantial (0.64), but not a perfect agreement between eDNA and visual survey methods. Cumulative detection probabilities based on estimates from the multi-scale occupancy approach indicated that five eDNA samples or seven visual surveys would produce 95% detection probability at a site for even the lower end of the confidence interval (Figure 2). Disregarding the 95% CI and focusing only on the central estimates themselves suggests that two eDNA samples or three visual surveys would yield a 95% detection probability or greater.
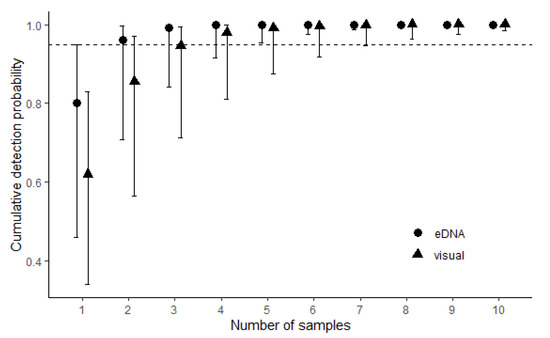
Figure 2.
Cumulative detection probabilities with 95% confidence intervals of longnose darter Percina nasuta in the St. Francis River drainage of Missouri. Black circles (eDNA surveys) and black triangles (visual surveys) represent detection probabilities based on output from multi-scale single-season occupancy models in the mainstem St. Francis River. The dashed line denotes the 95% detection probability threshold.
4. Discussion
4.1. Assay Development
The assay we used had a lower than preferred efficiency, but it did not cross-react with closely related, sympatric species in the genus Percina. The declining efficiency at lower standard concentrations suggested competition from a primer-dimer or hairpin structure among the primers and/or probe. In this project, high specificity to detect only the target species was more important than the ability to quantify DNA. Trade-offs may occur when designing PCR assays for species detections, especially when closely related species co-occur in the sampled area and sequence information is limited [48]. Additional investigation is required to determine a more robust eDNA-based predictor of longnose darter abundance. Possibilities include developing additional mitochondrial DNA sequence data from longnose darter and related sympatric species to allow the design of specific and efficient qPCR primers, optimizing filter type and pore size to increase the amount of DNA collected per filter, and optimizing the number of water samples per site and number of replicate qPCRs per sample. Additional mitochondrial DNA sequence data would also facilitate the use of emerging eDNA technologies, such as metabarcoding.
Due to an inefficient qPCR assay, we could not confidently quantify eDNA concentration for longnose darter. This was likely confounded by the low population density of longnose darter. Simply detecting the presence of fishes that occur at low densities can require high numbers of samples [49]. Thus, we were not able to investigate the relation between eDNA concentration and observed abundance. Additionally, we intended to only use 1.3-micron filters but used two different filter sizes because of shipping delays. This factor would have further complicated the quantification of eDNA concentration. We recognize that this may have also confounded detection probability given the efficiency of various filter pore sizes at capturing eDNA, but also acknowledge a wide range of filters are commonly used ranging from 0.2 to 20 µ [50]. Future work could investigate the utility of estimating eDNA concentration from detection rates [51].
4.2. Distributional Sampling
Environmental DNA detections expanded the known range of longnose darter in the St. Francis River watershed into a tributary, the Little St. Francis River (Sites 21 and 22), for the first time. Although we did not visually observe longnose darter in the Little St. Francis River sites during this study, subsequent visual survey efforts in 2019 confirmed the presence of longnose darter at, and upstream of, the eDNA detection sites. Our eDNA results also indicate the presence of longnose darter at two sites (Sites 4 and 10) well upstream of their known range in the mainstem St. Francis River. This section of the river was too turbid to snorkel, and trawling did not produce any longnose darter suggesting they were not otherwise easily detected by traditional gears. It is possible these two locations represent false positives; however, we believe the chances of both being in error are low because these collections were performed on the first day of sampling before any known positive sites were visited (i.e., potentially less field contamination) and the sites were analyzed on different qPCR plates. Regardless, additional effort is warranted to confirm their presence. If longnose darter occurs at the uppermost site in addition to the lower end of the Little St. Francis River, the known range of longnose darter in the St. Francis River drainage would be expanded by 27 km to a total of 103 km.
The lack of detection of longnose darter by either eDNA or visual surveys in the remaining tributary sites further confirms previous hypotheses that the species does not occur in smaller systems [23]. There are abrupt habitat changes between the mainstem St. Francis River and its tributaries [32]. The largest tributaries are 3rd or 4th order [31] at their confluence with the 5th order mainstem. However, they typically contain less turbid water, less diverse fish assemblages, and have much smaller habitat patches which may be less suitable for longnose darter. Other aquatic organisms in Missouri have similar affinities for mainstem rivers and do not commonly occur in smaller streams. For example, Niangua darter Etheostoma nianguae occupy mainstem streams and areas of tributaries closest to the mainstem [28]. Similarly, surveys using seining methods and eDNA methods for Coldwater Crayfish Faxonius eupunctus in the Eleven Point River of Missouri detected their target species primarily in the mainstem, but also in one tributary [52].
Despite the absence of longnose darter in the tributaries during our surveys, those systems may still be important to the species. Many fish species are known to ascend tributaries to spawn or complete their life cycles [53], including some darter species [54]. Research into darter movement has shown long-distance movement is more frequent than previously thought [55,56]. It is not known if longnose darters exhibit long-distance or seasonal movement, but additional surveys in tributaries during their spawning season may provide additional insight.
We cannot determine the exact spatial location of the source of the eDNA we detected at any given site, but we do not believe DNA transport in this riverine setting greatly affected our results as it has for others. For example, Rice et al. [52] posited that they had more crayfish eDNA detections lower in their study stream despite reduced target species abundance due to downstream DNA transport. We observed lower densities of our target species in the downstream-most reaches during visual surveys, but our eDNA detections were also reduced in the low abundance area providing some evidence that DNA transport was not likely to occur over long distances. Transport of eDNA in aquatic systems is complex [57], but the St. Francis River contains long, slow-moving pools that likely reduce the distance of DNA transport during baseflow conditions and expose DNA to warmer temperatures, and potentially higher rates of degradation, as compared to the spring-fed and fast-flowing Eleven Point River surveyed by Rice et al. [52]. Additionally, the lack of detection in most tributaries narrows the possible source to only the mainstem. Thus, we suspect our eDNA positive samples represent longnose darter presence in the riffle and run complexes directly above our sample locations and not transport of DNA from further upstream.
4.3. Comparison of Survey Methods
Given the model that held detection constant was the most supported, our data suggest that eDNA and visual surveys have similar detection probabilities around 0.70. There is often uncertainty when designing a field study regarding how much sampling effort to allocate to reach desired detection levels. Like ours, many eDNA studies in stream systems collect three, 1–2 L water samples per site [58,59], but not all do [52]. Interestingly, our estimates of cumulative detection probability indicated that two eDNA samples or three visual surveys would produce detection levels near 95% and that five (eDNA) or seven (visual) samples would ensure that even the lower confidence bounds on detection would exceed 95%. Strickland and Roberts [60] used nested information from repeat water samples each with repeat qPCR replications and suggested that for streams with average densities of Roanoke Logperch Percina rex, three water samples and three qPCR replicates could achieve cumulative detection probabilities of >0.9. Moore et al. [47] applied multi-scale occupancy models in a gear comparison framework for Clinch dace, Chrosomus sp. cf. saylori, and stated that backpack electrofishing produced a 55% greater detection probability than minnow traps. Pregler et. al. [2] used multi-scale occupancy models to compare sampling gears for the bridle shiner Notropis bifrenatus and found greater detection probabilities for seining (0.77) compared to backpack electrofishing (0.33). Failure to compare a focal gear type against a feasible alternative may result in overconfidence in detection estimates, especially if sample sizes are small.
Our small sample sizes likely precluded us from fully investigating the effect of turbidity and other covariates on detection for either sampling gear. However, the low model support for any covariates on detection suggests the effects of these covariates are not overpowering given the conditions in which we sampled. Specifically, turbidity plays an important role in the effectiveness of visual surveys and eDNA surveys. Snorkel surveys for fish in clear water often produce detection rates from 70–90% [61,62], comparable with our detection estimates. Turbidity can negatively affect eDNA sampling, whereby it clogs filters with small pore sizes [60] or causes PCR inhibition [63]. In our system, high turbidity at some sites prevented visual surveys but did not prevent eDNA sampling. As we demonstrated and as in other turbid systems [59], eDNA is an effective sampling approach for small-bodied fishes in rivers. However, Castañeda et. al. [41] showed that snorkeling can result in higher detection rates than eDNA for fishes and noted the negative influence of turbidity on detection. Similarly, Ulibarri et al. [64] compared eDNA to snorkeling techniques and concluded that snorkeling was more effective, however, see Wilcox et al. [65] and Amberg et al. [66] for further discussion. Other conditions beyond high turbidity may exist, whereby eDNA is favored over snorkeling. If visual surveys are unsafe (e.g., hazardous flows, whole-body contact warnings related to pollutants, cold temperatures), eDNA sampling may provide an alternative sampling method with similar detection capabilities.
We experienced contamination (false positives) in our negative control field blank samples (15%). False positives can stem from many sources ranging from sample acquisition to laboratory analysis [6,67]. In our study, we suspect the false positives arose from contamination of field blanks. Pre-filled and sealed “cooler” blanks are common in eDNA studies [20] but may not fully expose the control sample to the same sources of contamination that field samples experience. We attempted to more fully simulate water sample acquisition with our method of filling bags with DI water on-site. However, our DI water container had a spout that was external during use but could be reversed and stored within the container during transport by canoe or truck, which proved a poor choice. We attempted to keep the container and spout clean by keeping it in a bag and wearing clean nitrile gloves when moving it, but there were ample opportunities for contamination in the DI source. We did not use this DI water source for any other steps in the filtration or cleaning process, so contamination of the container would not have influenced the accuracy of field samples. Ultimately, contamination issues could sway skeptical researchers away from eDNA approaches if other sampling approaches provide similar detection probabilities at similar costs.
5. Conclusions
We were able to effectively develop an eDNA assay and apply it, along with visual surveys, to assess the distribution of longnose darter in the St. Francis River drainage of Missouri. This resulted in a range expansion for the species and valuable insight regarding future sampling approaches. The longnose darter occupied a high percentage of riffle/run complexes within our study reach, indicating that conservation efforts that focus on protecting the mainstem St. Francis River and lower section of the Little St. Francis River may be appropriate. Given similar detection probabilities, future sampling could include either visual surveys with mask and snorkel or eDNA surveys. We did not quantify sampling costs, but snorkeling was faster and less expensive than eDNA sampling based on observations of time requirements for filtering and laboratory analysis. Thus, future sampling efforts for benthic fishes, such as longnose darter may be most effective if they focus on snorkel surveys when water visibility is adequate and eDNA surveys if it is not.
Supplementary Materials
The following supporting information can be downloaded at: https://www.mdpi.com/article/10.3390/fishes7020070/s1, Supplemental File S1: Species and associated gene sequences used to design an eDNA assay for detection of Longnose Darter (Percina nasuta) in Missouri, USA. Table S1: Reference mt-cyb sequence accession numbers in GenBank used to design a qPCR assay for longnose darter (Percina nasuta) eDNA in southeast Missouri, USA [68].
Author Contributions
J.T.W., L.K.B., K.E.K., N.L.T. and C.A.R. contributed to conception and design of the study, participated in data acquisition, analysis, and interpterion of the data; J.T.W. contributed most of the writing with assistance from L.K.B., K.E.K., N.L.T. and C.A.R. All authors have read and agreed to the published version of the manuscript.
Funding
This project was funded by the United States Forest Service and Missouri Department of Conservation as Project 18-CS-11090500-039. Any use of trade, firm, or product names is for descriptive purposes only and does not imply endorsement by the U.S. Government.
Institutional Review Board Statement
This study was performed under the auspices of the Missouri Department of Conservation which does not require Animal Care and Use Committee approval for field sampling by its staff.
Informed Consent Statement
Not applicable.
Data Availability Statement
The data that support the findings of this study are available at https://doi.org/10.5066/P9Z597LN (accessed on 1 January 2022).
Acknowledgments
We thank J. Decoske, K. Moore, C. Skinner, C. Pemberton, A. Coons, and R. Limback for their skilled assistance in the field and during water filtering efforts. C. Titus assisted with primer development and D. Novinger provided guidance and project administration. A special thanks to the willing landowners who allowed us to access our sample sites through their property. We also thank the anonymous reviewers who helped improve the manuscript.
Conflicts of Interest
All authors declare no conflict of interest or involvement in any organization or entity with any financial or non-financial interest in the subject matter or materials discussed in this manuscript.
References
- Coggins, L.G., Jr.; Bacheler, N.M.; Gwinn, D.C. Occupancy models for monitoring marine fish: A bayesian hierarchical approach to model imperfect detection with a novel gear combination. PLoS ONE 2014, 9, e108302. [Google Scholar] [CrossRef] [PubMed] [Green Version]
- Pregler, K.C.; Vokoun, J.C.; Jensen, T.; Hagstrom, N. Using multimethod occupancy estimation models to quantify gear differences in detection probabilities: Is backpack electrofishing missing occurrences for a species of concern? Trans. Am. Fish. Soc. 2014, 144, 89–955. [Google Scholar] [CrossRef]
- Moler, P.E.; Enge, K.M.; Tornwall, B.; Farmer, A.L.; Harris, B.B. Status and Current Distribution of the Pine Barrens Treefrog (Hyla andersonii) in Florida. Southeast. Nat. 2020, 19, 380–394. [Google Scholar] [CrossRef]
- Wolf, S.S.; Hartl, B.; Carroll, C.; Neel, M.C.; Greenwald, D.N. Beyond PVA: Why Recovery under the Endangered Species Act Is More than Population Viability. BioScience 2015, 65, 200–207. [Google Scholar] [CrossRef] [Green Version]
- Bohmann, K.; Evans, A.; Gilbert, M.T.P.; Carvalho, G.R.; Creer, S.; Knapp, M.; Yu, D.W.; de Bruyn, M. Environmental DNA for wildlife biology and biodiversity monitoring. Trends Ecol. Evol. 2014, 29, 358–367. [Google Scholar] [CrossRef] [PubMed]
- Darling, J.A.; Mahon, A.R. From molecules to management: Adopting DNA-based methods for monitoring biological invasions in aquatic environments. Environ. Res. 2011, 111, 978–988. [Google Scholar] [CrossRef] [PubMed]
- Coulter, A.A.; Keller, D.; Amberg, J.J.; Bailey, E.J.; Goforth, R.R. Phenotypic plasticity in the spawning traits of bigheaded carp (Hypophthalmichthys spp.) in novel ecosystems. Freshw. Biol. 2013, 58, 1029–1037. [Google Scholar] [CrossRef]
- Olson, Z.H.; Briggler, J.T.; Williams, R.N. An eDNA approach to detect eastern hellbenders (Cryptobranchus a. alleganiensis) using samples of water. Wildl. Res. 2012, 39, 629–636. [Google Scholar] [CrossRef]
- Baird, D.J.; Hajibabaei, M. Biomonitoring 2.0: A new paradigm in ecosystem assessment made possible by next-generation DNA sequencing. Mol. Ecol. 2012, 21, 2039–2044. [Google Scholar] [CrossRef]
- Bush, A.; Compson, Z.; Monk, W.; Porter, T.M.; Steeves, R.; Emilson, E.; Gagne, N.; Hajibabaei, M.; Roy, M.; Baird, D.J. Studying ecosystems with DNA metabarcoding: Lessons from biomonitoring of aquatic macroinvertebrates. Front. Ecol. Evoloution 2019, 7, 434. [Google Scholar] [CrossRef] [Green Version]
- Hajibabaei, M.; Baird, D.J.; Fahner, N.A.; Beiko, R.; Golding, G.B. A new way to contemplate Darwin’s tangled bank: How DNA barcodes are reconnecting biodiversity science and biomonitoring. Philos. Trans. R. Soc. B Biol. Sci. 2016, 371, 20150330. [Google Scholar] [CrossRef] [PubMed]
- Keck, F.; Vasselon, V.; Tapolczai, K.; Rimet, F.; Bouchez, A. Freshwater biomonitoring in the Information Age. Front. Ecol. Environ. 2017, 15, 266–274. [Google Scholar] [CrossRef]
- Harper, L.R.; Handley, L.L.; Hahn, C.; Boonham, N.; Rees, H.C.; Gough, K.C.; Lewis, E.; Adams, I.P.; Brotherton, P.; Phillips, S.; et al. Needle in a haystack? A comparison of eDNA metabarcoding and targeted qPCR for detection of the great crested newt (Triturus cristatus). Ecol. Evol. 2018, 8, 6330–6341. [Google Scholar] [CrossRef]
- Klymus, K.K.; Richter, C.; Chapman, D.; Paukert, C. Quantification of eDNA shedding rates from invasive bighead carp Hypophthalmichthys nobilis and silver carp Hypophthalmichthys molitrix. Biol. Conserv. 2015, 183, 77–84. [Google Scholar] [CrossRef]
- Strickler, K.M.; Fremier, A.K.; Goldberg, C.S. Quantifying effects of UV-B, temperature, and pH on eDNA degradation in aquatic microcosms. Biol. Conserv. 2015, 183, 85–92. [Google Scholar] [CrossRef]
- Valentini, A.; Taberlet, P.; Miaud, C.; Civade, R.; Herder, J.; Thomsen, P.F.; Bellemain, E.; Besnard, A.; Coissac, E.; Boyer, F.; et al. Next-generation monitoring of aquatic biodiversity using environmental DNA metabarcoding. Mol. Ecol. 2016, 25, 929–942. [Google Scholar] [CrossRef] [PubMed] [Green Version]
- Evans, N.T.; Olds, B.P.; Renshaw, M.A.; Turner, C.R.; Li, Y.; Jerde, C.L.; Mahon, A.R.; Pfrender, M.E.; Lamberti, G.A.; Lodge, D.M. Quantification of mesocosm fish and amphibian species diversity via environmental DNA metabarcoding. Mol. Ecol. Resour. 2016, 16, 29–41. [Google Scholar] [CrossRef] [PubMed] [Green Version]
- Kelly, R.P.; Port, J.A.; Yamahara, K.M.; Crowder, L.B. Using Environmental DNA to Census Marine Fishes in a Large Mesocosm. PLoS ONE 2014, 9, e86175. [Google Scholar] [CrossRef] [PubMed] [Green Version]
- Tillotson, M.D.; Kelly, R.P.; Duda, J.J.; Hoy, M.; Kralj, J.; Quinn, T.P. Concentrations of environmental DNA (eDNA) reflect spawning salmon abundance at fine spatial and temporal scales. Biol. Conserv. 2018, 220, 1–11. [Google Scholar] [CrossRef]
- Evans, N.T.; Lamberti, G.A. Freshwater fisheries assessment using environmental DNA: A primer on the method, its potential, and shortcomings as a conservation tool. Fish. Res. 2018, 197, 60–66. [Google Scholar] [CrossRef]
- Ficetola, G.F.; Miaud, C.; Pompanon, F.; Taberlet, P. Species detection using environmental DNA from water samples. Biol. Lett. 2008, 4, 423–425. [Google Scholar] [CrossRef] [PubMed] [Green Version]
- Zinger, L.; Bonin, A.; Alsos, I.G.; Bálint, M.; Bik, H.; Boyer, F.; Chariton, A.A.; Creer, S.; Coissac, E.; Deagle, B.E.; et al. DNA metabarcoding—Need for robust experimental designs to draw sound ecological conclusions. Mol. Ecol. 2019, 28, 1857–1862. [Google Scholar] [CrossRef] [PubMed] [Green Version]
- Pflieger, W.L. The Fishes of Missouri; Missouri Department of Conservation: Jefferson City, MO, USA, 1997; 372p. [Google Scholar]
- Robison, H.W.; Cashner, R.C.; Raley, M.E.; Near, T.J. A New Species of Darter from the Ouachita Highlands in Arkansas Related to Percina nasuta (Percidae: Etheostomatinae). Bull. Peabody Mus. Nat. Hist. 2014, 55, 237–252. [Google Scholar] [CrossRef]
- Robison, H.W.; Buchanan, T.M. Fishes of Arkansas, 2nd ed.; The University of Arkansas Press: Fayetteville, AR, USA, 2020; 959p. [Google Scholar]
- Jelks, H.L.; Walsh, S.; Burkhead, N.M.; Contreras-Balderas, S.; Diaz-Pardo, E.; Hendrickson, D.A.; Lyons, J.; Mandrak, N.E.; McCormick, F.; Nelson, J.S.; et al. Conservation Status of Imperiled North American Freshwater and Diadromous Fishes. Fisheries 2008, 33, 372–407. [Google Scholar] [CrossRef]
- Wright, K.; Ludwig, E.; Westhoff, J. Extirpation Status of Longnose Darter Percina nasuta in the upper White River Drainage of Missouri; Internal Report; Missouri Department of Conservation: Columbia, MO, USA, 2019; 12p. [Google Scholar]
- Mattingly, H.T.; Galat, D.L. Distributional patterns of the threatened Niangua Darter, Etheostoma nianguae, at three spatial scales, with implications for species conservation. Copeia 2002, 2002, 573–585. [Google Scholar] [CrossRef]
- Coons, A.L. Multi-scale habitat associations of Longnose Darters (Percina nasuta) in the St. Francis River, Missouri. Master’s Thesis, Tennessee Technological University, Cookeville, TN, USA, 2021. [Google Scholar]
- Albanese, B.; Owers, K.A.; Weiler, D.A.; Pruitt, W. Estimating Occupancy of Rare Fishes using Visual Surveys, with a Comparison to Backpack Electrofishing. Southeast. Nat. 2011, 10, 423–442. [Google Scholar] [CrossRef]
- Strahler, A.N. Quantitative analysis of watershed geomorphology. Trans. Am. Geophys. Union 1957, 38, 913–920. [Google Scholar] [CrossRef] [Green Version]
- Boone, M. St. Francis River Watershed Inventory and Assessment; Missouri Department of Conservation: Cape Girardeau, MO, USA, 2001; 80p. [Google Scholar]
- Near, T.J. Phylogenetic Relationships of Percina (Percidae: Etheostomatinae). Copeia 2002, 2002, 1–14. [Google Scholar] [CrossRef]
- Riaz, T.; Shehzad, W.; Viari, A.; Pompanon, F.; Taberlet, P.; Coissac, E. ecoPrimers: Inference of new DNA barcode markers from whole genome sequence analysis. Nucleic Acids Res. 2011, 39, e145. [Google Scholar] [CrossRef]
- Kearse, M.; Moir, R.; Wilson, A.; Stones-Havas, S.; Cheung, M.; Sturrock, S.; Buxton, S.; Cooper, A.; Markowitz, S.; Duran, C.; et al. Geneious Basic: An integrated and extendable desktop software platform for the organization and analysis of sequence data. Bioinformatics 2012, 28, 1647–1649. [Google Scholar] [CrossRef]
- Klymus, K.K.E.; Merkes, C.M.; Allison, M.J.; Goldberg, C.S.; Helbing, C.C.; Hunter, M.E.; Jackson, C.A.; Lance, R.F.; Mangan, A.M.; Monroe, E.M.; et al. Reporting the limits of detection and quantification for environmental DNA assays. Environ. DNA 2020, 2, 271–282. [Google Scholar] [CrossRef] [Green Version]
- Merkes, C.M.; Klymus, K.E.; Allison, M.J.; Goldberg, C.; Helbing, C.C.; Hunter, M.E.; Richter, C. Code to Analyze Multi-lab LOD/LOQ Study Data, R Script. U.S.; Geological Survey: Reston, VA, USA, 2019. [Google Scholar] [CrossRef]
- Forootan, A.; Sjöback, R.; Björkman, J.; Sjögreen, B.; Linz, L.; Kubista, M. Methods to determine limit of detection and limit of quantification in quantitative real-time PCR (qPCR). Biomol. Detect. Quantif. 2017, 12, 1–6. [Google Scholar] [CrossRef] [PubMed]
- Kralik, P.; Ricchi, M. A basic guide to real time PCR in microbial diagnostics: Definitions, parameters, and everything. Front. Microbiol. 2017, 8, 108. [Google Scholar] [CrossRef] [PubMed] [Green Version]
- MacKenzie, D.L.; Nichols, J.D.; Royle, J.A.; Pollok, K.H.; Bailey, L.L.; Hines, J.E. Occupancy Estimation and Modeling: Inferring Patterns and Dynamics of Species Occurrence, 2nd ed.; Academic Press: London, UK, 2018; 641p. [Google Scholar] [CrossRef] [Green Version]
- Castañeda, R.R.A.; Van Nynatten, A.; Crookes, S.; Ellender, B.R.; Heath, D.D.; MacIsaac, H.J.; Mandrak, N.E.; Weyl, O.L.F. Detecting native freshwater fishes using novel non-invasive methods. Front. Environ. Sci. 2020, 8, 29. [Google Scholar] [CrossRef]
- Herzog, D.P.; Ostendorf, D.E.; Hrabik, R.A.; Barko, V.A. The mini-missouri trawl: A useful methodology for sampling small-bodied fishes in small and large river systems. J. Freshw. Ecol. 2009, 24, 103–108. [Google Scholar] [CrossRef]
- Nichols, J.D.; Bailey, L.L.; O’Connell, A.F., Jr.; Talancy, N.W.; Campbell Grant, E.H.; Gilbert, A.T.; Annand, E.M.; Husband, T.P.; Hines, J.E. Multi-scale occupancy estimation and modelling using multiple detection methods. J. Appl. Ecol. 2008, 45, 1321–1329. [Google Scholar] [CrossRef]
- Burnham, K.P.; Anderson, D.R. Model Selection and Multimodel Inference: A Practical Information Theoretic Approach, 2nd ed.; Springer: New York, NY, USA, 2002; 488p. [Google Scholar] [CrossRef] [Green Version]
- Agresti, A. An Introduction to Categorical Data Analysis, 2nd ed.; John Wiley & Sons, Inc.: Hoboken, NJ, USA, 2007; 372p. [Google Scholar]
- McArdle, B.H. When are rare species not there? Oikos 1990, 57, 276. [Google Scholar] [CrossRef]
- Moore, M.J.; Orth, D.; Frimpong, E.A. Occupancy and detection of clinch dace using two gear types. J. Fish Wildl. Manag. 2017, 8, 530–543. [Google Scholar] [CrossRef] [Green Version]
- Langlois, V.S.; Allison, M.J.; Bergman, L.C.; To, T.A.; Helbing, C.C. The need for robust qPCR-based eDNA detection assays in environmental monitoring and species inventories. Environ. DNA 2021, 3, 519–527. [Google Scholar] [CrossRef]
- Furlan, E.E.M.; Gleeson, D.; Wisniewski, C.; Yick, J.; Duncan, R.P. eDNA surveys to detect species at very low densities: A case study of European carp eradication in Tasmania, Australia. J. Appl. Ecol. 2019, 56, 2505–2517. [Google Scholar] [CrossRef]
- Robson, H.H.L.A.; Noble, T.H.; Saunders, R.; Robson, S.; Burrows, D.W.; Jerry, D. Fine-tuning for the tropics: Application of eDNA technology for invasive fish detection in tropical freshwater ecosystems. Mol. Ecol. Resour. 2016, 16, 922–932. [Google Scholar] [CrossRef] [PubMed]
- Lesperance, M.L.; Allison, M.J.; Bergman, L.C.; Hocking, M.D.; Helbing, C.C. A statistical model for calibration and computation of detection and quantification limits for low copy number environmental DNA samples. Environ. DNA 2021, 3, 970–981. [Google Scholar] [CrossRef]
- Rice, C.J.; Larson, E.R.; Taylor, C.A. Environmental DNA detects a rare large river crayfish but with little relation to local abundance. Freshw. Biol. 2018, 63, 443–455. [Google Scholar] [CrossRef]
- Montgomery, W.L.; McCormick, S.D.; Naiman, R.J.; Whoriskey, F.G., Jr.; Black, G.A. Spring migratory synchrony of salmonid, catostomid, and cyprinid fishes in Rivière a là Truite, Québec. Can. J. Zool. 1983, 61, 2495–2502. [Google Scholar] [CrossRef]
- Ryon, M.G. The Life History and Ecology of Etheostoma trisella (Pisces: Percidae). Am. Midl. Nat. 1986, 115, 73. [Google Scholar] [CrossRef]
- Eisenhour, D.J.; Washburn, B.A. Long-Distance Movements of Six Darters (Teleostei: Percidae) in the Red River, Kentucky. J. Ky. Acad. Sci. 2016, 77, 19–24. [Google Scholar] [CrossRef]
- Roberts, J.H.; Rosenberger, A.E.; Albanese, B.W.; Angermeier, P.L. Movement patterns of endangered Roanoke logperch (Percina rex). Ecol. Freshw. Fish 2008, 17, 374–381. [Google Scholar] [CrossRef]
- Harrison, J.B.; Sunday, J.M.; Rogers, S.M. Predicting the fate of eDNA in the environment and implications for studying biodiversity. Proc. R. Soc. B Boil. Sci. 2019, 286, 20191409. [Google Scholar] [CrossRef] [PubMed]
- Hinlo, R.; Lintermans, M.; Gleeson, D.; Broadhurst, B.; Furlan, E. Performance of eDNA assays to detect and quantify an elusive benthic fish in upland streams. Biol. Invasions 2018, 20, 3079–3093. [Google Scholar] [CrossRef]
- Pilliod, D.S.; Goldberg, C.S.; Arkle, R.S.; Waits, L.P. Estimating occupancy and abundance of stream amphibians using environmental DNA from filtered water samples. Can. J. Fish. Aquat. Sci. 2013, 70, 1123–1130. [Google Scholar] [CrossRef]
- Strickland, G.J.; Roberts, J.H. Utility of eDNA and occupancy models for monitoring an endangered fish across diverse riverine habitats. Hydrobiologia 2019, 826, 129–144. [Google Scholar] [CrossRef]
- Bonneau, J.J.L.; Thurow, R.E.; Scarnecchia, D.L. Capture, marking, and enumeration of juvenile bull trout and cutthroat trout in small, low-conductivity streams. N. Am. J. Fish. Manag. 1995, 15, 563–568. [Google Scholar] [CrossRef]
- Hillman, T.T.W.; Mullan, J.W.; Griffith, J.S. Accuracy of Underwater Counts of Juvenile Chinook Salmon, Coho Salmon, and Steelhead. N. Am. J. Fish. Manag. 1992, 12, 598–603. [Google Scholar] [CrossRef]
- Schrader, C.; Schielke, A.; Ellerbroek, L.; Johne, R. PCR inhibitors–occurrence, properties and removal. J. Appl. Microbiol. 2012, 113, 1014–1026. [Google Scholar] [CrossRef] [PubMed]
- Ulibarri, R.R.M.; Bonar, S.A.; Rees, C.; Amberg, J.; Ladell, B.; Jackson, C. Comparing efficiency of american fisheries society standard snorkeling techniques to environmental dna sampling techniques. N. Am. J. Fish. Manag. 2017, 37, 644–651. [Google Scholar] [CrossRef]
- Wilcox, T.T.M.; Carim, K.J.; Young, M.K.; McKelvey, K.S.; Franklin, T.; Schwartz, M.K. Comment: The importance of sound methodology in environmental DNA sampling. N. Am. J. Fish. Manag. 2018, 38, 592–596. [Google Scholar] [CrossRef]
- Amberg, J.J.; Bonar, S.A.; Perez, C.; Rees, C.B.; Jackson, C.; Ulibarri, R.M. The importance of sound methodology in environmental DNA sampling: Response to comment. N. Am. J. Fish. Manag. 2018, 38, 597–600. [Google Scholar] [CrossRef]
- Evans, N.T.; Shirey, P.D.; Wieringa, J.G.; Mahon, A.R.; Lamberti, G.A. Comparative cost and effort of fish distribution detection via environmental DNA analysis and electrofishing. Fisheries 2017, 42, 90–99. [Google Scholar] [CrossRef]
- Near, T.J.; Porterfield, J.C.; Page, L.M. Evolution of cytochrome b and the molecular systematics of Ammocrypta (Percidae: Etheostomatinae). Copeia 2000, 2000, 701–711. [Google Scholar] [CrossRef]
Publisher’s Note: MDPI stays neutral with regard to jurisdictional claims in published maps and institutional affiliations. |
© 2022 by the authors. Licensee MDPI, Basel, Switzerland. This article is an open access article distributed under the terms and conditions of the Creative Commons Attribution (CC BY) license (https://creativecommons.org/licenses/by/4.0/).