Article

Scale Development-Related Genes Identified by Transcriptome Analysis

1
College of Marine Sciences, Shanghai Ocean University, 999 Huchenghuan Road, Lingang New City, Shanghai 201306, China
2
Key Laboratory of Sustainable Exploitation of Oceanic Fisheries Resources, Ministry of Education, Shanghai Ocean University, Shanghai 201306, China
3
Key Laboratory of Aquaculture Resources and Utilization, Ministry of Education, College of Fisheries and Life Sciences, Shanghai Ocean University, Shanghai 201306, China
4
National Distant-Water Fisheries Engineering Research Center, Shanghai Ocean University, Shanghai 201306, China
*
Author to whom correspondence should be addressed.
These authors contributed equally to this work.
Fishes 2022, 7(2), 64; https://doi.org/10.3390/fishes7020064
Submission received: 19 January 2022 / Revised: 4 March 2022 / Accepted: 6 March 2022 / Published: 12 March 2022
(This article belongs to the Section Genetics and Biotechnology)

Abstract

:
Scales, as key structures of fish skin, play an important role in physiological function. The study of fish scale development mechanisms provides a basis for exploring the molecular-level developmental differences between scaled and non-scaled fishes. In this study, alizarin red staining was used to divide the different stages of zebrafish (Danio rerio) scale development. Four developmental stages, namely stage I (~17 dpf, scales have not started to grow), stage II (~33 dpf, the point at which scales start to grow), stage III (~41 dpf, the period in which the scales almost cover the whole body), and stage IV (~3 mpf, scales cover the whole body), were determined and used for subsequent transcriptome analysis. WGCNA (weighted correlation network analysis) and DEG (differentially expressed gene) analysis were used for screening the key genes. Based on the comparison between stage II and stage I, 54 hub-genes were identified by WGCNA analysis. Key genes including the Scpp family (Scpp7, Scpp6, Scpp5, and Scpp8), the Fgf family (Fgfr1b and Fgfr3), Tcf7, Wnt10b, Runx2b, and Il2rb were identified by DEG analysis, which indicated that these genes played important roles in the key nodes of scale development signal pathways. Combined with this analysis, the TGF-β, Wnt/β-catenin, and FGF signaling pathways were suggested to be the most important signal pathways for scales starting to grow. This study laid a foundation for exploring the scale development mechanism of other fishes. The scale development candidate genes identified in the current study will facilitate functional gene identifications in the future.

Graphical Abstract

1. Introduction

Scales are the structures that cover the surface of birds’ legs, reptiles’ bodies, and fishes’ skin. Different from birds and reptiles, fish scales are derived from the dermis. Fish scales, like fin rays, belong to the fish exoskeleton and generally refer to all the hard, flat bones in the fish skin [1,2], which protect the fish body. Fish scales account for 2% to 3% of the body weight and play important roles in protecting fish from external microorganisms, reducing frictional damage caused by particles in water, and maintaining fish body shape [3,4].
Studies of fish scales mainly focus on morphological comparison and observation, classification, structural composition, and the genes involved in scale development [5,6,7]. Recently, researchers have come to believe that the starting position of scale development is mainly affected by epigenetic factors [8]. At the gene level, the related signal pathways and genes mainly include the EDA/EDAR, Shh, FGFs, BMP, and Wnt/β-catenin signal pathways. [9,10,11]. For example, many studies showed that the Wnt signaling pathway plays a key role in the development of fish scales [12]. However, fish scale development is a complex process regulated by a variety of signals and there is no clear regulatory network reported.
Zebrafish (Danio rerio), a small tropical freshwater fish, has the advantages of short maturation cycle and easy reproduction, which makes zebrafish an important experimental model for the study of fish scale development [13,14]. Although no major breakthroughs have been made regarding the molecular mechanism, research on zebrafish scale development began decades ago. Several gene mutants (such as Fls, nkt, spd, and rs-3) resulted in fish scale development defects in zebrafish [15]. These mutants provide a convenient and relevant basis for fish scale development studies.
With the rapid development of high-throughput sequencing technology, the process of obtaining gene-level information has become possible [16]. Transcriptome analysis is a useful technology and has been widely used in developmental biology studies. Many studies regarding skin formation patterns and epidermal structural development have been carried out on mammals and birds through transcriptome analysis [17]. However, no transcriptome analysis regarding fish scale development has been reported.
In this study, the developmental process and signal transduction pathways of zebrafish scale development were analyzed by transcriptome sequencing. For key genes’ screening, WGCNA (weighted correlation network analysis) analysis was carried out. WGCNA is an R package for weighted gene co-expression network analysis, which can simplify a large amount of complex gene data and quickly identify core genes related to target traits, and has been widely used in animal and plant research [18]. The purpose of this study was to determine the key genes and pathways in the development of fish scales. These results will increase our understanding of the molecular mechanism of fish scale development.

2. Materials and Methods

2.1. Zebrafish Maintenance

Zebrafish (AB type) were maintained at 28 °C in a closed water ultrafiltration purification system at our zebrafish feeding laboratory (Shanghai Haisheng Biological Experimental equipment Co. Ltd., Shanghai, China). The animals used in the present study were cultured and euthanized following the terms of use of animals approved by the Institutional Animal Care and Use Committee at the Shanghai Ocean University (Shanghai, China; SHOU-DW-20171022). Zebrafish embryonic developmental stages were determined in days post-fertilization (dpf) or months post-fertilization (mpf). According to the days after embryo fertilization, after staining observation, we identified four stages of scale development, namely stage I (~17 dpf, scales have not started to grow), stage II (~33 dpf, the point at which scales start to grow), stage III (~41 dpf, the period in which the scales almost cover the whole body), and stage IV (~3 mpf, the period in which the scales completely cover the fish body).

2.2. Alizarin Red Staining and Observation

Zebrafish tissue samples were fixed with 4% paraformaldehyde (Sangon, Shanghai, China) overnight and rinsed with ddH2O for 20 min the next day. Equal volumes of 1% KOH and 1% H2O2 (Sangon, Shanghai) were mixed to make a bleaching solution and fish samples were immersed and exposed to the air for at least 10 min. After the bleaching solution was removed, protease solution (100 mL system: 65 mL ddH2O, 35 mL saturated sodium borate, and 1 g trypsin (Sangon, Shanghai)) was then used to remove the excess muscle tissue until the fish body became transparent. After digestion, the protease digestion solution was discarded and the fish samples were rinsed with 1% KOH several times; then soaked in 1% KOH solution; and 1% alizarin red solution (1 g alizarin red (Yuanye, Shanghai, China) dissolved in 100 mL 0.5% KOH) was gradually added. When the fish body surface turned light purple, the fish bodies were observed under a microscope (Nikon SMZ1500, Tokyo, Japan).

2.3. RNA Isolation and Sequencing

Total RNA was extracted from zebrafish skin (with scales) collected at four developmental stages with the Trizol reagent (Ambion, Austin, TX, USA). The sampling site was at the caudal peduncle shown in the alizarin red staining diagram (Figure 1). Only high-quality samples (OD260/280 ≥ 1.8, OD260/230 ≥ 1.8) were used to build a sequencing library.
The library was established according to the instructions of the VAHTS Stranded mRNA-seq Library Prep Kit for Illumina V2 (Vazyme, Nanjing, China). MRNA with a poly-A tail was enriched using magnetic beads with oligo dT. The combined mRNA was eluted and broken into fragments with buffer and the first chain of cDNA was formed by reverse transcription with random primers. RNase H digestion solution was used to digest the mRNA strand in the hybrid double-strand, synthesize the complementary strand of cDNA, realize the synthesis of the second strand of cDNA, and conduct end repair and dA-tailing. After the linker was connected, the second chain containing U was digested with the UDG enzyme and then PCR primer mix 3 in the kit was used to amplify and enrich the library. The sequencing work was carried out by Meiji Biological Company (Shanghai, China) using an illumina 4000.

2.4. Weighted Gene Co-Expression Analysis (WGCNA) of the Sequencing Data

WGCNA is a freely accessible R package for constructing the weighted gene co-expression network [19]. After cluster analysis, two outlier samples were deleted and the soft threshold was determined to be 12. On this basis, the co-expression network was constructed and the relationship between sample characteristics and modules was analyzed. Finally, it was determined that the turquoise module (turquoise, cor = 0.74, p < 0.01) was the module with the highest correlation with scale development. Then, correlation analysis between the module and gene importance was conducted. Finally, Cytoscape (Version 3.6.1) was used to draw the gene network diagram and Cytohubba’s EPC algorithm was used to identify hub-genes [20].

2.5. Differentially Expressed Gene Analysis and Functional Enrichment

In order to study the molecular mechanism of zebrafish scale development, we analyzed the number and biological function of DEGs in six groups. Firstly, we mapped all clean reads onto the reference gene sequence using HISAT2 (Hierarchical Indexing for Spliced Alignment of Transcripts 2) [21]. Significant DEGs were detected by EdgeR software (Version 3.26.8) and both |log2 (fold change)| ≥ 1 and p ≤ 0.05 were used as the filtering thresholds [22]. The gene expression level of each sample was then calculated to determine the fragments per kilobase of the exon model per million mapped fragments (FPKM) using cufflinks software [23] with the default settings.
In addition, to further understand the function of DEGs at different scale developmental stages, we selected genes with differential expression |log2 (fold change) | ≥ 1 and p ≤ 0.05, as well as used the clusterprofiler package in R software for enrichment analysis, and GO terms and KEGG pathways with p ≤ 0.05 were regarded as significant [24].

2.6. Quantitative Real-Time PCR Validation of RNA-Seq Data

To verify the accuracy of the transcriptome sequencing results, 11 genes were selected to perform qRT-PCR analysis. First, we extracted RNA from the caudal peduncle of zebrafish at four different stages. The first strand of cDNA was synthesized according to the instructions of the Goldenstar RT6 cDNA Synthesis Kit, version 2 (Tsingke Biological Technology Co., Ltd., Wuhan, China). The specific process was as follows: First, we removed the possible residual DNA in a 10 μL reaction system: 1 μg total RNA, 1 μL gRNA remover, and 1 μL gRNA remover buffer, and added RNase-free water to 10 μL. We incubated at 42 °C for 2 min and 60 °C for 5 min. Then, we added the following ingredients: 4 μL 5 × Goldenstar reaction buffer, 1 μL Goldenstar RT6 (200 U/μL), 1 μL oligo (DT) 17, 1 μL dNTP mix (10 mM), 1 μL DTT, and 2 μL RNase-free water. We incubated at 55 °C for 40 min and 85 °C for 5 min. Then, the synthesized cDNA was used as a template and the primers used are as shown in Table 1. The total qPCR mixture reaction volume of 20 μL contained 10 μL 2 × T5 Fast qPCR Mix (SYBR Green I (Tsingke Biological Technology Co., Ltd., Wuhan, China)), 0.8 μL of each primer (10 μM), 2 μL cDNA template, and 6.4 μL RNase-free water. The quantitative analysis of genes was carried out by using a CFX96 fluorescence quantitative PCR instrument (BioRad, Hercules, CA, USA). The specific qPCR procedure was as follows: pre-denaturation at 95 °C for 1 min, amplification at 95 °C for 10 s, amplification at 58 °C for 10 s, and amplification at 72 °C for 15 s, for 40 cycles in total. The relative expression of each of the ten genes was analyzed using the comparative cycle threshold (2−ΔΔCT) method (ΔCT = CTtarget gene − CTreference gene, ΔΔCT = ΔCTtreatment − ΔCTcontrol) [25]. Statistical analysis and Pearson correlation analysis were performed with SPSS (Version 25.0, IBM, Armonk, NY, USA). The significance of the test results was tested by t-test. Pearson correlation analyses were used to assess the strength of the relationship between RNA-seq data and RT-qPCR measurements.

3. Results

3.1. Scale Development in Zebrafish

We divided the zebrafish scale development process into four stages by alizarin red staining. Stage I (~17 dpf) is the stage when zebrafish do not grow scales (see Figure 1A,B). Stage II (~33 dpf) is the point at which scales start to grow (Figure 1C). The third stage (~41 dpf) is when scales extend forward along the midline with the dorsal axis and also vertically up and down until it covers the whole fish body (Figure 1D). Stage IV (~3 mpf) is the period in which the scales completely cover the fish body.

3.2. Gene Expression Quantification and Analysis of DEGs

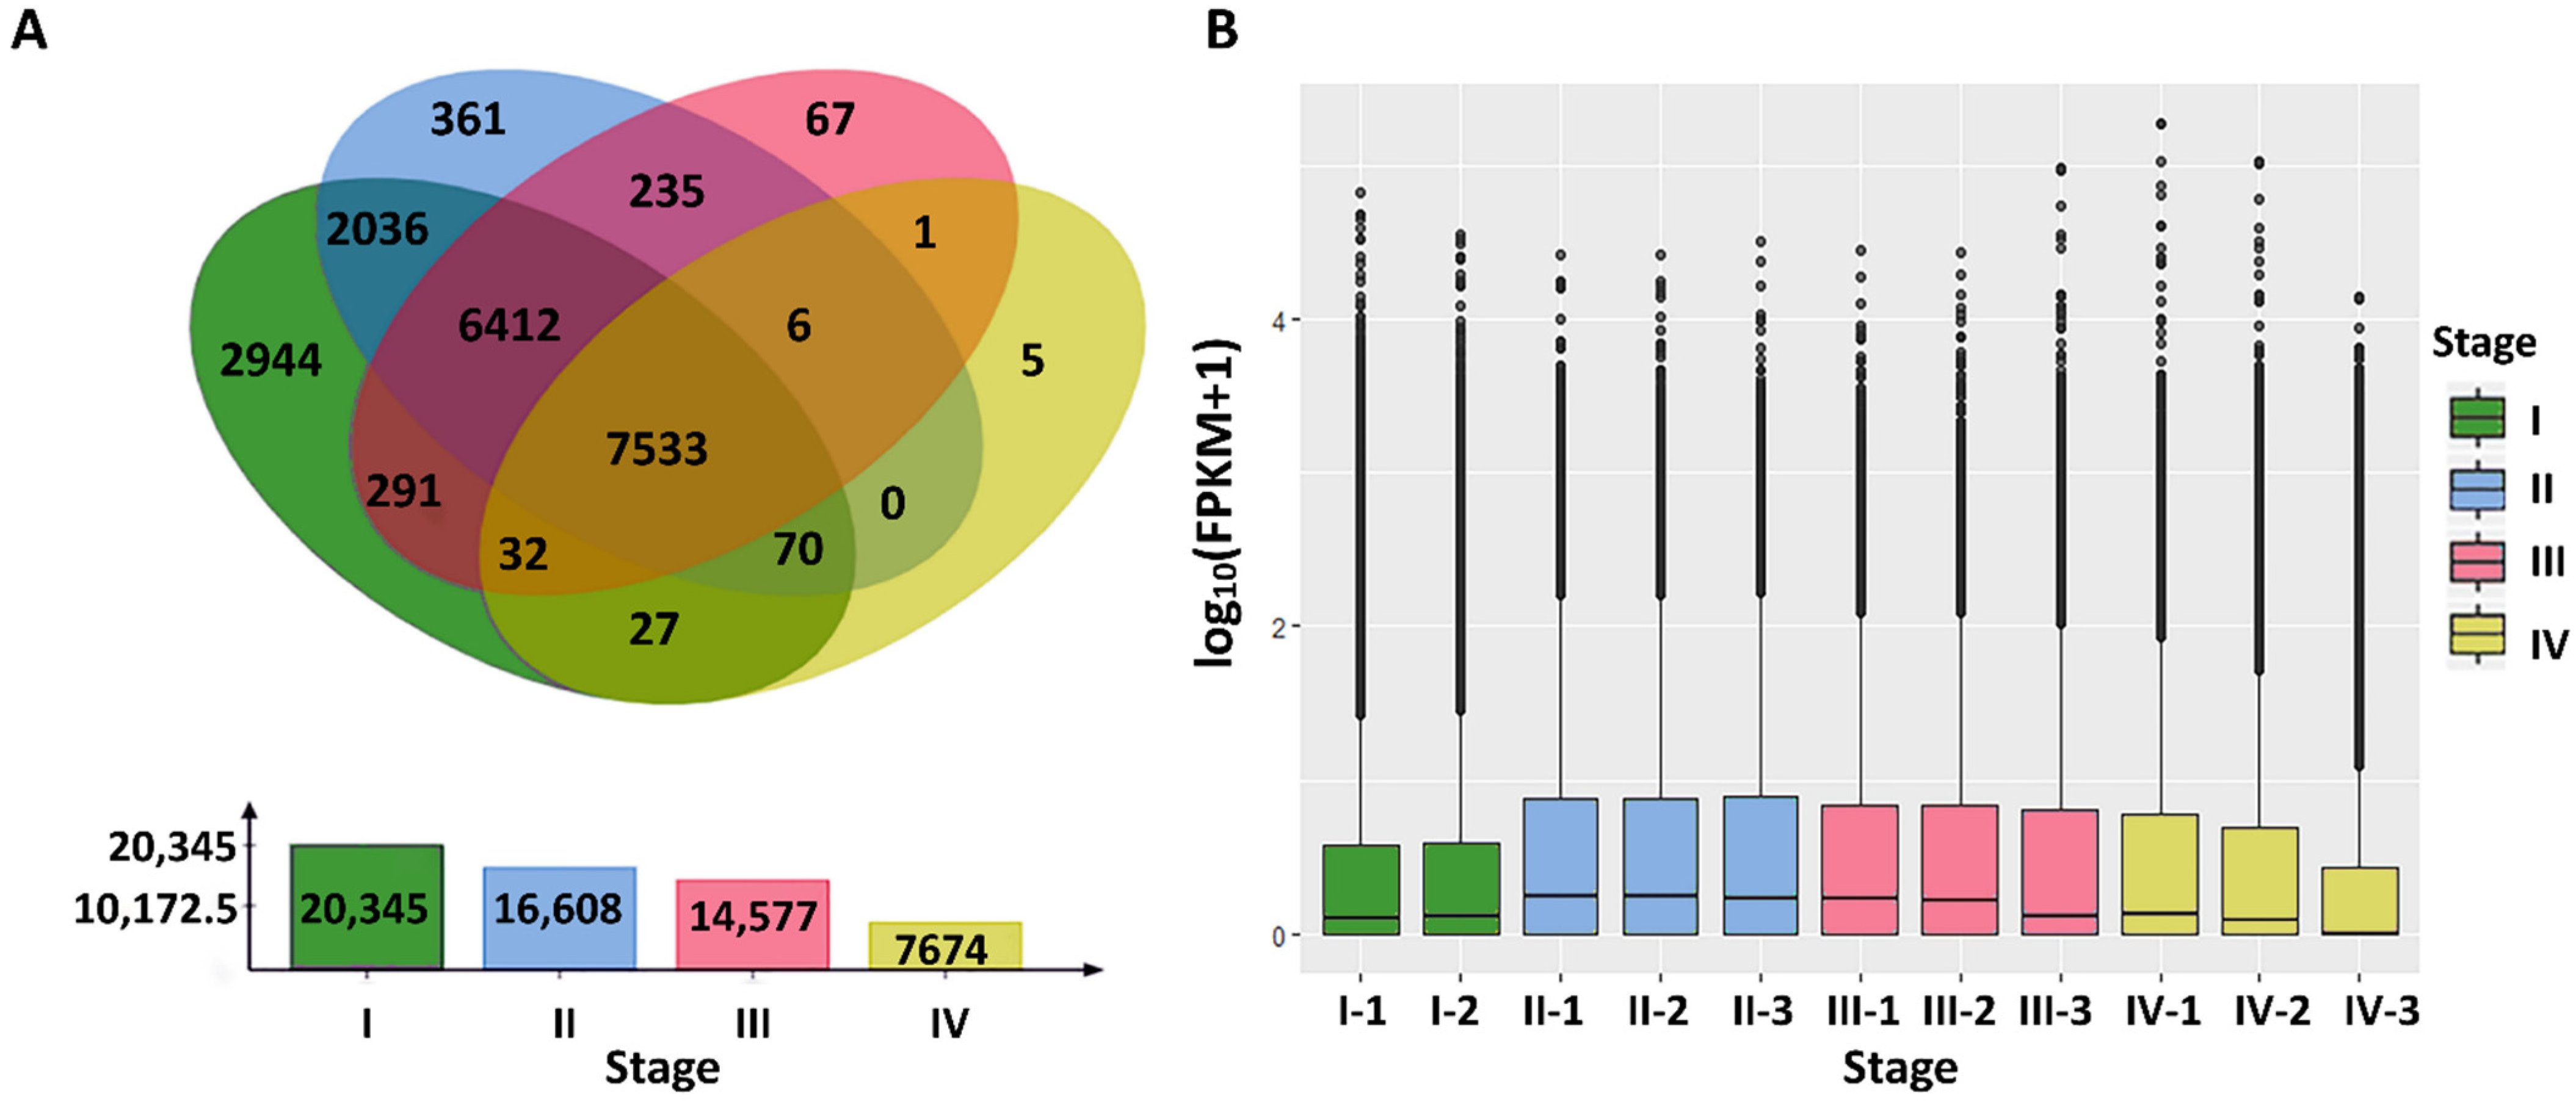
Gene expression levels for the four fish scale developmental stages are shown and visualized by Venn diagrams (Figure 2A) clearly showing the numbers of genes that were specifically expressed at each stage and the number of genes that were co-expressed between them. The results showed that 20,345, 16,608, 14,577, and 7674 genes were expressed in the four stages, of which 7533 genes were common among the four stages. It can be seen from Figure 2B that the data distribution of each group was relatively scattered; the minimum value is zero and the median is close to upper quartile.

3.3. WGCNA Analysis and Hub-Genes Screening

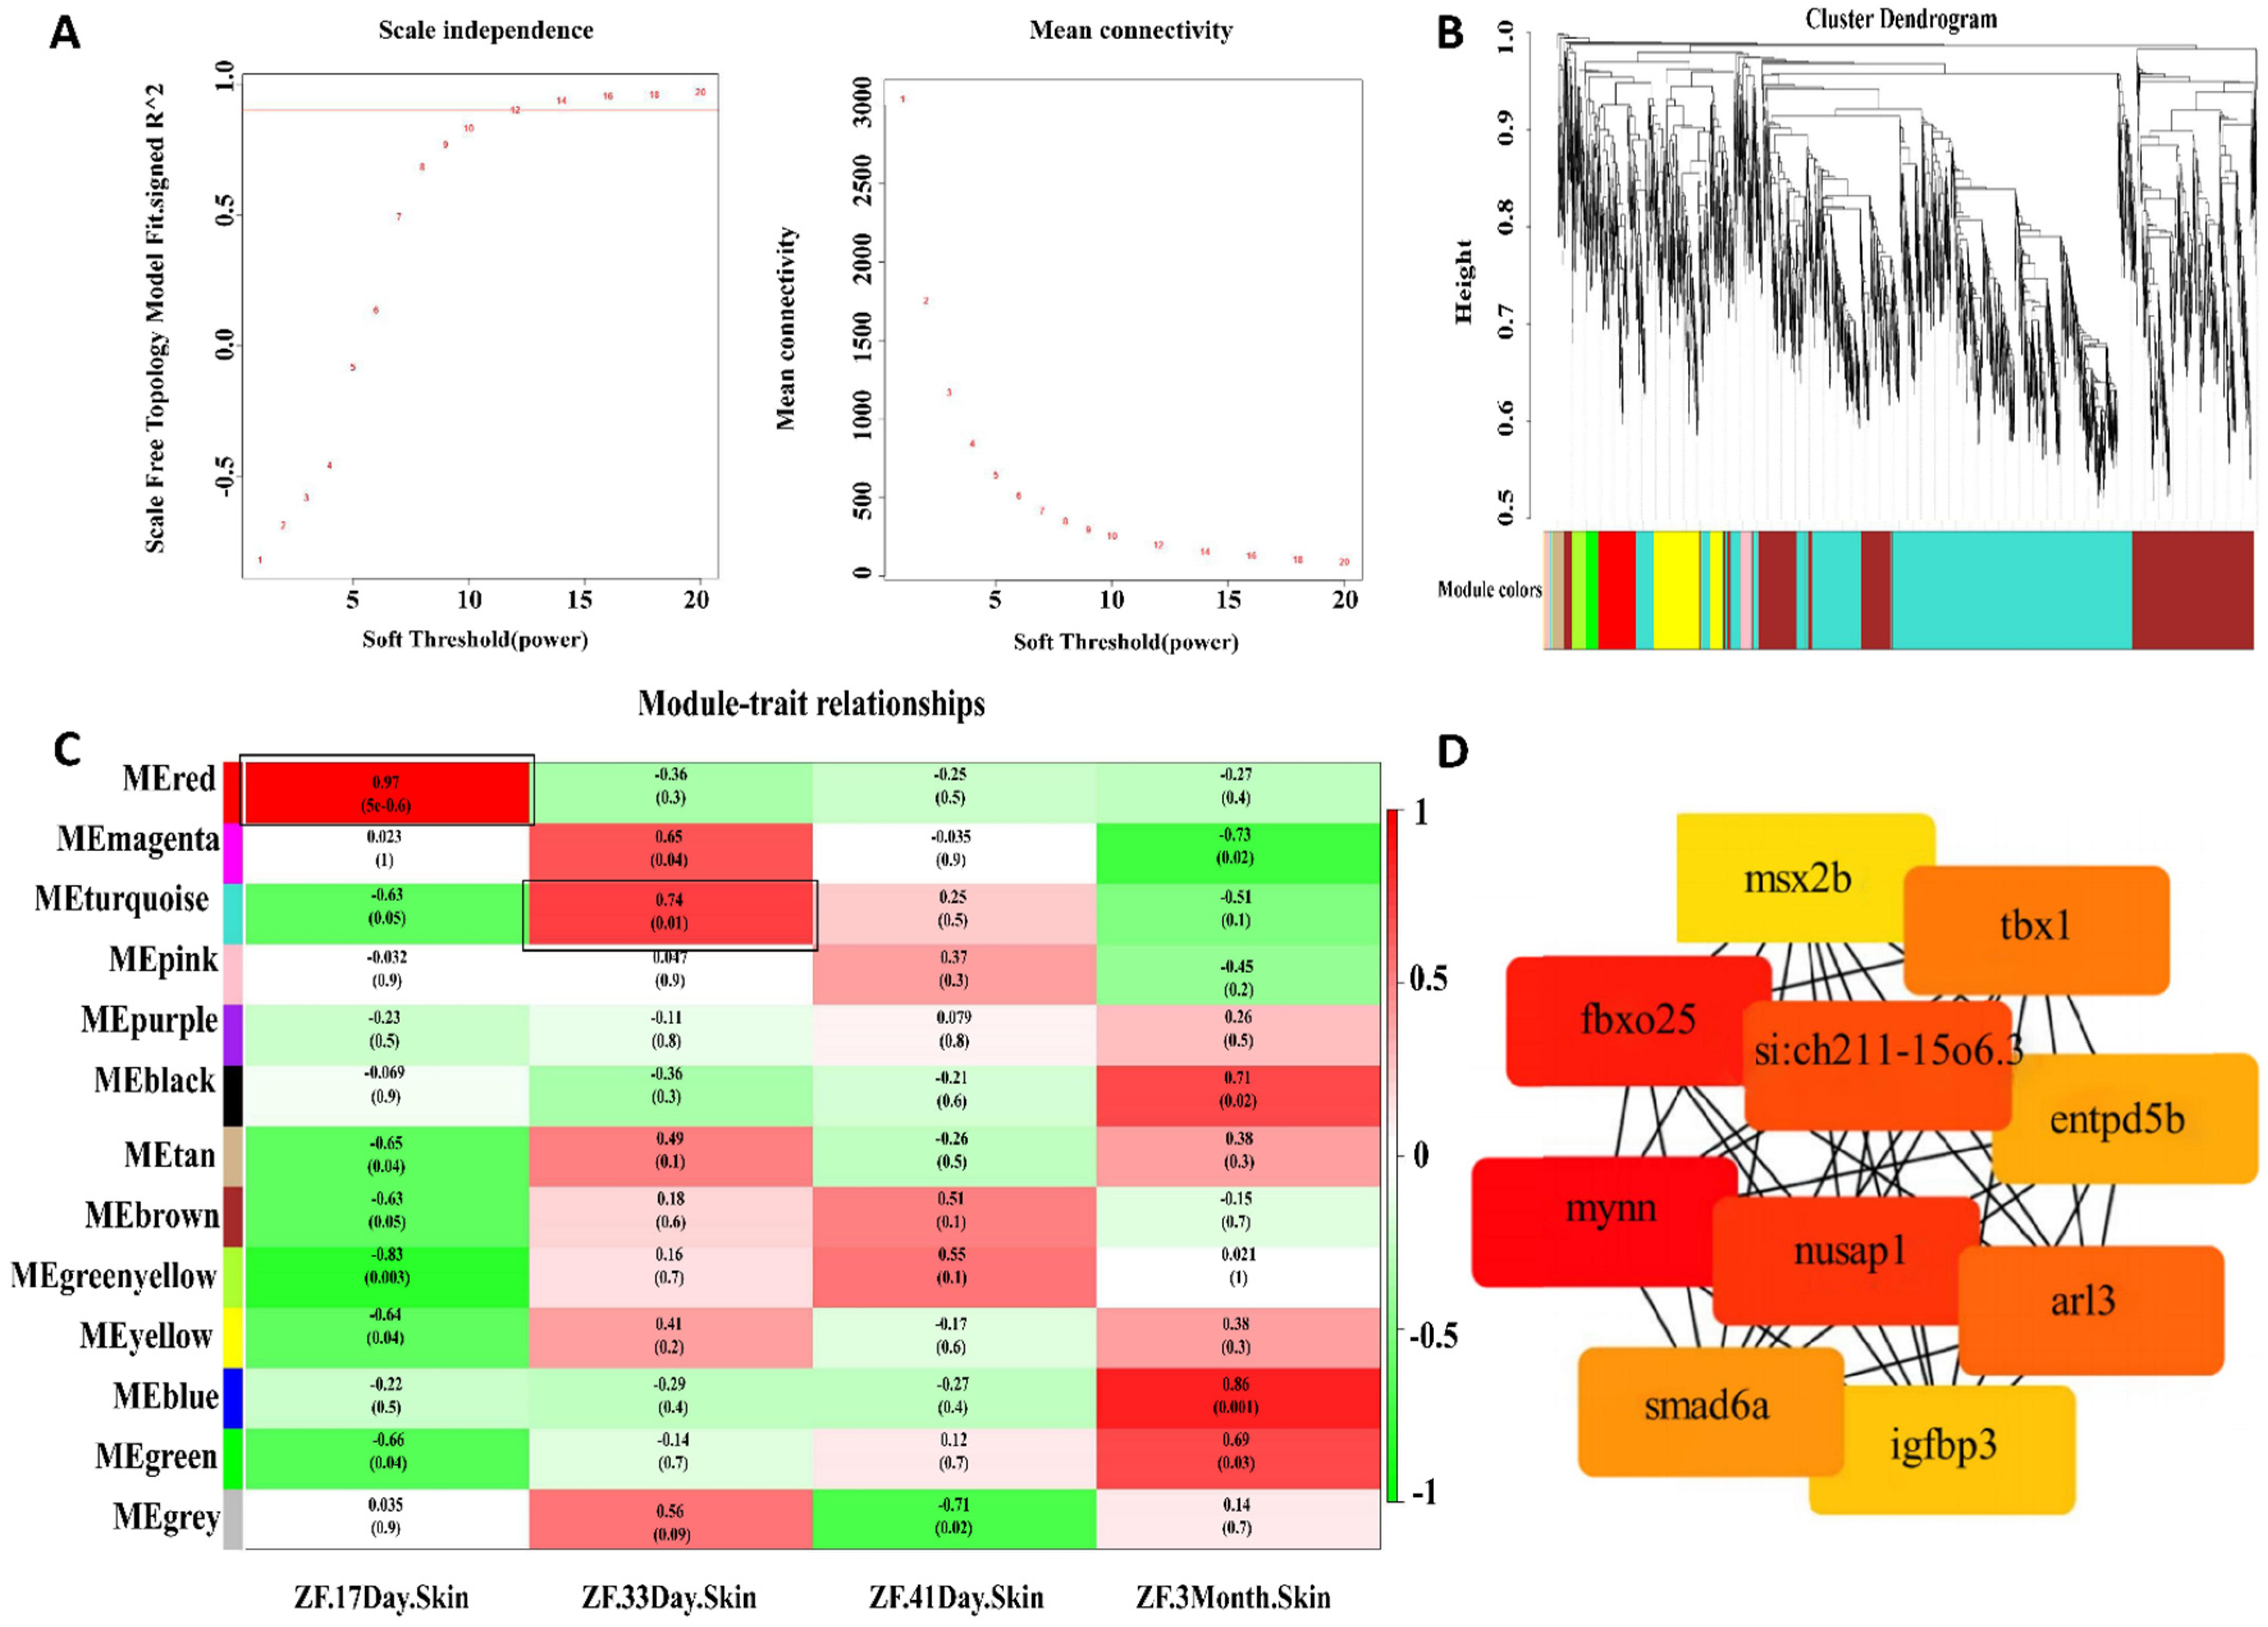
In total, FPKM values of the 35,116 genes for the four developmental stages were obtained. Among them, 7223 genes with FPKM ≥ 1 were selected for cluster analysis by the Fastcluster in the WGCNA software package. In construction of the WGCNA network, it is important to determine the soft threshold. We analyzed the network topology with a threshold power of 1 to 20 and determined both the scale independence and mean connectivity as the relative balance of WGCNA. As shown in Figure 3A, the optimal threshold β value was 12, indicating that after reaching the high threshold of 12, the curve began to flatten and the network topology was almost connected (Figure 3A).
The “one-step method” was used to construct the network. The difference coefficient between genes was calculated to obtain the genetic system cluster tree. After the gene modules were determined, the eigenvalues of each module were calculated in turn. Cluster analysis was performed on the modules. In total, 7233 genes were divided into 13 modules, among which 10 genes did not belong to any module (Figure 3B).
In order to explore genes that were highly correlated with the module and phenotype, we conducted a heat map of module-associated phenotypes (Figure 3C). Among the four scale developmental stages, we mainly focused on stage II, the starting point of scale growth (~33 dpf, zf33). It was clearly shown that compared with other modules, the turquoise module was highly correlated with stage II (zf33), which indicated that genes in the turquoise module might play an important role in zebrafish scale development (Figure 3C).
Then, the connectivity of genes in the turquoise module was calculated. Genes with gene significance > 0.87 and intra-module connectivity > 0.8 were identified as the key genes (hub-genes). In total, 54 hub-genes with high connectivity were identified (see Table S1). In addition, the top 10 key genes were obtained by Cytoscape software(Version 3.6.1, UCSD et al, Califonia, USA)package CytoHubba(Version1.5.1, UCSD et al, Califonia, USA) using the EPC algorithm (Figure 3D).

3.4. GO and KEGG Pathway Enrichment Analysis

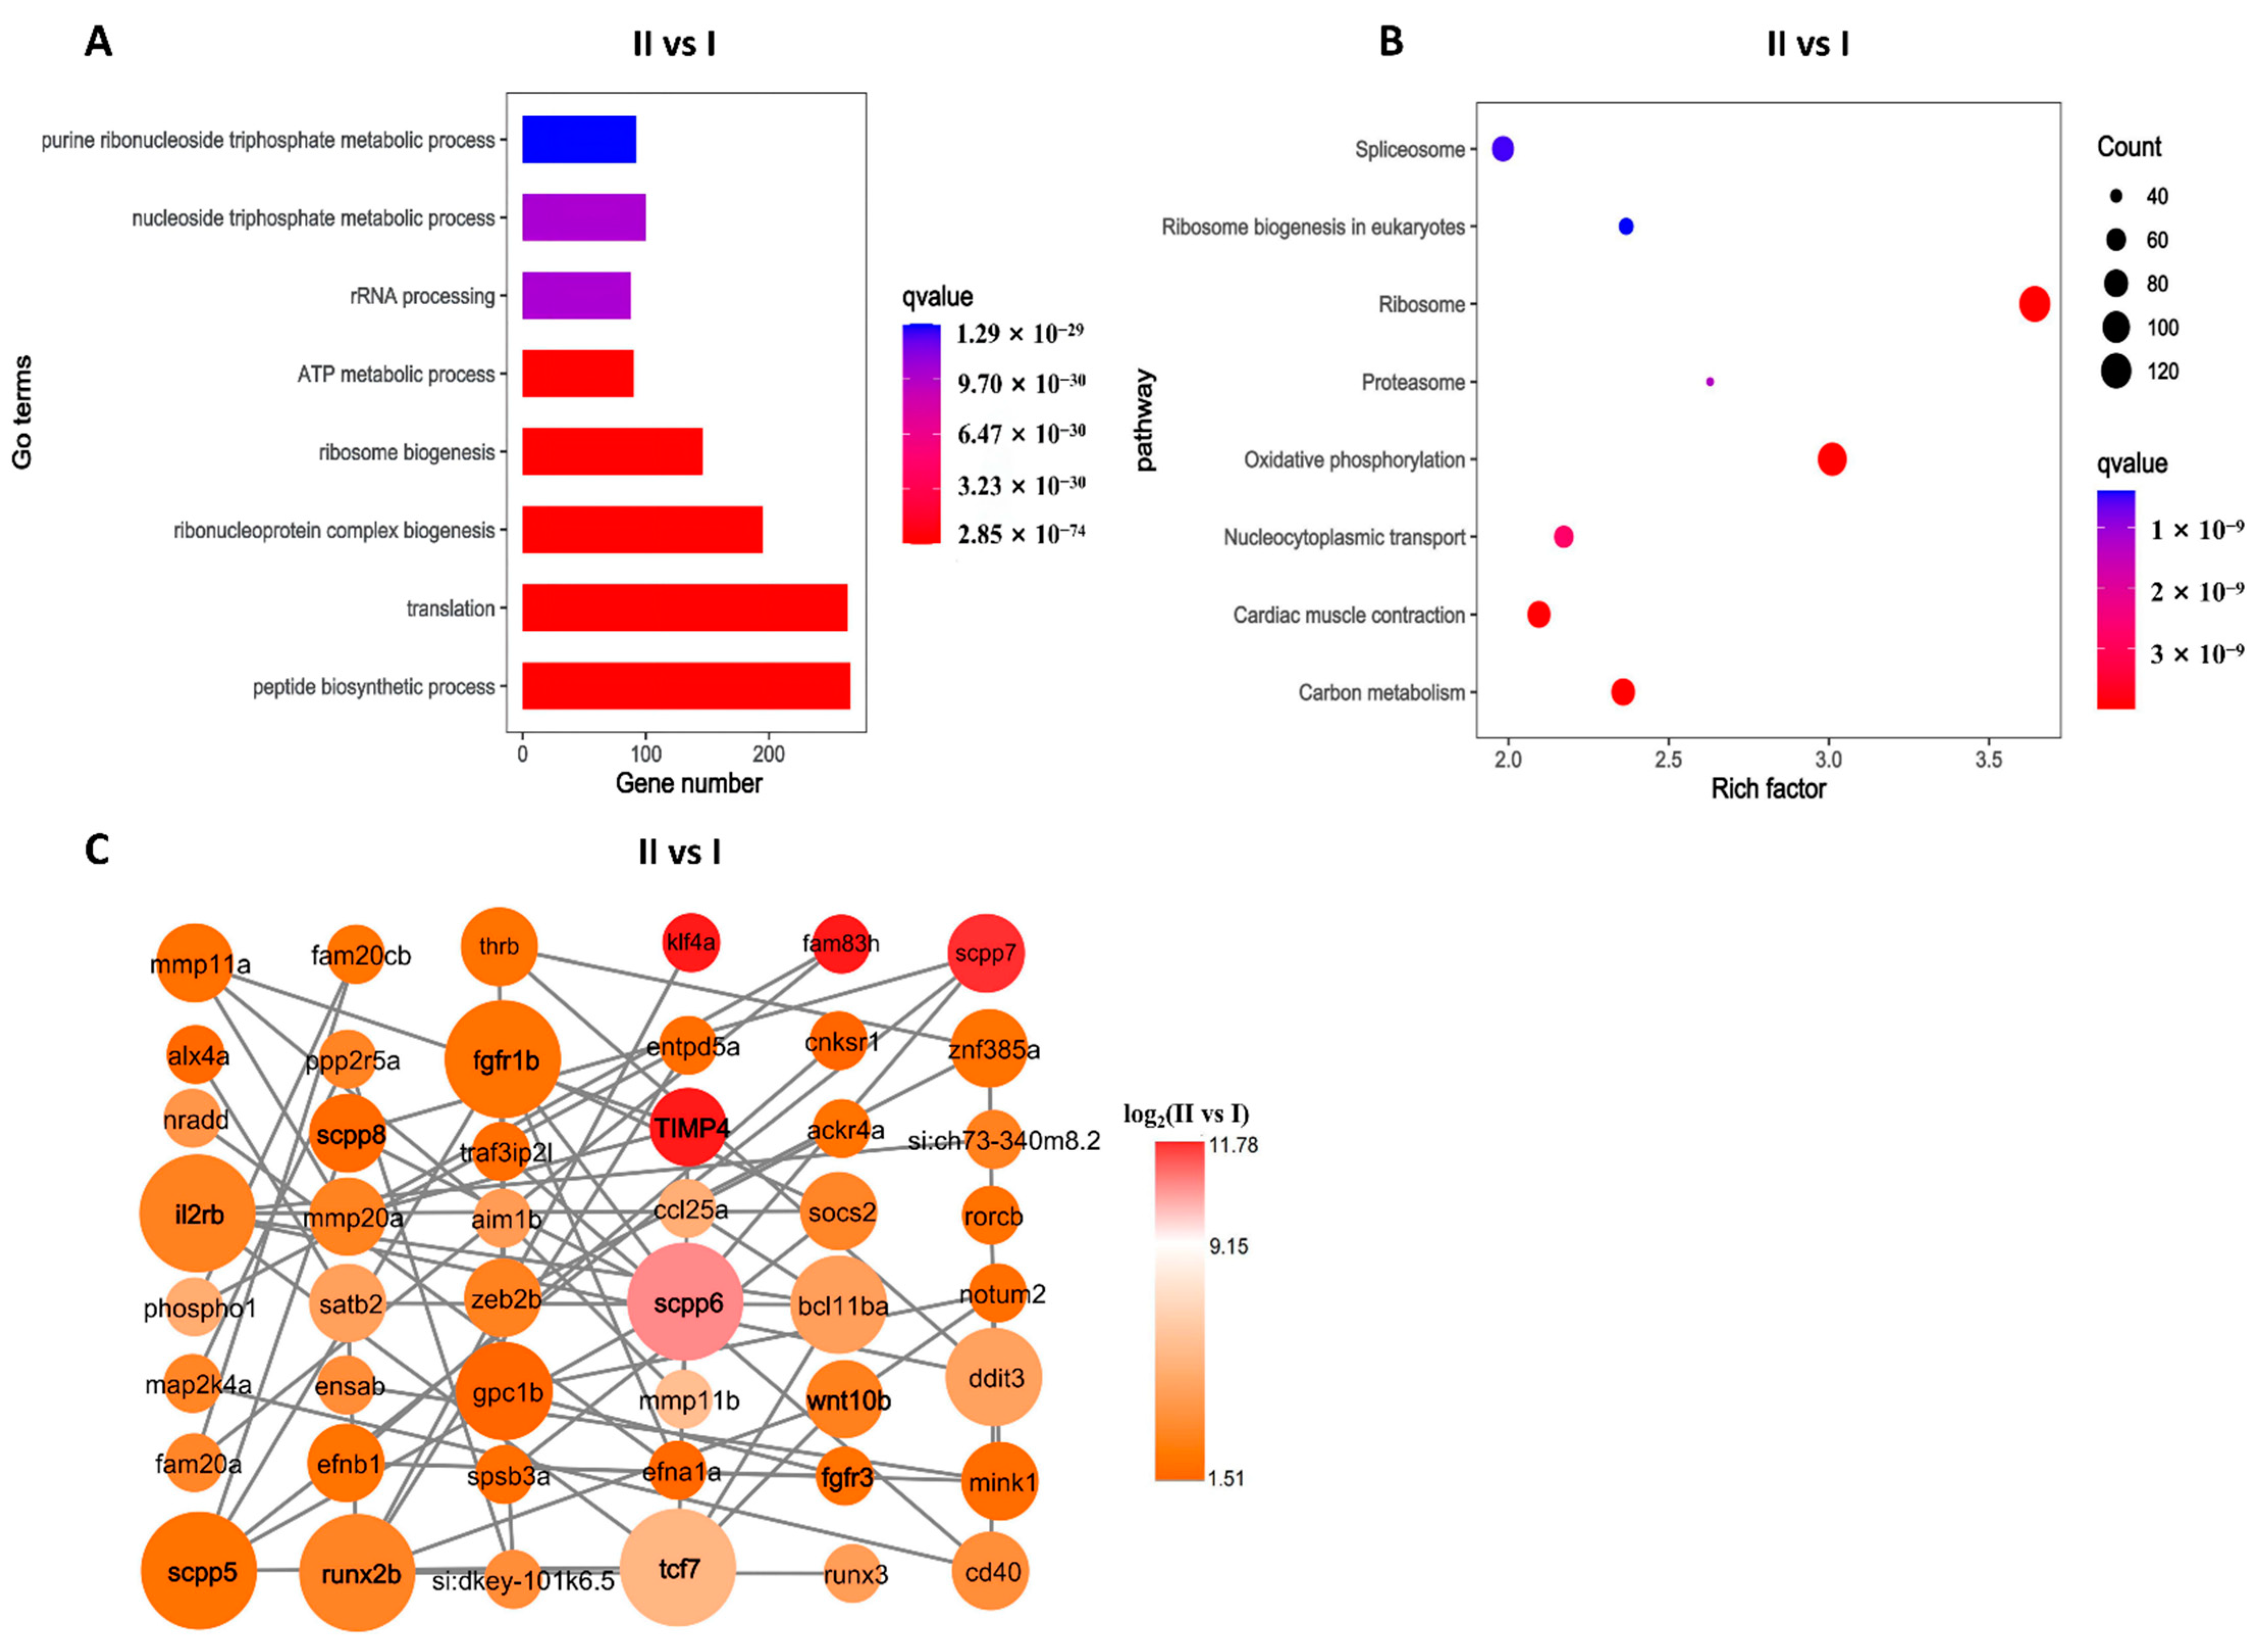
In order to explore important pathways and biological processes involved in scale development, the gene expression in the four developmental stages was compared and both GO and KEGG enrichment were carried out. As shown in Figure 4A, compared with stage I, stage II mainly involves metabolic processes, such as ATP metabolism and translation, indicating that a large amount of energy is required in the process of scale formation. In addition, the corresponding enrichment pathways are mainly energy metabolism pathways, such as carbon metabolism, ribosome, and other pathways (Figure 4B).
Compared with stage I, stage III is mainly involved in the biological process of energy metabolism and translation (Figure S1A), and the corresponding KEGG pathway was also related to energy metabolism, such as the TCA cycle and glucose metabolism (Figure S1B). Compared with stage I, stage IV is mainly involved in a series of biological processes of skeletal muscle growth (Figure S1C) and both focal adhesion and the ECM receptor in the enriched pathway are mainly involved in the process of cell adhesion (Figure S1D).

3.5. Gene-Act Network

Compared with stage I, 320 genes (log2FC ≥ 3.0, p ≤ 0.01) in stage II (the starting point of scale growth) were selected to explore the relationship between DEGs. Among them, 48 DEGs were identified for the linkage map constructing of the gene interaction network by Cytoscape software (Figure 4C). Several gene families, such as Fgf (Fgfr1b and Fgfr3) and Scpp (Scpp5, Scpp7, Scpp6, and Scpp8), were included (Figure 4C). It was clearly shown that Scpp6, Scpp5, Fgfr1b, Runx2b, Il2rb, and Tcf7 had complex interactive relationships with other genes, which indicated the important roles that those genes played (Figure 4C).

3.6. Key Genes and Pathways Related to Scale Development

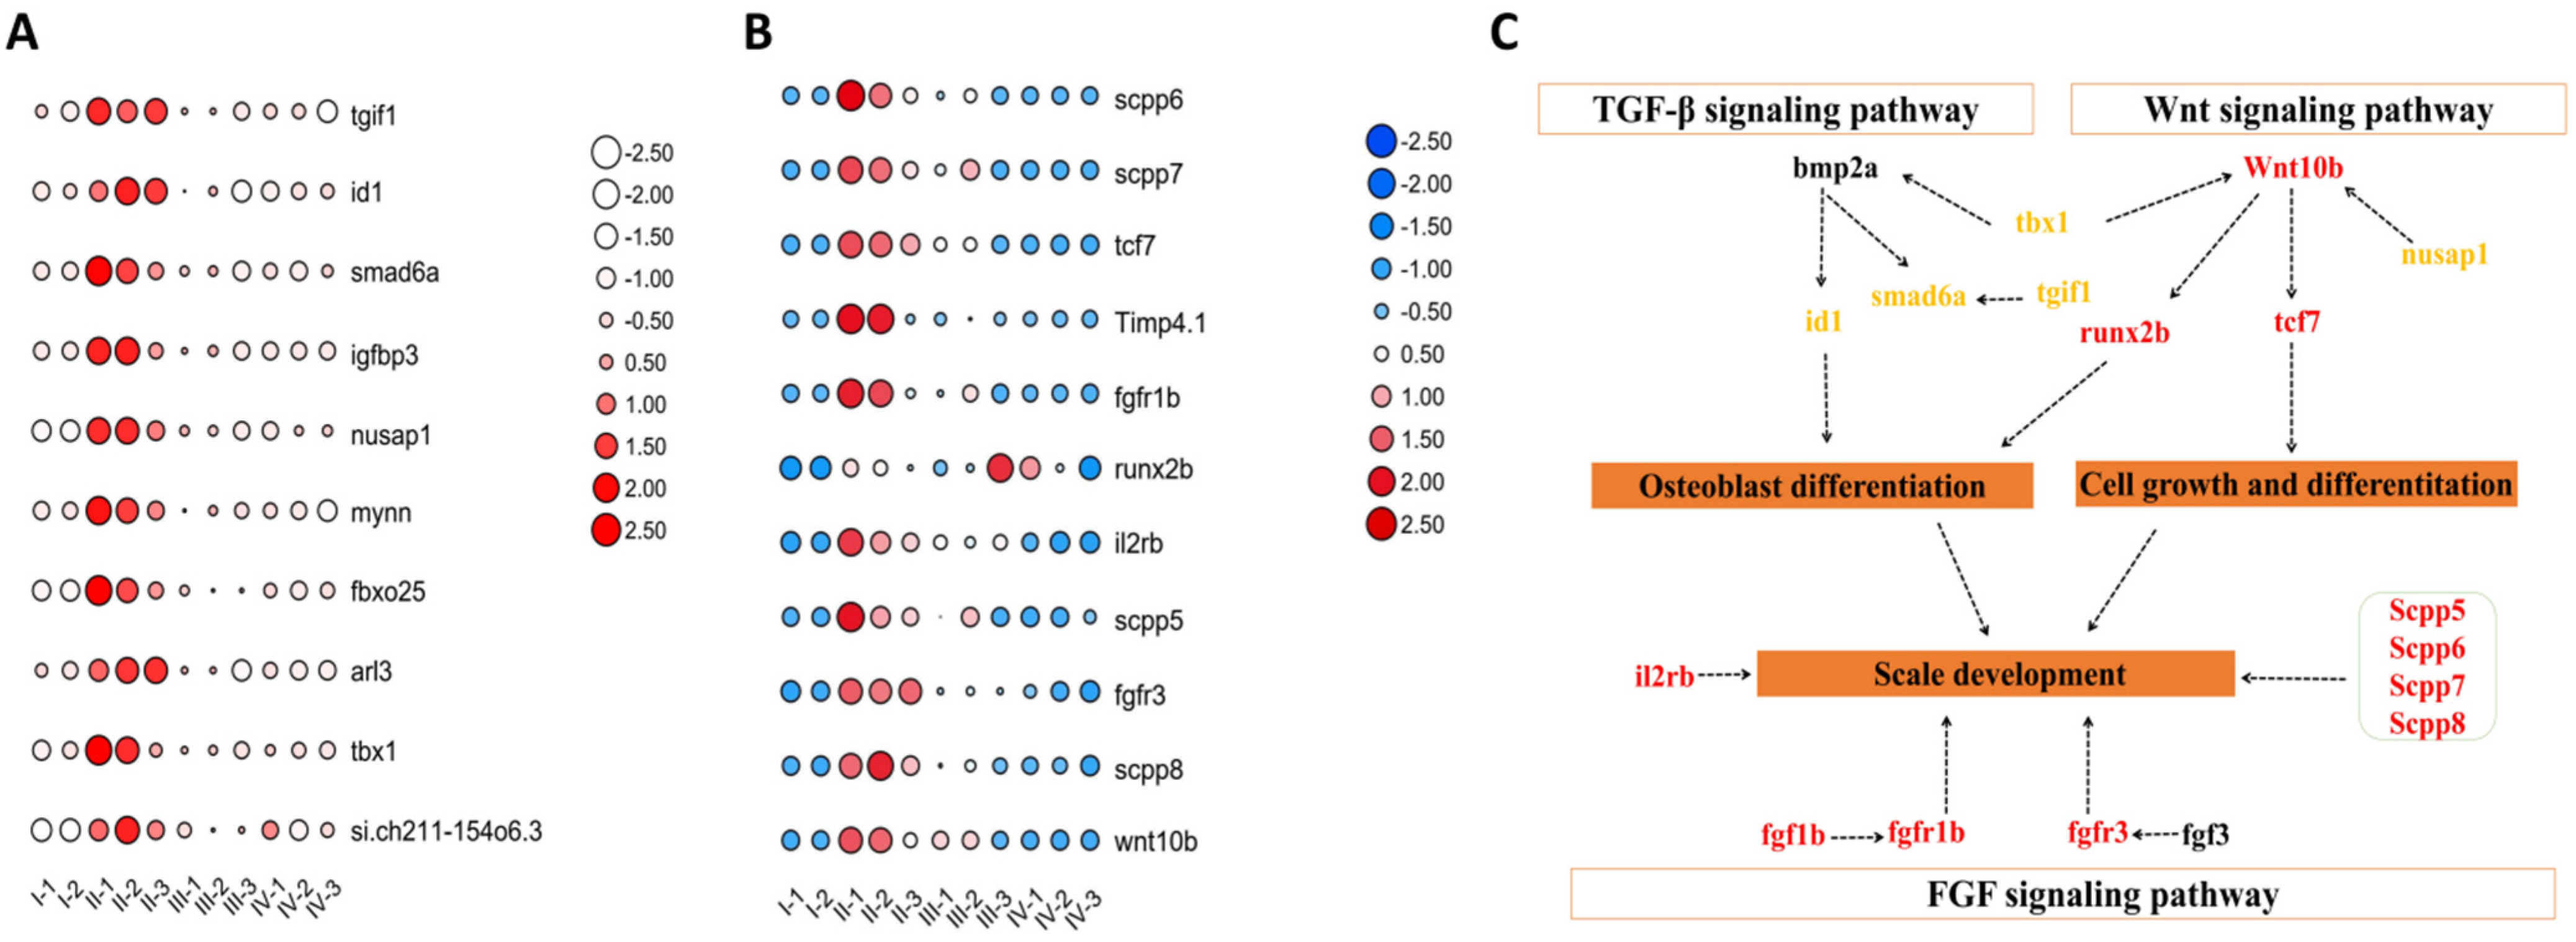
The 10 hub-genes obtained by WGCNA analysis were highly expressed in stage II of scale development (Figure 5A). Through traditional transcriptome analysis methods, this study found that the genes of these families were also upregulated in stage II of scale development, which included the Scpp family (Scpp6, Scpp7, Scpp5, and Scpp8), Wnt (Wnt10b), the Fgf family (Fgfr1b and Fgfr3), Tcf7, Il2rb, and Timp4.1 (Figure 5B). In order to further understand the process of scale formation, after further analysis of these genes, we found that they are mainly in three pathways: the Wnt, TGF-β, and FGF signaling pathways (Figure 5C). For further details about these genes, see Table S2.

3.7. qPCR Analysis Verifications

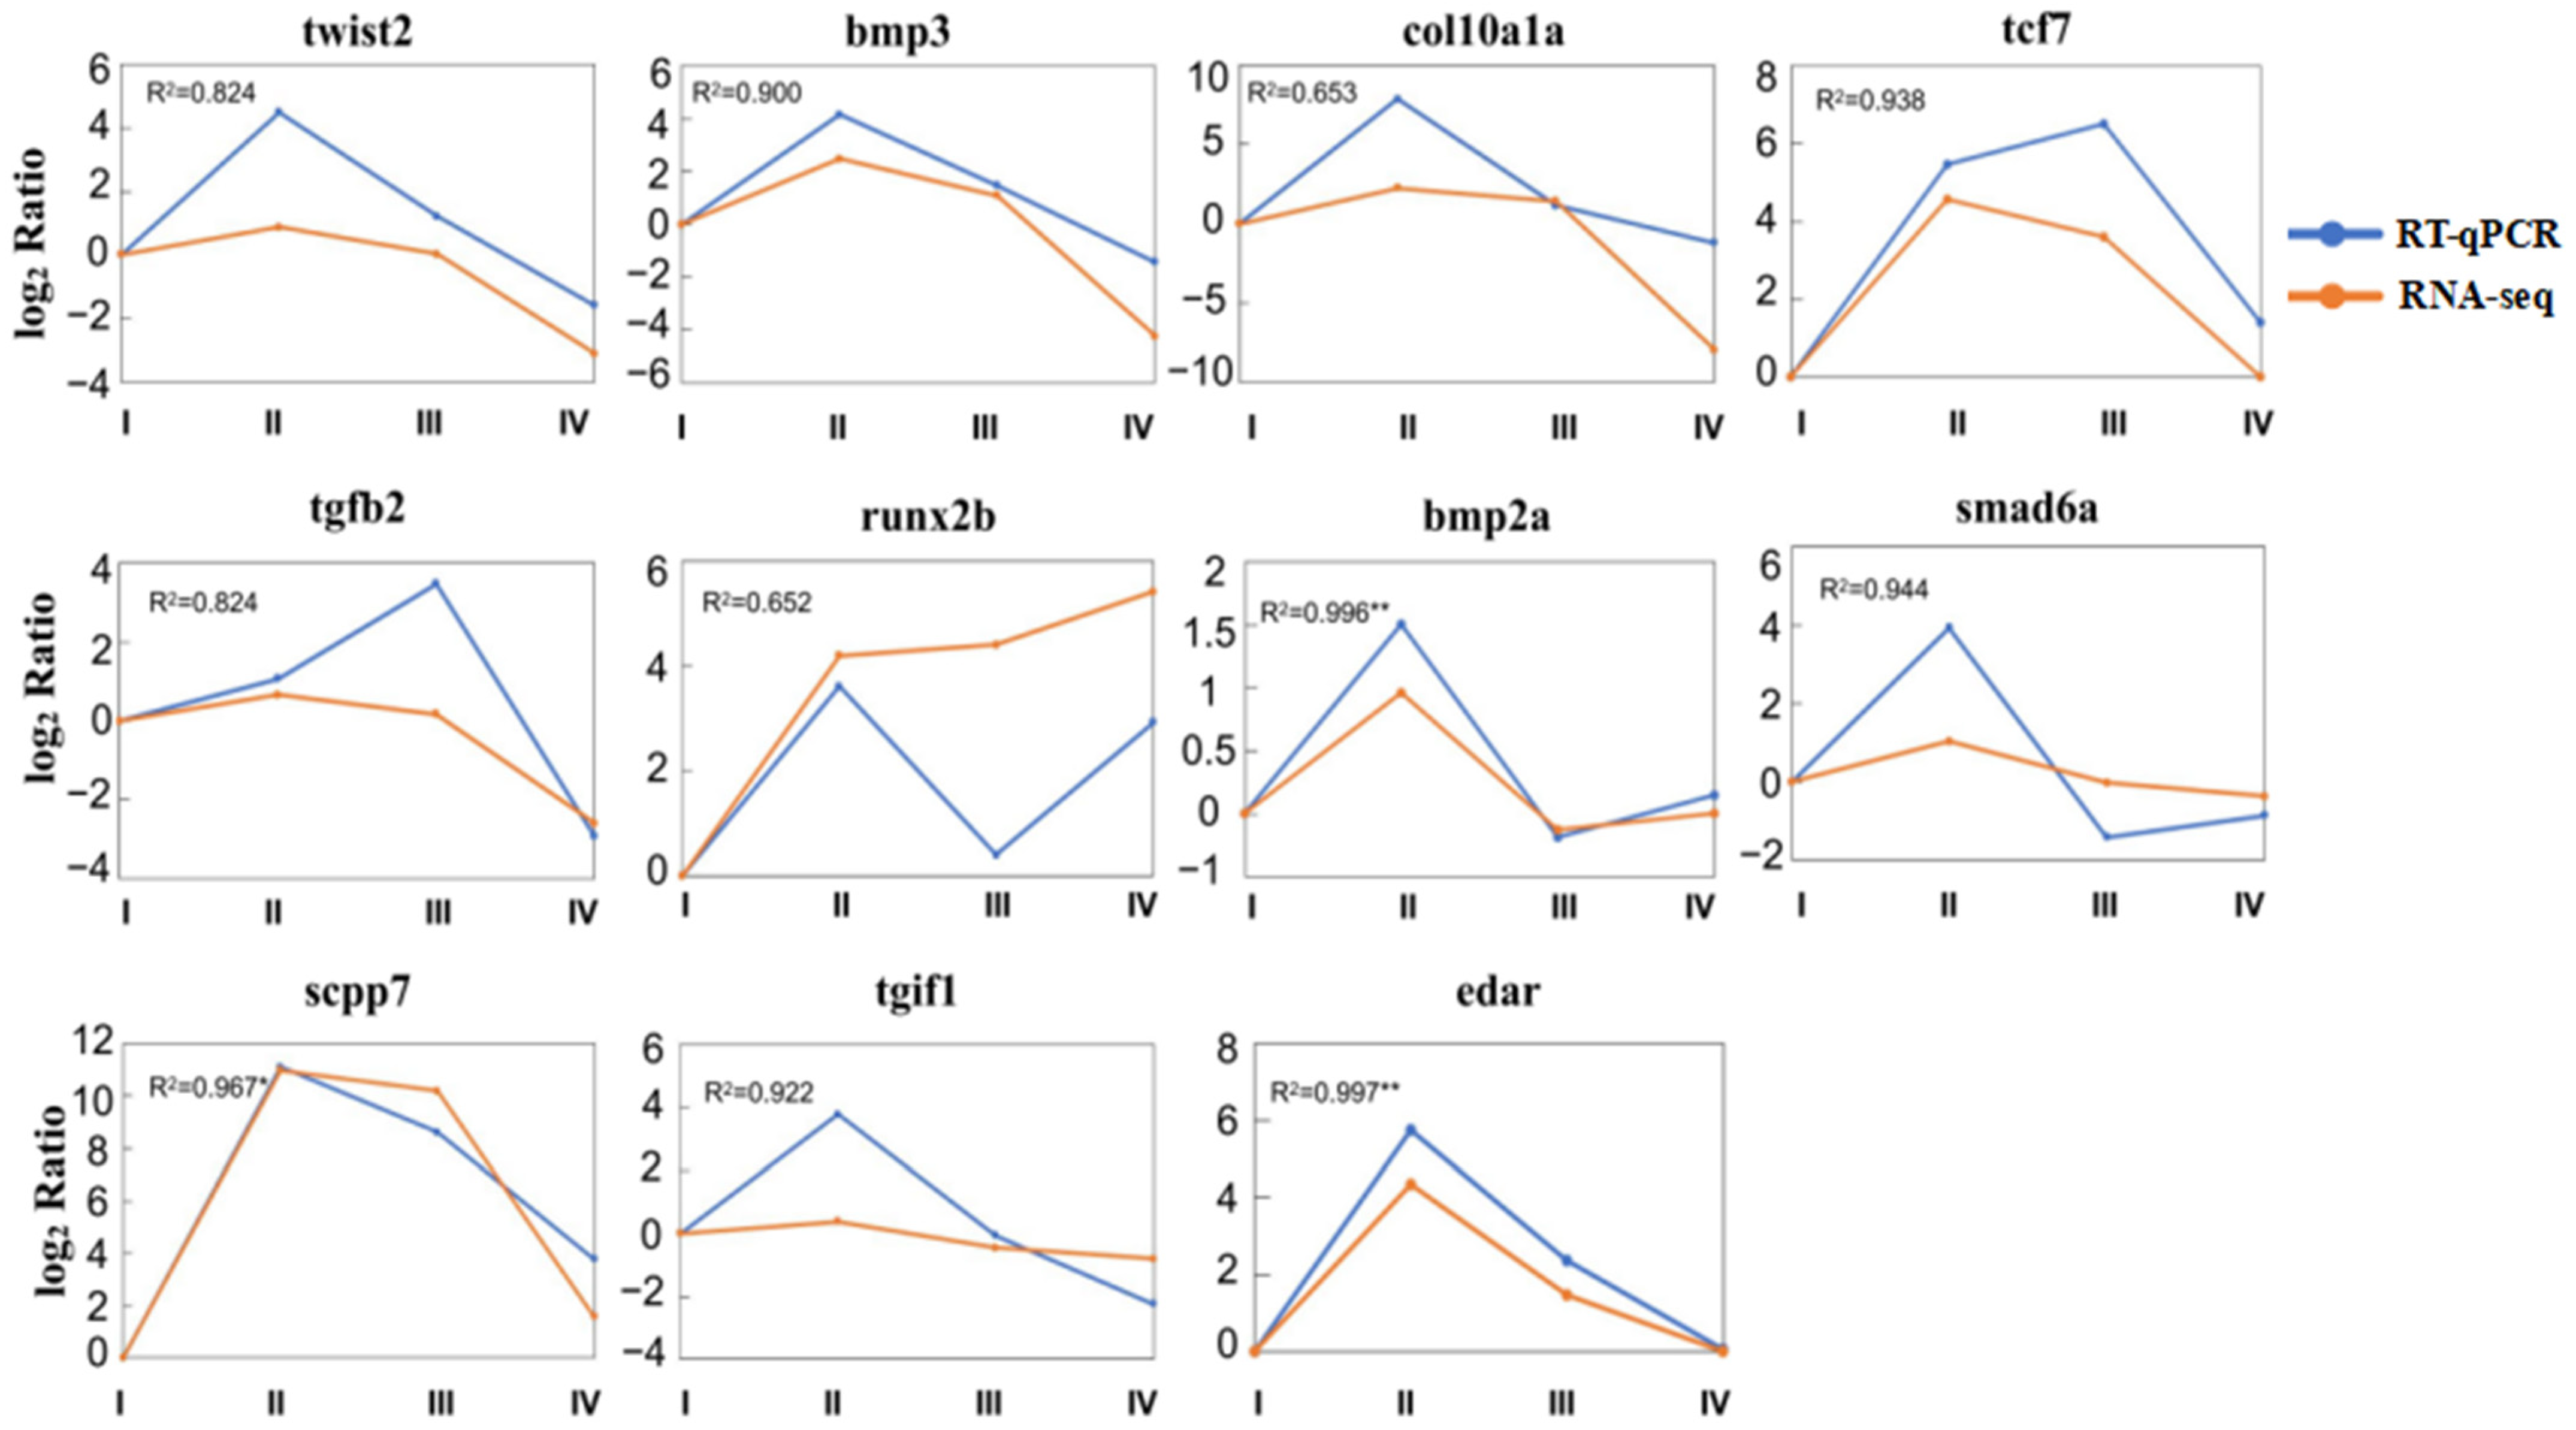
In order to further evaluate the reliability of transcriptome data, we selected 11 genes for qPCR detection. The correlation between RT-qPCR and RNA-seq results was analyzed by calculating the Pearson correlation coefficient (R2). The expression data of 11 selected genes showed the consistency between RNA-seq and RT-qPCR. The R2 value (>0.7) of the correlation between RT-qPCR and RNA-seq data confirmed the reliability of differential expression analysis in this study. Although the R2 values of two genes (Runx2b and Col10a1a) were less than 0.7, their trend of expression was the same (Figure 6).

4. Discussion

In fishes, scales are produced by directed differentiation from fish skin primitive stem cells [26]. Relevant research data show that the skin has already been formed at the beginning of the scale developmental process [27]. In this study, we used zebrafish as a model to study scale development by using alizarin red staining and we divided the developmental process into four stages: stage I (17 dpf), stage II (~33 dpf), stage III (~41 dpf), and stage IV (~3 mpf) (Figure 1). Studies have shown that first scale appearance in zebrafish is related to fish size. Zebrafish with a body length of 8.1–8.2 mm at 30 dpf had the first scale at the caudal peduncle [1]. The time of stage II of scale development (~33 dpf) was similar to that reported in the literature. The molecular mechanisms of fish scales starting to grow attract the interest of researchers. In order to find the key genes of scale development, we used WGCNA and differentially expressed gene analyses to perform gene identification.
According to the WGCNA analysis results, the study first identified hub-genes related to scale development, which included nusap1, tbx1, smad6a, and mynn (Figure 3). These genes have been reported to be involved in skin or bone development and have been confirmed to participate in many known skeletal development-related pathways. For example, Tbx1 is connected to several major signaling systems, such as FGF, WNT, and SHH, and is involved in the cell proliferation and regulation of cell shape and cell dynamics. It is expressed only in hair follicles in healthy human skin [28,29,30]. Id1 is a small molecule activator of BMP signaling [31] and is positively correlated with bone morphogenetic protein (BMP) signal metabolism during fin repair [32]. Bmp participates in the TGF-β signaling pathway and is a key regulatory gene in the pathway. Tgif1 is in the TGFβ1/Smad2/3 signaling pathway [33]. All these observations indicate that these hub-genes play both direct and indirect roles at key nodes in the scale development pathway.
Since stage II is the point at which scales start to grow and stage I is the stage zebrafish do not grow scales, the transcriptome comparison between II and I is very important. It is helpful for us to identify important upregulated genes involved in scale development. Therefore, we focused on the gene interaction map of groups (II vs. I) in which we found that the Scpp family (Scpp7, Scpp6, Scpp5, and Scpp8), the Fgf family (Fgfr1b and Fgfr3), Tcf7, Wnt10b, Runx2b, and Il2rb are closely connected, indicating that these genes play a key role in scale development (Figure 4C). Of course, some of the selected genes are consistent with existing literature reports. For instance, Z Liu et al. [34] further analyzed the transcriptome of scaled and non-scaled fishes, and found that two genes that play a leading role among the upregulated genes are the apolipoprotein and Scpp genes. In addition, Scpp has been reported to be involved in skeletal muscle development and tooth tissue calcification [35,36,37,38,39,40]. Wntl0b participates in the regulation of animal hair follicle growth and regeneration hair follicles are highly expressed during embryonic development, which promotes hair growth and participates in the maintenance of the hair follicle cycle [41]. FGFR (fibroblast growth factor receptor) is a member of the immunoglobulin superfamily and the gene itself also belongs to a polygenic family [42]. The FGFR gene is considered to be an important developmental gene which can regulate the differentiation and proliferation of a variety of cells [43]. Studies have shown that Fgfr1a and Fgfr20a mutations will lead to changes in the scale size of zebrafish during scale development [44,45]. The Fgfr1b and FGFR3 identified in this study belong to the FGFR family and are also highly expressed at the stage of scale formation, which is consistent with the results of existing reports. The TCF/lef transcription factor family can regulate the Wnt signaling pathway, including the Tcf7 gene identified in our study [46,47]. Ducy et al. [48] found that the Runx2 gene regulates bone formation by controlling osteoblast activity.
In the comparison of the RT-qPCR and RNA-seq results of the screened genes, we conducted correlation analysis and the t-test was used to test whether the correlation was significant. The results showed that the R2 of most genes was greater than 0.7 and two genes (EDAR and Bmp2a) had a very significant correlation (p < 0.01); the correlation of one gene (Scpp7) was significant (p < 0.05) but the correlation of the others was not significant (p > 0.05). However, while the R2 value of the RT-qPCR and RNA-seq of the genes was less than 0.7 or their correlation was not significant, their expression trend was consistent, indicating the reliability of the transcriptome results. This result is consistent with the results presented in many literature reports, that is, the expression trend of RT-qPCR and RNA-seq is consistent [49,50,51].
Scale development is an extremely important and complex process. Therefore, studying the mechanism of scale development and its related signaling pathways can help understand animal evolution, growth, development, and reproduction. It involves many signaling pathways and genes, such as the SHH, FGFs, BMP, EDA/EDAR, and Wnt/β-catenin signaling pathways, as well as transcription factors including Twist2 [9,10,11,52]. These factors control the occurrence and development of scales. However, in our current study, the Shh, EDA/EDAR, BMP, twist2, and ApoE genes were not identified during scale development, although they are still important. Based on the results of WGCNA analysis and traditional transcriptome analysis, we mainly found that the Wnt/β-catenin, TGF-β, and FGF signaling pathways play a very important role in the process of scale development.
At present, only a few genes related to scale development have been functionally verified in zebrafish and most genes have not been functionally verified to prove their impact on scale development. Moreover, with the development of gene editing technology, it is possible to use gene knockout to assess gene function. In future work, our focus is to identify the genes related to scale development using gene knockout.

5. Conclusions

In this study, four different stages of zebrafish scale development were determined by alizarin red staining and the skin transcriptome was studied regarding these four stages. Using WGCNA analysis, we found 54 hub-genes highly related to scale development. In addition, combined with transcriptome analysis, we found the TGF-β, Wnt/β-Catenin and FGF signaling pathways, and the highly expressed Scpp family (Scpp7, Scpp6, Scpp5, and Scpp8), the Fgf family (Fgfr1b and Fgfr3), Tcf7, Wnt10b, Runx2b, and Il2rb genes to be involved in scale development. In conclusion, this study provides a powerful reference for further study on the molecular regulation mechanism of gene regulation, morphogenesis, and the function of related genes in fish scale formation.

Supplementary Materials

The following supporting information can be downloaded at: https://www.mdpi.com/article/10.3390/fishes7020064/s1, Figure S1: Compared with stage I, the biological process and pathways enriched in stage III and stage IV; Table S1: WGCNA analysis of 54 highly connected genes in the turquoise module; and Table S2: According to the results of WGCNA and transcriptome analysis, the FPKM values of 21 candidate genes related to zebrafish scale development were identified.

Author Contributions

Validation, Z.Z., F.J., S.J. and Z.W.; formal analysis, Z.Z.; data curation, Z.Z. and F.J.; writing—original draft preparation, Z.Z.; writing—review and editing, Q.X.; visualization, Z.Z.; supervision, Q.X.; project administration, Q.X.; funding acquisition, Q.X. All authors have read and agreed to the published version of the manuscript.

Funding

This work was supported in part by the Funding Project of the National Key Research and Development Program of China (2018YFC0310600), the National Key Research and Development Program of China (2018YFD0900601), the National Natural Science Foundation of China (grant number 31772826), and the major scientific innovation project from the Shanghai Committee of Education (2017-01-07-00-10-E00060).

Institutional Review Board Statement

The animals used in the present study were cultured and euthanized following the terms of use of animals approved by the Institutional Animal Care and Use Committee at the Shanghai Ocean University (Shanghai, China; SHOU-DW-20171022).

Data Availability Statement

All sequencing data associated with this project were deposited in the National Center for Biotechnology Information (NCBI) Sequence Read Archive database with the bioproject accession number PRJNA789095 (https://www.ncbi.nlm.nih.gov/sra/PRJNA789095). The data will be released on 14 December 2025.

Conflicts of Interest

The authors declare no conflict of interest.

References

  1. Sire, J.-Y.; Allizard, F.; Babiar, O.; Bourguignon, J.; Quilhac, A. Scale development in zebrafish (Danio rerio). J. Anat. 1997, 190, 545–561. [Google Scholar] [CrossRef] [PubMed]
  2. Able, K.W.; Sakowicz, G.P.; Lamonaca, J.C. Scale formation in selected fundulid and cyprinodontid fishes. Ichthyol. Res. 2008, 56, 1. [Google Scholar] [CrossRef]
  3. Zylberberg, L.; Géraudie, J.; Meunier, F.J. Biomineralisation in the integumental skeleton of the living lower vertebrates. Bone-Bone Metab. Miner. 1992, 4, 171–224. [Google Scholar]
  4. Meunier, F.J. Les Tissus Osseux des Ostéichthyens. In Structure, Genése, Croissance et Évolution; Institut d’ethnologie du Museum National d’histoire Naturelle: Paris, France, 1983. [Google Scholar]
  5. Cooper, J.A. Scale Development as Related to Growth of Juvenile Black Crappie, Pomoxis nigromaculatus Lesueur. Trans. Am. Fish. Soc. 1971, 100, 570–572. [Google Scholar] [CrossRef]
  6. Huysseune, A.; Sire, J. Evolution of patterns and processes in teeth and tooth-related tissues in non-mammalian vertebrates. Eur. J. Oral Sci. 1998, 106, 437–481. [Google Scholar] [CrossRef]
  7. Zhu, D.; Ortega, C.F.; Motamedi, R.; Szewciw, L.; Vernerey, F.; Barthelat, F. Structure and Mechanical Performance of a “Modern” Fish Scale. Adv. Eng. Mater. 2011, 14, B185–B194. [Google Scholar] [CrossRef]
  8. Sire, J.-Y. Development and fine structure of the bony scutes in Corydoras arcuatus (Siluriformes, callichthyidae). J. Morphol. 1993, 215, 225–244. [Google Scholar] [CrossRef]
  9. Schneider, P.; Street, S.L.; Gaide, O.; Hertig, S.; Tardivel, A.; Tschopp, J.; Runkel, L.; Alevizopoulos, K.; Ferguson, B.M.; Zonana, J. Mutations Leading to X-linked Hypohidrotic Ectodermal Dysplasia Affect Three Major Functional Domains in the Tumor Necrosis Factor Family Member Ectodysplasin-A. J. Biol. Chem. 2001, 276, 18819–18827. [Google Scholar] [CrossRef] [Green Version]
  10. Sehring, I.M.; Jahn, C.; Weidinger, G. Zebrafish fin and heart: What’s special about regeneration? Curr. Opin. Genet. Dev. 2016, 40, 48–56. [Google Scholar] [CrossRef]
  11. Motamedi, M.; Zeinali, F.; Soltanian, S. Expression Patterns of Three Regulatory Genes in Caudal Fin Regeneration of the Euryhaline Killifish, Aphanius hormuzensis (Teleostei: Aphaniidae). Iran. J. Sci. Technol. Trans. A Sci. 2019, 43, 2115–2122. [Google Scholar] [CrossRef]
  12. Aman, A.J.; Fulbright, A.N.; Parichy, D.M. Wnt/β-catenin regulates an ancient signaling network during zebrafish scale development. eLife 2018, 7, 37001. [Google Scholar] [CrossRef] [PubMed]
  13. Streisinger, G.; Walker, C.; Dower, N.; Knauber, D.; Singer, F. Production of clones of homozygous diploid zebra fish. Nature 1981, 291, 293–296. [Google Scholar] [CrossRef] [PubMed]
  14. Akimenko, M.; Johnson, S.; Westerfield, M.; Ekker, M. Differential induction of four msx homeobox genes during fin development and regeneration in zebrafish. Development 1995, 121, 347–357. [Google Scholar] [CrossRef] [PubMed]
  15. Kondo, S.; Kuwahara, Y.; Kondo, M.; Naruse, K.; Mitani, H.; Wakamatsu, Y.; Ozato, K.; Asakawa, S.; Shimizu, N.; Shima, A. The medaka rs-3 locus required for scale development encodes ectodysplasin-A receptor. Curr. Biol. 2001, 11, 1202–1206. [Google Scholar] [CrossRef] [Green Version]
  16. Mortazavi, A.; Williams, B.A.; McCue, K.; Schaeffer, L.; Wold, B. Mapping and quantifying mammalian transcriptomes by RNA-Seq. Nat. Methods 2008, 5, 621–628. [Google Scholar] [CrossRef]
  17. Chen, C.-F.; Foley, J.; Tang, P.-C.; Li, A.; Jiang, T.X.; Wu, P.; Widelitz, R.B.; Chuong, C.M. Development, Regeneration, and Evolution of Feathers. Annu. Rev. Anim. Biosci. 2015, 3, 169–195. [Google Scholar] [CrossRef] [Green Version]
  18. Liu, S.; Wang, Z.; Chen, D.; Zhang, B.; Tian, R.-R.; Wu, J.; Zhang, Y.; Xu, K.; Yang, L.-M.; Cheng, C.; et al. Annotation and cluster analysis of spatiotemporal- and sex-related lncRNA expression in rhesus macaque brain. Genome Res. 2017, 27, 1608–1620. [Google Scholar] [CrossRef] [Green Version]
  19. Langfelder, P.; Horvath, S. WGCNA: An R package for weighted correlation network analysis. BMC Bioinform. 2008, 9, 559. [Google Scholar] [CrossRef] [Green Version]
  20. Shannon, P.; Markiel, A.; Ozier, O.; Baliga, N.S.; Wang, J.T.; Ramage, D.; Amin, N.; Schwikowski, B.; Ideker, T. Cytoscape: A software environment for integrated models of Biomolecular Interaction Networks. Genome Res. 2003, 13, 2498–2504. [Google Scholar] [CrossRef]
  21. Kim, D.; Langmead, B.; Salzberg, S.L. HISAT: A fast spliced aligner with low memory requirements. Nat. Methods 2015, 12, 357–360. [Google Scholar] [CrossRef] [Green Version]
  22. Robinson, M.D.; McCarthy, D.J.; Smyth, G.K. EdgeR: A Bioconductor package for differential expression analysis of digital gene expression data. Bioinformatics 2010, 26, 139–140. [Google Scholar] [CrossRef] [PubMed] [Green Version]
  23. Trapnell, C.; Roberts, A.; Goff, L.; Pertea, G.; Kim, D.; Kelley, D.R.; Pimentel, H.; Salzberg, S.L.; Rinn, J.L.; Pachter, L. Differential gene and transcript expression analysis of RNA-seq experiments with TopHat and Cufflinks. Nat. Protoc. 2012, 7, 562–578. [Google Scholar] [CrossRef] [PubMed] [Green Version]
  24. Yu, G.; Wang, L.-G.; Han, Y.; He, Q.-Y. clusterProfiler: An R Package for Comparing Biological Themes Among Gene Clusters. OMICS 2012, 16, 284–287. [Google Scholar] [CrossRef] [PubMed]
  25. Livak, K.J.; Schmittgen, T.D. Analysis of relative gene expression data using real-time quantitative PCR and the 2-ΔΔCt method. Methods 2001, 25, 402–408. [Google Scholar] [CrossRef]
  26. Sharpe, P. Fish scale development: Hair today, teeth and scales yesterday? Curr. Biol. 2001, 11, R751–R752. [Google Scholar] [CrossRef] [Green Version]
  27. Francillon-Vieillot, H.; de Buffrénil, V.; Castanet, J.; Géraudie, J.; Meunier, F.; Sire, J.Y.; Zylberberg, L.; de Ricqlès, A. Microstructure and Mineralization of Vertebrate Skeletal Tissues; American Geophysical Union: Washington, DC, USA, 2013; pp. 175–234. [Google Scholar]
  28. Garg, V.; Yamagishi, C.; Huab, T.; Kathiriyaab, I.S.; Yamagishiab, H.; Srivastava, D. Tbx1, a DiGeorge Syndrome Candidate Gene, Is Regulated by Sonic Hedgehog during Pharyngeal Arch Development. Dev. Biol. 2001, 235, 62–73. [Google Scholar] [CrossRef] [Green Version]
  29. Merscher, S.; Funke, B.; Epstein, J.A.; Heyer, J.; Puech, A.; Lu, M.M.; Xavier, R.J.; Demay, M.B.; Russell, R.G.; Factor, S.; et al. TBX1 Is Responsible for Cardiovascular Defects in Velo-Cardio-Facial/DiGeorge Syndrome. Cell 2001, 104, 619–629. [Google Scholar] [CrossRef] [Green Version]
  30. Yu, J.; Carroll, T.J.; McMahon, A.P. Sonic hedgehog regulates proliferation and differentiation of mesenchymal cells in the mouse metanephric kidney. Development 2002, 129, 5301–5312. [Google Scholar] [CrossRef]
  31. Vrijens, K.; Lin, W.; Cui, J.; Farmer, D.; Low, J.; Pronier, E.; Zeng, F.-Y.; Shelat, A.A.; Guy, K.; Taylor, M.R.; et al. Identification of Small Molecule Activators of BMP Signaling. PLoS ONE 2013, 8, e59045. [Google Scholar] [CrossRef] [Green Version]
  32. Thorimbert, V.; König, D.; Marro, J.; Ruggiero, F.; Jazwinska, A. Bone morphogenetic protein signaling promotes morphogenesis of blood vessels, wound epidermis, and actinotrichia during fin regeneration in zebrafish. FASEB J. 2015, 29, 4299–4312. [Google Scholar] [CrossRef] [Green Version]
  33. Sharma, A.; Sinha, N.R.; Siddiqui, S.; Mohan, R.R. Role of 5′TG3′-interacting factors (TGIFs) in Vorinostat (HDAC inhibitor)-mediated Corneal Fibrosis Inhibition. Mol. Vis. 2015, 21, 974–984. [Google Scholar] [PubMed]
  34. Liu, Z.; Liu, S.; Yao, J.; Bao, L.; Zhang, J.; Li, Y.; Jiang, C.; Sun, L.; Wang, R.; Zhang, Y.; et al. The channel catfish genome sequence provides insights into the evolution of scale formation in teleosts. Nat. Commun. 2016, 7, 11757. [Google Scholar] [CrossRef] [PubMed]
  35. Kawasaki, K.; Weiss, K.M. Mineralized tissue and vertebrate evolution: The secretory calcium-binding phosphoprotein gene cluster. Proc. Natl. Acad. Sci. USA 2003, 100, 4060–4065. [Google Scholar] [CrossRef] [Green Version]
  36. Kawasaki, K. The SCPP gene repertoire in bony vertebrates and graded differences in mineralized tissues. Dev. Genes Evol. 2009, 219, 147–157. [Google Scholar] [CrossRef] [PubMed] [Green Version]
  37. Kawasaki, K. The SCPP Gene Family and the Complexity of Hard Tissues in Vertebrates. Cells Tissues Organs 2011, 194, 108–112. [Google Scholar] [CrossRef] [PubMed]
  38. Kawasaki, K.; Amemiya, C.T. SCPP genes in the coelacanth: Tissue mineralization genes shared by sarcopterygians. J. Exp. Zool. Part B Mol. Dev. Evol. 2013, 322, 390–402. [Google Scholar] [CrossRef]
  39. Kawasaki, K.; Weiss, K. SCPP Gene Evolution and the Dental Mineralization Continuum. J. Dent. Res. 2008, 87, 520–531. [Google Scholar] [CrossRef]
  40. Kawasaki, K.; Weiss, K.M. Evolutionary genetics of vertebrate tissue mineralization: The origin and evolution of the secretory calcium-binding phosphoprotein family. J. Exp. Zool. Part B Mol. Dev. Evol. 2006, 306, 295–316. [Google Scholar] [CrossRef]
  41. Ouji, Y.; Yoshikawa, M.; Shiroi, A.; Ishizaka, S. Wnt-10b promotes differentiation of skin epithelial cells in vitro. Biochem. Biophys. Res. Commun. 2006, 342, 28–35. [Google Scholar] [CrossRef]
  42. Schultz, G.A.; Harvey, M.B.; Watson, A.J.; Arcellana-Panlilio, M.Y.; Jones, K.; Westhusin, M.E. Regulation of Early Embryonic Development by Growth Factors: Growth Factor Gene Expression in Cloned Bovine Embryos. J. Anim. Sci. 1996, 74, 50–57. [Google Scholar] [CrossRef]
  43. Lacome, D. Clinical dysmorphology beyond developmental genetics recent advances in some human developmental genes. Ann. Genet. 1995, 38, 137–144. [Google Scholar]
  44. Daane, J.M.; Rohner, N.; Konstantinidis, P.; Djuranovic, S.; Harris, M.P. Parallelism and Epistasis in Skeletal Evolution Identified through Use of Phylogenomic Mapping Strategies. Mol. Biol. Evol. 2016, 33, 162–173. [Google Scholar] [CrossRef] [PubMed] [Green Version]
  45. Rohner, N.; Bercsényi, M.; Orbán, L.; Kolanczyk, M.E.; Linke, D.; Brand, M.; Nüsslein-Volhard, C.; Harris, M.P. Duplication of fgfr1 Permits Fgf Signaling to Serve as a Target for Selection during Domestication. Curr. Biol. 2009, 19, 1642–1647. [Google Scholar] [CrossRef] [PubMed] [Green Version]
  46. Clevers, H. Wnt/β-Catenin Signaling in Development and Disease. Cell 2006, 127, 469–480. [Google Scholar] [CrossRef] [Green Version]
  47. Logan, C.Y.; Nusse, R. The Wnt Signaling Pathway in Development and Disease. Annu. Rev. Cell Dev. Biol. 2004, 20, 781–810. [Google Scholar] [CrossRef] [Green Version]
  48. Ducy, P.; Starbuck, M.; Priemel, M.; Shen, J.; Pinero, G.; Geoffroy, V.; Amling, M.; Karsenty, G. A Cbfa1-dependent genetic pathway controls bone formation beyond embryonic development. Genes Dev. 1999, 13, 1025–1036. [Google Scholar] [CrossRef] [Green Version]
  49. Li, S.; Zhou, Y.; Yang, C.; Fan, S.; Huang, L.; Zhou, T.; Wang, Q.; Zhao, R.; Tang, C.; Tao, M.; et al. Comparative analyses of hypothalamus transcriptomes reveal fertility-, growth-, and immune-related genes and signal pathways in different ploidy cyprinid fish. Genomics 2021, 113, 595–605. [Google Scholar] [CrossRef]
  50. Hu, P.; Liu, M.; Zhang, N.; Wang, J.; Niu, H.; Liu, Y.; Wu, Z.; Han, B.; Zhai, W.; Shen, Y.; et al. Global identification of the genetic networks and cis-regulatory elements of the cold response in zebrafish. Nucleic Acids Res. 2015, 43, 9198–9213. [Google Scholar] [CrossRef] [Green Version]
  51. Zhao, X.; Sun, Z.; Xu, H.; Song, N.; Gao, T. Transcriptome and co-expression network analyses reveal the regulatory pathways and key genes associated with temperature adaptability in the yellow drum (Nibea albiflora). J. Therm. Biol. 2021, 100, 103071. [Google Scholar] [CrossRef]
  52. Jacob, T.; Chakravarty, A.; Panchal, A.; Patil, M.; Ghodadra, G.; Sudhakaran, J.; Nuesslein-Volhard, C. Zebrafish twist2/dermo1 regulates scale shape and scale organization during skin development and regeneration. Cells Dev. 2021, 166, 203684. [Google Scholar] [CrossRef]
Figure 1. Alizarin red staining of tail scales at each sampling point for transcriptome analysis. (A) Whole-body staining of zebrafish stage I (~17 dpf). (B) Tail-scale staining of zebrafish at stage I (~17 dpf). (C) Tail-scale staining of zebrafish at stage II (~33 dpf). (D) Tail-scale staining of zebrafish at stage III (~41 dpf).
Fishes 07 00064 g001
Figure 2. Statistical analysis of the transcriptome sequencing data. (A) Gene expression numbers of the four fish scale developmental stages. (B) Distribution of gene expression levels for each sample. The X-axis represents the sample name and the Y-axis represents the value of log10 (FPKM + 1). The box chart of each part corresponds to the following from top to bottom: upper quartile, median, lower quartile, and lower limit. The upper and lower limits do not take outliers into account.
Fishes 07 00064 g002
Figure 3. WGCNA analysis and hub-gene identification. (A) Network topology analysis of various soft threshold powers. The left figure shows the relationship between the scale-free fitting index (Y−axis) and the soft threshold capability (X−axis). The right graph shows the relationship between average connectivity (Y−axis) and soft threshold power (X−axis). (B) Clustering tree graph of genetic system based on topological overlap. Based on the dissimilarity of topological overlap, genes were classified into 13 different modules, where each color represents a module. (C) Correlation heat map between gene co-expression network module and different developmental stages of scales. (D) The top 10 hub-gene networks. The color intensity in the figure represents the connectivity; the darker the color, the more important it is.
Fishes 07 00064 g003
Figure 4. KEGG and GO analysis of transcriptome data. (A) Differential gene ontology (GO) classification of (II vs. I) groups. (B) KEGG pathway classification of (II vs. I) groups. (C) In the gene interaction network diagram in group (II vs. I), the bubble size represents the number of connection points between the focal gene and other genes; the more connection points, the more important the gene is in the enriched pathway. Changes in color from red to orange represent a decrease of expression.
Fishes 07 00064 g004
Figure 5. (A) Heat map of 10 hub-genes. (B) Heat maps of 11 important genes screened by traditional transcriptome analysis. (C) Three important signal pathways obtained by comprehensive analysis.
Fishes 07 00064 g005
Figure 6. The comparison of the selected gene expression patterns in RT-qPCR and RNA-seq showed a high correlation between the two methods. The calculation and mapping of the log2 ratio of expression changes in the other three stages was relative to the first stage (the log2 ratio of stage I was set to 0). The blue line shows the RT-qPCR results and the orange line shows the RNA sequence results. The Pearson correlation coefficient (R2) was used to measure the correlation between RT-qPCR and RNA-seq results. The results were analyzed by t-test. * indicates significant correlation (p < 0.05) while ** indicates highly significant correlation (p < 0.01).
Fishes 07 00064 g006
Table 1. Primers used in qPCR reactions.
Gene NamePrime Sequence (5′→3′)Product LengthTm
scpp7F: TTATTGCGCTCCGCAAGTG
R:GATTTCAGAGGGTCTTGCTGC
103 bp57 °C
twist2F:TGATAATGCCGAACGGACTGT
R:GAATGTCCTTTGGCCACGTC
100 bp58 °C
bmp3F:CTGATATCGGCTGGAGCGAG
R:GGAAGGTTTCAGAGACTTTGGC
104 bp57 °C
tcf7F: CTACGTGAGTGCTTTGGGCA
R:CGCGGCATTTCTTTGGAGAG
92 bp58 °C
tgif1F: TGCGCTCGATACTTCGTAACA
R: GACATCGCCAAAACACCCTT
139 bp59 °C
smad6 aF:CCCAGGACTATTCAGATGCCA
R:CGTCGTGAACTGGGTACAGG
117 bp56 °C
tgfb2F: ACGCGCTTTGCAGGTATAGA
R: AGACGGTATGATGGCAGCAG
122 bp60 °C
il2 rbF: ACAAGCTGGGAGATGGCAAA
R: ATGACCGTCAGTTTTCGGCT
138 bp57 °C
edarF: TGCGGACACTGTTTACCAGG
R:GTGTGGACCTCATGCACTCT
121 bp57 °C
bmp2aF:GAGCTTCCACCATGATGAATCTACA
R:ACCAACTCCTCGTCTGGGAT
105 bp60 °C
ZF-β-ActinF: CACTGAGGCTCCCCTGAATC
R: GGGTCACACCATCACCAGAG
167 bp60 °C
Publisher’s Note: MDPI stays neutral with regard to jurisdictional claims in published maps and institutional affiliations.