Article

Comparative Analysis of Intestinal Characteristics of Largemouth Bass (Micropterus salmoides) and Intestinal Flora with Different Growth Rates

1
Research Center of Fishery Resources and Environment, Guizhou University, Guiyang 550025, China
2
Key Laboratory of Animal Genetics, Breeding and Reproduction in the Plateau Mountainous Region, Ministry of Education, Guizhou University, Guiyang 550025, China
*
Author to whom correspondence should be addressed.
Fishes 2022, 7(2), 65; https://doi.org/10.3390/fishes7020065
Submission received: 22 January 2022 / Revised: 25 February 2022 / Accepted: 8 March 2022 / Published: 15 March 2022

Abstract

:
To explore the causes of different growth rates among juvenile populations of largemouth bass, in the present study, a batch of largemouth bass juveniles reared under the same conditions were divided into a fast-growing group and a slow-growing group. We used histological, enzymatic and molecular biology methods to analyze and determine their histomorphological changes, digestive enzyme activity and intestinal floral composition. The fast-growing group had a significantly (p ≤ 0.01) greater intestinal fold height and muscle thickness than the slow-growing group. Lipase activity was significantly (p ≤ 0.01) higher in the fast-growing group than in the slow-growing group. Intestinal microbial analysis showed that the relative abundance of Actinobacteria and Halomonas in the fast-growing group was higher than that in the slow-growing group. This research shows that the differentiation of growth rates in juvenile largemouth bass populations is closely related to intestinal fold status, lipase activity, and intestinal flora.

1. Introduction

In fishes, the same group of young individuals, exhibits obvious growth rate differentiation after a period of growth, with some individuals outgrowing other individuals one- to two-fold or more. This phenomenon of individual growth rate differentiation in fish has gradually received attention from scholars. Studies by Dobrochna Adamek et al. on Atlantic sturgeon (Acipenser oxyrinchus) showed that individuals belonging to the same population had different growth performances and a large number of differences in body length and weight [1]. Faster-growing individuals are more likely to survive to sexual maturity than slower-growing individuals. Individuals with slower growth usually show lower environmental adaptability and disease resistance [2]. Alm’s study on brown trout (Salmo trutta) showed that fast-growing brown trout reached sexual maturity earlier than slow-growing trout [3].
The growth rate of fish of the same species is regulated by exogenous factors such as environmental conditions, diet and culture density [4]. However, under the same culture conditions, the growth rate is mostly regulated by endogenous factors such as the endocrine system and nervous system [5]. Within a given fish species, there are many factors that have an impact on growth, such as feed type, food size and intake and nutrient absorption capacity [6]. Among these factors, nutrient uptake capacity is particularly important for the survival and growth of fish. The intestine plays an important role in vertebrate metabolism, nutrient absorption and immune function [7]. The intestine of fish can generally be divided into three parts: the foregut, midgut and hindgut. The foregut is primarily associated with digestion and absorption and is the main site of fat digestion [8], and the midgut and hindgut are associated with immunity [9]. The digestion and absorption of food by the fish intestine are mainly related to the mucosal surface structure. Intestinal mucosal thickness, fold length, crypt depth, muscle thickness and fold width are important indicators used to measure intestinal digestion and absorption function [7]. The intestinal flora also affects the digestive ability of fish. The intestinal flora create the microenvironment needed for the host to survive, and the host provides the conditions necessary for the intestinal flora to grow and flourish, creating a symbiotic relationship [10]. Research on the growth rate of fish usually focuses on the digestive system and its digestive ability. David Tamayo et al. showed that the growth rates of Philippine clams (Ruditapes philippinarum) were accelerated by faster feeding and improved digestive performance [4]. In terms of intestinal digestive enzymes, the protease and lipase activities of Cuban gar (Atractosteus tristoechus) varied at different stages of early development [11]. Kolkovski et al. found that the addition of pancreatic enzymes to the diet had a positive effect on the growth of gilthead seabream (Sparus aurata) fingerlings [12]. In studies on grass carp (Ctenopharyngodon idella) and crucian carp (Carassius auratus auratus), the fish were able to improve their digestion and absorption of feed fats by increasing the activity of digestive enzymes in the body [13,14]. In a study on the intestinal flora of rainbow trout (Oncorhynchus mykiss), the indicator flora for fast-growing individuals weighing 988.6 g–2123.9 g were Clostridium, Leptotrichia, and Peptostreptococcus, while Corynebacterium and Paeniclostridium were the indicator flora for the slow-growing group [15]. Among the intestinal flora of European eels (Anguilla anguilla) with different growth rates, the genus Cetobacterium was found to be more abundant in the fast-growing group [16].
Largemouth bass (Micropterus salmoides), also known as California bass, was first introduced to Guangdong Province of China in 1983. At present, largemouth basses are farmed in many parts of China. In 2020, China contributed nearly 620,000 tons of freshwater farmed largemouth bass. In this study, we used largemouth bass as an experimental material to observe growth rate differentiation. The intestinal structure, digestive enzyme activity and intestinal flora of largemouth bass reared under the same conditions were investigated from three perspectives to determine the causes of growth rate differentiation in juvenile largemouth bass.

2. Materials and Methods

2.1. Materials

Largemouth bass juveniles for the experiment were collected from a farm in Xifeng County (Guizhou, China). A circular pond with a diameter of 14 m was stocked with 20,000 juvenile bass with the following specifications: body length, 3.941 ± 0.236 mm; weight, 0.877 ± 0.052 g. After 92 days of breeding, the juvenile largemouth bass showed appropriate growth differentiation. The same puffed pellet feed was provided to all individuals during the breeding period (Zhuhai Hailong Biotechnology Co., Ltd., Zhuhai, China; crude protein ≥ 49%, crude fat ≥ 6%, crude fiber ≤ 3.5%). Water quality was monitored throughout the culture process and maintained within safe levels for largemouth bass.

2.2. Sample Collection

Fish were fasted for 24 h prior to sampling. Nine fish each were randomly selected from the fast- and slow-growing groups (FG and SG groups, respectively) for testing. The specifications of the FG group were as follows: body length, 138.506 ± 5.713 mm; weight, 60.416 ± 4.629 g. The specifications of the SG fish were as follows: body length, 80.950 ± 5.5404 mm; weight, 10.566 ± 1.879 g. Following the sampling under sterile conditions, the intestinal contents of three fish in each group were mixed as a sample in a 2 mL sterile centrifuge tube, immediately frozen with liquid nitrogen and stored at −80 °C for the determination of the intestinal flora. Three replicates were sampled for each group. The intestines of three fish in each group were divided into anterior, middle and posterior segments and fixed with 4% formaldehyde for morphological observation. The remaining intact intestine was placed in a 2 mL sterile centrifuge tube and stored in a freezer at −80 °C for the determination of digestive enzyme activity.

2.3. Intestinal Histological Analysis

The foregut, midgut, and hindgut were kept in formaldehyde solution for 24 h, washed, and transferred to 70% ethanol solution. Fixed samples were graded and dehydrated to 100% in various percentages of standard ethanol, cleared in xylene, embedded in paraffin, sectioned at 4 μm intervals, stained with hematoxylin-eosin, dehydrated and cleared and then sealed in neutral gum. The intestinal fold height, fold width, crypt depth and muscular thickness were measured according to the method of Guoxia Wang (2019) for counting goblet cells per fold.

2.4. Enzyme Activity Analysis

The intestinal tissues of each group of samples were weighed accurately, mixed proportionally with saline, homogenized mechanically in an ice water bath, and centrifuged (2500 rpm, 10 min). The supernatant was collected and assayed for lipase, amylase and trypsin activities using a commercial kit (Nanjing Jiancheng Biotechnology Co., Ltd., Nanjing, China).

2.5. Total DNA Extraction and Biological Analysis of Intestinal Flora

DNA was extracted from intestinal contents by a FastDNA® SPIN Kit (MP Biomedicals, Shanghai, China) and quantified by a NanoDrop NC2000 spectrophotometer (Thermo Fisher Scientific, Waltham, MA, USA) The quality of extracted DNA was detected by 1.2% agarose gel electrophoresis. The 16S rRNA gene V3-V4 primers F (3′-ACTCCTACGGGAGGCAGCA-5′) and R (3′-GGACTACHVGGGTWTCTAAT-5′) were applied. PCR amplification was performed on an ABI PCR instrument (Thermao Fisher Science, Shanghai, China). The PCR conditions were as follows:initial denaturation at 98 °C for 2 min; 30 cycles of denaturing at 98 °C for 15 s, annealing at 55 °C for 30 s, and extension at 72 °C for 30 s; a single extension at 72 °C for 5 min; and holding at 4 °C. The PCR mixtures contained 5× reaction buffer (5 μL), 5× GC buffer (5 μL), dNTPs (2.5 mM) (2 μL), forward primer (10 µM) (1 μL), reverse primer (10 µM) (1 μL), template DNA (10 ng), Q5 DNA Polymerase (0.25 μL) and enough ddH2O to reach a total volume of 25 μL.
High-throughput sequencing of 16S DNA was performed on the Illumina MiSeq platform (https://docs.qiime2.org/2019.4/tutorials/ accessed on 11 February 2022) by Chengdu Nomi Metabolic Biotechnology Co (Chengdu, China). The data analysis methods were as follows: the primer fragment of the QIIME cutadapt trim-pair excision sequence was used to discard unmatched sequences; DADA2 was then called via QIIME for quality control, denoising, splicing, and chimera removal. The sequences were clustered into operational taxonomic units (amplicon sequence variants, ASVs) with 100% similarity. After completing the denoising of all libraries, the ASV feature sequences were merged, and singleton ASVs were removed. The processed data were used for subsequent diversity analysis. Species annotations were performed on the basis of the Greengenes database using scikit-learn classification.

2.6. Data Collection and Statistical Analysis

In the intestinal histological analysis, the images were obtained by biological microscopy (Nexcope), and morphological analysis was performed by ImageView software. The digestive enzyme activity results were analyzed using SPSS 19.0 software (SPSS USA); p ≤ 0.05 indicated a significant difference, and p ≤ 0.01 indicated an extremely significant difference. Results are expressed as the mean ± standard error (SE). Figures were created by GraphPad Prism 8.0. In the intestinal flora analysis, alpha diversity metrics (Chao1, ACE, Shannon index, Simpson index and coverage) were calculated using QIIME2 software (2019.4). Beta diversity measures were calculated as described above. Other intestinal microbiota analyses were performed using R software (v3.2.0).

3. Results

3.1. Intestinal Histomorphology of Juvenile Largemouth Bass with Different Growth Rates

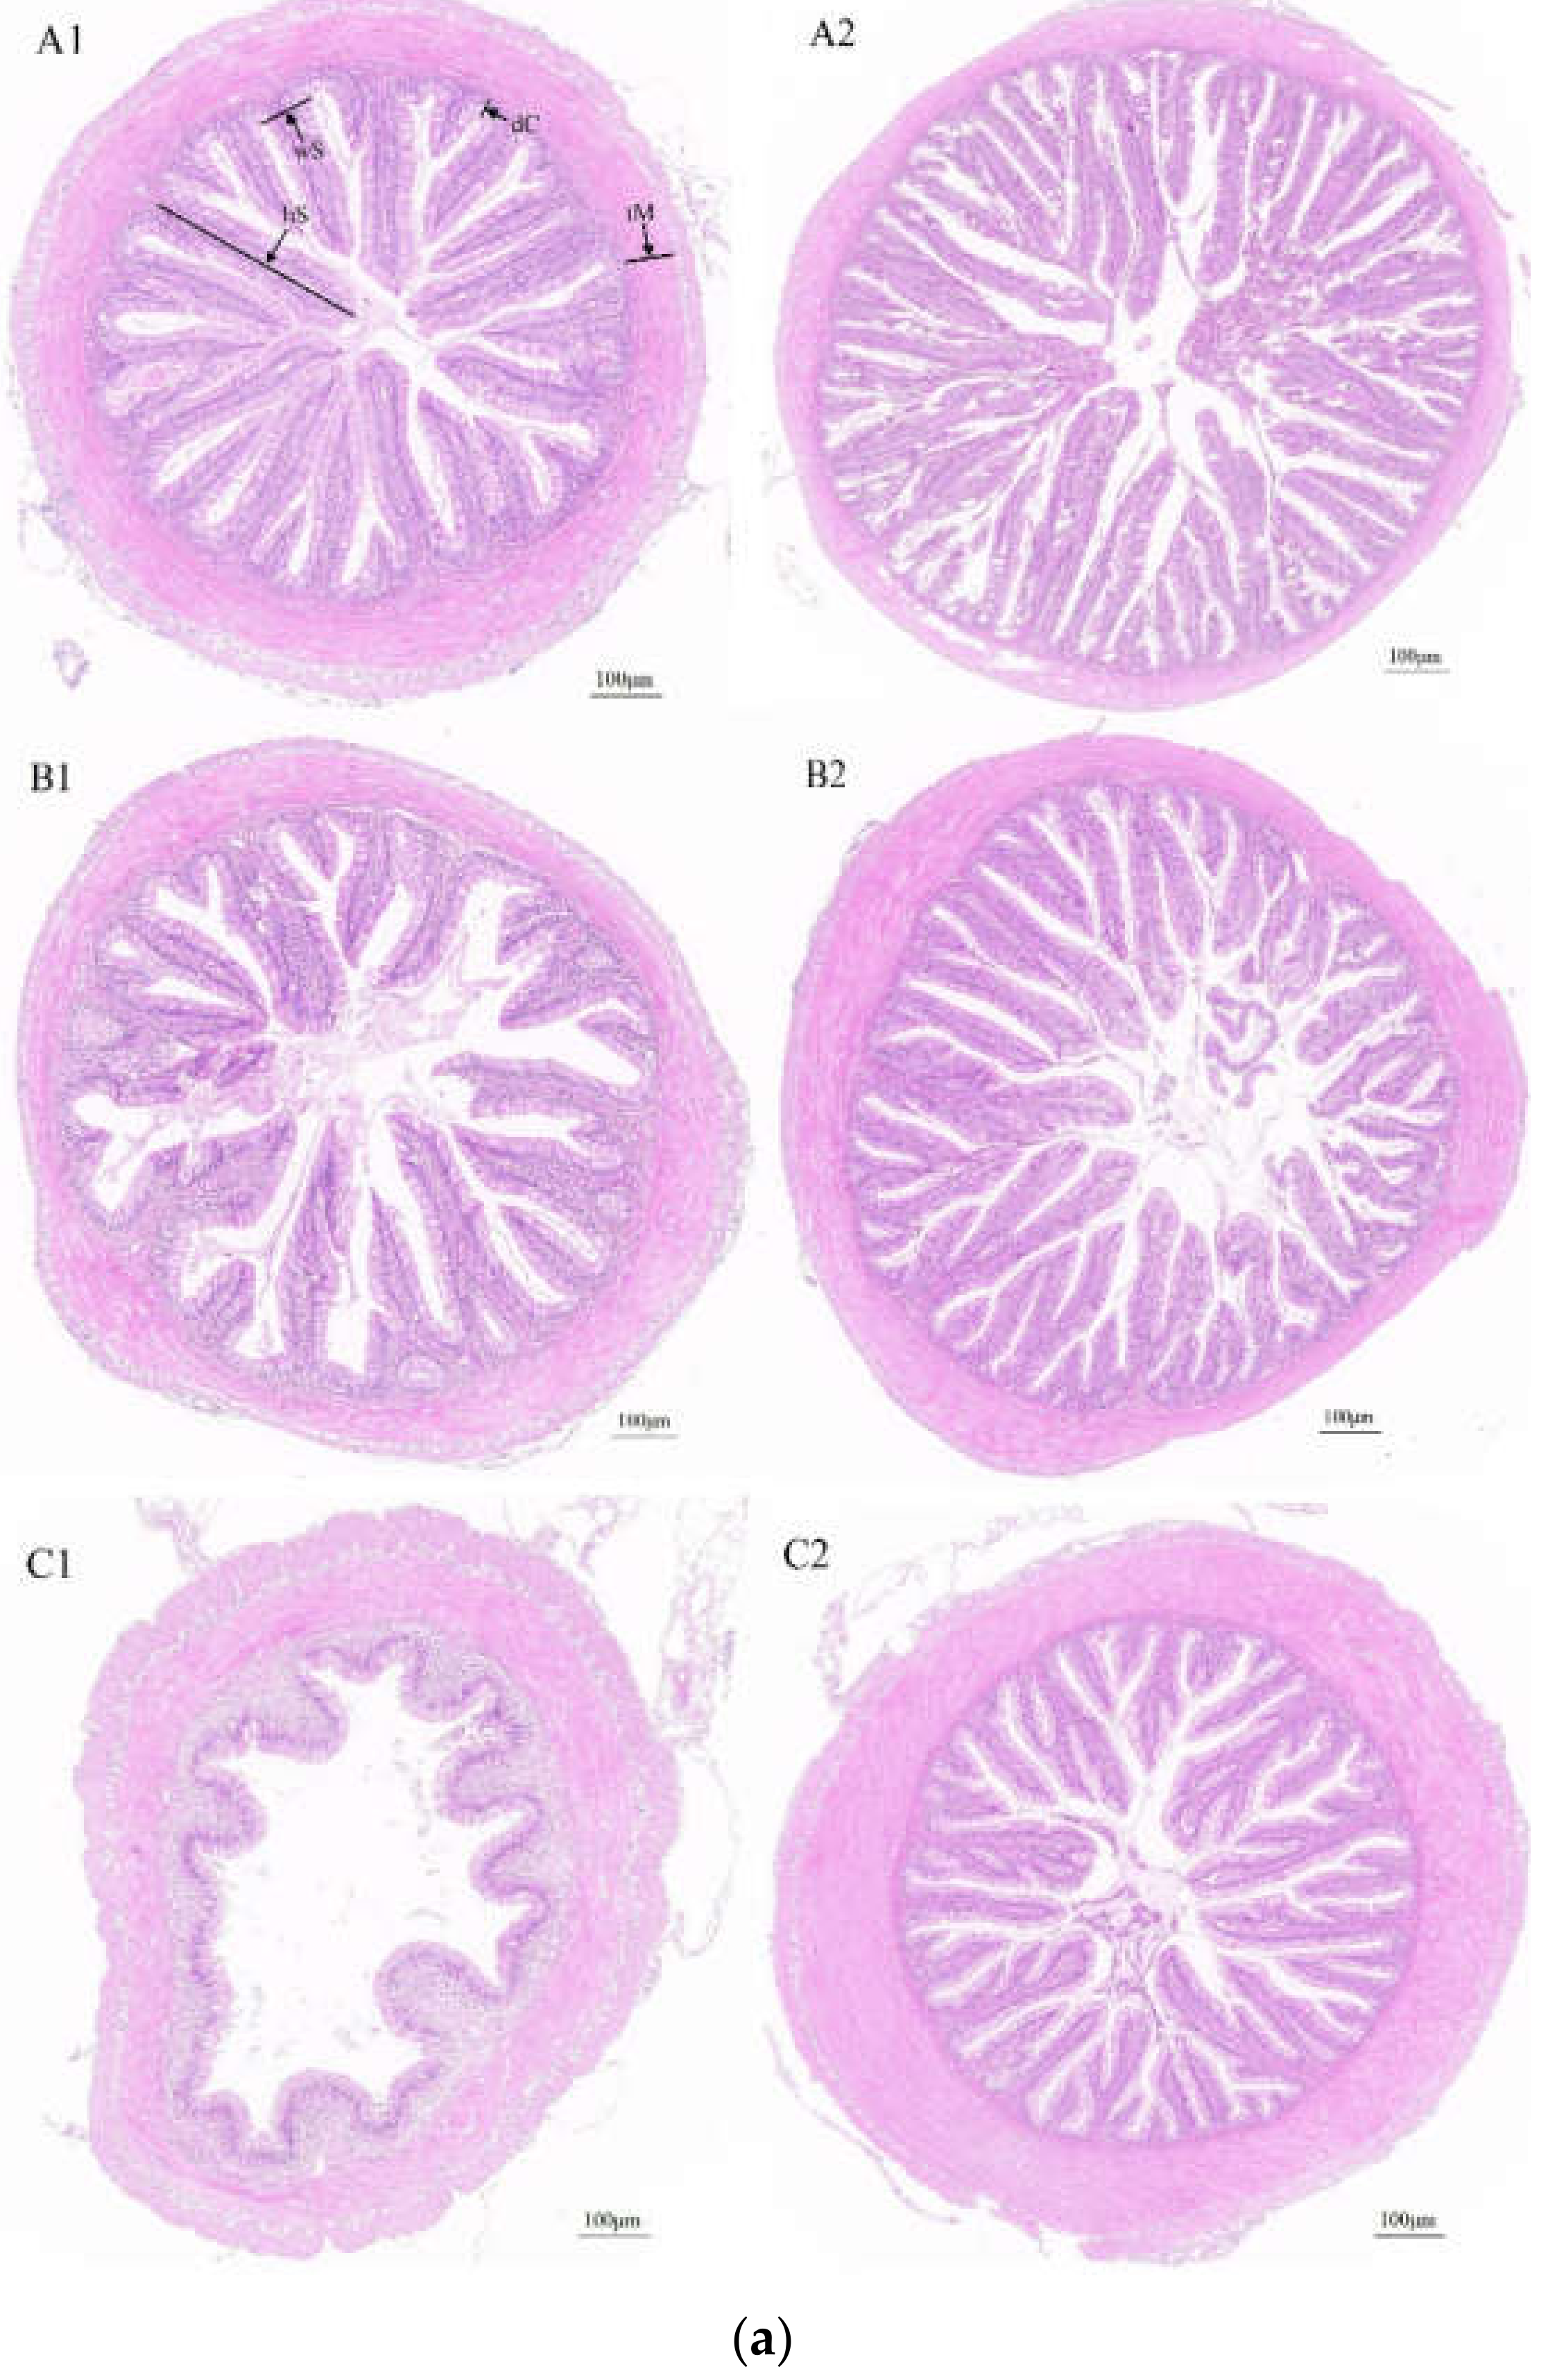
3.1.1. Morphological Characteristics of the Foregut, Midgut and Hindgut

The gut morphology of the FG and SG groups of juvenile largemouth bass is shown in Figure 1. Overall, the intestinal structure of juvenile largemouth bass in the FG and SG groups was relatively intact, with neat intestinal villi and smooth intestinal mucosa. In the foregut, the FG group had long, dense villi. By contrast, the SG group had sparse intestinal villi with shorter lengths.
In the FG group, the midgut villi were neatly arranged, dense, and intact, whereas in the SG group, the midgut villi were sparse and relatively short, with partial loss. The hindgut villi of the FG group were in good condition, complete, and more numerous and denser than those of the SG group, whereas the hindgut villi of the SG juveniles were sparse and very short.

3.1.2. Determination of Morphological Indexes of the Foregut, Midgut and Hindgut

The fold height, fold width, crypt depth, goblet cell number and muscular thickness of each part of the intestine were measured, and the results are shown in Table 1. In the foregut, the fold lengths of the FG group and the SG group were 711.945 ± 143.179 μm and 243.097 ± 32.021 μm, respectively, with an extremely significant difference (p ≤ 0.01). The fold widths of the FG group and SG group were 121.795 ± 30.937 μm and 88.822 ± 16.607 μm, with a significant difference (p ≤ 0.01). The crypt depths of the FG group and SG group were 24.501 ± 4.173 μm and 25.216 ± 1.489 μm, with a significant difference (p ≤ 0.01). The numbers of goblet cells in the FG group and SG group were 10.230 ± 2.888 cells/100 μm and 7.846 ± 1.461 cells/100 μm, respectively, and there was no significant difference between groups (p ≥ 0.05). The muscle thicknesses of the FG group and SG group were 104.589 ± 14.392 μm and 70.897 ± 2.624 μm, respectively, with a significant difference (p ≤ 0.01).
In the midgut, the fold lengths of FG group and SG group were 479.917 ± 123.664 μm and 262.311 ± 44.298 μm, respectively, with an extremely significant difference (p ≤ 0.01). The fold widths of the FG group and SG group were 95.035 ± 23.205 μm and 99.601 ± 24.127 μm, respectively, with no significant difference between groups (p ≥ 0.05). The crypt depths of the FG group and SG group were 23.976 ± 4.426 μm and 23.170 ± 4.491 μm, respectively, with no significant difference between groups (p ≥ 0.05). The numbers of goblet cells in the FG group and SG group were 8.481 ± 2.190 cells/100 μm and 7.851 ± 2.582 cells/100 μm, respectively, and there was no significant difference between groups (p ≥ 0.05). The muscle thicknesses of the FG group and SG group were 115.418 ± 42.527 μm and 66.581 ± 17.173 μm, respectively, with an extremely significant difference (p ≤ 0.01).
In the hindgut, the fold lengths of the FG group and SG group were 422.190 ± 87.901 μm and 166.811 ± 36.217 μm, respectively, with an extremely significant difference (p ≤ 0.01). The fold widths of the FG group and SG group were 93.080 ± 20.008 μm and 175.475 ± 16.175 μm, respectively, with an extremely significant difference (p ≤ 0.01). The crypt depths of the FG group and SG group were 25.139 ± 4.500 μm and 40.821 ± 5.996 μm, respectively, with an extremely significant difference (p ≤ 0.01). The numbers of goblet cells in the FG group and SG group were 10.166 ± 3.714 cells/100 μm and 13.222 ± 2.414 cells/100 μm, respectively, with an extremely significant difference (p ≤ 0.01). The muscle thicknesses of the FG group and SG group were 189.381 ± 43.220 μm and 101.991 ± 14.217 μm, respectively, with an extremely significant difference (p ≤ 0.01).

3.2. Intestinal Digestive Enzyme Activities of Juvenile Largemouth Bass with Different Growth Rates

The activities of amylase, lipase and trypsin were measured in the intestine of juvenile largemouth bass in the FG and SG groups, and the results are shown in Table 2. There were no significant differences in the activities of amylase and trypsin between the FG and SG groups, whereas the difference in lipase activity was highly significant, with 13.369 ± 0.224 U·g−1 lipase activity in the FG group and 9.756 ± 0.122 U·g−1 lipase activity in the SG group.

3.3. Intestinal Microfloral Structure of Largemouth Bass with Different Growth Rates

3.3.1. Sequence Characteristics of the Intestinal Flora

Illumina MiSeq 16S rRNA sequencing identified a total of 1142 operational taxonomic units (ASVs) in 29 phyla, 86 classes, 158 orders, 287 families, and 582 genera of bacteria. The ASVs of different groups of intestinal flora were combined and analyzed for common and unique ASVs, with 1676 ASVs detected in the FG group and 1892 ASVs detected in the SG group, for a total of 409 ASVs. The intestinal flora statuses of the FG and SG groups of largemouth bass are shown in Figure 2.
Coverage was used to estimate the completeness of sequencing in the alpha diversity analysis. The community coverage for each sample exceeded 99.93%, indicating that the probability of a collection sample not being sequenced was low. The coverage, Shannon index, Simpson index and Chao1 values for each sample from both groups of fish are shown in Figure 3 and were not significantly different between groups (p ≥ 0.05).
Principal coordinate analysis (PCoA) based on Bray-Curtis dissimilarity was used for beta diversity analysis to detect relationships between microorganisms in different samples. The results showed that the intestinal floras of FG largemouth bass juveniles and SG largemouth bass juveniles were different (Figure 3b). The first principal component (PC1, x axis) and the second principal component (PC2, y axis) explained 43.30% and 24.80% of the variation, respectively, indicating that there were differences between the FG and SG groups, but according to the permutational analysis of variance (PERMANOVA) results, this difference was not significant (p = 0.104).

3.3.2. Assessment of Intestinal Floral Differences

The composition of the intestinal flora at the phylum level in the FG and SG groups is shown in Figure 4a. The dominant phyla in the FG and SG groups were Proteobacteria (48.781% vs. 43.929%, respectively) and Firmicutes (19.754% vs. 20.560%, respectively). The abundance of Fusobacteria in the SG group (12.433%) was significantly higher than that in the FG group. The relative abundance of Actinobacteria (9.079%) in the FG group was significantly higher than that in the SG group.
The composition of the intestinal flora in the FG and SG groups at the genus level is shown in Figure 4b. The dominant bacteria of largemouth bass in the FG group were Halomonas (14.182%) and unclassified Enterobacteriaceae (11.405%). The dominant bacteria in the SG group were unclassified Enterobacteriaceae (16.649%) and Clostridium (12.277%).
We used linear discriminant analysis (LDA) to analyze differences in the gut floral taxa of juvenile largemouth bass in the FG and SG groups (Figure 5). The FG and SG groups were enriched with 77 and 52 bacterial taxa, respectively. Specifically, the FG group included 1 phylum, 5 classes, 9 orders, 23 families and 39 genera, with 10 bacterial taxa showing LDA scores >4. At the phylum and genus levels, the taxa included Actinobacteria, Halomonas and Bifidobacterium. The SG group included 3 phyla, 5 classes, 15 orders, 23 families and 15 genera, with 5 bacterial taxa showing LDA scores > 4, including Fusobacteria and Cetobacterium.

4. Discussion

4.1. Distinct Gut Characteristics of the Fast-Growing Group of Largemouth Bass

In our study, the fold length and muscle thickness of the FG group were significantly greater than those of the SG group in the foregut, midgut and hindgut. Increases in the length and width of the villi expand the absorption area, allowing for better absorption and utilization of nutrients, which in turn promotes fish growth [17]. The thickening of the muscular layer of the intestine accelerates peristalsis and thus enhances intestinal absorption. Li Yingying et al.’s study on the intestine of rhubarb fish with different growth rates showed that the intestinal muscle layer was thicker in the FG group than in the FG group [18]. This result is consistent with the results of our study. In studies of oysters (Ostrea gigas Thunb.), faster-growing oysters had faster feeding and absorption rates than slower-growing oysters [19], and the same results were obtained in a study of mussels (Mytilus edulis) [20]. In studies of juvenile redhead cichlids, those with better growth performance (Vieja melanura) also had greater gut fold heights [21]. Fold height and crypt depth reflect the digestive and absorptive capacities of the small intestine and the maturation rate of epithelial cells, respectively. The fold length/crypt depth ratio reflects the state of digestive and absorptive function of the intestine [22]. The fold length and crypt depth of the FG group were greater than those of the SG group, and the fold length/crypt depth ratio of the FG group was significantly greater than that of the SG group, indicating that the digestive absorption capacity of the FG group was significantly stronger than that of the SG group. The variation in intestinal morphology revealed a difference in intestinal structure between the FG group and FG group, with juvenile fish in the FG group having greater digestive and absorptive capacities. Therefore, the intestinal structural characteristics of largemouth bass juveniles in the FG group reveal that these juveniles have stronger digestion and absorption abilities, which is an important reason for their faster growth.
The digestive capacity of the fish gut can be demonstrated not only by tissue status but also by digestive enzyme activity. Largemouth bass juveniles in the FG group had higher digestive enzyme activities, which improved their ability to digest and absorb lipids and promoted lipid metabolism. This may be another reason for the rapid growth of these largemouth basses.

4.2. Differences in Intestinal Floral Levels between the FG Group and SG Group

The fish intestinal flora play an important role in aspects of fish growth, including nutrition, development, immunity and resistance to invasive pathogens [23]. Studies on the intestinal flora of largemouth bass juveniles showed that specific groups can be used to characterize the growth rate. Such groups associated with the FG group appear to be associated with disease-resistance immunity.
At the phylum level, the dominant microbes in the FG and SG groups were Proteobacteria and Firmicutes. In the fish digestive tract, Proteobacteria, Bacteroidetes, Actinobacteria, Fusobacteria and Fusobacterium are generally considered to be the dominant phyla [24]. Proteobacteria are Gram-negative bacteria that help maintain homeostasis in the anaerobic environment of the gut [25,26]. Firmicutes have been shown to participate in fermentation and regulate the absorption of intestinal dietary fats [27].
Notably, the relative abundance of Actinobacteria was significantly higher in the FG group than in the SG group. In general, Actinobacteria, as Gram-positive bacteria, can be used for the production of secondary metabolites, including probiotics and antibiotics, capable of inhibiting pathogenic activity [28,29]. A study of golden pomfret (Trachinotus ovatus) by X Tan et al., showed that the addition of dandelion extract to feed increased the abundance of actinomycetes in the fish intestine, thereby improving the immunity of the fish [30]. In the juvenile largemouth bass studied here, the FG group had more Actinobacteria in their gut than the SG group, indicating that the FG group of juvenile largemouth bass was more resistant to disease than the SG group. In addition, the relative abundance of Fusobacterium was significantly lower in the FG group than in the SG group. The presence of large numbers of Fusobacteria may contribute to colon cancer and is detrimental to the intestinal development of slow-growing individuals [31,32]. The FG group of juvenile largemouth bass had more immune-related flora, which may lead to faster growth.

4.3. Differences in Intestinal Flora at the Genus Level between the FG and SG Groups

At the genus level, the dominant flora in the gut of juvenile largemouth bass differed between the FG and SG groups. The relative abundances of Halomonas and Bifidobacterium were significantly higher in the FG group than in the SG group. Halomonas is a common intestinal bacterium that plays an important role in enhancing host immune activity and disease resistance [33]. Bifidobacterium is considered to be beneficialto the host [34]. Itami et al. [35] found that peptidoglycan production by Bifidobacterium thermophilum enhanced disease resistance in Japanese shrimp (kuruma shrimp). We speculated that the growth difference of largemouth bass juveniles may be due to the high abundance of bacteria related to disease resistance in the intestinal flora in the FG group, which confers higher immunity and is more conducive to growth.
Surprisingly, the relative abundance of Cetobacterium was also significantly higher in the gut of the SG group of juvenile fish. Cetobacterium can ferment carbohydrates, producing vitamin B12 for absorption and use by the host [36]. However, in a study of marbled eels (Anguilla marmorata), the opposite result was obtained [37]. The reason for this discrepancy may be that the breeding environment at the sampling site of this study was suitable for the growth of largemouth bass, with an increase in probiotics such as Cetobacterium in the intestinal tract. However, the relatively high abundance of Cetobacterium in the SG group remains to be further explored.

5. Conclusions

Studies on the morphological structure, digestive enzyme activity and intestinal flora of fast- and slow-growing juvenile largemouth bass have shown that rapid growth is closely related to the following factors. Intestinal fold length and muscle thickness in the fast-growing group were significantly greater than those in the slow-growing group. The lipase activity in juvenile fish of the fast-growing group was higher than that in the slow-growing group. In the fast-growing group, the intestinal tract and disease-resistance immune-related bacteria (Actinobacteria, Halomonas and Bifidobacterium) accounted for a large proportion of the total microbial taxa.

Author Contributions

Experiment design, D.J.; samples collection, validation, M.Y.; software formal analysis, Y.Z.; writing—original draft preparation, X.S.; writing—review and editing, J.Y. All authors have read and agreed to the published version of the manuscript.

Funding

This research was funded by Guizhou Association for Science and Technology project(Z2021295).

Institutional Review Board Statement

The animal study protocol was approved by the Experimental Animal Ethics Committee of Guizhou University (protocol code EAE-GZU-2021-PO11 and date of approval 10 October 2021).

Data Availability Statement

The data used to produce the results in this paper can be provided to the corresponding authors if necessary.

Acknowledgments

The authors sincerely thank Hu Lixia and Meng Qingmi for their help with sampling. The authors thank all the editors and reviewers for providing constructive comments on the present work.

Conflicts of Interest

This manuscript is an original submission that has not been published before and is not currently under review at any other publication outlet. No conflicts of interest exist in the submission of this manuscript, and the manuscript has been approved by all authors for publication.

References

  1. Adamek, D.; Rzepkowska, M.; Panagiotopoulou, H.; Ostaszewska, T.; Kolman, R. Morphological Differences of White Muscle Fibers and Genetic Diversity of Fast and Slow Growing Atlantic Sturgeons (Acipenser oxyrinchus). Turk. J. Fish. Aquat. Sci. 2017, 17, 959–966. [Google Scholar] [CrossRef]
  2. Mun, S.H.; You, J.H.; Oh, H.J.; Lee, C.H.; Baek, H.J.; Lee, Y.D.; Kwon, J.Y. Expression Patterns of Growth Related Genes in Juvenile Red Spotted Grouper (Epinephelus akaara) with Different Growth Performance after Size Grading. Dev. Reprod. 2019, 23, 35–42. [Google Scholar] [CrossRef] [PubMed]
  3. Alm, G. Connection between Maturity, Size and Age in Fishes; Institute of Freshwater Research Report; Institute of Freshwater Research: Stockholm, Sweden, 1959. [Google Scholar]
  4. Tamayo, D.; Ibarrola, I.; Urrutia, M.B.; Navarro, E. The Physiological Basis for Inter-Individual Growth Variability in the Spat of Clams (Ruditapes philippinarum). Aquaculture 2011, 321, 113–120. [Google Scholar] [CrossRef]
  5. Valente, L.M.P.; Moutou, K.A.; Conceicao, L.E.C. What Determines Growth Potential and Juvenile Quality of Farmed Fish Species? Rev. Aquac. 2013, 5, S168–S193. [Google Scholar] [CrossRef] [Green Version]
  6. Xie, F.; Ai, Q.; Mai, K.; Wei, X.; Ma, H. The Optimal Feeding Frequency of Large Yellow Croaker (Pseudosciaena Crocea, Richardson) Larvae. Aquaculture 2011, 311, 162–167. [Google Scholar] [CrossRef]
  7. Wang, C.L.; Wang, X.D.; Xiao, S.S.; Bu, X.Y.; Chen, L.Q. T-2 Toxin in the Diet Suppresses Growth and Induces Immunotoxicity in Juvenile Chinese Mitten Crab (Eriocheir sinensis). Fish Shellfish Immunol. 2019, 97, 593–601. [Google Scholar] [CrossRef] [PubMed]
  8. Escaffre, A.M.; Kaushik, S.; Mambrini, M. Morphometric Evaluation of Changes in the Digestive Tract of Rainbow Trout (Oncorhynchus mykiss) due to Fish Meal Replacement with Soy Protein Concentrate. Aquaculture 2007, 273, 127–138. [Google Scholar] [CrossRef]
  9. Noaillac-Depeyre, J.; Gas, N. Structure and Function of the Intestinal Epithelial Cells in the Perch (Perca Fluviatillis L.). Anat. Rec. 1979, 195, 621–627. [Google Scholar] [CrossRef]
  10. Kashinskaya, E.N.; Suhanova, E.V.; Solov’Ev, M.M.; Izvekova, G.I.; Glupov, V.V. Diversity of Microbial Communities of the Intestinal Mucosa and Intestinal Contents of Fish from Lake Chany (Western Siberia). Inland Water Biol. 2014, 7, 172–177. [Google Scholar] [CrossRef]
  11. Comabella, Y.; Mendoza, R.; Aguilera, C.; Carrillo, O.; Hurtado, A.; García-Galano, T. Digestive Enzyme Activity During Early Larval Development of the Cuban Gar Atractosteus tristoechus. Fish Physiol. Biochem. 2006, 32, 147–157. [Google Scholar] [CrossRef]
  12. Kolkovski, S.; Tandler, A.; Kissil, G.W.; Gertler, A. The Effect of Dietary Exogenous Digestive Enzymes on Ingestion, Assimilation, Growth and Survival of Gilthead Seabream (Sparus Aurata, Sparidae, Linnaeus) Larvae. Fish Physiol. Biochem. 1993, 12, 203–209. [Google Scholar] [CrossRef]
  13. Du, Z.-Y.; Liu, Y.-J.; Tian, L.-X.; Wang, J.-T.; Wang, Y.; Liang, G.-Y. Effect of Dietary Lipid Level on Growth, Feed Utilization and Body Composition by Juvenile Grass Carp (Ctenopharyngodon idella). Aquac. Nutr. 2005, 11, 139–146. [Google Scholar] [CrossRef]
  14. Pei, Z.; Xie, S.; Lei, W.; Zhu, X.; Yang, Y.; Pei, Z.; Xie, S.; Lei, W.; Zhu, X.; Yang, Y. Comparative Study on the Effect of Dietary Lipid Level on Growth and Feed Utilization for Gibel Carp (Carassius auratus gibelio) and Chinese Longsnout Catfish (Leiocassis longirostris Gunther). Aquac. Nutr. 2015, 10, 209–216. [Google Scholar] [CrossRef]
  15. Chapagain, P.; Arivett, B.; Cleveland, B.M.; Walker, D.M.; Salem, M. Analysis of the Fecal Microbiota of Fast- and Slow-Growing Rainbow Trout (Oncorhynchus mykiss). BMC Genom. 2019, 20, 788. [Google Scholar] [CrossRef]
  16. Shi, Y.; Ma, D.Y.; Wei, Z.S. Revealing the Difference of Intestinal Microbiota Composition of Cultured European Eels (Anguilla anguilla) with Different Growth Rates. Isr. J. Aquac. 2020, 72, 4–12. [Google Scholar] [CrossRef]
  17. Guan, F.; Shen, L.; Zhou, X.; Chen, Z.; Yu, C.; Zhang, J.; Yuan, Y. Effects of Underwater and Semi-Aquatic Environments on Gut Tissue and Microbiota of the Mudskipper Boleophthalmus Pectinirostris. J. Comp. Physiol. B 2021, 191, 741–753. [Google Scholar] [CrossRef]
  18. Li, Y.Y.; Chen, X.; Li, S.Y.; Li, P.; Li, Y.H.; Song, T.Y. Influence of factors related to the intestinal digestion and absorption on growth of cultured large yellow croaker Pseudosciaena crocea. J. Dalian Ocean. Univ. 2015, 30, 5. [Google Scholar]
  19. Bayne, B.L. Physiological Components of Growth Differences between Individual Oysters (Crassostrea gigas) and a Comparison with Saccostrea Commercialis. Physiol. Biochem. Zool. 1999, 72, 705–713. [Google Scholar] [CrossRef]
  20. Ibarrola, I.; Hilton, Z.; Ragg, N. Physiological Basis of Inter-Population, Inter-Familiar and Intra-Familiar Differences in Growth Rate in the Green-Lipped Mussel Perna Canaliculus. Aquaculture 2017, 479, 544–555. [Google Scholar] [CrossRef]
  21. Adamek-Urbańska, D.; Kasprzak, R.; Tyszkiewicz, M.; Fisher, K.; Dbrowski, K. Negative Effects of Artificial Diets on Growth and the Digestive Tract of 1-month-old Redhead Cichlid (Vieja melanura, Günther, 1862). Aquac. Res. 2021, 52, 4890–4896. [Google Scholar] [CrossRef]
  22. Goodlad, R.A.; Ratcliffe, B.; Lee, C.Y.; Wright, N.A. Dietary Fibre and the Gastrointestinal Tract: Differing Trophic Effects on Muscle and Mucosa of the Stomach, Small Intestine and Colon. Eur. J. Clin. Nutr. 1995, 49 (Suppl. S3), S178–S181. [Google Scholar] [PubMed]
  23. Austin, B. The Bacterial Microflora of Fish. Sci. World J. 2014, 2, 558–572. [Google Scholar] [CrossRef] [Green Version]
  24. Wang, A.R.; Ran, C.; Ringø, E.; Zhou, Z.G. Progress in Fish Gastrointestinal Microbiota Research. Rev. Aquac. 2018, 10, 1753–5123. [Google Scholar] [CrossRef] [Green Version]
  25. Moon, C.D.; Wayne, Y.; Maclean, P.H.; Cookson, A.L.; Bermingham, E.N. Metagenomic Insights into the Roles of Proteobacteria in the Gastrointestinal Microbiomes of Healthy Dogs and Cats. MicrobiologyOpen 2018, 7, e00677. [Google Scholar] [CrossRef] [PubMed] [Green Version]
  26. Bereded, N.K.; Abebe, G.B.; Fanta, S.W.; Curto, M.; Domig, K.J. The Impact of Sampling Season and Catching Site (Wild and Aquaculture) on Gut Microbiota Composition and Diversity of Nile Tilapia (Oreochromis niloticus). Biology 2021, 10, 180. [Google Scholar] [CrossRef]
  27. Semova, I.; Carten, J.; Stombaugh, J.; Mackey, L.; Knight, R.; Farber, S.; Rawls, J.F. Microbiota Regulate Intestinal Absorption and Metabolism of Fatty Acids in the Zebrafish. Cell Host Microbe 2012, 12, 277–288. [Google Scholar] [CrossRef] [PubMed] [Green Version]
  28. Anandan, R.; Dhanasekaran, D.; Manogaran, G.P. An Introduction to Actinobacteria. In Actinobacteria—Basics and Biotechnological Applications; IntechOpen: London, UK, 2016; pp. 4–37. [Google Scholar]
  29. Fan, L.; Li, Q.X. Characteristics of Intestinal Microbiota in the Pacific White Shrimp Litopenaeus vannamei Differing Growth Performances in the Marine Cultured Environment. Aquaculture 2019, 50, 450–461. [Google Scholar] [CrossRef]
  30. Tan, X.; Sun, Z. Dietary Dandelion Extract Improved Growth Performance, Immunity, Intestinal Morphology and Microbiota Composition of Golden Pompano Trachinotus ovatus. Aquac. Rep. 2020, 18, 100491. [Google Scholar] [CrossRef]
  31. Kostic, A.D.; Gevers, D.; Pedamallu, C.S.; Michaud, M.; Meyerson, M. Genomic Analysis Identifies Association of Fusobacterium with Colorectal Carcinoma. Genome Res. 2012, 22, 292–298. [Google Scholar] [CrossRef] [Green Version]
  32. Bachrach, G.; Ianculovici, C.; Naor, R.; Weiss, E.I. Fluorescence Based Measurements of Fusobacterium Nucleatum Coaggregation and of Fusobacterial Attachment to Mammalian Cells. FEMS Microbiol. Lett. 2010, 248, 235–240. [Google Scholar] [CrossRef] [Green Version]
  33. Li, Y.D.; Zhou, F.L.; Tang, Y.P.; Huang, J.H.; Jiang, S.G. Variation in Bacterial Communities among Stress: Ensitive and Stress-Tolerant Black Tiger Shrimp (Penaeus monodon) Individuals. Aquac. Res. 2020, 52, 2146–2159. [Google Scholar] [CrossRef]
  34. Didier, R. Probiotics and Obesity: A Link? Nat. Rev. Microbiol. 2009, 7, 616. [Google Scholar]
  35. Itami, T.; Asano, M.; Tokushige, K.; Kubono, K.; Nakagawa, A.; Takeno, N.; Nishimura, H.; Maeda, M.; Kondo, M.; Takahashi, Y. Enhancement of Disease Resistance of Kuruma Shrimp, Penaeus Japonicus, after Oral Administration of Peptidoglycan Derived from Bifidobacterium Thermophilum. Aquaculture 1998, 164, 277–288. [Google Scholar] [CrossRef]
  36. Hsu, H.-Y.; Chang, F.-C.; Wang, Y.-B.; Chen, S.-H.; Lin, Y.-P.; Chung, Y.-L.; Han, Y.-S. Revealing the Compositions of the Intestinal Microbiota of Three Anguillid Eel Species Using 16S rDNA Sequencing. Aquac. Res. 2018, 49, 2404–2415. [Google Scholar] [CrossRef]
  37. Mao, L.; Zeng, C.X.; Jia, X.Q.; Zhai, S.W.; Li, Z.Q.; Ma, Y. The Composition and Structure of the Intestinal Microflora of Anguilla Marmorata at Different Growth Rates: A Deep Sequencing Study. J. Appl. Bacteriol. 2018, 126, 1340–1352. [Google Scholar]
Figure 1. (a) HE-stained sections of intestinal tissues of juvenile largemouth bass from the fast-growing (FG) and slow-growing (SG) groups (100×). (b) HE-stained sections of intestinal tissues of juvenile largemouth bass from the fast-growing (FG) and slow-growing (SG) groups (400×). Note: A1 represents the foregut of the slow-growing group (100×); A2 represents the foregut of the fast-growing group (100×); B1 represents the midgut of the slow-growing group (100×); B2 represents the midgut of the fast-growing group. C1 represents the hindgut of the slow-growing group (100×); C2 represents the hindgut of the fast-growing group (100×); A4 represents the foregut of the slow-growing group (400×); A8 represents the foregut of the fast-growing group (400×); B4 represents the midgut of the fast-growing group (400×); B8 represents the midgut of the fast-growing group (400×); C4 represents the hindgut of the slow-growing group (100×); C8 represents the hindgut of the fast-growing group (100×); FL: Fold length; FW: Fold width; CD: Crypt depth; GC: Goblet cell; MT: Muscle thickness.
Fishes 07 00065 g001aFishes 07 00065 g001b
Figure 2. Venn diagram of the intestinal flora of the slow-growing (SG) and fast-growing (FG) groups of juvenile largemouth bass.
Fishes 07 00065 g002
Figure 3. (a) Alpha diversity of the gut bacterial communities of the fast-growing (FG) and slow-growing (SG) groups of juvenile fish; (b) Bray–Curtis dissimilarity-based principal coordinate analysis (PCoA).
Fishes 07 00065 g003
Figure 4. (a) Plots of the relative abundance of gut bacteria at the phylum level in the FG and SG groups of juvenile largemouth bass; (b) plots of the relative abundance of gut bacteria at the genus level in the FG and SG groups of juvenile largemouth bass.
Fishes 07 00065 g004aFishes 07 00065 g004b
Figure 5. (a) Linear discriminant analysis effect size (LEfSe) results showing differences in the gut flora between the fast-growing (FG) and slow-growing (SG) groups of juvenile largemouth bass; (b) LDA score > 4, p ≤ 0.05.
Fishes 07 00065 g005aFishes 07 00065 g005b
Table 1. Measurement of intestinal parameters of juvenile largemouth bass with different growth rates.
GroupFold Length/μmFold Width/μmCrypt Depth/μmGoblet Cell Number/Cells/100 μmMuscle Thickness/μm
Foregut (SG)243.097 ± 32.021 A88.822 ± 16.607 A25.216 ± 1.4897.846 ± 1.461 A70.897 ± 2.624 A
Foregut (FG)711.945 ± 143.179 B121.795 ± 30.937 B24.501 ± 4.17310.230 ± 2.888 B104.589 ± 14.392 B
Midgut (SG)262.311 ± 44.298 A99.601 ± 24.12723.170 ± 4.4917.851 ± 2.58266.581 ± 17.173 A
Midgut (FG)479.917 ± 123.664 B95.035 ± 23.20523.976 ± 4.4268.481 ± 2.190115.418 ± 42.527 B
Hindgut (SG)166.811 ± 36.217 A175.475 ± 16.175 A40.821 ± 5.996 A10.166 ± 3.714 A101.991 ± 14.217 A
Hindgut (FG)422.190 ± 87.901 B93.080 ± 20.008 B25.139 ± 4.500 B13.222 ± 2.414 B189.381 ± 43.220 B
Different letters> “A”and “B” indicate significant differences between groups (p ≤ 0.01).
Table 2. Digestive enzyme activities of largemouth bass with different growth rates.
GroupAmylase Activity/(U·g−1)Lipase Activity/(U·g−1)Trypsin Activity/(U·g−1)
Slow-growing group (SG) 0.289 ± 0.0059.756 ± 0.122 A2487.939 ± 325.567
Fast-growing (FG)0.287 ± 0.01113.369 ± 0.224 B2849.089 ± 137.591
Different letters indicate significant differences between groups (p ≤ 0.01).
Publisher’s Note: MDPI stays neutral with regard to jurisdictional claims in published maps and institutional affiliations.

