Article

Comparative Analysis of Blood Transcriptome in the Yangtze Finless Porpoise (Neophocaena asiaeorientalis)

Scientific Observing and Experimental Station of Fishery Resources and Environment in the Lower Reaches of the Changjiang River, Ministry of Agriculture and Rural Affairs, Freshwater Fisheries Research Center, CAFS, Wuxi 214081, China
*
Authors to whom correspondence should be addressed.
Fishes 2022, 7(2), 61; https://doi.org/10.3390/fishes7020061
Submission received: 25 January 2022 / Revised: 2 March 2022 / Accepted: 3 March 2022 / Published: 10 March 2022
(This article belongs to the Section Genetics and Biotechnology)

Abstract

:
The Yangtze finless porpoise (Neophocaena asiaeorientalis) is the sole freshwater subspecies of Neophocaena phocaenoides, and there is a lack of data on its transcriptome. In this study, we applied RNA-seq technology to assemble, de novo, a transcriptome and analyzed differential expressed genes (DEGs). About 6 Gb of clean data was generated for the Yangtze finless porpoise blood (n = 6) through de novo sequencing. In total, 151,211 unigenes were generated and a total of 119,039 of these unigenes (78.72%) were functionally annotated when searched for within the NCBI Nr, SwissProt, GO, COG, and KEGG databases. Diverse and extensive expressed gene catalogs were sampled for the Yangtze finless porpoise. DESeq2 was used to analyze the differential expression genes (DEGs) obtained from the assembled transcriptome. The results indicated that DEGs have close relationships with the Yangtze finless porpoise’s development, evolution and adaptation. Further, we found that genes involved in cetacean TAG synthesis might directly explain the molecular basis of cetacean blubber thickening. These transcriptome data will assist in understanding molecular mechanisms of Yangtze finless porpoise adaptation.

Graphical Abstract

1. Introduction

The Yangtze finless porpoise (Neophocaena asiaeorientalis) is the sole freshwater subspecies of Neophocaena phocaenoides, is listed as a critically endangered species in the IUCN Red List of Threatened Species [1] and now has been shown to be a unique incipient species [2]. Its population size has decreased remarkably because of water development projects, water pollution, overfishing and accidental deaths during the last several decades [3,4,5,6]. It was estimated that the remaining population was approximately 1200 in 2006, decreasing at a rate about 5% per year [4]. Survey results also indicated that the distribution is becoming more and more fragmented [5]. The disconnection between lakes and the Yangtze River has directly impacted the ecosystem functions related to Yangtze finless porpoise habitats [7]. Ultimately, a plan for Yangtze finless porpoise conservation was approved by the Chinese government and developed by scientists from the Institute of Hydrobiology (CAS) [8,9]. Captive breeding programs have served as a valuable and effective protection method and provide vital help for the conservation of this species [9]. For captive animals to breed successfully in an ex situ conservation area, however, their ecological adaptive mechanisms must be fully understood.
Recent surveys indicated that there is an existing imbalance in the sex ratio between male and female Yangtze finless porpoises. From 1993 to 2004, survey results showed that the mature female–male sex ratio was 0.86:1, while the puberty female–male sex ratio was 0.33:1. This indicated that there was a decrease in the female birth rate, which may be one of reasons for the Yangtze finless porpoise’s remarkable decline [5,9]. Further, mitochondrial control region sequencing analysis showed that Yangtze finless porpoise populations had a low genetic diversity in three Chinese waters [10]. Blood contains and can produce informative biological markers that are reflective of the environment that the animal lives in [11]. Animal adaptation processes are highly organized and complex. Functional genes are expressed in orderly patterns during different times of the adaptation processes. These functional gene expression patterns are determined by both extrinsic cues and intrinsic genetically programmed blood cells [12]. The temporal regulation of gene expression in blood, as in all tissues, is thus important to ensure biological adaptation at the transcriptional and translational levels [11].
Serving as one of the most effective strategies for understanding gene function, transcriptome sequencing can yield information on the expression of critical genes in a selected tissue of interest [13]. Despite recent advances in genomic data resources, the Yangtze finless porpoise lacks any existing genomic data [14]. As such, in this study, we performed de novo sequencing for the transcriptomic analysis of the blood of the Yangtze finless porpoise, N. asiaeorientalis. Our results provide comprehensive transcriptomic data, and we identified different gene expression patterns and signaling pathways among the sampled individuals. This could increase our knowledge of biological adaptation for the Yangtze finless porpoise.

2. Materials and Methods

2.1. Blood Sampling

From September to December in 2017, as part of the Yangtze finless porpoise ex situ conservation and research projects conducted by the Freshwater Fisheries Research Center, Chinese Academy of Fishery Sciences (FFRC, CAFS), healthy finless porpoise blood was sampled after health and routine examination in the river in west Anqing. Three male and three female individuals (n = 6) were identified using the microsatellite DNA technology for parentage identification (unpublished data). The subjects constituted, specifically: Male 1, 5 years old; Male 2, 2 years old; Male 3, 2 years old; Female 1, 4 years old; Female 2, 2 years old; Female 3, 5 years old. The females were not pregnant according to the routine ultrasonic test. There were restrained gently, and 5 mL blood was collected from the central caudal vein using a 10 mL vacuum blood collector. The sampled whole blood was immediately placed in liquid nitrogen and transferred to the laboratory at −80 °C for later use. After sampling, animals were released in the river section in west Anqing. All experimental procedures were authorized by the Yangtze River Fisheries Resource Communities.

2.2. RNA Extraction and Transcriptomesequencing

Total RNA from each of the sampled finless porpoises was extracted with Trizol reagent (Invitrogen, Shanghai, China). The isolated RNA was then purified using the RNeasy Animal Mini Kit (Qiagen, Shanghai, China). Total RNA quality was assessed using an Agilent 2100 Bioanalyzer (Agilent Technologies, Santa Clara, CA, USA). RNA with high quality (28S/18S ratio > 1.0, RNA Integrity Number (RIN) > 7.2) from each individual was used to construct independent cDNA libraries (Illumina, San Diego, CA, USA). Subsequently, the prepared Illumina libraries were sequenced through an Illumina HiSeq2000 platform at BGI (Shenzhen, China). We generated more than 43 million double-stranded paired-end 150 bp reads for each library (Table 1).

2.3. Raw Data Processing, Assembling and FPKM Calculation

Paired-end short raw reads with adaptor sequences, more than 10% N bases and low quality (a Phred score below 20) were filtered out using SOAPnuke (version 2.0) [15]. The remaining clean reads were then de novo assembled into contigs using Trinity (version 2.1.1) [16]. The quality of short reads was filtered based on the Phred score (Phred score 20 equals probability of error 0.01). Reads with adapter sequences were discarded rather than trimmed. Afterwards, TGICL (version 1.2.12) was used to eliminate redundancies in the assemblies [17]. The FPKM (fragments per kilo base transcriptome per million mapped reads) metric was used to calculate the expression values in each sample [18]. Data were normalized and lowly expressed genes with FPKM values of less than 1 were discarded. Differentially expressed genes (DEGs) were identified using the DESeq2 R package (V4.1.1) with parameters of log2 Fold Change: 1, padj: 0.05 [19,20].

2.4. Functional Unigene Annotation

Hierarchical clustering and principal component analyses (PCA) were performed to assess the clustering of the samples and to identify potential outliers in the general gene expression background. By using R Bioconducter, the packages “pheatmap” and “PCA tools” were used to plot heatmaps and PCA, respectively.
The final assembly was searched with Blastx against diverse databases, including the NCBI Nr and Nt, SwissProt, Clusters of Orthologous Groups (COG) and Kyoto Encyclopedia of Genes and Genomes (KEGG) databases [21,22,23]. After Nr annotation, the Blast2GO program was used to obtain Gene Ontology (GO) annotations and the distribution of gene functions [19]. GO enrichment analysis was performed using the topGO package with adjusted p-value = 0.05 as the threshold. It does not count “enrichment score” as GSEA does [23], but topGO also has a parameter for adjusted p-value.

2.5. DEGs between the Male and Female’s Blood Transcriptome

In order to validate the DEGs obtained from the assembled transcriptome, a Student–Newman–Keuls post hoc test was used to reveal how many transcripts showed high expression levels in the male or female blood transcriptome. Data were normalized and lowly expressed genes with FPKM values of less than one were discarded. DESeq2 was used to analyze DEGs with false discovery rates (FDR < 0.05 and log2 Fold Change FC > 1) as the standard difference [24].

2.6. Validation of the Potential Function Genes by qRT-PCR

A qRT-PCR method is typically used to confirm data obtained from RNA sequencing analysis; however, 6 selected genes were used to verify the analytic results of transcriptional sequencing. The total RNA used for the qRT-PCR was the same RNA used for RNA sequencing. Acquired RNA were purified with the RNeasy Animal Kit (Qiagen, Valencia, CA, USA), and first-strand cDNA was obtained using a First Strand cDNA Synthesis Kit (TaKaRa, Dalian, China). The specificity and efficiency of the designed primers was determined using the RT-PCR method before performing the qPCR experiments. Reactions were performed in a total volume of 20 µL comprising 10 µL of 2 × SYBR Premix Ex Taq™ II (TaKaRa, Tokyo, Japan), 1 µL of cDNA template (50 ng total RNA), 0.5 µL of both sense and anti-sense primers (10 µM) and 8 µL of PCR-grade water. The PCR program consisted of 1 cycle of 95 °C for 1 min, then 35 cycles of 94 °C for 15 s and 58 °C for 30 s. Quantitative expression levels were computed using the 2−ΔΔCt method with the ABI 7500 software package (Applied Biosystems, California, USA) [24]. Three technical replications and three biological replications were conducted in each assay. Copy numbers of β-actin were detected to assess stable and uniform expression in all samples. On the basis of the DEGs analysis, six TAG synthesis-related genes were selected to validate their expression between the individuals. All gene-specific primers (GSP) for target genes, as well as the β-actin, are summarized in Table 2.

2.7. Data Deposition

The raw sequenced transcriptome data from Yangtze finless porpoise blood was deposited in the Sequence Read Archive (SRA) database of NCBI with accession numbers SAMN06298616 (Male 1), SAMN06298617 (Male 2), SAMN06298618 (Male 3), SAMN06298613 (Female 1), SAMN06298614 (Female 2) and SAMN06298615 (Female 3). The detailed data set is also available from Dr. Di-an Fang on request ([email protected]).

3. Results and Discussion

3.1. Transcriptome Sequencing Output, Assembly and Annotation

More than 6 Gb of raw bases for each sample and 44.76 (Male 1), 42.02 (Male 2), 41.40 (Male 3), 48.14 (Female 1), 47.99 (Female 2) and 40.44 (Female 3) million clean reads for each individual were obtained after data filtering through Illumina sequencing. We generated 150 bp double-stranded paired-end sequencing reads (PE150) for each sample. Detailed information on raw data, clean data, assemblies and relevant quality-control data is presented in Table 1. The clean reads were then assembled separately, and showed a mean length of 844 bp, 978 bp, 970 bp, 991 bp, 960 bp and 965 bp unigenes for each sample, respectively (Table 3).

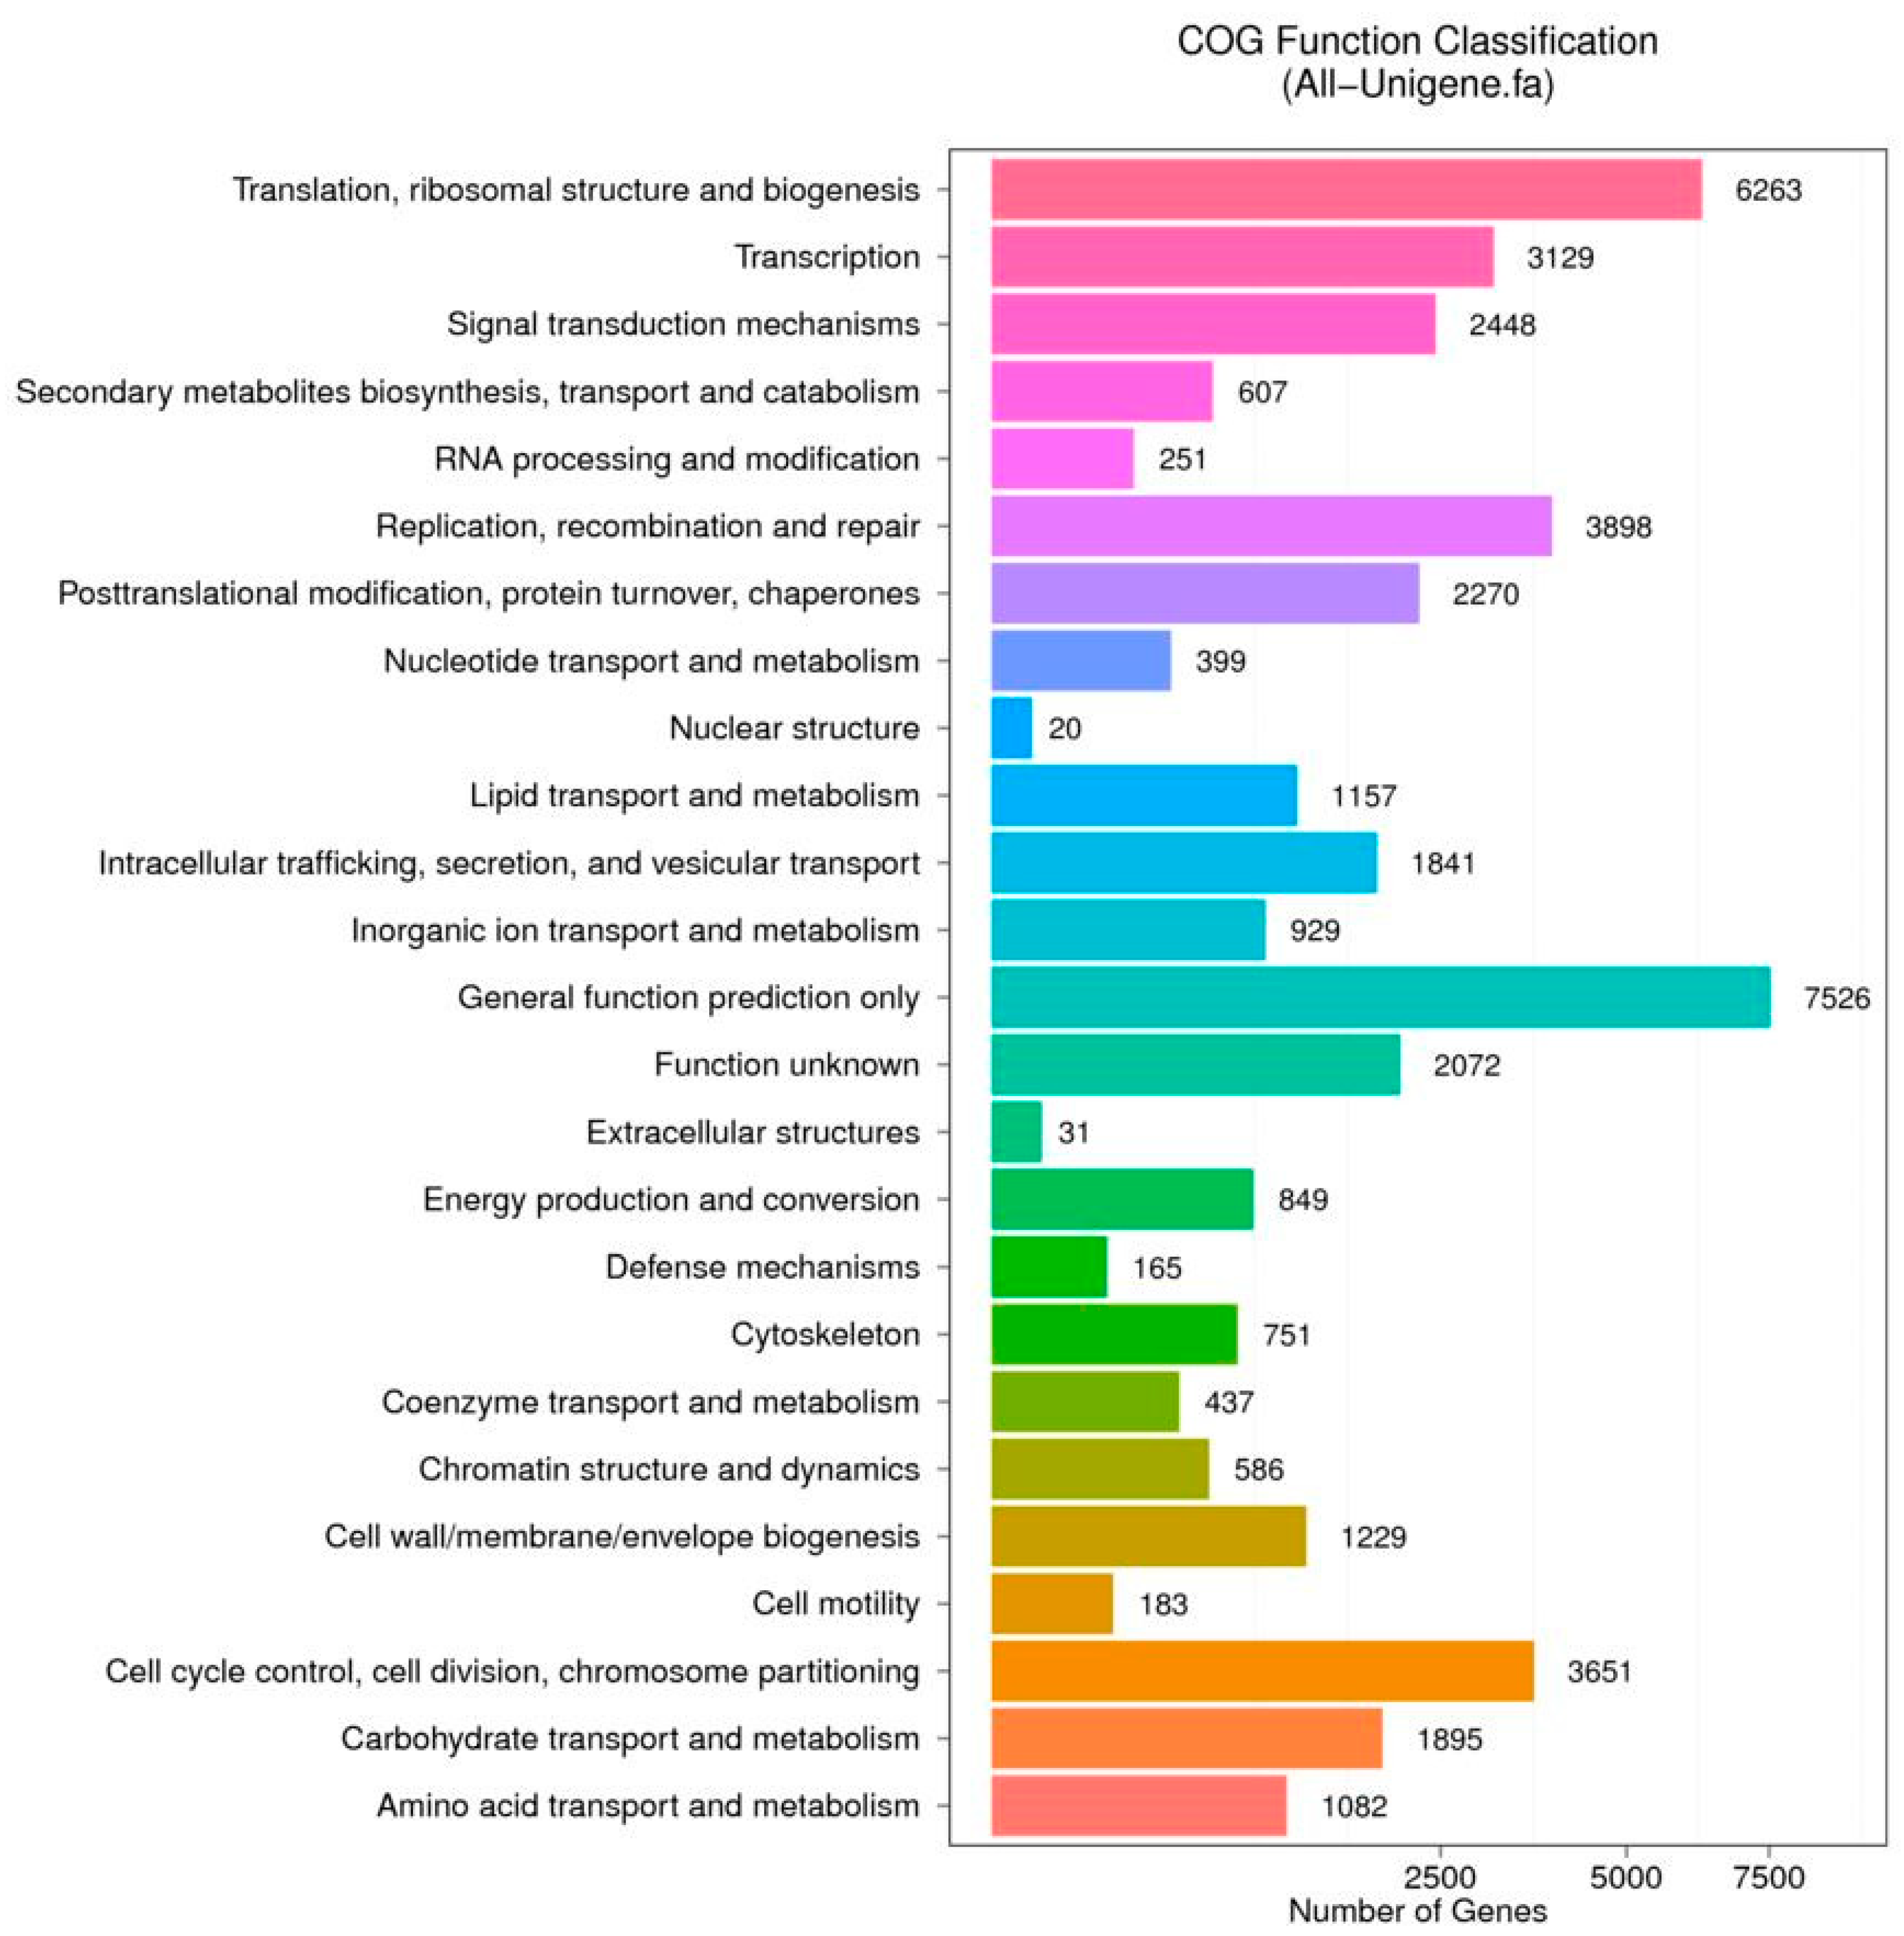
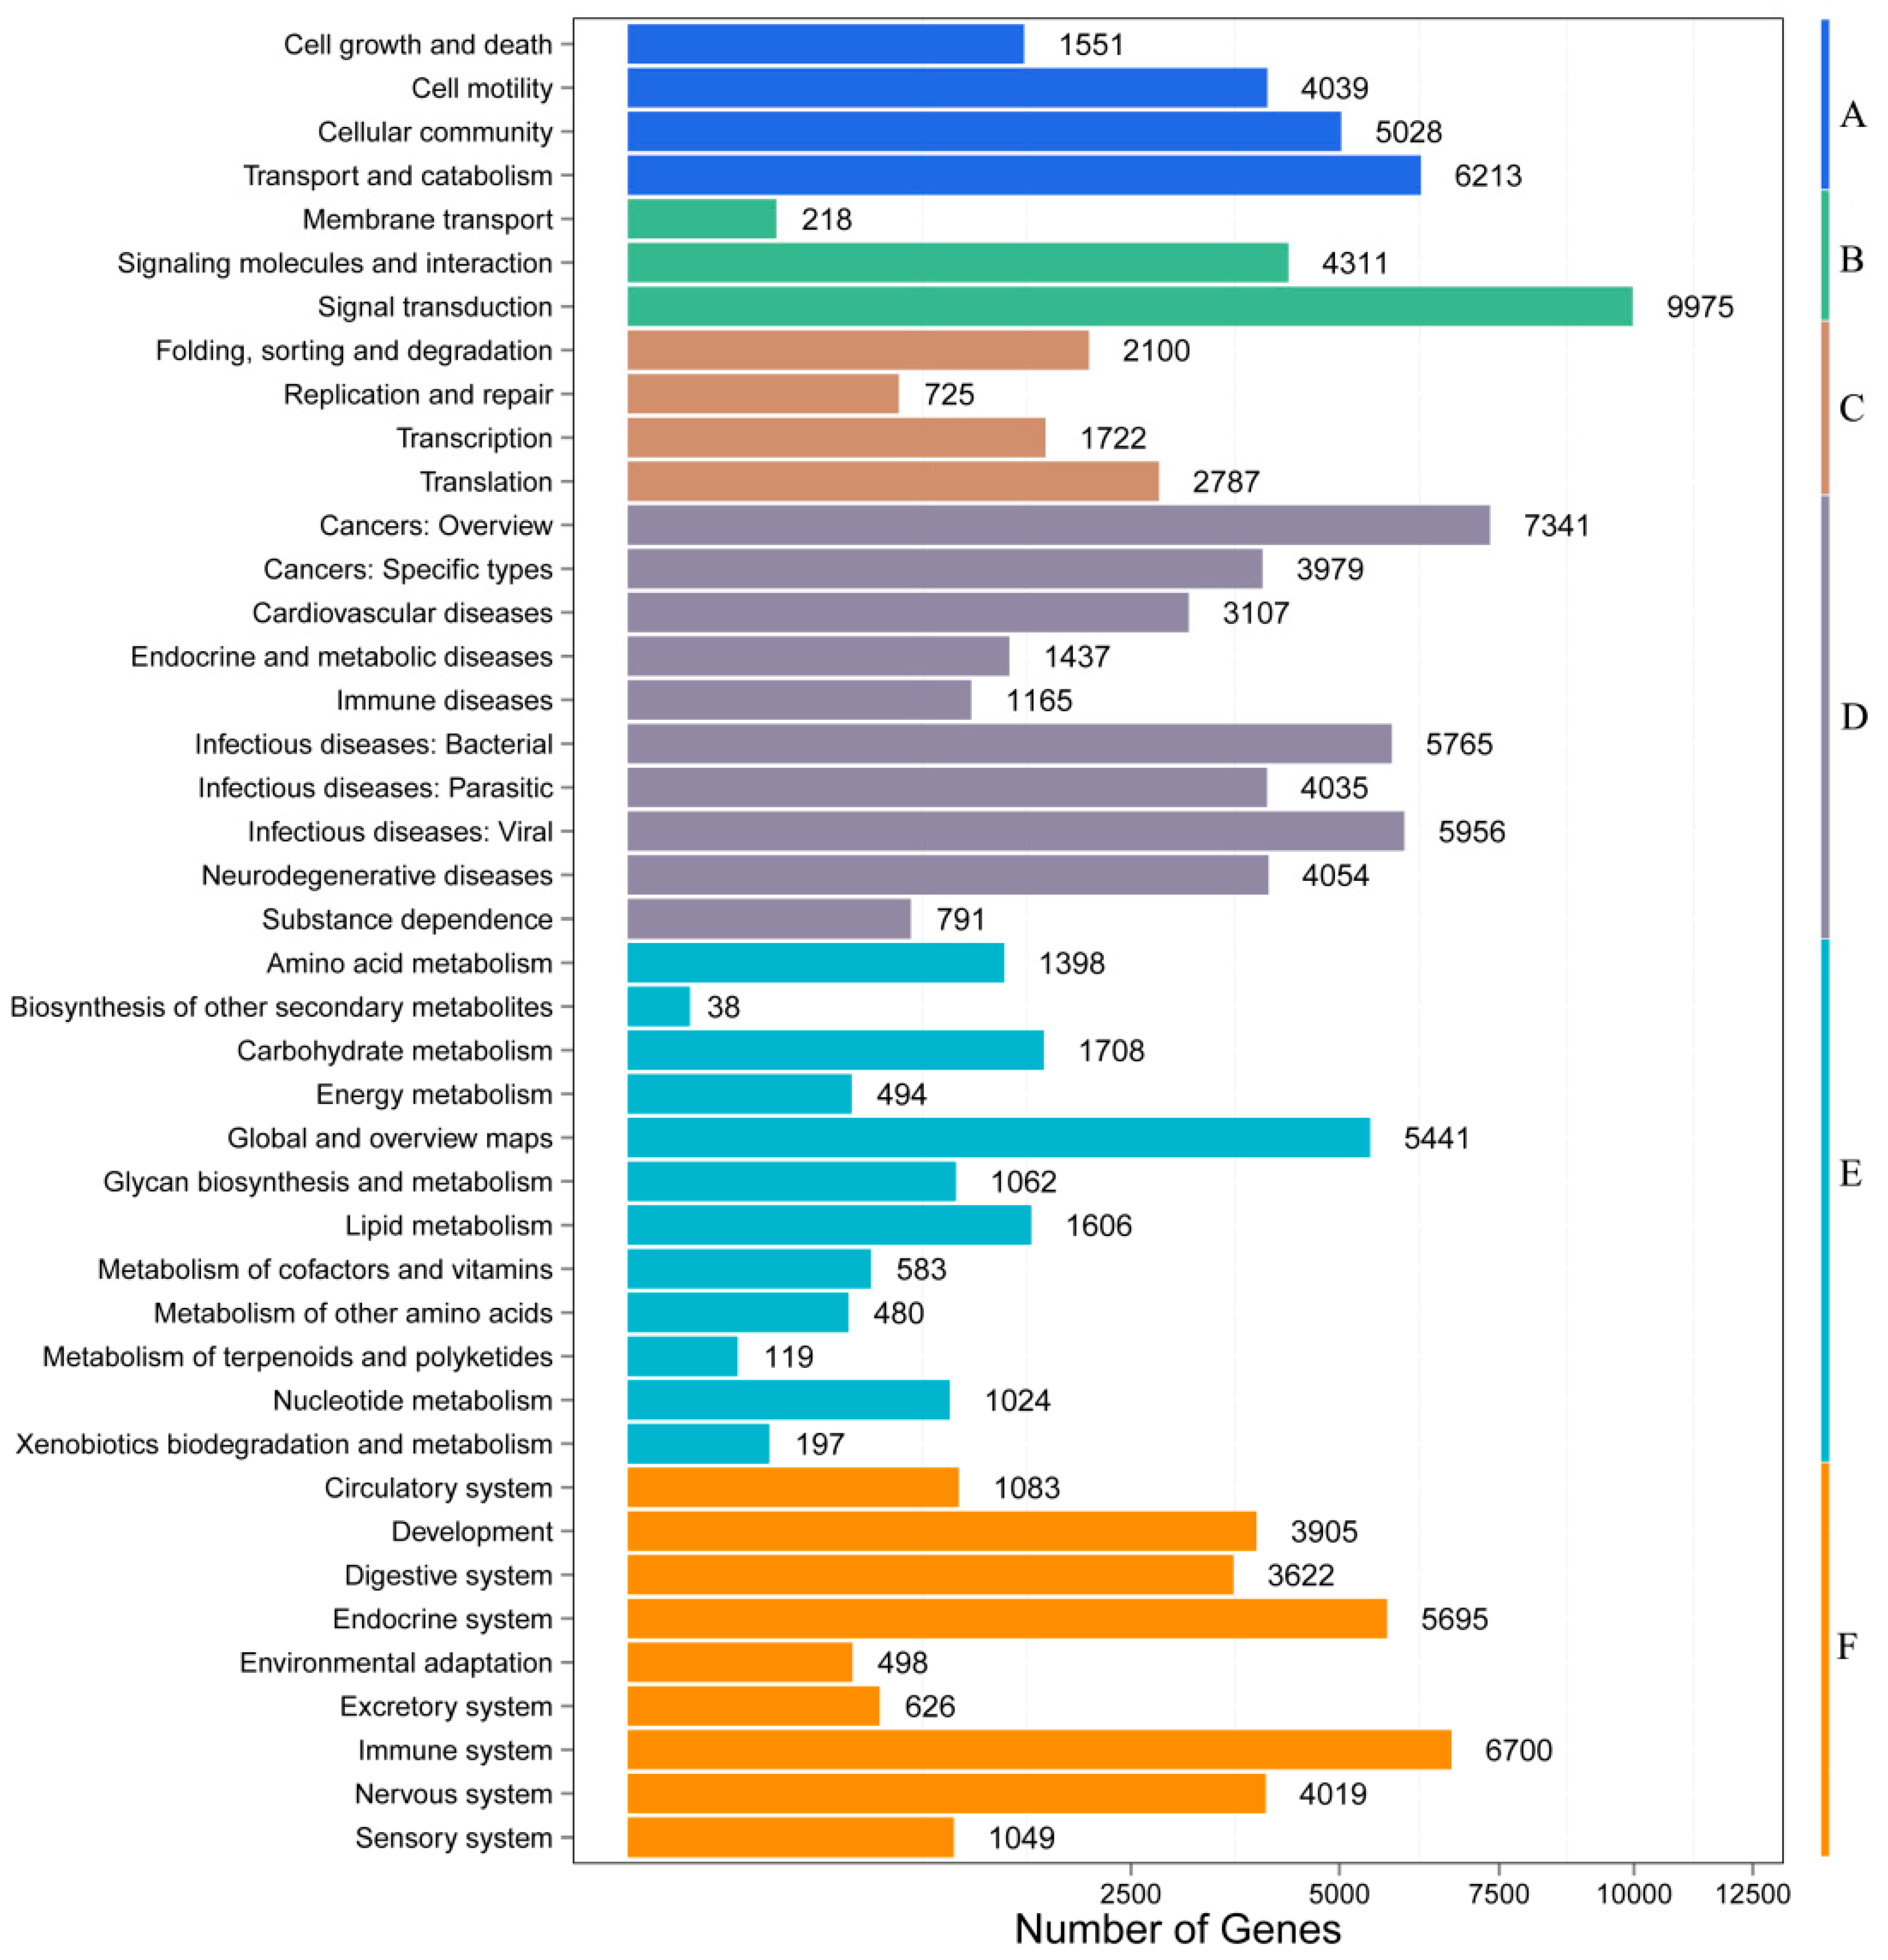
3.2. Functional Annotation and Pathway Assignment

Unigenes from each sample were merged; the yield is a total of 151,211 non-redundant unigenes. After aligning against the NCBI Nr, SwissProt, GO, COG and KEGG databases, 119,039 of these unigenes (78.72%) were functionally annotated. The number of annotated gene in each database is listed in Table 4. Among all the annotated genes, 6563 unigenes were found to be enriched in 64 GO terms, in which cell, cell part and cellular process were the top three enriched terms, with 5445, 5440 and 5222 genes annotated, respectively (Figure 1, Table S1).
Further, using the COG database, 23,017 unigenes were classified into 25 categories with general function prediction only (7526 annotated genes) and translation, ribosomal structure and biogenesis (6263 annotated genes) forming the two largest groups (Figure 2, Table S2).
For the Yangtze finless porpoise, developmental, cell differentiation, reproductive and ecological adaptation traits are of particular interest. When the assembled transcriptome was combined together for DGEs enrichment pathway analysis using the DEseq2 method, the results showed higher unigene expression involved in environmental information processing. All unigenes FPKM for each blood transcriptome were analyzed and listed in Table S3.
There were 48,051 unigenes enriched into 42 KEGG pathways which were classified into 6 groups. Signal transduction, cancers: overview, and immune system were the top three enriched pathways with 9975, 7341 and 6700 genes annotated, respectively. (Figure 3, Table S4).

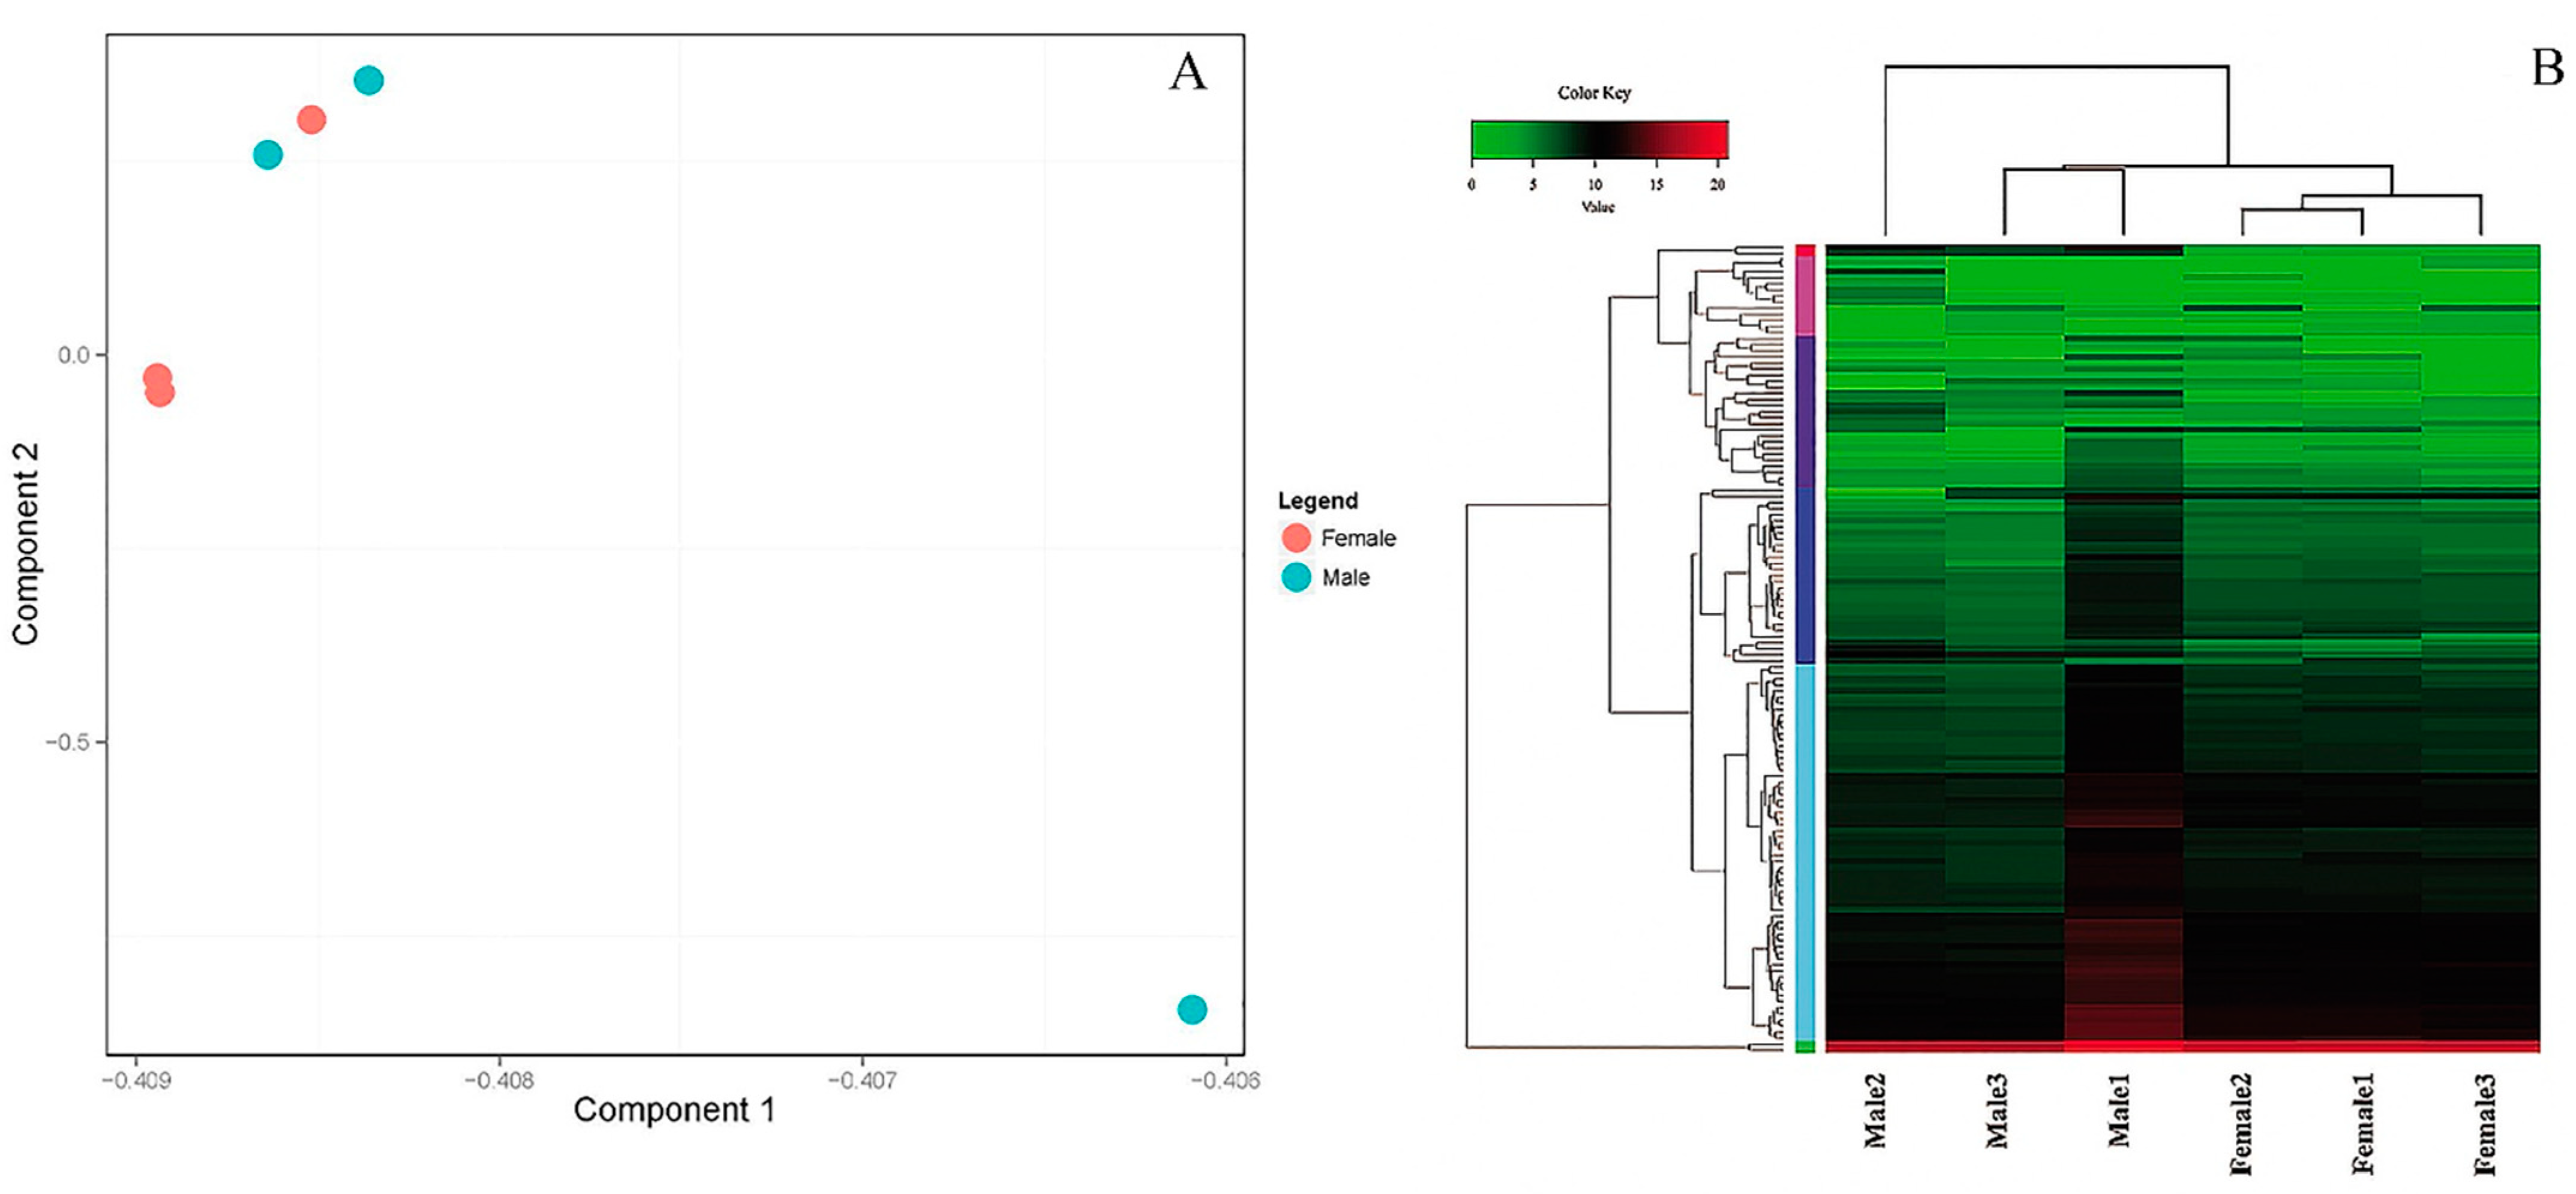
3.3. PCA Plot, Heatmap and Clustering Diagram Analysis

The blood transcriptome showed very small differences between the female and male groups, as shown in the PCA (Figure 4A). However, the results divided the six samples into three groups, the first group containing Female 2, Male 2 and Male 3 and the second group including Female 1 and Female 3, while Male 1 forms the third group independently. Male 1 is a 5-year-old individual, older than other sampled individuals. Interestingly, among the six individuals, parentages were verified using our established paternity test methods. The first group is the younger individuals, identified as the offspring; the second group includes the mother of the offspring, while the third group is Male 1, which is the father of the younger individuals. Furthermore, heatmaps representing the hierarchical clustering of DEGs somewhat differentiated the female and male transcriptome profiles (Figure 4B).

3.4. Differential Gene Expression Patterns

DESeq2 analysis revealed 185 genes that showed statistically significant differences (>2.0 fold) in their expression levels between the male and female blood transcriptomes. Of all the DEGs, 103 transcripts showed up-regulated expression in the adult male compared to the female. Such genes will be referred as “male” enhanced expression genes. A list of DGEs together with their functional annotation is shown in Table S5. Gene expression in the Yangtze finless porpoises showed a series of temporal and developmental stages. Furthermore, KEGG genes between male and female blood transcriptomes are listed in Table S6. After comparative analysis, a lipid metabolism was identified in the assembled transcriptome. It showed that triacylglycerol (TAG) synthesis-related genes were expressed in the identified transcriptome differentially, suggesting a potential regulation function in the blubber-thickening process [8,25].

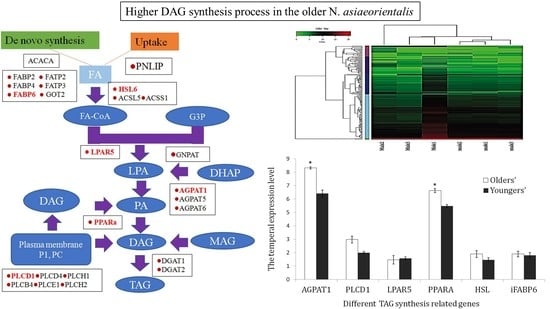
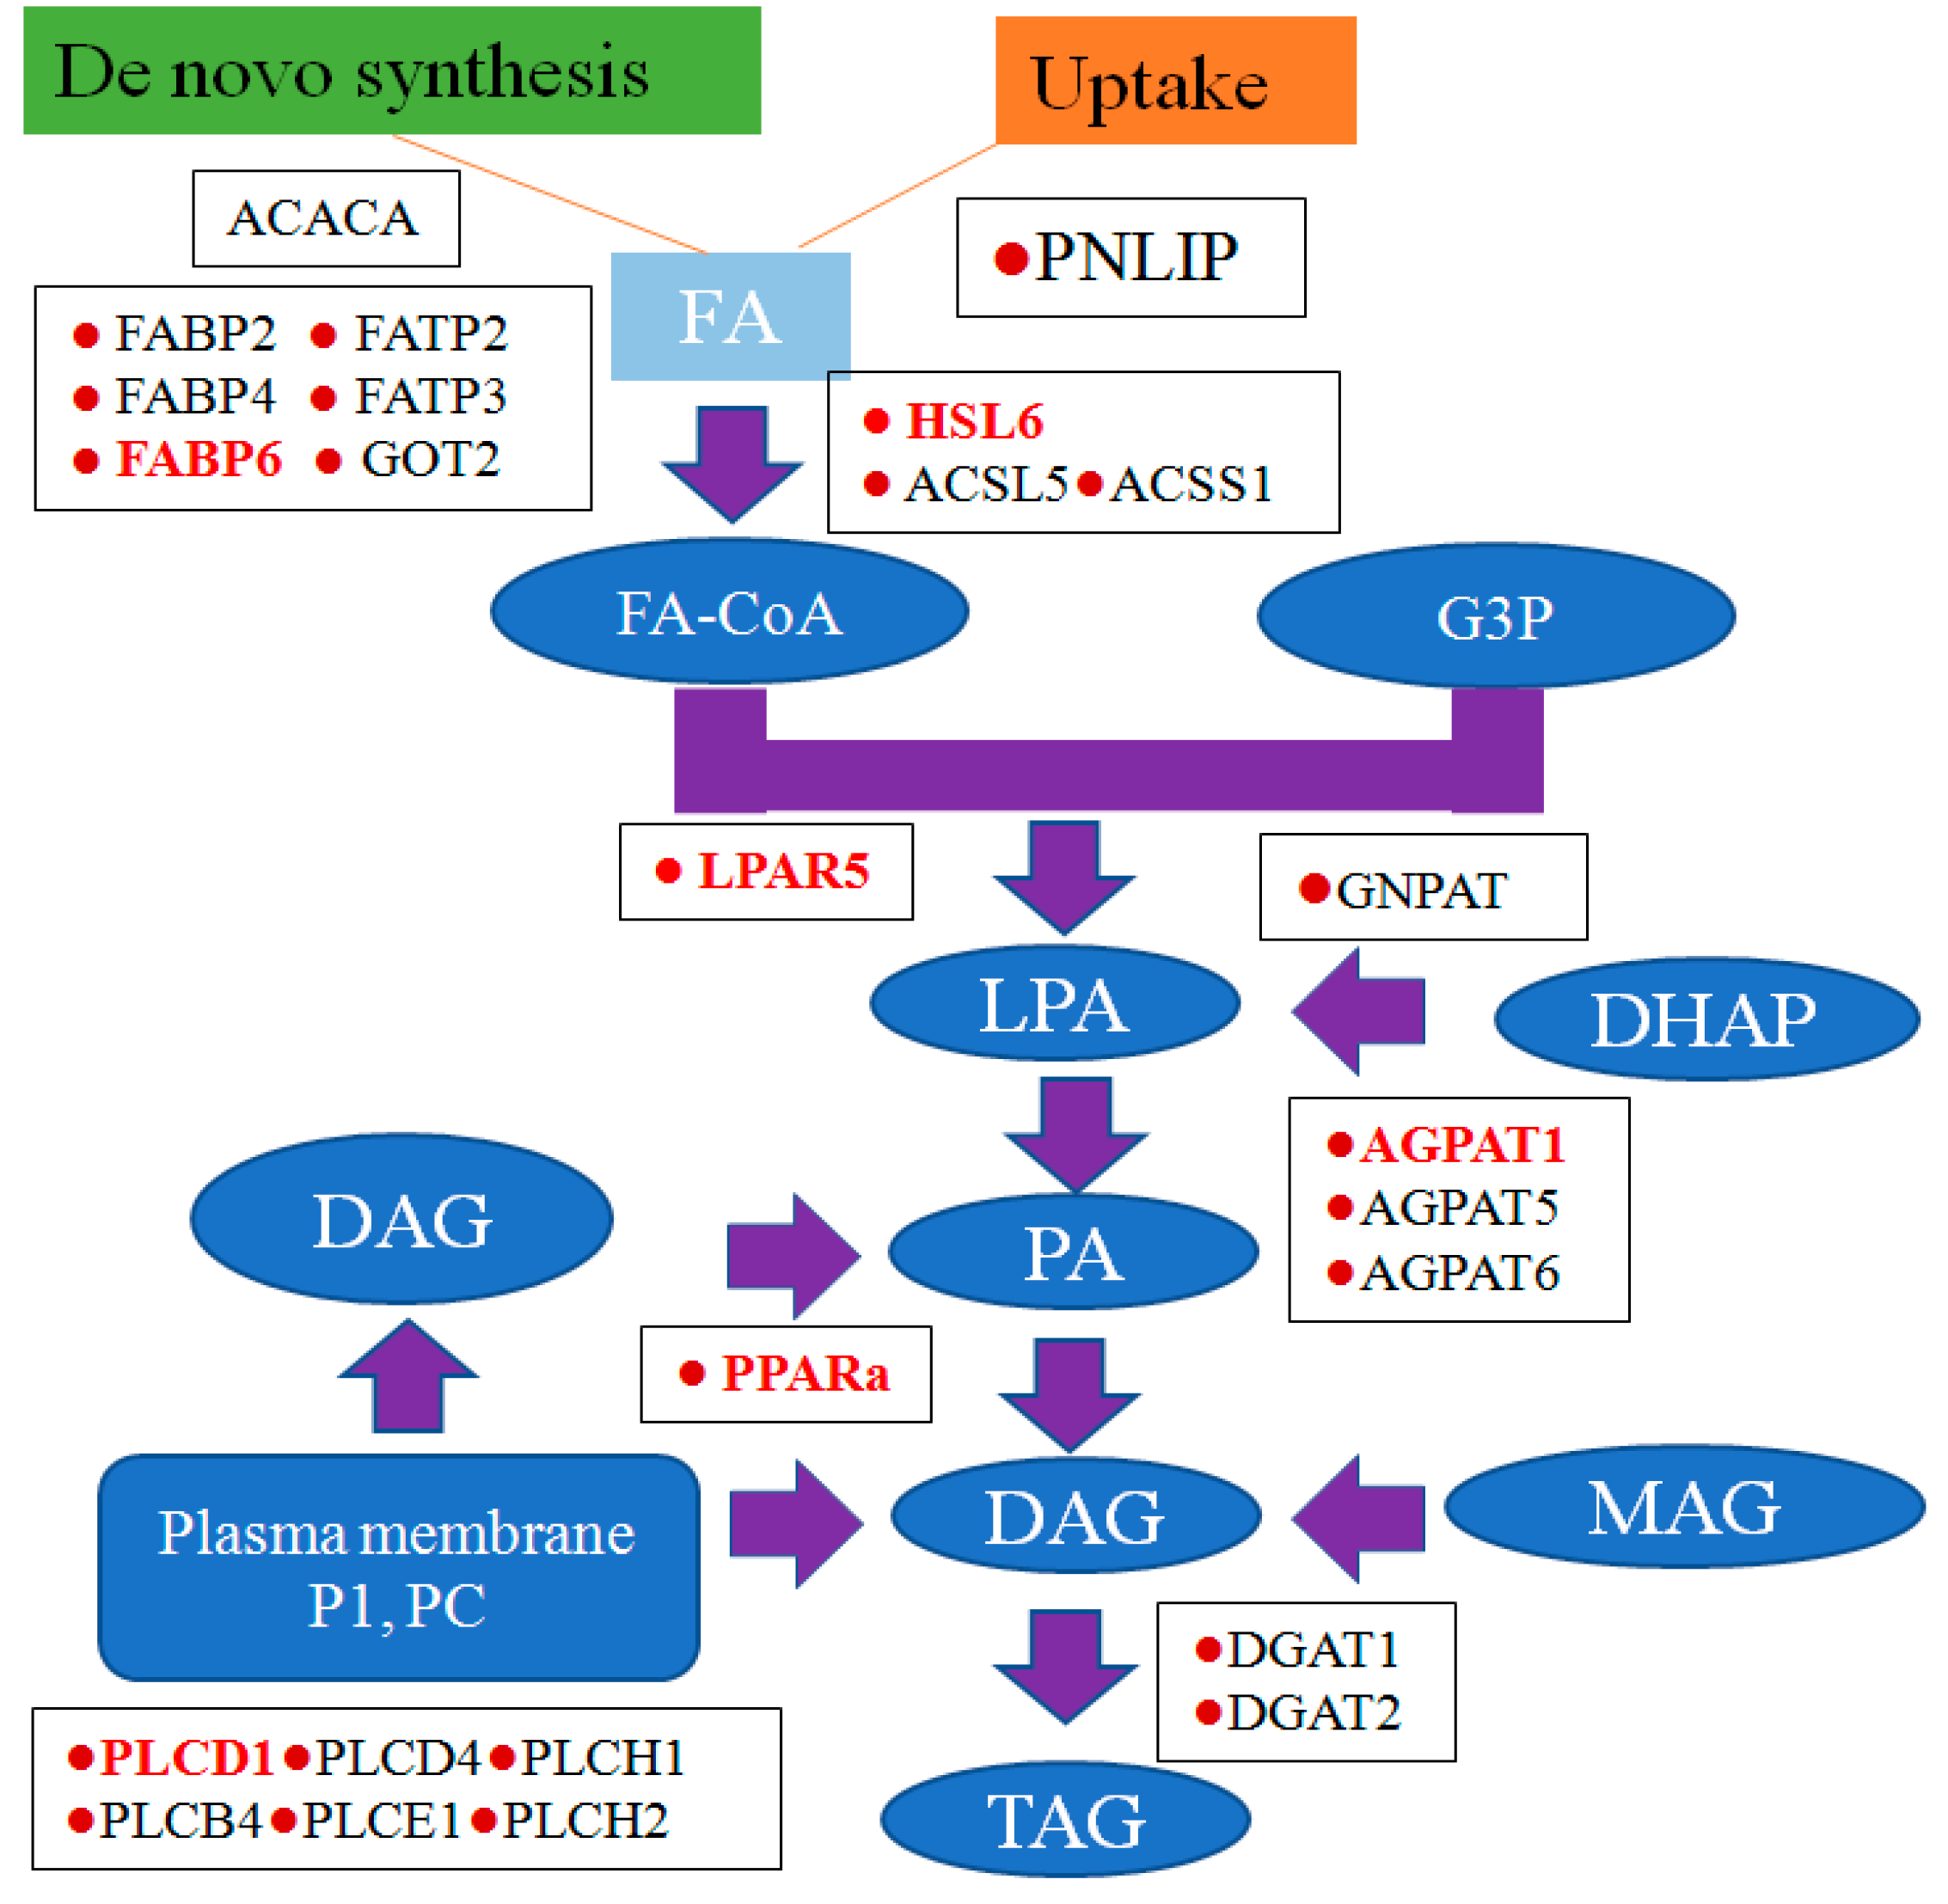
3.5. Potential Role of Triacylglycerol (TAG) Synthesis

Different genes involved in cetacean triacylglycerol (TAG) synthesis might directly explain the molecular basis of cetacean blubber thickening. Interestingly, the enhanced expression in the DGAT1 (diacylglycerol acyl transferase 1) and DGAT2 (diacylglycerol acyl transferase 2) genes in cetaceans is suggestive of an enhanced capability for TAG formation [26]. The effective uptake of free fatty acids can accelerate the expansion of adipocyte dimensions when lipids accumulate. Positive selection was detected in TAG synthesis, and functional characterization of these genes indicated that these are involved mainly in TAG synthesis and lipolysis processes [27]. Some regulatory genes related to TAG synthesis are also listed in Figure 5, which may imply a complex molecular mechanism of cetacean blubber thickening [2]. The expression of FAS can be greatly increased, which in turn results in an increase in TAG deposition [27]. Further, the DGAT-catalyzed synthesis of TAG is the final and rate-limiting step in TAG formation, which might, therefore, play an important role in promoting cetacean blubber thickening [28]. These findings, therefore, suggest that lipolysis was advanced to a certain degree in cetaceans, and the metabolic rate of cetaceans might have been increased to compensate for energy shortage, while cetaceans exhibit physiological and anatomical adaptations that allow them to rely on the lipids stored in their blubber as a source of energy during annual fasting periods [12].
In this study, almost all TAG synthesis-related genes were up-regulated in the blood transcriptome of the older finless porpoise group, which indicated that TAG may also play an important role [2,26]. Many metabolites in TAG are intermediates for other anabolic pathways as well, and as a result, the activation of the TAG pathway also led to the activation of multiple processes. Many TAG synthesis-related genes, such as 1-acylglycerol-3-phosphate O-acyltransferase 1 (AGPAT1), diacylglycerol acyl transferase (DGAT1), phospholipase C delta 1 transcript variant 1 (PLCD1), lysophosphatidic acid receptor 5 (LPAR5), peroxisome proliferator-activated receptor alpha (PPARA), hormone-sensitive lipase (HSL), fatty acid transport protein 1 (FATP1), ileal-type fatty acid-binding protein 6, (iFABP6), lipoprotein lipase (LPL) and adipose triglyceride lipase (ATGL) genes, were identified as differently expressed, which suggested their specific function in adaptation to the aquatic environment [27].

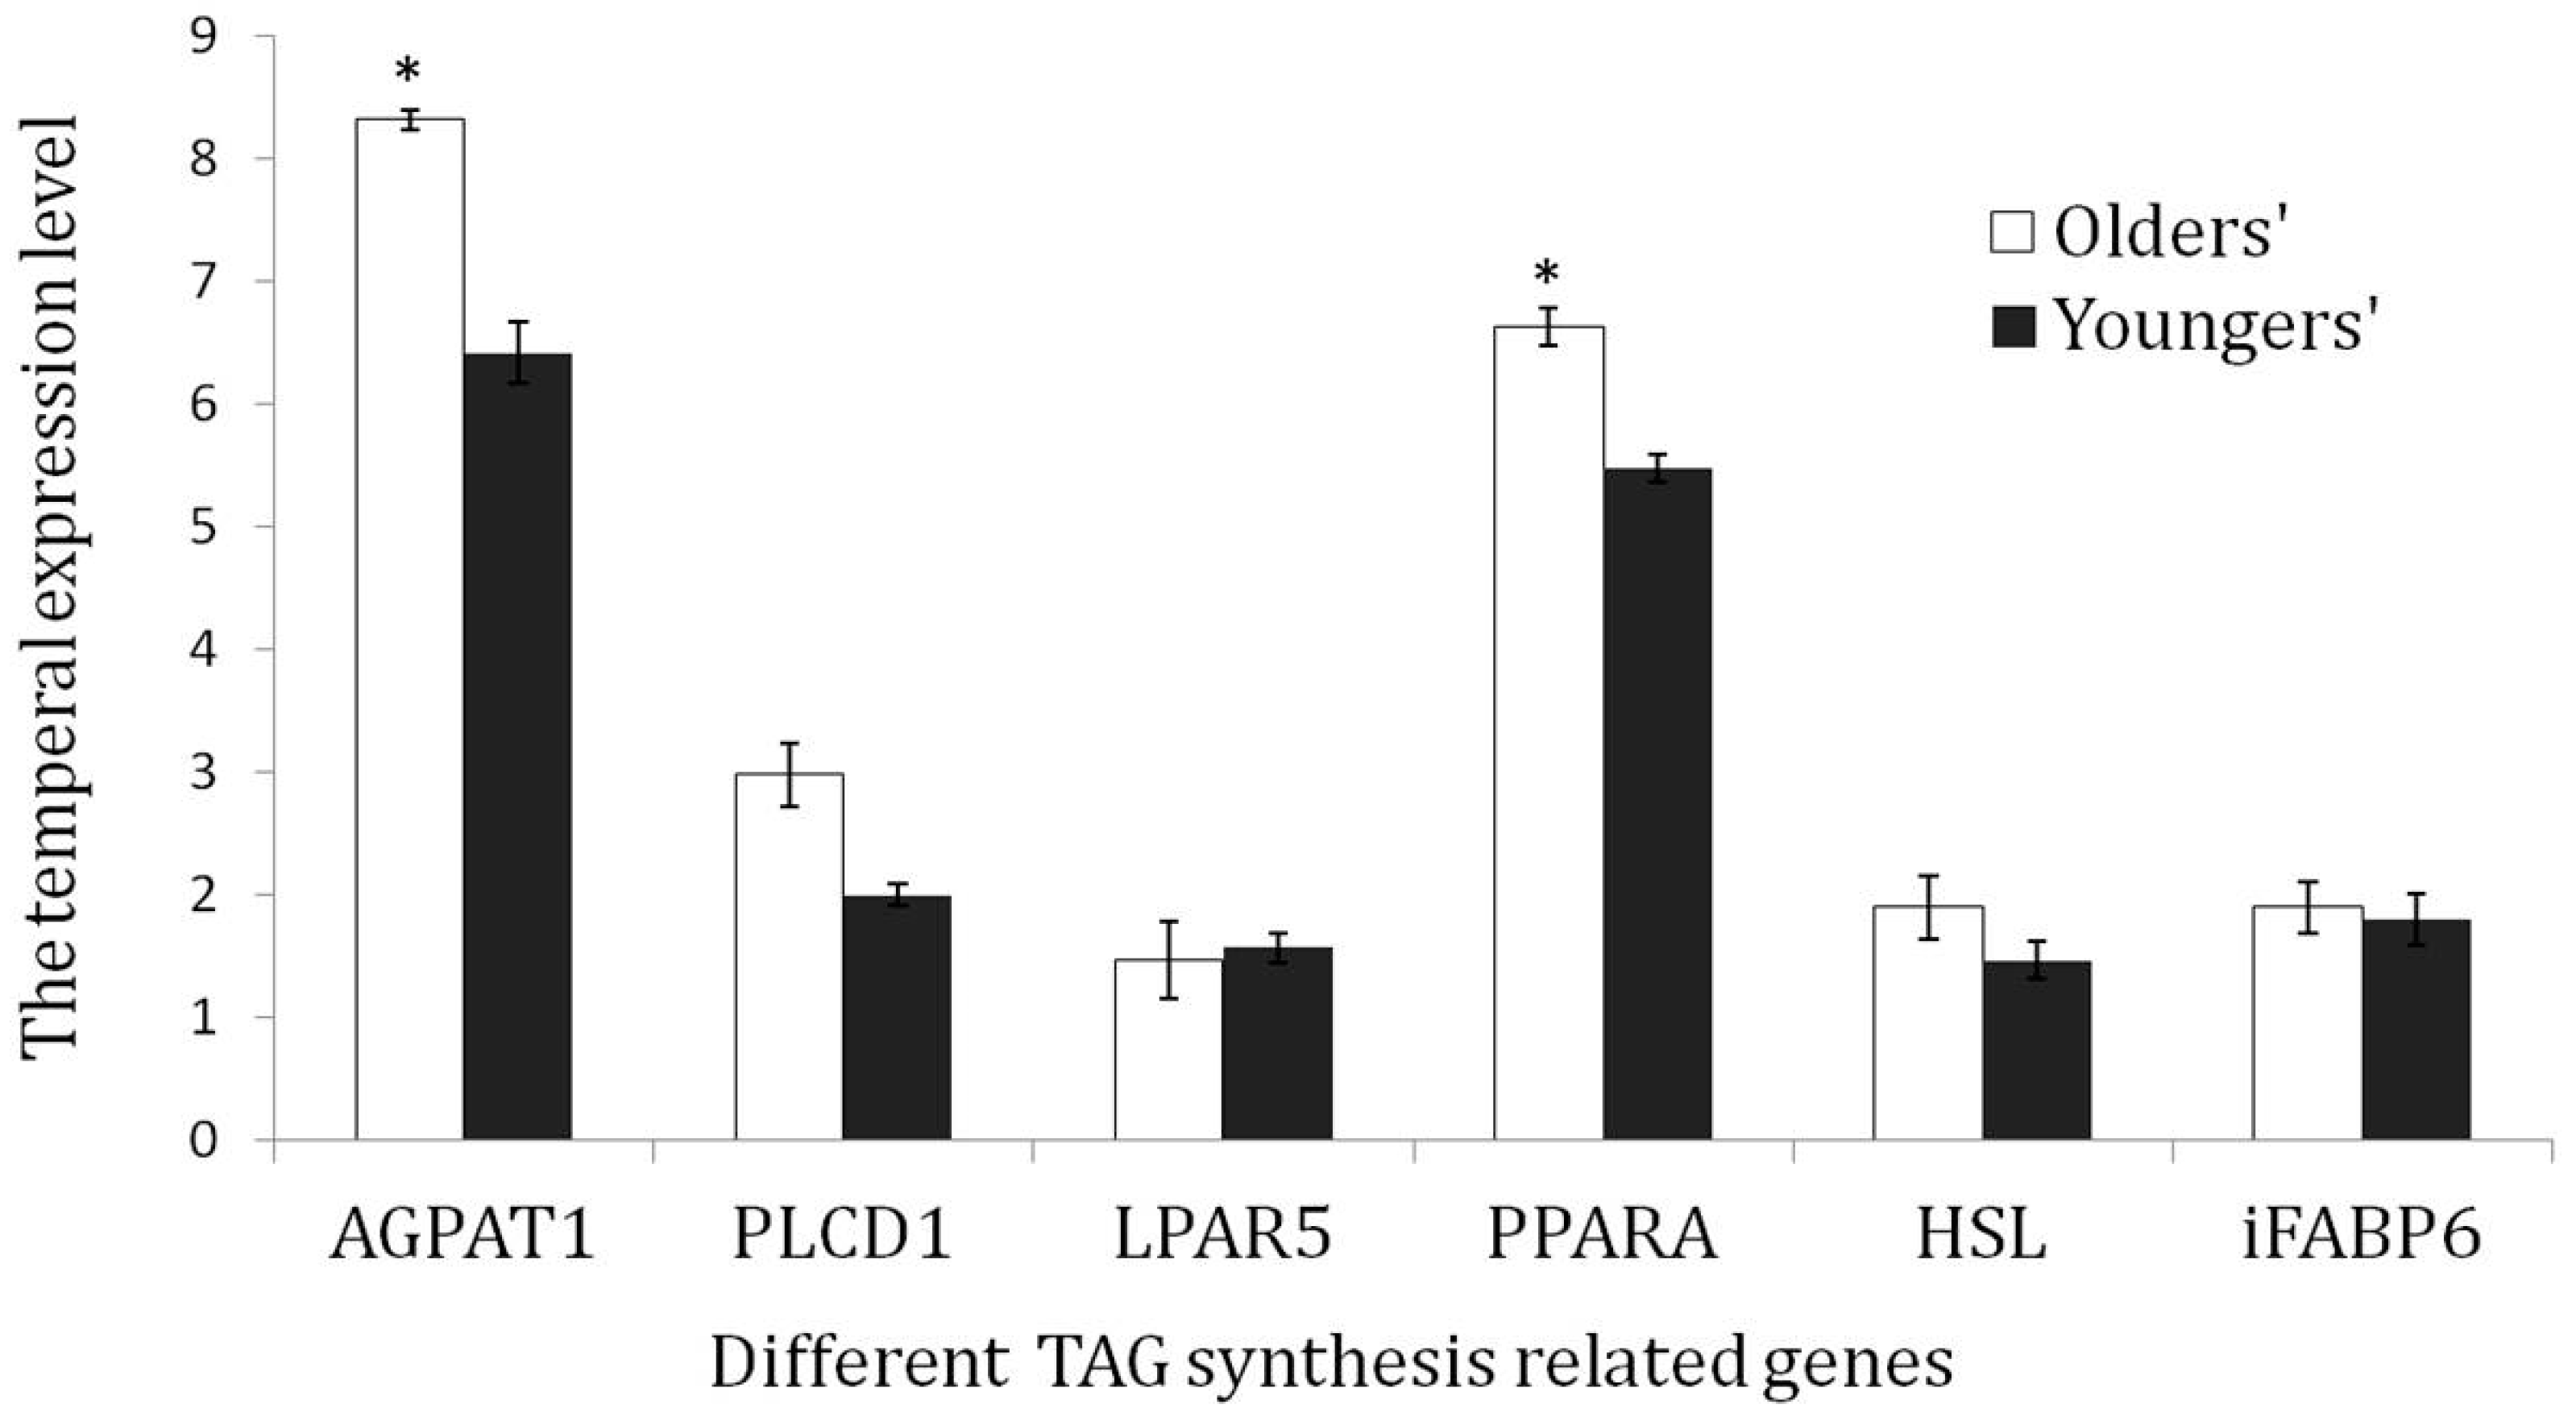
3.6. Validation of the TAG Synthesis-Related Genes via qRT-PCR

It is well known that the thickening of blubber is an evolution strategy in cetaceans [27]. Literature reports showed that TAG synthesis or the regulation of TAG synthesis could provide significant insights into blubber thickening in cetaceans [29]. AGPAT1, PLCd1 and PPARa were determined to have undergone positive selection in cetaceans, which in turn suggests that cetaceans possess an effective ability to enhance their TAG synthesis for a fully aquatic life [30], while LPAR5, HSL and iFABP6 mRNA would be involved in different steps of TAG biosynthesis pathways [28]. Therefore, the selected TAG metabolism-related genes detected support for their possible role in Yangtze finless porpoise adaptation.
Before beginning the qRT-PCR program, the specificity and efficiency of primers were also tested. The results showed that AGPAT1, PLCd1 and PPARa mRNA transcript expression was significantly higher in the older Yangtze finless porpoises than in the younger ones, which is consistent with the results of DEG expression analysis. LPAR5, HSL and iFABP6 mRNA transcript expression had no difference between two groups (Figure 6). In cetaceans, it had been proven that TAG synthesis-related genes have undergone a process of ongoing adaptive evolution [27]. AGPAT isoforms catalyze the acylation of lysophosphatidic acid (LPA) to form phosphatidic acid (PA); they also are involved in the biosynthesis of glycerolipids, such as phospholipids and triacylglycerol (Figure 5) [28,31]. AGPATs perform an essential cellular function by controlling the production of phosphatidic acid (PA), a key intermediate in the synthesis of membranes, signaling and storage lipids [31]. PLCD1 is essential to maintain the homeostasis of the cells and lipid metabolism, which is, indeed, functional and vital [32]. PPARA is a major regulator of fatty acid oxidation during acute fasting, and it is considered to be an important mediator of the fasting response [33]. Lysophosphatidic acid (LPA) exerts its action through six G-protein-coupled receptors, including LPAR5, which is a ubiquitously expressed bioactive phospholipid derived from phospholipid metabolism [34]. Hormone-sensitive lipase (HSL) is the predominant lipase effector of catecholamine-stimulated lipolysis in adipocytes. It is believed that the perilipin translocation of HSL from the cytosol to the lipid droplet is a key event in stimulated lipolysis [35]. FABP6 is known to be involved in enterohepatic bile acid metabolism, which confers a protective effect on obese individuals [36]. To some extent, the older individual has better adaptive ability to the environment than the youngest. Higher TAG-related gene expression is required for the Yangtze finless porpoise during their adaptation to the aquatic environment, so that they have enough energy to survive the challenging environment.

4. Conclusions

This study presented a comparative transcriptome of the Yangtze finless porpoise blood. Dominant gene clusters were identified, which could be involved in various metabolic, developmental and biological processes. The presented data and approach have helped to discover novel genes that play roles in the Yangtze finless porpoise’s ecological adaptation. Some DEGs could potentially play a role in biological functions as part of the Yangtze finless porpoise’s adaptation. Considering the functions of the various pathways, the present study suggested that the Yangtze finless porpoises possess an effective ability to enhance their TAG synthesis, fatty acid degradation and biosynthesis of unsaturated fatty acids. Clarifying their functional roles in the adaptation process is an essential step to further Yangtze finless porpoise conservation.

Supplementary Materials

The following supporting information can be downloaded at: https://www.mdpi.com/article/10.3390/fishes7020061/s1, Table S1: All-Unigene.fa. GO2Gene, Table S2: All-Unigene. fa. COG2 Gene, Table S3: All. Gene Expression.FPKM, Table S4: KEGG pathway, Table S5: Expression level of genes, Table S6: KEGG genes between male and female.

Author Contributions

D.-A.F. was responsible for data scoring and analyses and writing the manuscript. P.X. conceived and designed the experiments. K.L., D.-P.X. and Y.-P.W. helped with selecting the Yangtze finless porpoise blood sample, RNA extraction and data analysis during manuscript preparation. All authors have read and agreed to the published version of the manuscript.

Funding

This project was funded by the Investigation on Fishery Resources and Environment in the Lower Reach of Changjiang River (CJDC-2017-22), and the National Infrastructure of Fishery Germplasm Resources (2021DKA3047003).

Institutional Review Board Statement

The study was conducted according to the guidelines of the Declaration of Helsinki, and approved by the Institutional Review Board (or Ethics Committee) of the Animal Care and Use Committee of the Freshwater Fisheries Research Center at the Chinese Academy of Fishery Sciences. The analysis was carried out following the Guidelines for the Care and Use of Laboratory Animals set by the Animal Care and Use Committee of the Freshwater Fisheries Research Center (2003WXEP61). All operations were carried out with field permit no. 20181AC1128.

Data Availability Statement

The raw sequenced transcriptome data from the Yangtze finless porpoise blood was deposited in the Sequence Read Archive (SRA) database of NCBI. The detailed data set is also available from Di-an Fang on request ([email protected]).

Acknowledgments

We thank the Yangtze River Fisheries Resource Communities for their permission and our survey group members’ diligent work. We thank the fishermen for their dedication and hard work.

Conflicts of Interest

The authors declare no conflict of interest.

References

  1. Wang, D.; Turvey, S.T.; Zhao, X.; Mei, Z. Neophocaena asiaeorientalis ssp. Asiaeorientalis. IUCN Red List Threat. Species 2013, e.T43205774A45893487. Available online: https://www.iucnredlist.org/species/43205774/45893487 (accessed on 1 January 2022).
  2. Zhou, X.; Guang, X.; Sun, D.; Xu, S.; Li, M.; Seim, I.; Jie, W.; Yang, L.; Zhu, Q.; Xu, J.; et al. Population genomics of finless porpoises reveal an incipient cetacean species adapted to freshwater. Nat. Commun. 2018, 9, 1276. [Google Scholar] [CrossRef] [Green Version]
  3. Mei, Z.; Zhang, X.; Huang, S.-L.; Zhao, X.; Hao, Y.; Zhang, L.; Qian, Z.; Zheng, J.; Wang, K.; Wang, D. The yangtze finless porpoise: On an accelerating path to extinction? Biol. Conserv. 2014, 172, 117–123. [Google Scholar] [CrossRef]
  4. Kimura, S.; Akamatsu, T.; Li, S.; Dong, L.; Wang, K.; Wang, D.; Arai, N. Seasonal changes in the local distribution of yangtze finless porpoises related to fish presence. Mar. Mammal Sci. 2012, 28, 308–324. [Google Scholar] [CrossRef]
  5. Wang, D. Population status, threats and conservation of the yangtze finless porpoise. Chin. Sci. Bull. 2009, 54, 3473. [Google Scholar] [CrossRef] [Green Version]
  6. Isobe, T.; Oshihoi, T.; Hamada, H.; Nakayama, K.; Yamada, T.K.; Tajima, Y.; Amano, M.; Tanabe, S. Contamination status of pops and bfrs and relationship with parasitic infection in finless porpoises (Neophocaena phocaenoides) from seto inland sea and omura bay, Japan. Mar. Pollut. Bull. 2011, 63, 564–571. [Google Scholar] [CrossRef] [PubMed]
  7. Zhao, X.; Barlow, J.; Taylor, B.L.; Pitman, R.L.; Wang, K.; Wei, Z.; Stewart, B.S.; Turvey, S.T.; Akamatsu, T.; Reeves, R.R.; et al. Abundance and conservation status of the yangtze finless porpoise in the yangtze river, china. Biol. Conserv. 2008, 141, 3006–3018. [Google Scholar] [CrossRef] [Green Version]
  8. Zhang, K.; Qian, Z.; Ruan, Y.; Hao, Y.; Dong, W.; Li, K.; Mei, Z.; Wang, K.; Wu, C.; Wu, J.; et al. First evaluation of legacy persistent organic pollutant contamination status of stranded yangtze finless porpoises along the yangtze river basin, china. Sci. Total Environ. 2020, 710, 136446. [Google Scholar] [CrossRef]
  9. Muka, S.; Zarpentine, C. Cetacean conservation and the ethics of captivity. Biol. Conserv. 2021, 262, 109303. [Google Scholar] [CrossRef]
  10. Ju, J.; Yang, M.; Xu, S.; Zhou, K.; Yang, G. High level population differentiation of finless porpoises (Neophocaena phocaenoides) in chinese waters revealed by sequence variability of four nuclear introns. Mol. Biol. Rep. 2012, 39, 7755–7762. [Google Scholar] [CrossRef]
  11. Spitz, J.; Becquet, V.; Rosen, D.A.S.; Trites, A.W. A nutrigenomic approach to detect nutritional stress from gene expression in blood samples drawn from steller sea lions. Comp. Biochem. Physiol. Part A Mol. Integr. Physiol. 2015, 187, 214–223. [Google Scholar] [CrossRef] [PubMed]
  12. Yim, H.-S.; Cho, Y.S.; Guang, X.; Kang, S.G.; Jeong, J.-Y.; Cha, S.-S.; Oh, H.-M.; Lee, J.-H.; Yang, E.C.; Kwon, K.K.; et al. Minke whale genome and aquatic adaptation in cetaceans. Nat. Genet. 2014, 46, 88–92. [Google Scholar] [CrossRef] [PubMed] [Green Version]
  13. Hwang, J.Y.; Kwon, M.G.; Jung, S.-H.; Park, M.A.; Kim, D.-W.; Cho, W.S.; Park, J.W.; Son, M.-H. Rna-seq transcriptome analysis of the olive flounder (paralichthys olivaceus) kidney response to vaccination with heat-inactivated viral hemorrhagic septicemia virus. Fish Shellfish Immunol. 2017, 62, 221–226. [Google Scholar] [CrossRef] [PubMed]
  14. Mancia, A. Chapter 11—new technologies for monitoring marine mammal health. In Marine Mammal Ecotoxicology; Fossi, M.C., Panti, C., Eds.; Academic Press: Cambridge, MA, USA, 2018; pp. 291–320. [Google Scholar]
  15. Luo, R.; Liu, B.; Xie, Y.; Li, Z.; Liu, Y. Soapdenovo2: An empirically improved memory-efficient short-read de novo assembler. Gigascience 2012, 1, 2047–2217X. [Google Scholar] [CrossRef]
  16. Grabherr, M.; Haas, B.; Yassour, M.; Levin, J.Z.; Thompson, D.A.; Amit, I. Trinity: Reconstructing a full-length transcriptome without a genome from rna-seq data. Nat. Biotechnol. 2011, 29, 644–652. [Google Scholar] [CrossRef] [Green Version]
  17. Pertea, G.; Huang, X.; Liang, F.; Antonescu, V.; Sultana, R.; Karamycheva, S.; Lee, Y.; White, J.; Cheung, F.; Parvizi, B.; et al. Tigr gene indices clustering tools (tgicl): A software system for fast clustering of large est datasets. Bioinformatics 2003, 19, 651–652. [Google Scholar] [CrossRef] [PubMed] [Green Version]
  18. Li, B.; Dewey, C.N. Rsem: Accurate transcript quantification from rna-seq data with or without a reference genome. BMC Bioinform. 2011, 12, 323. [Google Scholar] [CrossRef] [Green Version]
  19. Conesa, A.; Götz, S.; García-Gómez, J.M.; Terol, J.; Talón, M.; Robles, M. Blast2go: A universal tool for annotation, visualization and analysis in functional genomics research. Bioinformatics 2005, 21, 3674–3676. [Google Scholar] [CrossRef] [Green Version]
  20. Love, M.I.; Huber, W.; Anders, S. Moderated estimation of fold change and dispersion for rna-seq data with deseq2. Genome Biol. 2014, 15, 550. [Google Scholar] [CrossRef] [Green Version]
  21. Tatusov, R.L.; Galperin, M.Y.; Natale, D.A.; Koonin, E.V. The cog database: A tool for genome-scale analysis of protein functions and evolution. Nucleic Acids Res. 2000, 28, 33–36. [Google Scholar] [CrossRef] [PubMed] [Green Version]
  22. Kanehisa, M.; Goto, S.; Kawashima, S.; Okuno, Y.; Hattori, M. The kegg resource for deciphering the genome. Nucleic Acids Res. 2004, 32, D277–D280. [Google Scholar] [CrossRef] [Green Version]
  23. Leng, N.; Dawson, J.A.; Thomson, J.A.; Ruotti, V.; Rissman, A.I.; Smits, B.M.G.; Haag, J.D.; Gould, M.N.; Stewart, R.M.; Kendziorski, C. Ebseq: An empirical bayes hierarchical model for inference in rna-seq experiments. Bioinformatics 2013, 29, 1035–1043. [Google Scholar] [CrossRef] [PubMed] [Green Version]
  24. Livak, K.J.; Schmittgen, T.D. Analysis of relative gene expression data using real-time quantitative pcr and the 2−δδct method. Methods 2001, 25, 402–408. [Google Scholar] [CrossRef] [PubMed]
  25. Mancia, A.; Ryan, J.C.; Van Dolah, F.M.; Kucklick, J.R.; Rowles, T.K.; Wells, R.S.; Rosel, P.E.; Hohn, A.A.; Schwacke, L.H. Machine learning approaches to investigate the impact of pcbs on the transcriptome of the common bottlenose dolphin (tursiops truncatus). Mar. Environ. Res. 2014, 100, 57–67. [Google Scholar] [CrossRef] [PubMed]
  26. Mu, H.; Shen, H.; Liu, J.; Xie, F.; Zhang, W.; Mai, K. High level of dietary soybean oil depresses the growth and anti-oxidative capacity and induces inflammatory response in large yellow croaker larimichthys crocea. Fish Shellfish Immunol. 2018, 77, 465–473. [Google Scholar] [CrossRef]
  27. Wang, Z.; Chen, Z.; Xu, S.; Ren, W.; Zhou, K.; Yang, G. ‘Obesity’ is healthy for cetaceans? Evidence from pervasive positive selection in genes related to triacylglycerol metabolism. Sci. Rep. 2015, 5, 14187. [Google Scholar] [CrossRef] [Green Version]
  28. Yamashita, A.; Hayashi, Y.; Nemoto-Sasaki, Y.; Ito, M.; Oka, S.; Tanikawa, T.; Waku, K.; Sugiura, T. Acyltransferases and transacylases that determine the fatty acid composition of glycerolipids and the metabolism of bioactive lipid mediators in mammalian cells and model organisms. Prog. Lipid Res. 2014, 53, 18–81. [Google Scholar] [CrossRef]
  29. Springer, M.S.; Guerrero-Juarez, C.F.; Huelsmann, M.; Collin, M.A.; Danil, K.; McGowen, M.R.; Oh, J.W.; Ramos, R.; Hiller, M.; Plikus, M.V.; et al. ; et al. Genomic and anatomical comparisons of skin support independent adaptation to life in water by cetaceans and hippos. Curr. Biol. 2021, 31, 2124–2139.e3. [Google Scholar] [CrossRef]
  30. Braissant, O.; Foufelle, F.; Scotto, C.; Dauça, M.; Wahli, W. Differential expression of peroxisome proliferator-activated receptors (ppars): Tissue distribution of ppar-alpha, -beta, and -gamma in the adult rat. Endocrinology 1996, 137, 354–366. [Google Scholar] [CrossRef] [PubMed] [Green Version]
  31. Körbes, A.P.; Kulcheski, F.R.; Margis, R.; Margis-Pinheiro, M.; Turchetto-Zolet, A.C. Molecular evolution of the lysophosphatidic acid acyltransferase (lpaat) gene family. Mol. Phylogenetics Evol. 2016, 96, 55–69. [Google Scholar] [CrossRef]
  32. Hammond, G.R.V.; Balla, T. Polyphosphoinositide binding domains: Key to inositol lipid biology. Biochim. Biophys. Acta (BBA)-Mol. Cell Biol. Lipids 2015, 1851, 746–758. [Google Scholar] [CrossRef] [PubMed] [Green Version]
  33. Li, G.; Brocker, C.N.; Yan, T.; Xie, C.; Krausz, K.W.; Xiang, R.; Gonzalez, F.J. Corrigendum to “metabolic adaptation to intermittent fasting is independent of peroxisome proliferator-activated receptor alpha”. Mol. Metab. 2018, 9, 217–219. [Google Scholar] [CrossRef] [PubMed]
  34. Lin, M.-E.; Herr, D.R.; Chun, J. Lysophosphatidic acid (lpa) receptors: Signaling properties and disease relevance. Prostaglandins Other Lipid Mediat. 2010, 91, 130–138. [Google Scholar] [CrossRef] [PubMed] [Green Version]
  35. Miyoshi, H.; Souza, S.C.; Zhang, H.-H.; Strissel, K.J.; Christoffolete, M.A.; Kovsan, J.; Rudich, A.; Kraemer, F.B.; Bianco, A.C.; Obin, M.S.; et al. Perilipin promotes hormone-sensitive lipase-mediated adipocyte lipolysis via phosphorylation-dependent and -independent mechanisms. J. Biol. Chem. 2006, 281, 15837–15844. [Google Scholar] [CrossRef] [Green Version]
  36. Fisher, E.; Grallert, H.; Klapper, M.; Pfäfflin, A.; Schrezenmeir, J.; Illig, T.; Boeing, H.; Döring, F. Evidence for the thr79met polymorphism of the ileal fatty acid binding protein (fabp6) to be associated with type 2 diabetes in obese individuals. Mol. Genet. Metab. 2009, 98, 400–405. [Google Scholar] [CrossRef]
Figure 1. GO enrichment within the assembled transcriptome. The number of each bar indicates the number of genes in a category. The vertical axis shows identified GO terms. The right margin indicates the three groups of GO-enriched terms.
Fishes 07 00061 g001
Figure 2. COG classifications of consensus sequences. COG categories are shown on the vertical axis and the numbers of genes are plotted on the horizontal axis.
Fishes 07 00061 g002
Figure 3. KEGG pathway analyses for all annotated unigenes. The horizontal indicates the number of genes in a category. The left y-axis indicates the identified KEGG pathways. The right y-axis indicates the six groups of KEGG enrichment which are: (A) cellular processes; (B) environmental information processing; (C) genetic information processing; (D) human diseases; (E) metabolism; (F) organismal systems.
Fishes 07 00061 g003
Figure 4. PCA analysis and a heatmap for DGEs. Panel (A) shows very small differences between the female and male blood transcriptome in the PCA. Panel (B) presents the hierarchical clustering of DEGs somewhat differentiated between the female and male transcriptome profiles.
Fishes 07 00061 g004
Figure 5. Genes involved in triacylglycerol synthesis.
Fishes 07 00061 g005
Figure 6. qRT-PCR validation of TAG-related genes. Six genes were selected as representatives of the older and the younger groups. AGPAT1: 1-acylglycerol-3-phosphate O-acyltransferase 1, PLCD1: phospholipase C delta 1transcript variant 1, LPAR5: lysophosphatidic acid receptor 5, PPARA: peroxisome proliferator-activated receptor alpha, HSL: hormone-sensitive lipase, iFABP6: ileal-type fatty acid-binding protein 6. β-actin was used as the internal control, and each value represents an average of three separate biological replicates. Blood was sampled from the same six individuals as for transcriptome analysis. The error bars represent the standard deviation. Asterisk (*) marks significant difference, set at p = 0.05 with a t-test.
Fishes 07 00061 g006
Table 1. Statistics for sequencing raw reads and clean reads.
SampleNo. of Raw Reads (Mb)Length (bp)No. of Bases (Gb)No. of Clean Reads (Mb)Clean Reads Q20Clean Reads Q30Clean Reads Ratio (%)
Female 150.861507.6348.1496.8793.0794.66
Female 250.641507.6047.9996.9393.1794.77
Female 343.481506.5240.4496.8192.9893.03
Male 147.911507.1944.7697.0893.4593.42
Male 243.971506.6042.0296.8893.1195.56
Male 344.101506.6241.4096.7792.9193.88
Table 2. RT-qPCR primers for the verified genes.
Primers NameSequence(5’–3’)TmProducts
1-acylglycerol-3-phosphate O-acyltransferase 1
AGPAT1-F
AGPAT1-R
AGGTTCCCATTGTTCCCATAGTCAT
CCTCCAGGCTTCTTCAGATAGTCAC
64.2
62.8
238 bp
phospholipase C, delta 1, transcript variant 2
PLCD1-F
PLCD1-R
AAGGACAACAAGATGAACTTCAAGGAG
AGACCACTAACTGATCCACCGACAG
63.8
63.6
249 bp
lysophosphatidic acid receptor5
LPAR5-F
LPAR5-R
TCTGAGTCTTGACTGGGACTACGTT
CACCATCCCTGGGTATTCTCATCTC
61.4
65.0
194 bp
peroxisome proliferator-activated receptor α
PPARA-F
PPARA-R
CCCTGAACTGGTTGACTGTGCTTTA
CTTGTACTGGCTTGGCTAGGATAGG
64.7
63.2
173 bp
Hormone-sensitive lipase
HSL-F
HSL-R
CGCAAGATGATATGAGAATAACTGC
CCTCTGTGAAATGGGTACAAGAAGA
60.5
61.8
221 bp
fatty acid binding protein 6, ileal
iFABP6-F
iFABP6-R
AAGACTATCTCAGAGGTGCAGCAGG
CACGATCTCCGCAGTGTAGTTGTAG
63.4
63.2
210 bp
β-actin
β-actin-F
β-actin-R
GAATCTTGTGGCATCCACGAAACTA
GATGATCTTGATCTTCATCGTGCTG
64.5
62.8
183 bp
Table 3. Transcriptome assemblies.
SampleTotal NumberTotal LengthMean LengthN50N70N90GC (%)
Female 189,76688,972,8219912320105932350.91
Female 286,00082,641,3009602250100331451.13
Female 397,48594,156,799965225199631651.15
Male 137,90732,026,539844159377830852.47
Male 2102,959100,765,6779782363103031750.35
Male 3101,59498,586,3789702341101931450.96
Table 4. Summary for annotated databases.
Annotated DatabasesAnnotated Genes (Female/Male)Annotated PercentageTotal Annotated Genes/Percentage
All annotated unigenes109,043/110,35246.26%/44.84%119,039 (78.72%)
Nr 49,794/48,80145.66%/44.22%61,071 (40.39%)
SwissProt43,277/42,21239.69%/38.25%52,607 (34.79%)
KEGG39,796/38,73236.50%/35.10%48,051 (31.78%)
COG19,206/18,72417.61%/16.97%23,017 (15.22%)
GO 5564/54805.10%/4.97%6563 (4.34%)
Publisher’s Note: MDPI stays neutral with regard to jurisdictional claims in published maps and institutional affiliations.

