Article

Effect of Dietary Plant Feedstuffs and Protein/Carbohydrate Ratio on Gilthead Seabream (Sparus aurata) Gut Health and Functionality

by
Catarina Basto-Silva
1,2,*,†,
Irene García-Meilán
3,†,
Ana Couto
1,2,
Cláudia R. Serra
1,2,
Paula Enes
1,2,
Aires Oliva-Teles
1,2,
Encarnación Capilla
3 and
Inês Guerreiro
1
1
CIIMAR—Interdisciplinary Centre of Marine and Environmental Research, University of Porto, 4050-208 Matosinhos, Portugal
2
FCUP—Department of Biology, Faculty of Sciences, University of Porto, 4169-007 Porto, Portugal
3
Department of Cell Biology, Physiology and Immunology, Faculty of Biology, University of Barcelona, 08028 Barcelona, Spain
*
Author to whom correspondence should be addressed.
These authors contributed equally to this work.
Fishes 2022, 7(2), 59; https://doi.org/10.3390/fishes7020059
Submission received: 14 January 2022 / Revised: 4 March 2022 / Accepted: 4 March 2022 / Published: 7 March 2022

Abstract

:
This study investigated, for the first time, the integrated effects of dietary protein source and protein/carbohydrate (P/CH) ratio on gilthead seabream gut histomorphology, microbiota composition, digestive enzymes activity, and immunological and oxidative stress-related gene expressions. Four isolipidic diets: two fishmeal-based (FM) and two plant feedstuff (PF)-based diets, with P/CH ratios of 50/10 or 40/20 each (FM-P50/CH10; FM-P40/CH20; PF-P50/CH10; PF-P40/CH20), were tested. PF-based diets lead to more histomorphological alterations than FM-based diets. P/CH ratio had no relevant effect on gut histomorphology. Gut mucosa of fish fed PF-based diets presented a higher number of operational taxonomic units, and richness and diversity indices, while the P/CH ratio did not affect those parameters. The α-amylase activity was lower in fish fed with PF-based diets and in fish fed the P40/CH20 diets. Regarding the immune-related genes, only cyclooxygenase-2 was affected, being higher in fish fed the P50/CH10 diets than the P40/CH20 diets. Fish fed the FM-based diets presented higher expression of glutathione reductase and glutathione peroxidase, while fish fed the P50/CH10 diet had higher expression of superoxide dismutase. In conclusion, PF-based diets can compromise gut absorptive and digestive metabolism, but decreasing the dietary P/CH ratio had little effect on the parameters measured.

Graphical Abstract

1. Introduction

Fishmeal (FM) was traditionally used as the main and most adequate protein source for carnivorous fish due to its high quality, high digestibility, and good palatability [1,2,3]. Presently, its use is in a clear downward trend [4]. This reduction is largely due to supply and price variation, coupled with the continuously increasing demand from the aquafeed industry [4]. Hence, the use of plant feedstuffs (PF) and the inclusion of carbohydrate (CH) sources in fish feeds have been good alternatives to, respectively, decreasing dietary FM inclusion as a protein source and spare protein use for growth [5,6,7,8,9,10]. Gilthead seabream (Sparus aurata), one of the species with higher production in Europe, seems able to cope with a total replacement of dietary FM by PF [9]. This species requires about 45% of dietary protein [11]. However, if digestible CHs are provided in a suitable quantity, dietary protein might be spared for growth instead of being used as an energy source and, therefore, reduce nitrogen wastes and dietary costs [6,7,12]. Nonetheless, the maximum dietary CH inclusion that does not cause negative effects in gilthead seabream is limited to 20% [7]. Higher dietary CH inclusion may compromise growth and the digestive and absorptive capacities [6,12]. Several studies with gilthead seabream were already conducted to separately evaluate the effects of dietary inclusion of PF and the protein-sparing by CHs. Overall, results showed that PF-based diets often promoted gut morphological changes, modifications on microbiota composition, decreases in gut enzymatic activity, and increases in oxidative stress of fish [9,13,14,15,16,17,18,19,20,21]. The inclusion of 20% or more of dietary CHs also affected fish growth performance, digestive enzyme activities, and antioxidant status [7,22,23,24]. However, the interactive effects on gut functionality and the health of gilthead seabream fed diets with lower P/CH ratios and the replacement of FM by PF as a major dietary protein source has not received much attention, and the available information is somehow dispersed. For instance, Castro et al. [25] did not observe major changes in gut histomorphology, microbiota, α-amylase, and lipase activities of gilthead seabream fed diets with highly different P/CH ratios (50/17 and 66/0). Similarly, in the same species, Couto et al. [26] and Fountoulaki et al. [27] also did not find an effect of the dietary P/CH ratio on the proteolytic and amylolytic activities, nor did Castro et al. [23] on the gut oxidative status, or antioxidant enzymes activities. All these studies evaluating different dietary P/CH ratios were made with FM as the main dietary protein source. To our knowledge, only one study is available that evaluated dietary P/CH ratios using PF as the main protein source [12]. In this study, the authors reported that fish fed a P40/CH39 diet had higher lipase and trypsin activities and lower α-amylase activity than those fed a P46/CH19 diet.
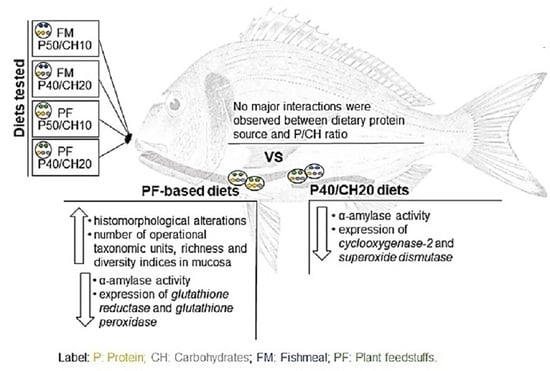
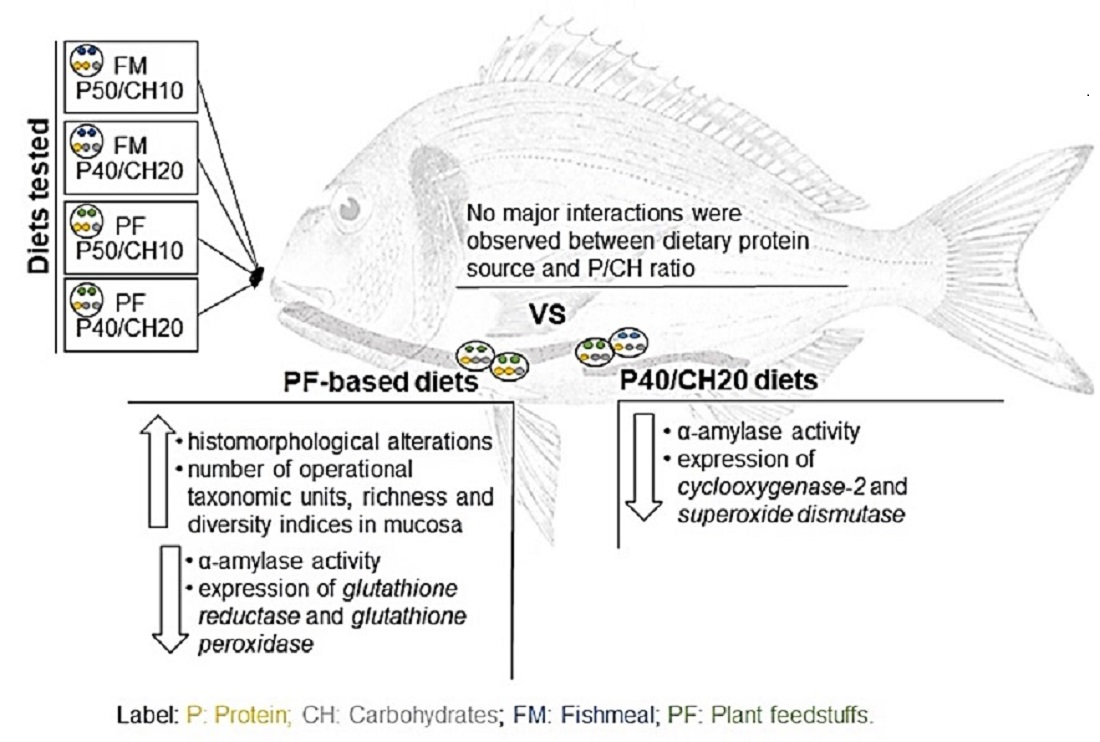
Recently, we assessed the effects of FM- or PF-based diets with different P/CH ratios (50/10 and 40/20) in gilthead seabream growth, feed utilization, appetite regulation, and intermediary metabolism [28]. Results showed that diets only slightly modified fish appetite and metabolic parameters, although growth was higher in fish fed the FM-P50/CH10 diet than those fed the FM-P40/CH20 diet. Further, reducing the dietary P/CH ratio led to a decrease in the feed efficiency and an increase in the protein efficiency ratio.
The present study is a follow-up to our previous study [28]. While the previous study aimed to evaluate the effect of dietary protein sources (FM vs. PF) and P/CH ratio on gilthead seabream appetite regulation and intermediary metabolism, the present study aims to evaluate, for the first time, the effects of these factors (dietary protein source and P/CH ratio) on gilthead seabream gut function and health, by assessing gut histomorphology, gut microbiota composition, digestive enzymes activity, and gut immunological and oxidative stress genes expression.

2. Materials and Methods

2.1. Diets

Four isolipidic diets (18% crude lipids) were formulated to contain 100% FM or 20% FM + 80% PF as protein sources, and protein to carbohydrate (P/CH) ratios of P50/CH10 or P40/CH20 (diets FM-P50/CH10, FM-P40/CH20, PF-P50/CH10, and PF-P40/CH20). Details of diets, ingredient composition, and a proximate analysis are presented in the supplementary material (Table S1).

2.2. Experimental Conditions and Sampling

Fish-rearing conditions are described in detail in Basto-Silva et al. [28]. Briefly, 180 gilthead seabream (140 ± 0.1 g, initial body weight) were randomly distributed to twelve 300-L water capacity tanks in a temperature-controlled recirculation life-support system. The diets were randomly distributed to triplicate groups, and fish were fed with the corresponding diet by hand until apparent visual satiation—two meals per day, for 41 days, 6 days a week. The length of the trial was chosen based on previous studies conducted on fish, also including gilthead seabream, which show that this duration was enough to induce dietary effects at intestinal level [17,29].
At the end of the 41 days, 6 fish per tank were sampled 5 h after the first meal of the day and euthanized with a sharp blow to the head (Figure 1). Three fish were sampled for midgut, pyloric caeca (PC), and stomach, all with digestive content, for digestive enzymes evaluation. From the same fish, midgut and PC were also collected for histomorphology evaluation. The remaining 3 fish were sampled to collect midgut to perform gene expression analysis. Two of these three fish were also sampled for allochthonous (digesta) and autochthonous (mucosa) microbiota characterization. Digesta samples were collected by squeezing the entire gut, and mucosa samples were obtained by scrapping the internal surface of gut. Midgut was considered as the portion which began after the PC and finished before the hindgut, which is the final section of the gut [30], and the portions collected were the ones from the beginning of the midgut. Samples for enzymes activity and microbiota characterization were immediately frozen in liquid nitrogen and stored at −80 °C until analyses. Histology and gene expression samples were freed from the adjacent adipose and connective tissue, rinsed in phosphate-buffered saline (PBS), and the excess PBS was removed using a paper towel before being stored. Histology samples were fixed in phosphate-buffered formalin (4%, pH 7.4) for 24 h and then transferred to ethanol (70%) until further processing. Samples for gene expression were stored in RNA later, left at 4 °C overnight, and afterwards stored at −80 °C until analysis.

2.3. Histological Evaluation

PC and midgut samples were processed and sectioned using standard histological techniques, stained with hematoxylin and eosin, and evaluated through a blinded semi-quantitative method, as described in Castro et al. [25], with slight modifications, namely, considering the nucleus position and hyper-vacuolization within the enterocytes. A score of 1 was given to the tissue with the least changes, and subsequent scores (up to 5) accounted for increasing histomorphological alterations, as described by Penn et al. [31]. Digital images were acquired with Zen software (Blue Edition; Zeiss, Jena, Germany), and using a light microscope Axio Imager.A2 (Zeiss, Oberkochen, Germany).

2.4. Microbial Diversity Analysis

Digesta and mucosa samples of the 2 fish per tank were pooled to reduce individual variation, accounting for n = 3 per treatment, each representing the microbial community of 6 fish. DNA extractions, polymorphism analyses of 16S rRNA genes by denaturing gradient gel electrophoresis (DGGE), band excisions, and re-amplifications were performed as described by Castro et al. [25], with each PCR product being loaded on a polyacrylamide gel at 8%, made of a denaturing gradient of 30 to 60% 7 M urea/40% formamide. Amplicons were sequenced to identify microbiota operational taxonomic units (OTUs), and a phylogenetic analysis was performed to identify the closest known species as described in Castro et al. [25].

2.5. Digestive Enzyme Activities and Zymograms

All samples were individually homogenized with a Ystral homogenizer—Laboratory Series X10 (Ballrechten-Dottingen, Germany) in 4 parts of ice-cold 50-mM Tris-HCl buffer pH 7.5, containing 0.1 mM EDTA (reference code E5134, Sigma-Aldrich, Sintra, Portugal), and 0.1% (v/v) Triton X-100 (reference code T8787, Sigma-Aldrich, Sintra, Portugal). Homogenates were centrifuged (30,000× g, 30 min, 4 °C) and supernatants were recovered and stored at −80 °C until use.
Pepsin activity was measured in the stomach, as described in Alarcón et al. [32], total protease activity was measured in PC and midgut, as described in Moyano et al. [33], and lipase (EC 3.1.1.3) and α-amylase (EC 3.2.1.1) activities were measured in PC and midgut using commercial kits from Spinreact (Girona, Spain), with code #1001275 and #41201, respectively.
Pepsin and proteolytic activities were expressed as units (U) per mg of soluble protein, and α-amylase and lipase as mU per mg of soluble protein, with one U of enzyme activity defined as the amount of enzyme that catalyzes the hydrolysis of 1 μmol/min of the substrate at the assay temperature.
Protein concentration of the samples was measured according to Bradford [34], using a Sigma-Aldrich (Sintra, Portugal) protein assay kit (reference code B6916) and albumin bovine serum (BSA; reference code A4503, Sigma-Aldrich, Sintra, Portugal) as standard.
All enzyme activities were measured in a Multiskan GO microplate reader (model 51119200; Thermo Scientific, Nanjing, China).
Alkaline protease zymograms were obtained after resolving, by SDS-PAGE, the homogenates, as described in Castro et al. [35]. The commercial Precision Plus Protein™ All Blue Prestained Standard (reference code 1610373, Bio-Rad Laboratories Lda., Amadora, Portugal) was used to estimate the proteins’ molecular weight. The specific trypsin-like and chymotrypsin-like activities were identified based on García-Meilán et al. [24], where 6 bands with protease activity were identified in gilthead seabream. Coomassie-stained gels were imaged with a ChemiDoc XRS+ (Bio-Rad Laboratories Lda., Amadora, Portugal), and qualitatively evaluated by the presence or absence of bands.

2.6. RNA Extraction, cDNA Synthesis and Quantitative Real-Time PCR (qPCR)

The total RNA extraction from intestinal samples, the RNA concentration, the purity and integrity evaluation, the cDNA synthesis, and the quantitative real-time PCR (qPCR) were performed as described in Basto-Silva et al. [28]. The forward and reverse primers used (Table 1) were searched in the GenBank database [36], and their efficiency curves were evaluated according to the assay conditions. Most of the primers’ amplification efficiencies were between 90% and 110%, which are the recommended efficiency values [37]. However, as not all used primers conform to this criteria, we used the Pfaffl method [38] to ensure the robustness of the data. The Bio-Rad CFX Manager 3.1 (California, CA, USA) was the software used to measure the expression levels. Elongation factor 1α (ef1α) and ribosomal protein S18 (rps18) were used as reference genes.

2.7. Statistical Analysis

Statistical analyses were completed using SPSS 25 software package for Windows (IBM® SPSS® Statistics, New York, NY, USA). Homogeneity of variances and data normality were tested by the Levene and Shapiro–Wilk tests, respectively. When normality was not verified, data were transformed before ANOVA. However, all data are presented as the mean and standard error of the mean (SEM), without any transformation. Differences were considered statistically significant at p < 0.05.
Since histological data was not normal nor homogenous even after transformation, statistical analysis of the histomorphology evaluation was completed by the non-parametric Kruskal–Wallis test, followed by all-pairwise comparisons. Furthermore, the significance values were adjusted by the Bonferroni correction for multiple tests.
The remaining data were evaluated by two-way ANOVA tests, with the protein source and P/CH ratios as factors. In the case of interaction between factors, one-way ANOVA was performed for the P/CH ratio within each protein source, and for the protein source within each P/CH ratio.
Statistical analysis related to the DGGE was performed as described in Castro et al. [25].

3. Results

During the trial, all experimental diets were well-accepted by the fish, and the fish survival rate was 100%. Results of the rearing trial were not the aim of this study and are presented elsewhere [28].
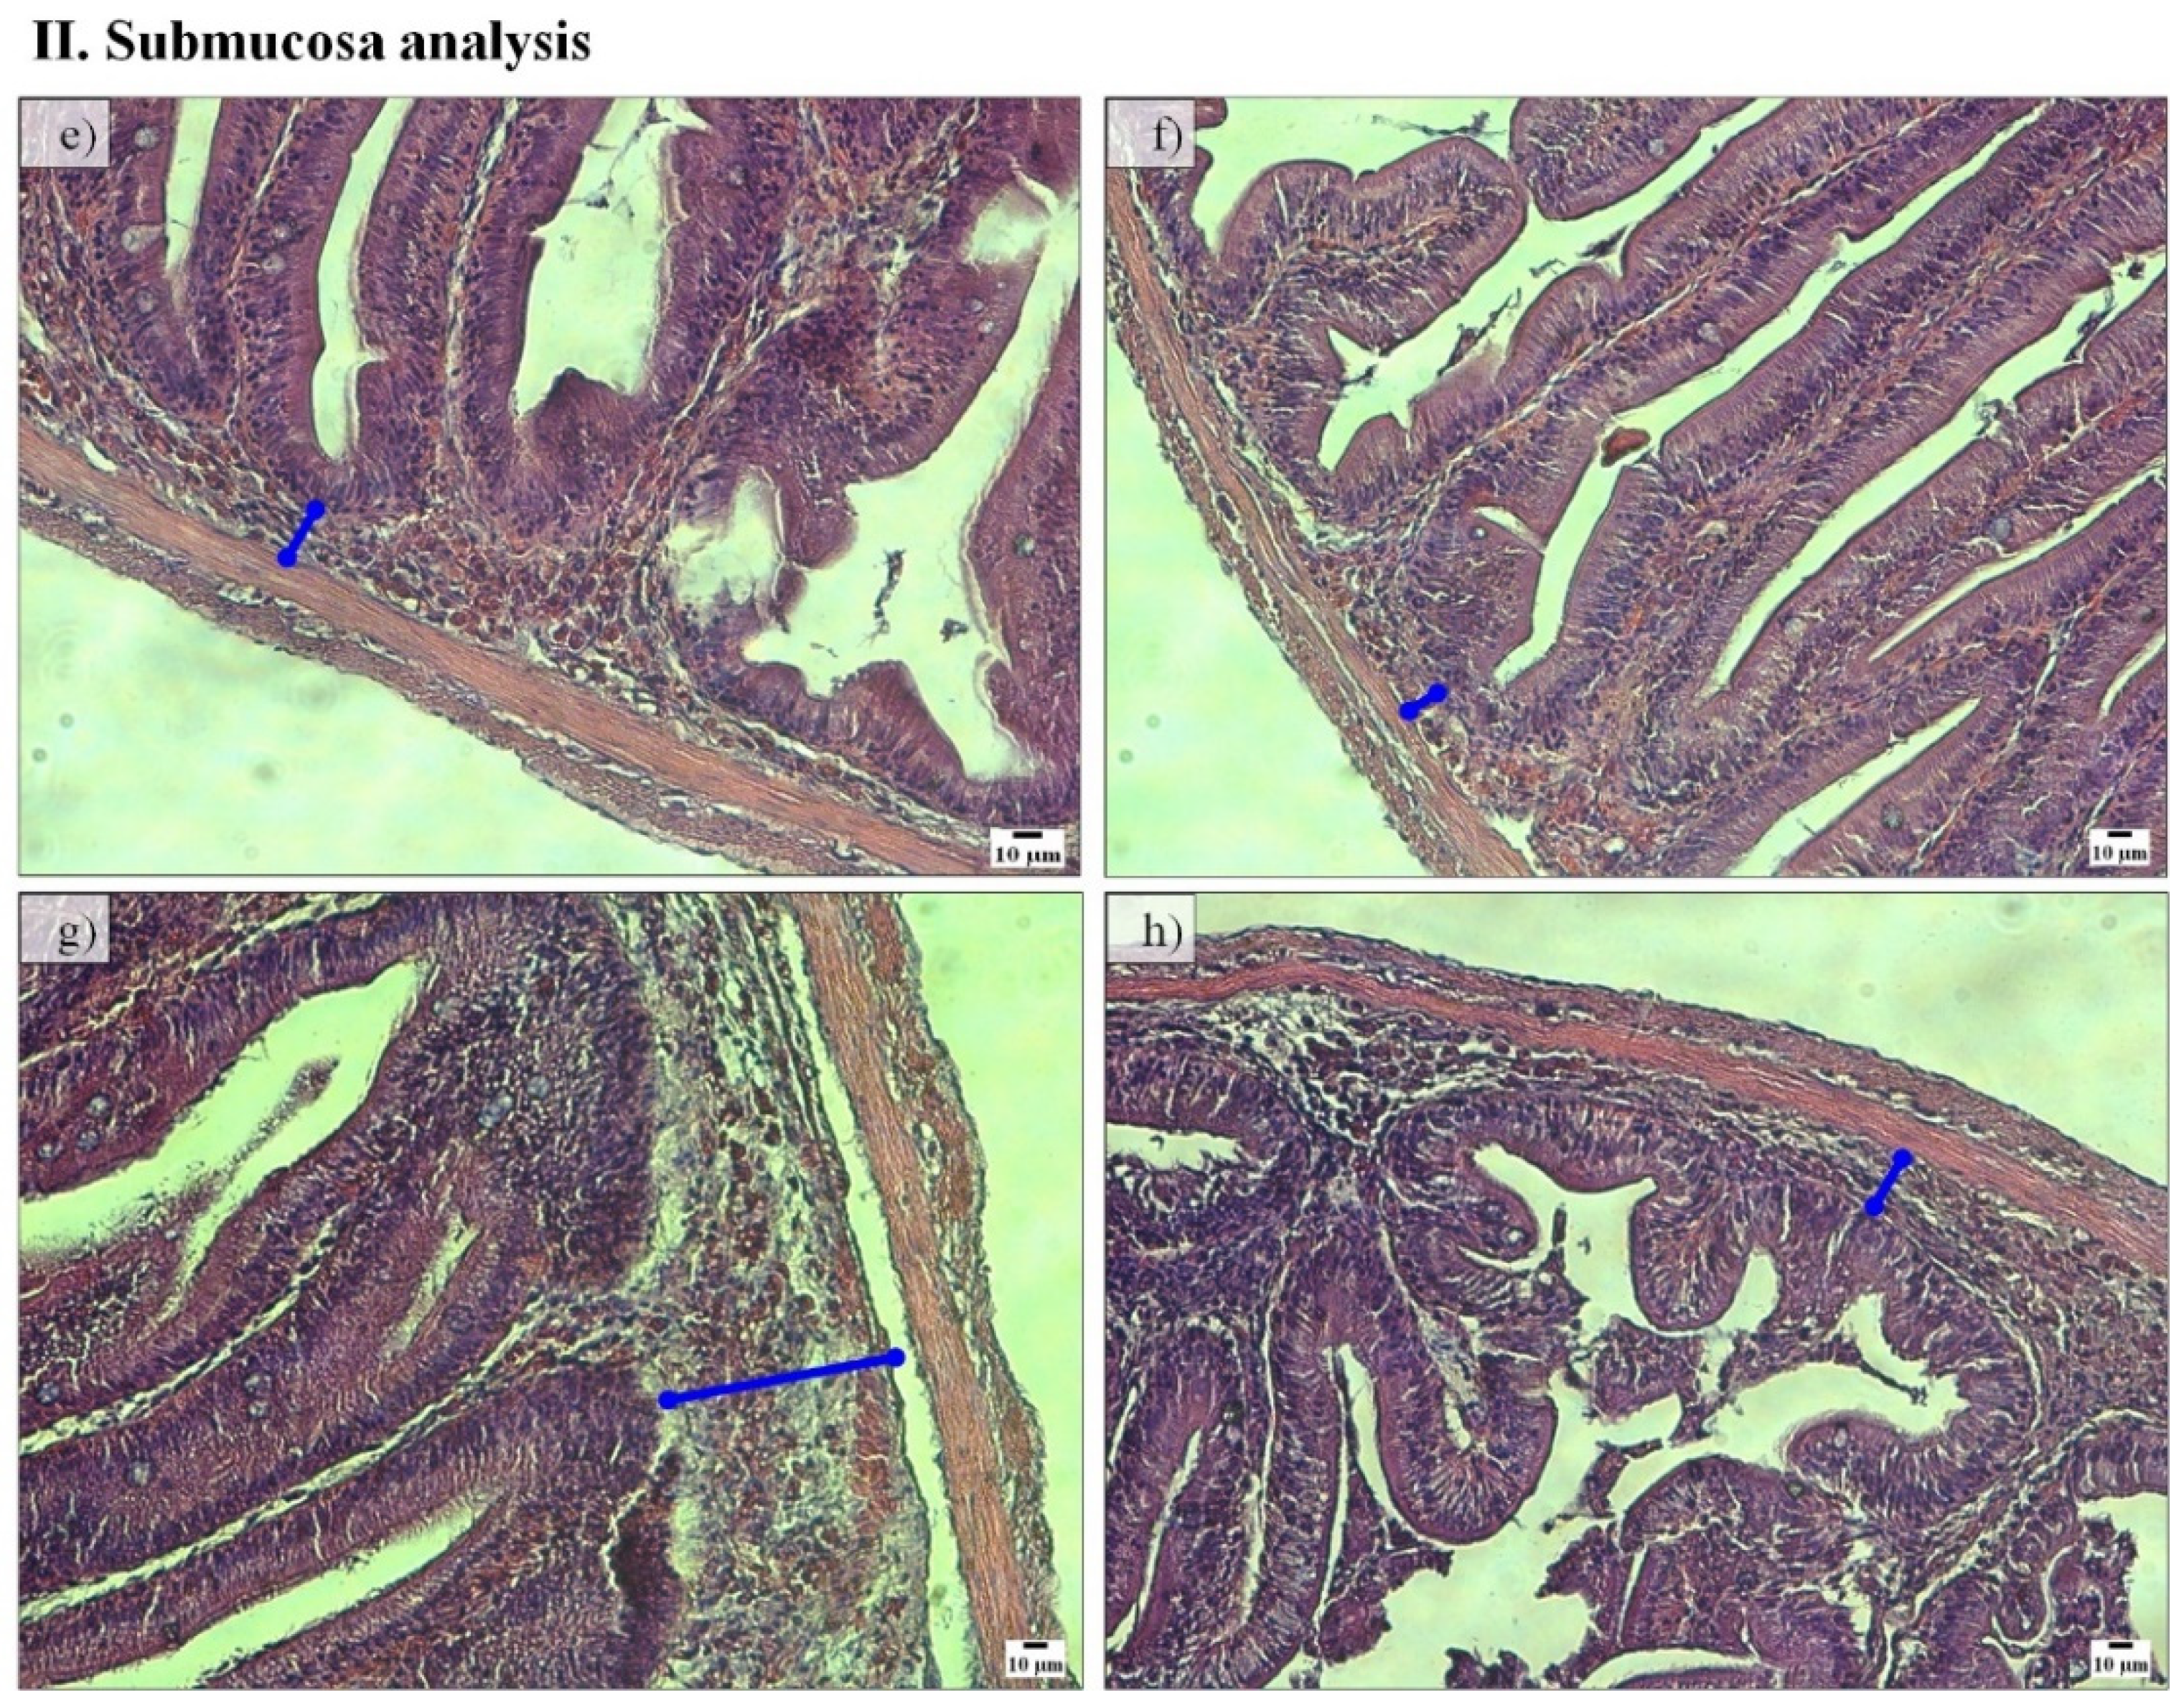
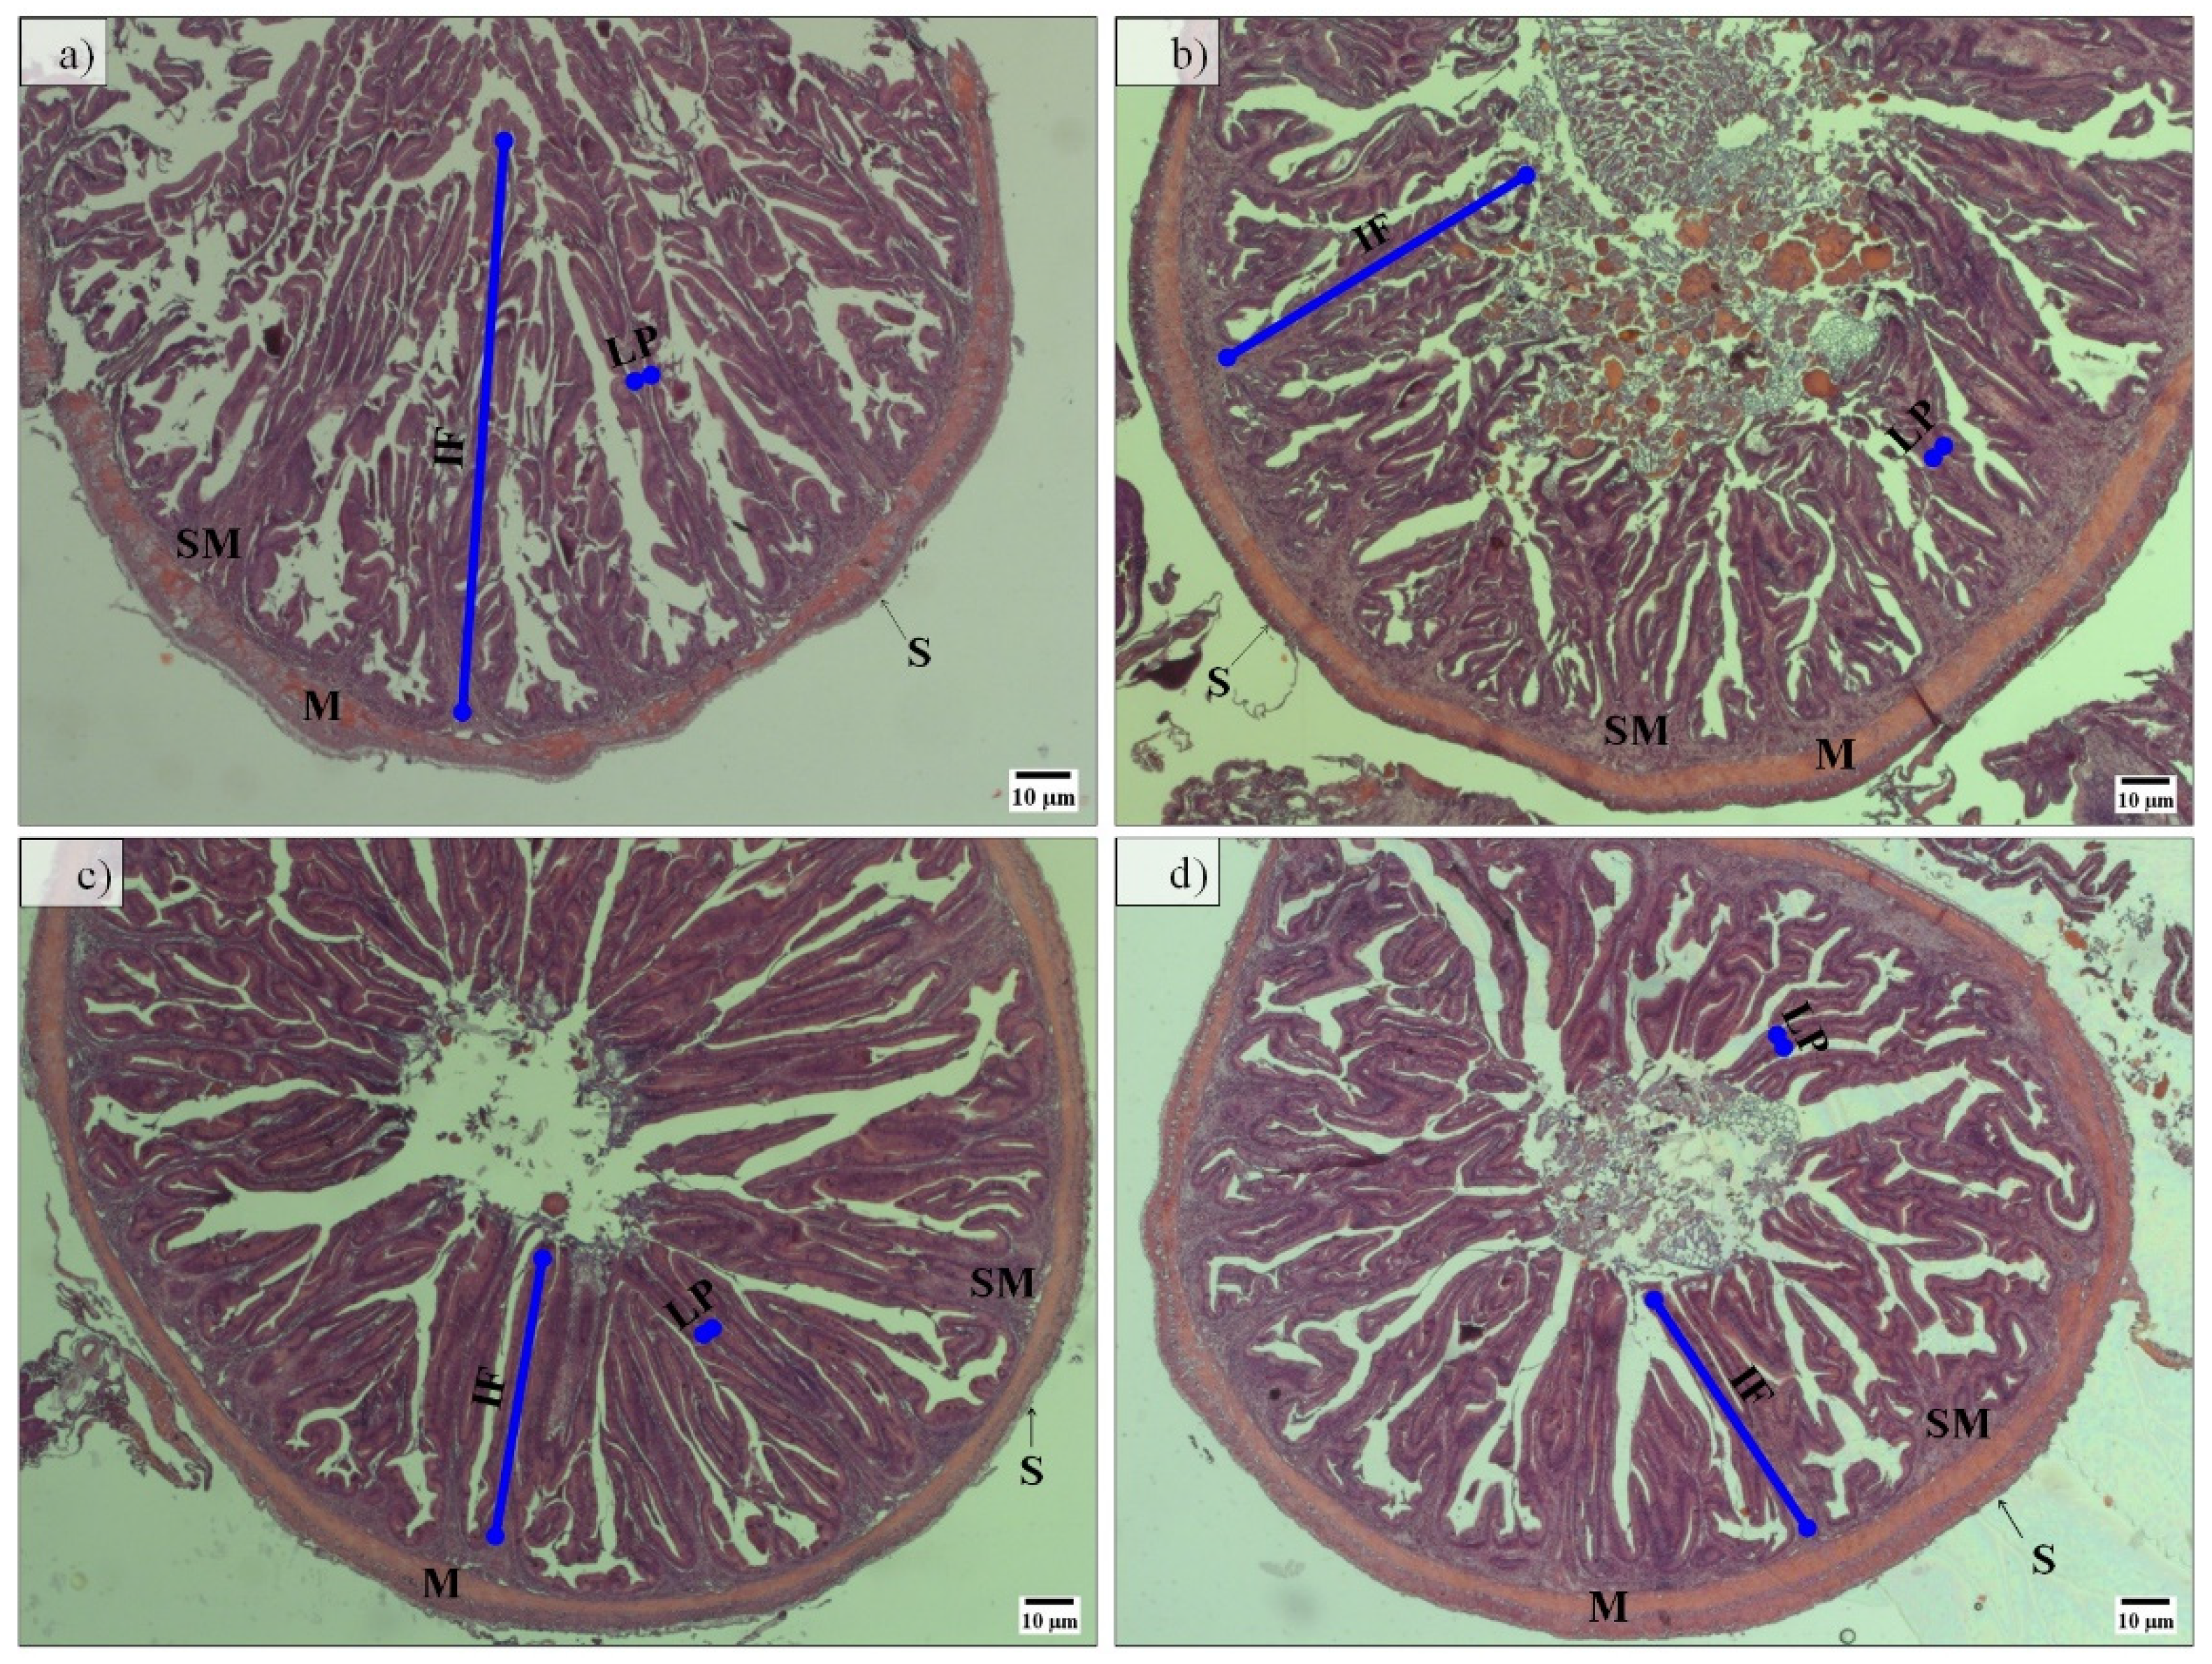
Regarding the PC histomorphology, fish fed the PF-P50/CH10 diet presented a higher total mean score (2.23) than those in the remaining experimental conditions, where the total mean score ranged between 1.78 and 1.88 (Table 2). Lamina propria width was higher in fish fed the PF-P50/CH10 diet than in those fed the FM-based diets (Figure 2I). Fish fed the PF-P50/CH10 diet also presented higher submucosa widths than those remaining in the experimental conditions (Figure 2II). Lamina propria cellularity was higher in fish fed the FM-P50/CH10 and PF-P50/CH10 diets than the FM-P40/CH20 diet. The enterocytes vacuolization was higher in fish fed the PF-based diets.
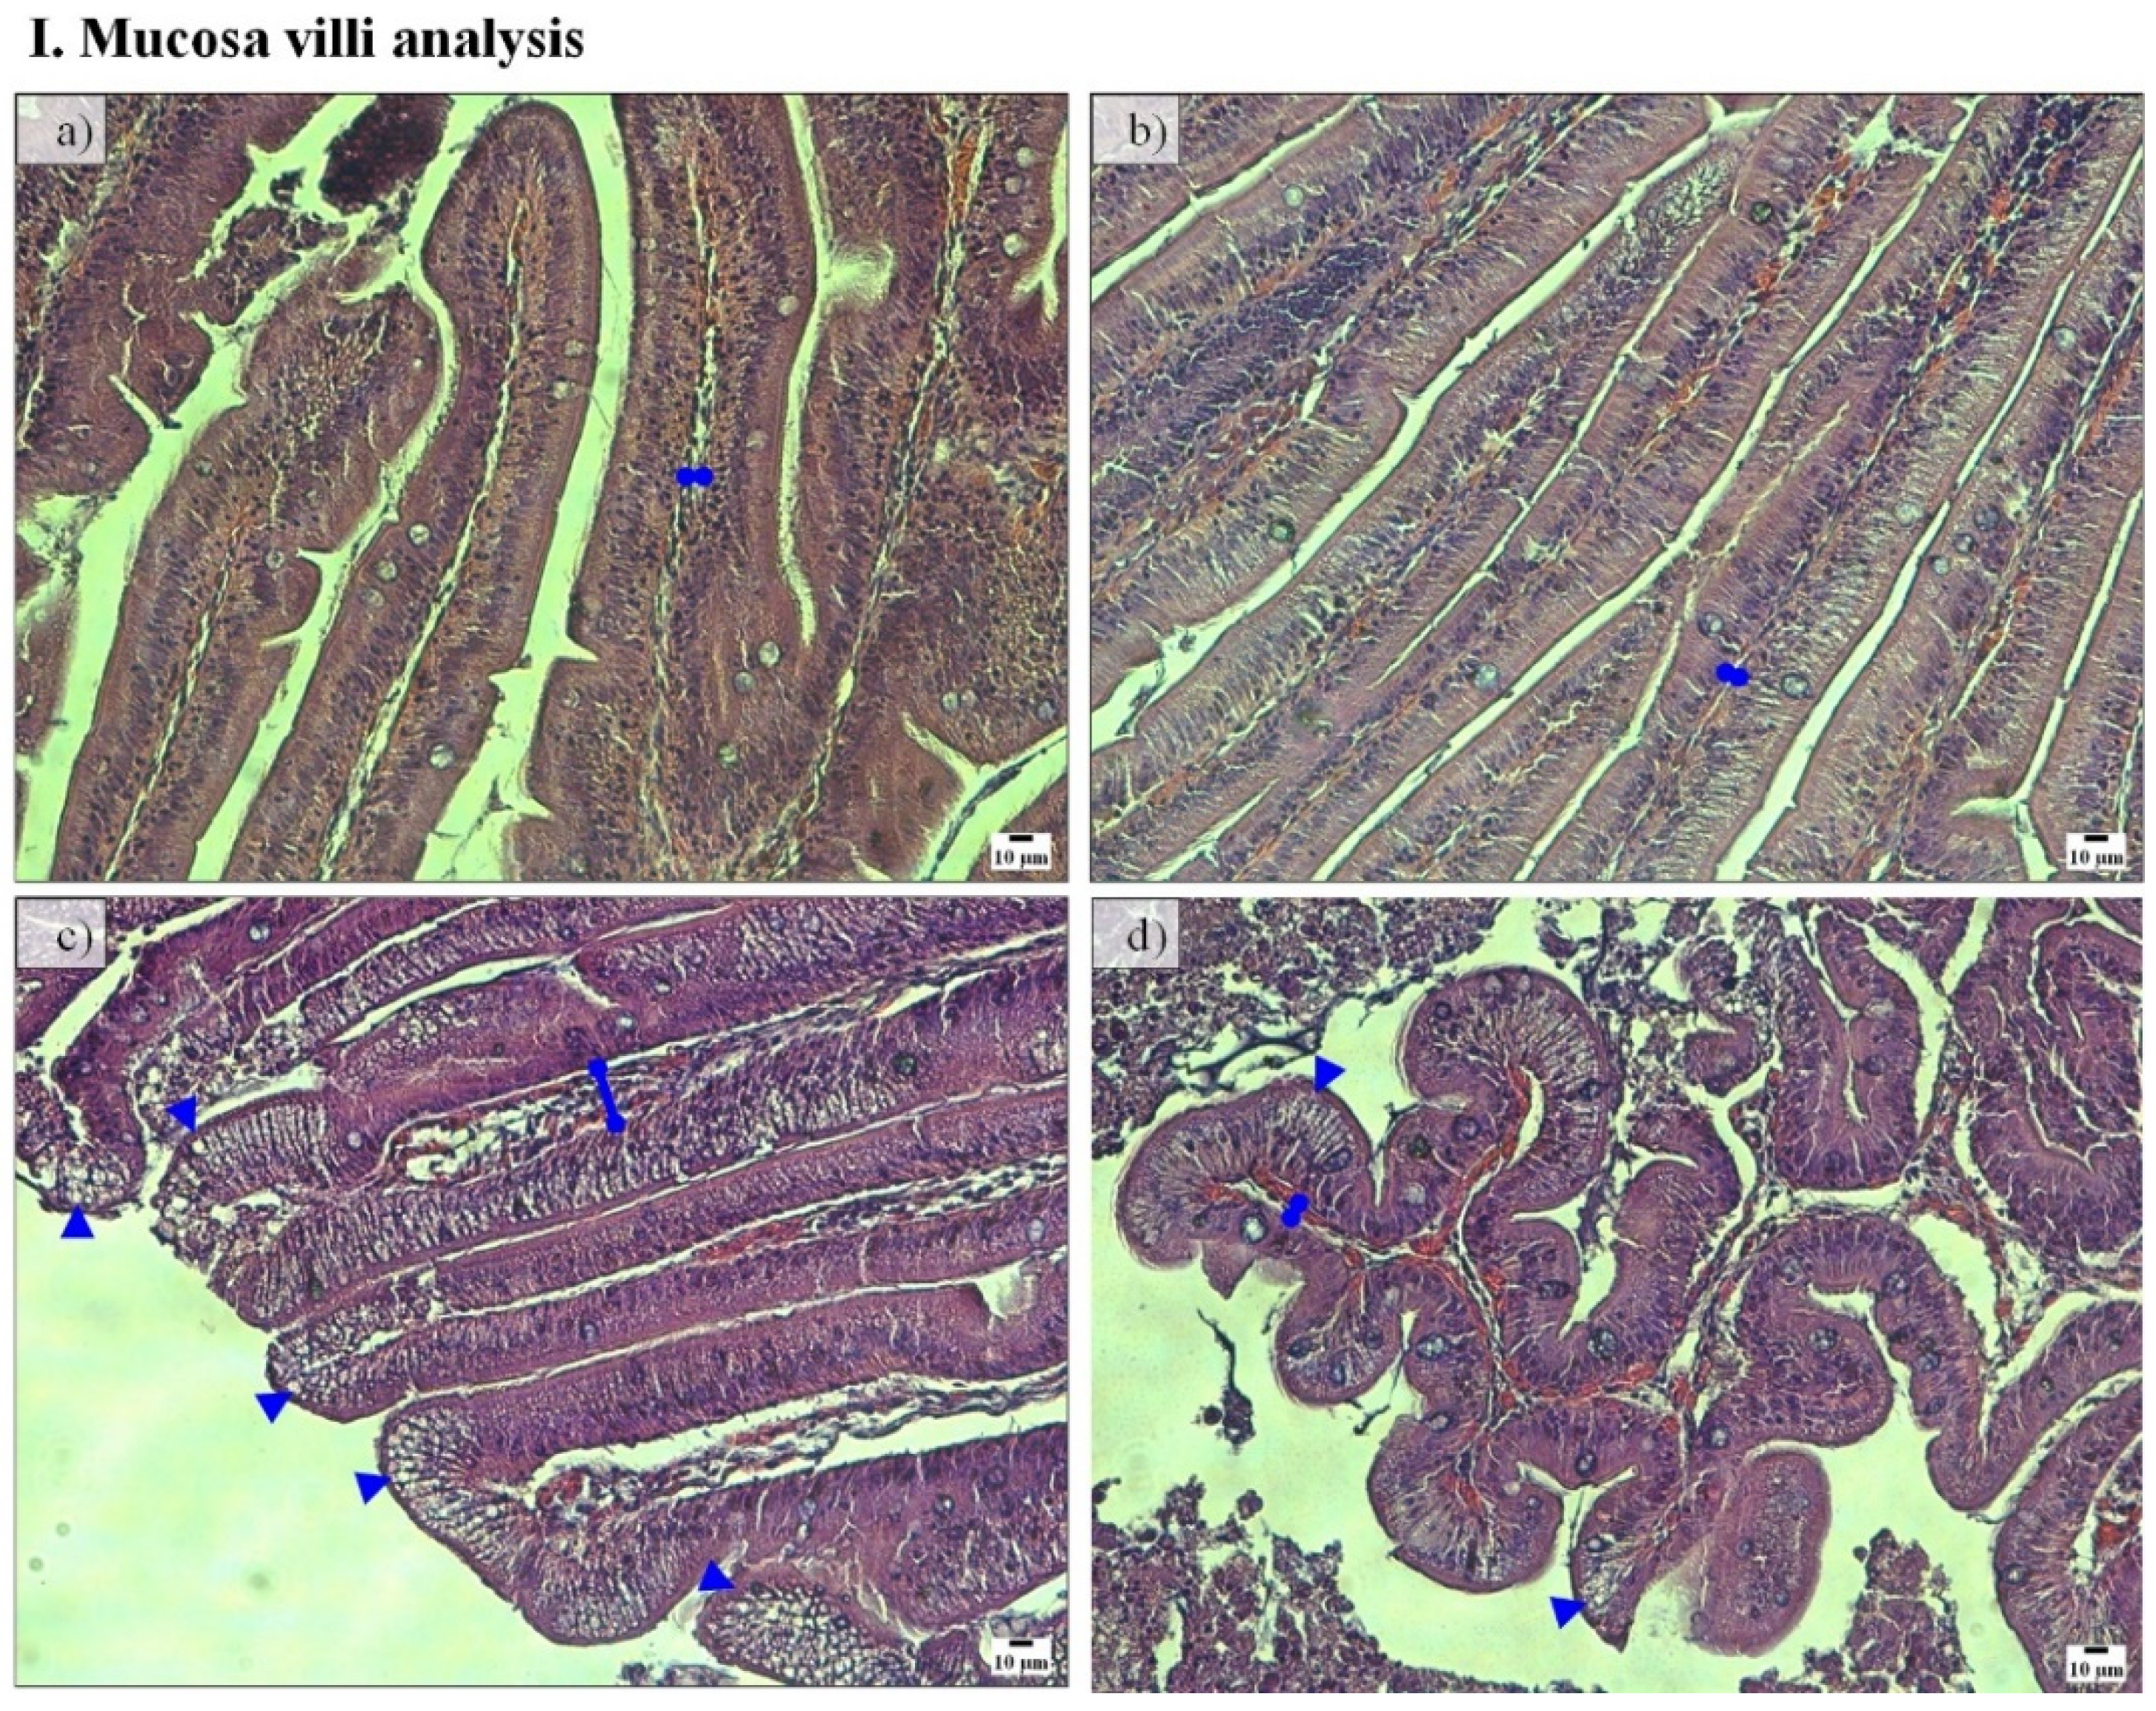
Regarding midgut histomorphology, fish fed the PF-based diets presented a higher total mean score (2.77) and gut fold height than fish fed FM-based diets, which have a total mean score of 2.28 (Figure 3 and Table 3). No further differences between groups were detected.
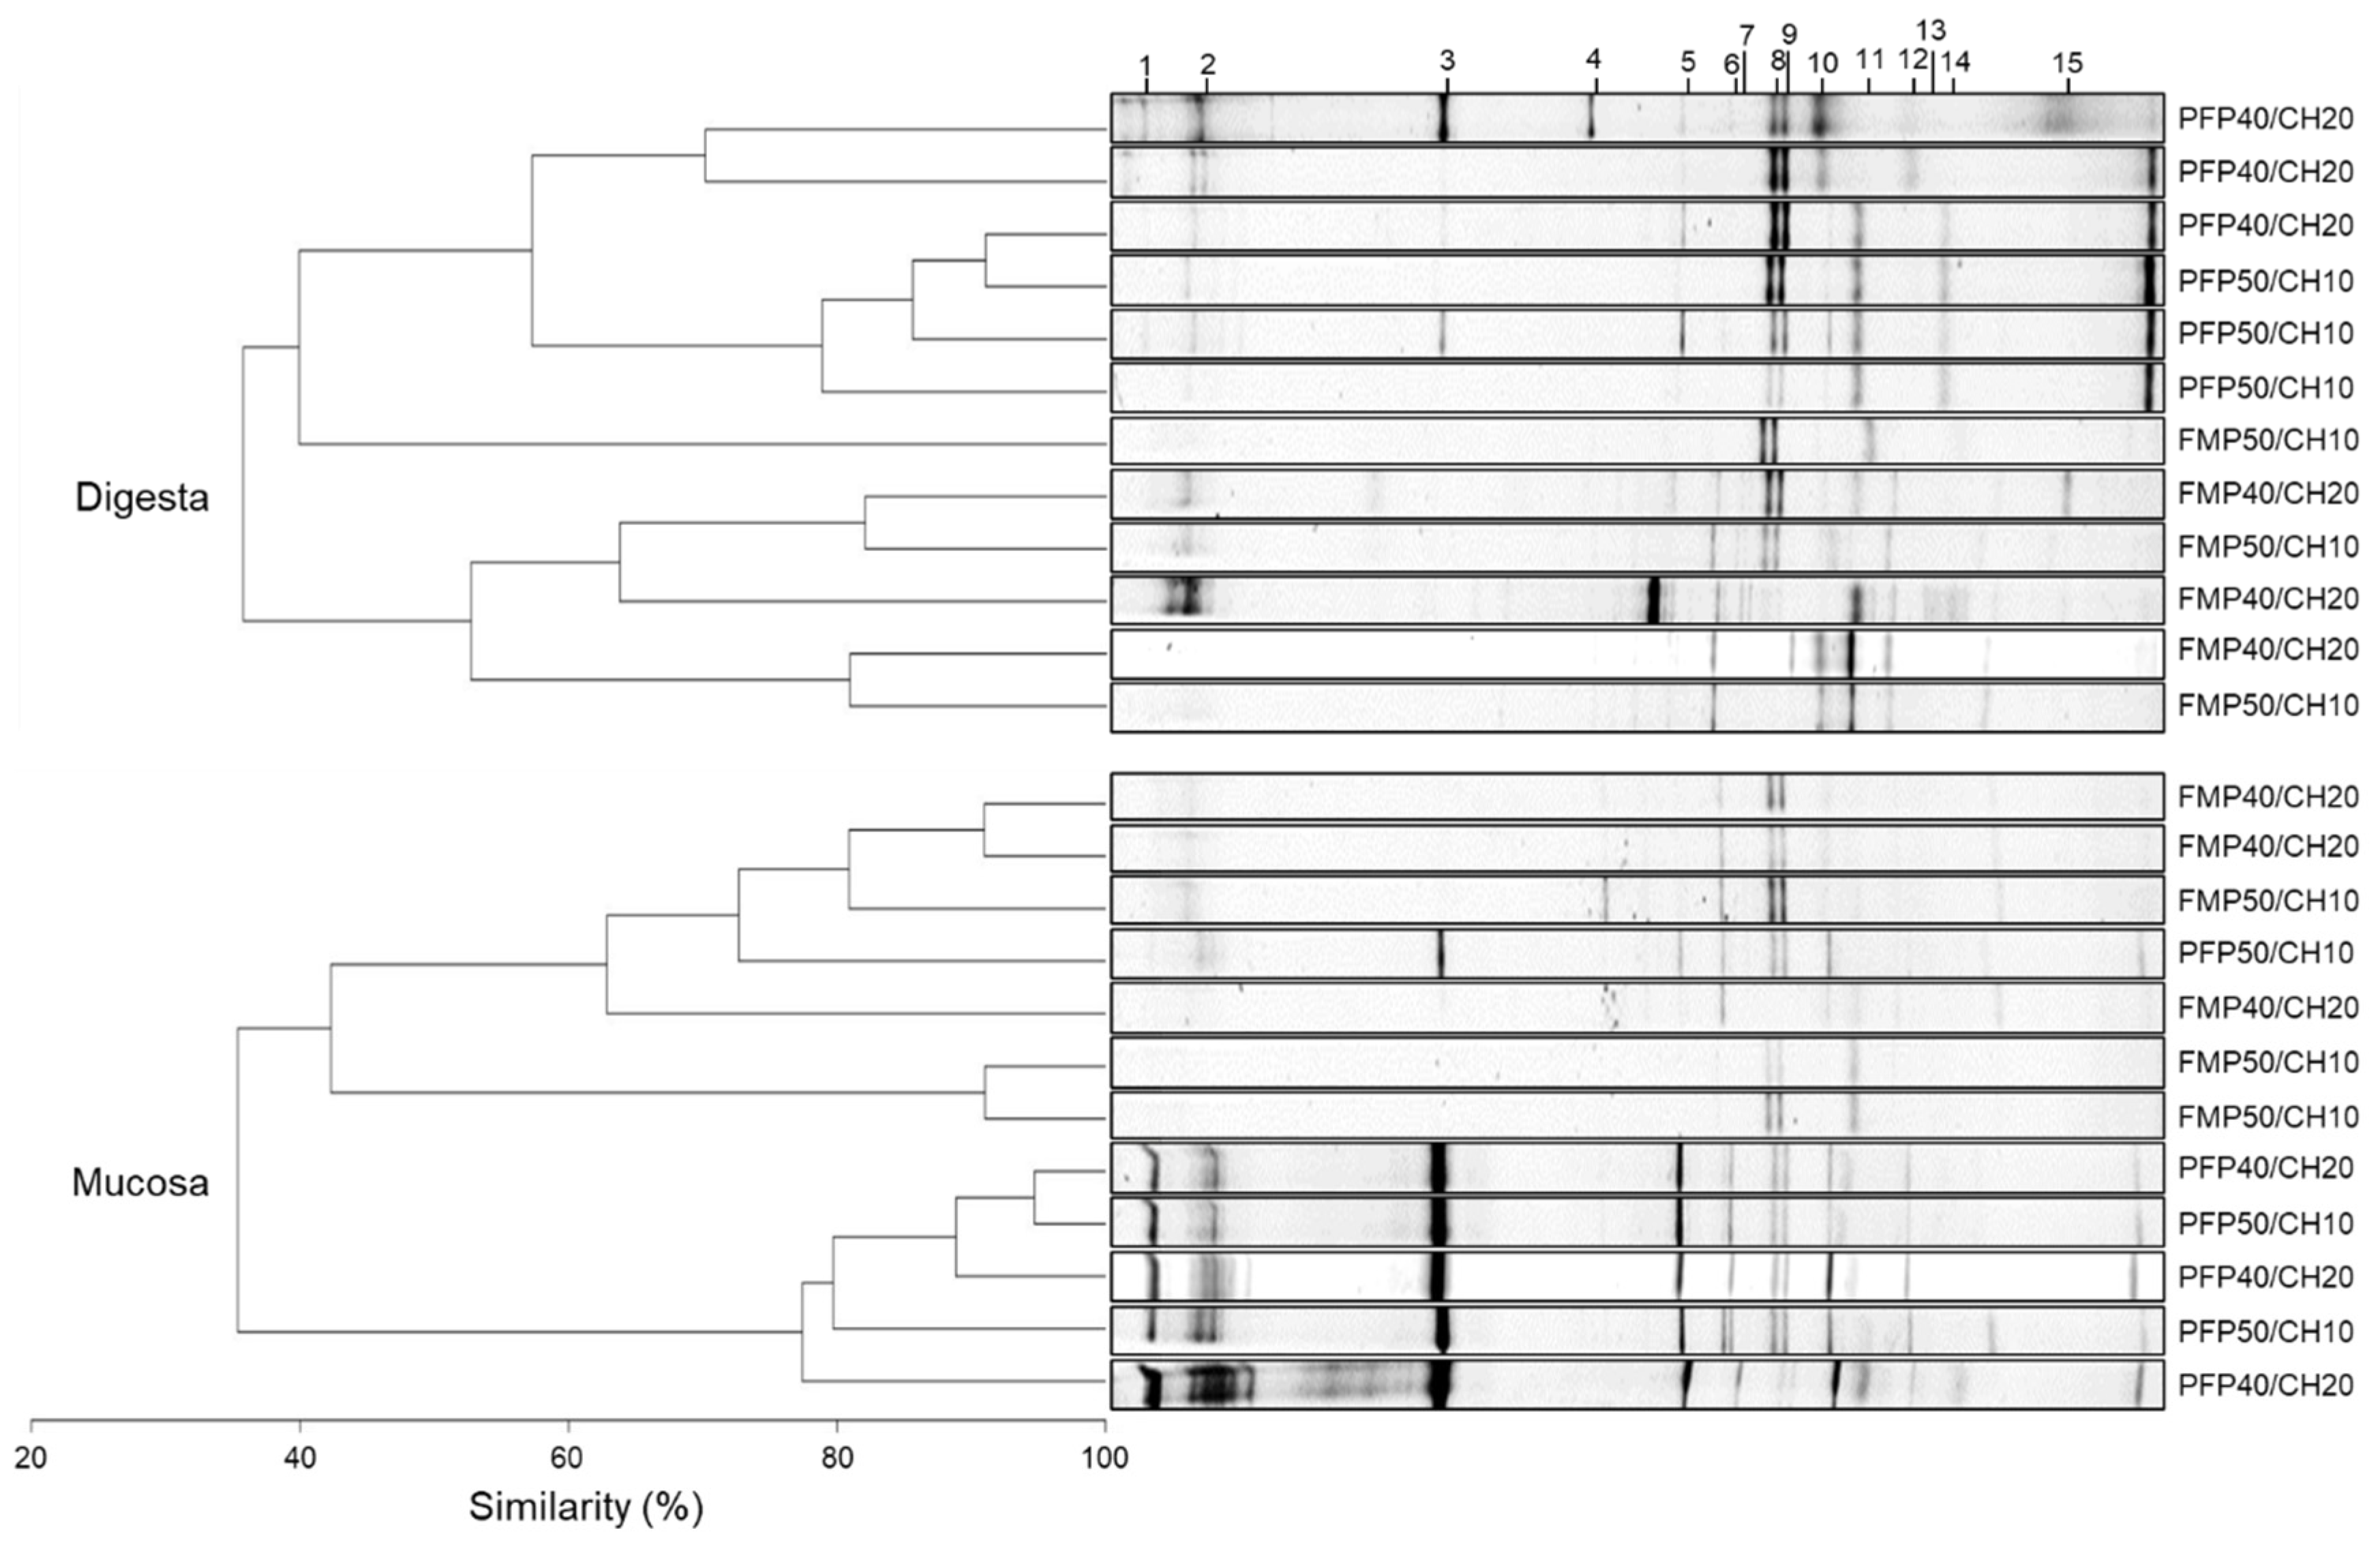
DGGE fingerprints of the hypervariable V3 region of the 16S rRNA genes present in digesta and mucosa gut samples revealed that, independently of the dietary treatment, gut bacterial communities maintained a similarity, near 40% within both gut samples (Figure 4). Moreover, two clusters were observed in both gut microbiota regions, corresponding to samples recovered from fish fed the FM- and the PF-based diets, except for the FM-P50/CH10 diet in the digesta, which did not cluster with the remaining FM-based diets, and the PF-P50/CH10 diet in the mucosa, which did not cluster with the remaining PF-based diets. Despite this clear cluster separation, in digesta samples, the dietary composition did not affect the average number of OTUs, richness, and diversity indices (Table 4). Only the similarity index was higher in fish fed PF-P50/CH10 than in fish fed the FM-P50/CH10 diet. In mucosa samples, PF-based diets led to a higher number of gut OTUs, richness, and diversity indices than FM-based diets, while the similarity index was not different between groups. Sequence analysis from DGGE-selected bands showed that the dominant allochthonous and autochthonous bacteria detected were either corresponding to uncultured bacteria not yet assigned to a specific taxon or were closely related to genera belonging to the phylum Firmicutes and Proteobacteria, namely, Lactobacillus, Pseudomonas, Klebsiella, and Vibrio (Table 5 and Figure 4). Except for band 15, which was only found in digesta, all other bands were detected in digesta and mucosa samples.
Concerning digestive enzymes, α-amylase activity was lower in fish fed the PF-based diets, for both PC and midgut, and in fish fed the P40/CH20 diet only in the PC (Table 6). Proteolytic activity was higher in the PC of fish fed the P50/CH10 diet, but only within the PF-based diet-fed fish. Pepsin and lipase activities were not affected by dietary composition.
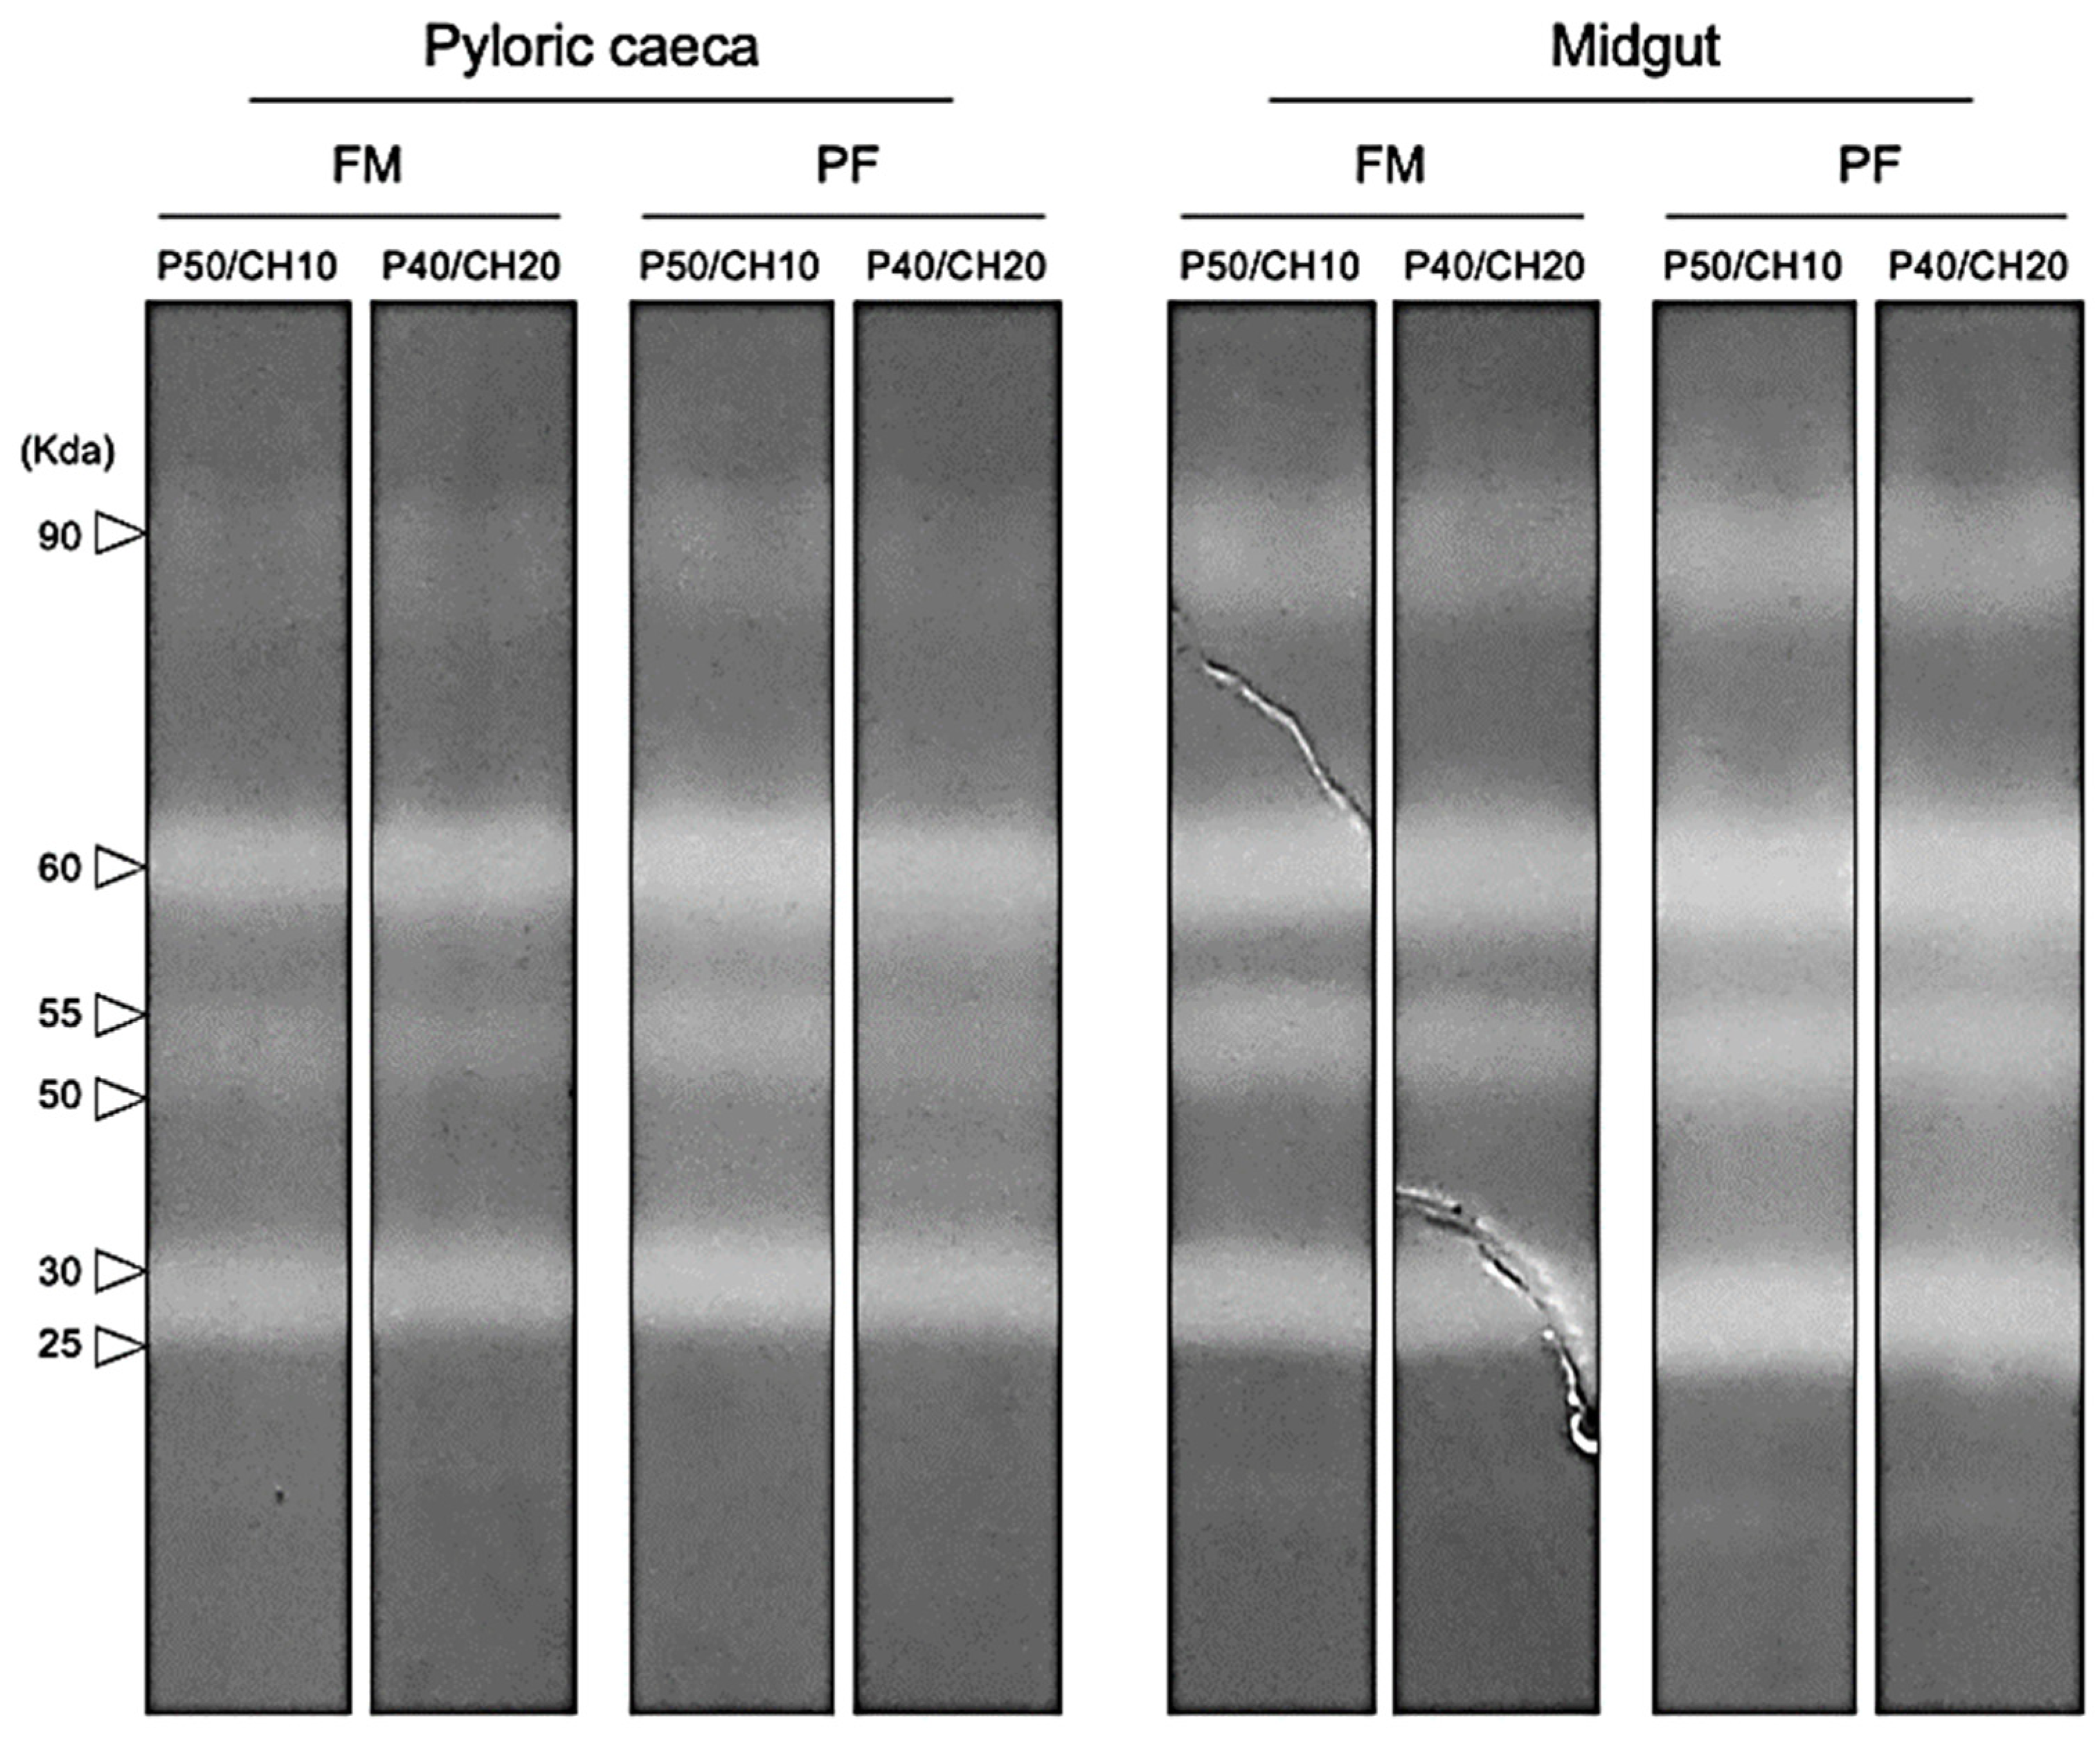
Alkaline protease zymograms, from both PC and midgut, revealed the presence of six bands with proteolytic activity against casein, three identified as trypsin-like proteases (90, 60, and 55 KDa), and the other three as chymotrypsin-like proteases (50, 30, and 25 KDa). All treatments presented the same number of proteolytic bands (Figure 5).
Concerning immune-related gene expressions, only cyclooxygenase-2 (cox2) presented significant changes, being higher in fish fed the P50/CH10 diet (Table 7). Gene expression of immunoglobulin M heavy chain (igM), interleukin-1β (il1β), and tumor necrosis factor-α (tnf-α) was not affected by dietary composition.
Regarding the oxidative stress-related genes, PF-based diets led to a lower expression of glutathione reductase (gr) and glutathione peroxidase (gpx1), while superoxide dismutase (sod) expression was lower in fish fed the P40/CH20 diet. The gene expression of 70 kilodalton heat shock proteins (hsp70) and catalase (cat) was not affected by dietary composition.

4. Discussion

The presence of antinutritional factors on PF, namely, in soybean products, was reported as leading to gut inflammation in gilthead seabream [15,18,20,21,39]. Among the observed gut morphological alterations caused by soybean meal were a decrease in gut fold height, an enlargement of submucosa and lamina propria, an increased number of inflammatory cells on tissues, and modifications on enterocytes vacuolization [15,18,20,21]. Although we have assessed the midgut and PC, and previous studies analyzed the distal gut, the present results agree with the reported observations in this species, since fish fed the PF-P50/CH10 diet, which has a higher soybean meal content (25% compared with 19% for PF-P40/CH20, and no soybean meal content for FM-based diets), also presented more histological alterations when compared with fish fed the other diets. The histological modifications observed in the midgut and PC were mainly in gut fold height, width and cellularity of lamina propria, width of the submucosa, and/or in enterocytes vacuolization. Similarly, gilthead seabream juveniles fed 30% soybean meal presented a moderately and diffusely expanded distal gut lamina propria [14], while juveniles fed soy saponins and phytosterols presented histomorphological alterations of the intestinal mucosal structure [17]. Nonetheless, during the on-growing period (fish of similar sizes to those of the present study) gilthead seabream showed a high tolerance to soy saponins and phytosterols [29]. This indicates that fish responses can be different, depending on the life stage, dietary ingredients/antinutrients combinations, and intestine portions.
Moreover, in the present study, PC seemed to be more sensitive to dietary composition changes than midgut, where fewer histomorphological alterations were observed. This agreed with the study of Couto et al. [29], which observed that dietary soy saponins and phytosterols affected PC histomorphology but not the distal gut of on-growing gilthead seabream.
However, it is important to add that the observed histomorphology modifications were not enough to consistently affect gilthead seabream growth [28]. Nonetheless, a longer experimental trial could have exposed those differences.
The composition of gut microbiota also affects gut functionality since, for instance, bacteria might have a role in nutrients’ digestion and immune functions, being affected by diet composition [39]. In the present study, protein source was the single factor affecting gut microbiota. The only detectable effect on digesta microbiota was an increase of the similarity index in fish fed the PF-P50/CH10 diet, indicating that this diet might modulate gut bacteria populations towards a higher similarity between samples. The absence of any other major effect on digesta microbiota in fish fed different dietary compositions was previously observed in gilthead seabream [25]. This lack of effect could be expected, since digesta microbiota comprises transient (allochthonous) microorganisms, which are often surrounded by the resident microbiota to the gut wall and, thus, do not last a long time in the gut [40].
The higher number of OTUs, richness, and diversity indices observed in the mucosa microbiota of fish fed the PF-based diets agree with what was previously reported for this species, at the juvenile stage, fed soybean meal-based diets compared with FM-based diets [16], and for other species also fed PF-based diets, such as Senegalese sole (Solea senegalensis) and Atlantic salmon [41,42,43]. These results could be explained by the presence of non-digestible carbohydrates on PF, which provide the required substrate for gut bacteria proliferation [44,45]. It should be noticed that higher richness and diversity indices, as in fish fed the PF-based diets, can be undesirable since they can be associated with the presence of pathogenic bacteria in gut microbiota [18,46]. On the other hand, a diverse gut microbiome, with the increase of microorganisms from the Firmicutes phylum, can stimulate a fish’s innate immunity and reduce the gut surface area for the establishment of pathogenic bacteria, improving the fish’s health [47,48,49]. Although, in the present study, none of the immune-related genes measured were affected by the use of PF, the dominant allochthonous and autochthonous bacteria detected were indeed the most closely related to the Firmicutes and Proteobacteria phyla, as already described in gilthead seabream fed different dietary compositions [18,47]. However, in future studies, a higher-resolution method, such as next-generation sequencing and FISH, could improve the characterization of the bacterial communities under different dietary feeding regimes, providing not only the full identification of the species and/or subspecies of the bacteria, but also allowing for their quantification. This more in-depth characterization and quantification of the bacterial species and/or subspecies will possibly allow for a clearer connection between microbiota and gut functionality.
Both Pseudomonas sp. and Lactobacillus sp. can produce α-amylase [50]; however, as their presence was detected in fish fed all experimental diets, no link can be made between the presence of α-amylase-producing bacteria, the dietary ratios, and α-amylase activity measured. Indeed, the lack of differences in the gut microbiota of fish fed different dietary P/CH ratios could be partially explained by the use of pregelatinized maize starch as the main carbohydrate source. Gilthead seabream presents almost 100% starch digestibility of diets including 10 to 30% of this ingredient [26]; thus, pregelatinized maize starch does not seem to provide a substantial substrate for microbial fermentation and development. A similar lack of changes in gut microbiota was reported for gilthead seabream and other fish species fed also with highly digestible starch [26,51,52].
For diets’ digestion, several enzymes are needed, with each enzyme presenting a specific role. α-amylase, proteases, and lipase are, respectively, responsible for the enzymatic hydrolysis of starch, proteins, and lipids [51,52,53]. Despite that we did not observe any major effect on the feed intake of fish fed the different diets [28], in the present study, α-amylase activity in PC and midgut and proteolytic activity in PC were affected by the dietary composition. The α-amylase activity was lower in the PC and midgut of fish fed the P40/CH20 diet, and in the PC, it was also lower in fish fed the PF-based diets than those fed the FM-based diets. The influence of dietary P/CH ratio can be related to the adsorption of α-amylase by starch, as suggested by Spannhof and Plantikow [54], who observed that α-amylase secreted by fish during the digestive process was adsorbed by the starch present in the diets [55,56]. This lower α-amylase activity observed in fish fed the P40/CH20 diet can partially explain the lower feed efficiency observed in our previous study in fish fed the P40/CH20 diet, in comparison with those fed the P50/CH10 diet [28]. The effects of dietary protein sources may be related to the ingredients used, namely, wheat gluten, which is a source of α-amylase inhibitors [55,56].
According to Hidalgo et al. [57] and Fernández et al. [58], α-amylase activity is more dependent on fish nutritional habits than the proteolytic activity, and this is further supported by the lack of effects on the proteolytic activity reported in gilthead seabream fed diets with different P/CH ratios [25,26,27]. However, studies in other fish species showed that higher dietary protein levels increased proteolytic activity [59,60,61,62]. In the present study, higher proteolytic activity in fish fed the diet with a higher protein content was also observed in the PC, but only in fish fed the PF-based diets. Moreover, no differences were found regarding the alkaline protease pattern, as observed in the zymograms of the different dietary treatments, suggesting the proteases present are the same independently of the diet offered. Differently, García-Meilán et al. [24] observed that, in gilthead seabream fed FM-based diets, PC proteolytic activity was higher in fish fed lower dietary protein-content diets (P35 and P38), while in the midgut, the proteolytic activity increased progressively as dietary protein increased, stabilizing at 41% to 47% of protein. Thus, more studies should be conducted to clarify the effects of dietary protein level and source on proteolytic activity in the gut.
In the present study, fish fed the PF-based diets presented lower gr and gpx1 gene expression than those fed FM-based diets, which may indicate that the former were more vulnerable to oxidative stress [63]. This evidence seems to be in agreement with the presence of soybean meal antinutritional factors, such as the β-conglycinin, which has been identified as one of the major feed allergens [64,65]. This allergen has an N-glycan structure, essential for the formation of di-tyrosine bridges, which trigger the process responsible for oxidative stress, increasing the malondialdehyde content, and causing oxidative damages [64].
Regarding dietary P/CH ratio effects on oxidative stress, the decrease of sod gene expression in fish fed the P40/CH20 diet may indicate that those fish were also more susceptible to oxidative stress. Nevertheless, Castro et al. [23] observed in gilthead seabream that the intestinal sod activity was not affected by the use of different dietary P/CH ratios. Indeed, a disconnection between the gene expression and enzymatic activity results was previously reported by other studies [22,66]. Thus, we might not disregard that the response at the biochemical level might be different of the one obtained at molecular level. Hence, future studies should also include enzymatic activities which, together with the gene expression analyses, will allow for a more complete conclusion.
Sitjà-Bobadilla et al. [13] and Kokou et al. [19,20] reported, in gilthead seabream fed PF-based diets, a synchronism between the immune and stress responses and the gut histomorphological alterations. A similar relationship was observed in the present study, although no effects were observed in the immune-related genes analyzed, except for cox2 expression, which was higher in fish fed the high-protein diets. Cox2 is linked mainly to inflammation [67,68], so it might be expected that an increase of cox2 gene expression would be accompanied by higher histomorphological scores in this group, which did not happen. The absence of effects on immune-related responses seems to agree with the lack of mortality or diseases observed in our previous study [28].

5. Conclusions

The present study aimed to provide an integrated view of the effects on gut health and functionality of gilthead seabream when fed diets with FM or PF as the main dietary protein sources and different P/CH ratios. However, no major statistical interactions between those two factors were observed, and in general, only independent effects were reported, which did not allow us to conclude on the cumulative effect of both factors. Dietary P/CH ratio has little effects on gut health or functionality; only a decrease of α-amylase activity and gut cox2 and sod gene expression were observed.
PF-based diets are more prone to compromise CH digestibility, induce gut histomorphological changes and modifications of gut mucosa microbiota profile, and decrease expression of oxidative stress-related genes. Overall, the present data demonstrates the need of fine-tunning fish feed formulations with PF to properly preserve fish intestinal physiology.

Supplementary Materials

The following supporting information can be downloaded at: https://www.mdpi.com/article/10.3390/fishes7020059/s1, Table S1: Details of diets, ingredient composition, and proximate analysis published in Basto-Silva, et al. [28].

Author Contributions

Conceptualization: A.O.-T. and I.G.; Experimental analyses, data analyses, and experimental design methodology: C.B.-S. and I.G.-M.; Supervision team: P.E. and I.G. (experimental trial and digestive enzymes activity), A.C. (histological evaluation), C.R.S. (microbial diversity analysis), and E.C. (gene expression analysis). The first manuscript draft was written by C.B.-S., and all authors commented on previous versions of the manuscript. All authors have read and agreed to the published version of the manuscript.

Funding

This research was partially supported by the Strategic Funding to UID/Multi/04423/2019 (POCI-480 01-0145-FEDER-007621) through national funds provided by Foundation for Science and Technology (FCT) and European Regional Development Fund (ERDF), in the framework of the programme Portugal2020; also partially supported by the structured program of R&D&I ATLANTIDA—Platform for the monitoring of the North Atlantic Ocean and tools for the sustainable exploitation of the marine resources (NORTE-01-0145-FEDER-000040), supported by the North Portugal Regional Operational Programme (NORTE2020), through the ERDF; and by the Ministerio de Ciencia, Innovación y Universidades (MICIUN) (AGL2017-89436-R project). Catarina Basto-Silva and Inês Guerreiro were supported by the European Social Fund (ESF) and FCT (SFRH/BD/130171/2017 and SFRH/BPD/114959/2016, respectively). Irene García-Meilán was supported by the MICIUN (Programa Jose Castillejo CAS18/00436). Ana Couto, Cláudia Serra, and Paula Enes had scientific employment contracts supported by national funds through FCT.

Institutional Review Board Statement

The experiment was performed by accredited scientists (following FELASA category C recommendations) and approved by the General Directorate of Food and Veterinary from Portugal (Certification number ORBEA-CIIMAR 30-2019), according to the European Union directive 2010/63/EU on the protection of animals for scientific purposes.

Data Availability Statement

The data used to generate the results in this manuscript can be made available if requested to the corresponding author.

Conflicts of Interest

The authors declare no conflict of interest.

References

  1. Tacon, A.G.J.; Metian, M. Global overview on the use of fish meal and fish oil in industrially compounded aquafeeds: Trends and future prospects. Aquaculture 2008, 285, 146–158. [Google Scholar] [CrossRef]
  2. Tacon, A.G.J.; Metian, M. Feed matters: Satisfying the feed demand of aquaculture. Rev. Fish. Sci. Aquac. 2015, 23, 1–10. [Google Scholar] [CrossRef]
  3. Olsen, R.L.; Hasan, M.R. A limited supply of fishmeal: Impact on future increases in global aquaculture production. Trends Food Sci. Technol. 2012, 27, 120–128. [Google Scholar] [CrossRef]
  4. FAO. The State of World Fisheries and Aquaculture 2020. Sustainability in Action; FAO: Rome, Italy, 2020; p. 224. [Google Scholar]
  5. Kissil, G.W.; Lupatsch, I. Successful replacement of fishmeal by plant proteins in diets for the gilthead seabream, Sparus aurata L. Isr. J. Aquac.-Bamidgeh 2004, 56, 20378. [Google Scholar] [CrossRef]
  6. Fernández, F.; Miquel, A.G.; Córdoba, M.; Varas, M.; Metón, I.; Caseras, A.; Baanante, I.V. Effects of diets with distinct protein-to-carbohydrate ratios on nutrient digestibility, growth performance, body composition and liver intermediary enzyme activities in gilthead sea bream (Sparus aurata, L.) fingerlings. J. Exp. Mar. Biol. Ecol. 2007, 343, 1–10. [Google Scholar] [CrossRef]
  7. Enes, P.; Panserat, S.; Kaushik, S.; Oliva-Teles, A. Dietary carbohydrate utilization by European sea bass (Dicentrarchus labrax L.) and gilthead sea bream (Sparus aurata L.) juveniles. Rev. Fish. Sci. 2011, 19, 201–215. [Google Scholar] [CrossRef]
  8. Cabral, E.M.; Fernandes, T.J.R.; Campos, S.D.; Castro-Cunha, M.; Oliveira, M.; Cunha, L.M.; Valente, L.M.P. Replacement of fish meal by plant protein sources up to 75% induces good growth performance without affecting flesh quality in ongrowing Senegalese sole. Aquaculture 2013, 380, 130–138. [Google Scholar] [CrossRef]
  9. Monge-Ortiz, R.; Martínez-Llorens, S.; Márquez, L.; Moyano, F.J.; Jover-Cerdá, M.; Tomás-Vidal, A. Potential use of high levels of vegetal proteins in diets for market-sized gilthead sea bream (Sparus aurata). Arch. Anim. Nutr. 2016, 70, 155–172. [Google Scholar] [CrossRef]
  10. Wang, X.X.; Chen, M.Y.; Wang, K.; Ye, J.D. Growth and metabolic responses in Nile tilapia (Oreochromis niloticus) subjected to varied starch and protein levels of diets. Ital. J. Anim. Sci. 2017, 16, 308–316. [Google Scholar] [CrossRef] [Green Version]
  11. Lupatsch, I.; Kissil, G.W.; Sklan, D. Defining energy and protein requirements of gilthead seabream (Sparus aurata) to optimize feeds and feeding regimes. Isr. J. Aquac.-Bamidgeh 2003, 55, 243–257. [Google Scholar] [CrossRef]
  12. García-Meilán, I.; Ordóñez-Grande, B.; Valentín, J.M.; Fontanillas, R.; Gallardo, Á. High dietary carbohydrate inclusion by both protein and lipid replacement in gilthead sea bream. Changes in digestive and absorptive processes. Aquaculture 2020, 520, 734977. [Google Scholar] [CrossRef]
  13. Sitjà-Bobadilla, A.; Peña-Llopis, S.; Gómez-Requeni, P.; Médale, F.; Kaushik, S.; Pérez-Sánchez, J. Effect of fish meal replacement by plant protein sources on non-specific defence mechanisms and oxidative stress in gilthead sea bream (Sparus aurata). Aquaculture 2005, 249, 387–400. [Google Scholar] [CrossRef] [Green Version]
  14. Bonaldo, A.; Roem, A.J.; Fagioli, P.; Pecchini, A.; Cipollini, I.; Gatta, P.P. Influence of dietary levels of soybean meal on the performance and gut histology of gilthead sea bream (Sparus aurata L.) and European sea bass (Dicentrarchus labrax L.). Aquac. Res. 2008, 39, 970–978. [Google Scholar] [CrossRef]
  15. Santigosa, E.; Sánchez, J.; Médale, F.; Kaushik, S.; Pérez-Sánchez, J.; Gallardo, M.A. Modifications of digestive enzymes in trout (Oncorhynchus mykiss) and sea bream (Sparus aurata) in response to dietary fish meal replacement by plant protein sources. Aquaculture 2008, 282, 68–74. [Google Scholar] [CrossRef]
  16. Dimitroglou, A.; Merrifield, D.L.; Spring, P.; Sweetman, J.; Moate, R.; Davies, S.J. Effects of mannan oligosaccharide (MOS) supplementation on growth performance, feed utilisation, intestinal histology and gut microbiota of gilthead sea bream (Sparus aurata). Aquaculture 2010, 300, 182–188. [Google Scholar] [CrossRef]
  17. Couto, A.; Kortner, T.M.; Penn, M.; Bakke, A.M.; Krogdahl, A.; Oliva-Teles, A. Effects of dietary phytosterols and soy saponins on growth, feed utilization efficiency and intestinal integrity of gilthead sea bream (Sparus aurata) juveniles. Aquaculture 2014, 432, 295–303. [Google Scholar] [CrossRef]
  18. Estruch, G.; Collado, M.C.; Peñaranda, D.S.; Tomás-Vidal, A.; Jover Cerdá, M.; Pérez Martínez, G.; Martinez-Llorens, S. Impact of fishmeal replacement in diets for gilthead sea bream (Sparus aurata) on the gastrointestinal microbiota determined by pyrosequencing the 16S rRNA gene. PLoS ONE 2015, 10, e0136389. [Google Scholar] [CrossRef]
  19. Kokou, F.; Sarropoulou, E.; Cotou, E.; Rigos, G.; Henry, M.; Alexis, M.; Kentouri, M. Effects of fish meal replacement by a soybean protein on growth, histology, selected immune and oxidative status markers of gilthead sea bream, Sparus aurata. J. World Aquac. Soc. 2015, 46, 115–128. [Google Scholar] [CrossRef]
  20. Kokou, F.; Sarropoulou, E.; Cotou, E.; Kentouri, M.; Alexis, M.; Rigos, G. Effects of graded dietary levels of soy protein concentrate supplemented with methionine and phosphate on the immune and antioxidant responses of gilthead sea bream (Sparus aurata L.). Fish Shellfish Immunol. 2017, 64, 111–121. [Google Scholar] [CrossRef]
  21. Estruch, G.; Collado, M.C.; Monge-Ortiz, R.; Tomás-Vidal, A.; Jover-Cerdá, M.; Peñaranda, D.S.; Pérez Martínez, G.; Martínez-Llorens, S. Long-term feeding with high plant protein based diets in gilthead seabream (Sparus aurata, L.) leads to changes in the inflammatory and immune related gene expression at intestinal level. BMC Vet. Res. 2018, 14, 302. [Google Scholar] [CrossRef]
  22. Castro, C.; Corraze, G.; Firmino-Diógenes, A.; Larroquet, L.; Panserat, S.; Oliva-Teles, A. Regulation of glucose and lipid metabolism by dietary carbohydrate levels and lipid sources in gilthead sea bream juveniles. Br. J. Nutr. 2016, 116, 19–34. [Google Scholar] [CrossRef] [PubMed] [Green Version]
  23. Castro, C.; Diógenes, A.F.; Coutinho, F.; Panserat, S.; Corraze, G.; Pérez-Jiménez, A.; Peres, H.; Oliva-Teles, A. Liver and intestine oxidative status of gilthead sea bream fed vegetable oil and carbohydrate rich diets. Aquaculture 2016, 464, 665–672. [Google Scholar] [CrossRef]
  24. García-Meilán, I.; Valentín, J.M.; Fontanillas, R.; Gallardo, M.A. Different protein to energy ratio diets for gilthead sea bream (Sparus aurata): Effects on digestive and absorptive processes. Aquaculture 2013, 412, 1–7. [Google Scholar] [CrossRef]
  25. Castro, C.; Couto, A.; Diógenes, A.F.; Corraze, G.; Panserat, S.; Serra, C.R.; Oliva-Teles, A. Vegetable oil and carbohydrate-rich diets marginally affected intestine histomorphology, digestive enzymes activities, and gut microbiota of gilthead sea bream juveniles. Fish Physiol. Biochem. 2019, 45, 681–695. [Google Scholar] [CrossRef] [PubMed]
  26. Couto, A.; Enes, P.; Peres, H.; Oliva-Teles, A. Temperature and dietary starch level affected protein but not starch digestibility in gilthead sea bream juveniles. Fish Physiol. Biochem. 2012, 38, 595–601. [Google Scholar] [CrossRef] [PubMed]
  27. Fountoulaki, E.; Alexis, M.N.; Nengas, I.; Venou, B. Effect of diet composition on nutrient digestibility and digestive enzyme levels of gilthead sea bream (Sparus aurata L.). Aquac. Res. 2005, 36, 1243–1251. [Google Scholar] [CrossRef]
  28. Basto-Silva, C.; Enes, P.; Oliva-Teles, A.; Balbuena-Pecino, S.; Navarro, I.; Capilla, E.; Guerreiro, I. Dietary protein source and protein/carbohydrate ratio affects appetite regulation-related genes expression in gilthead seabream (Sparus aurata). Aquaculture 2021, 533, 736142. [Google Scholar] [CrossRef]
  29. Couto, A.; Kortner, T.M.; Penn, M.; Bakke, A.M.; Krogdahl, A.; Oliva-Teles, A. Effects of dietary soy saponins and phytosterols on gilthead sea bream (Sparus aurata) during the on-growing period. Anim. Feed Sci. Technol. 2014, 198, 203–214. [Google Scholar] [CrossRef]
  30. Khojasteh, S.M. The morphology of the post-gastric alimentary canal in teleost fishes: A brief review. Int. J. Aquatic Sci. 2012, 3, 71–88. [Google Scholar]
  31. Penn, M.H.; Bendiksen, E.Å.; Campbell, P.; Krogdahl, Å. High level of dietary pea protein concentrate induces enteropathy in Atlantic salmon (Salmo salar L.). Aquaculture 2011, 310, 267–273. [Google Scholar] [CrossRef]
  32. Alarcón, F.J.; Díaz, M.; Moyano, F.J.; Abellán, E. Characterization and functional properties of digestive proteases in two sparids; gilthead seabream (Sparus aurata) and common dentex (Dentex dentex). Fish Physiol. Biochem. 1998, 19, 257–267. [Google Scholar] [CrossRef]
  33. Moyano, F.J.; Díaz, M.; Alarcón, F.J.; Sarasquete, M.C. Characterization of digestive enzyme activity during larval development of gilthead seabream (Sparus aurata). Fish Physiol. Biochem. 1996, 15, 121–130. [Google Scholar] [CrossRef] [PubMed]
  34. Bradford, M.M. A rapid and sensitive method for the quantitation of microgram quantities of protein utilizing the principle of protein-dye binding. Anal. Biochem. 1976, 72, 248–254. [Google Scholar] [CrossRef]
  35. Castro, C.; Couto, A.; Pérez-Jiménez, A.; Serra, C.R.; Díaz-Rosales, P.; Fernandes, R.; Corraze, G.; Panserat, S.; Oliva-Teles, A. Effects of fish oil replacement by vegetable oil blend on digestive enzymes and tissue histomorphology of European sea bass (Dicentrarchus labrax) juveniles. Fish Physiol. Biochem. 2016, 42, 203–217. [Google Scholar] [CrossRef]
  36. National Center for Biotechnology Information. Available online: https://www.ncbi.nlm.nih.gov/ (accessed on 14 January 2022).
  37. Taylor, S.; Wakem, M.; Dijkman, G.; Alsarraj, M.; Nguyen, M. A practical approach to RT-qPCR—Publishing data that conform to the MIQE guidelines. Methods 2010, 50, S1–S5. [Google Scholar] [CrossRef]
  38. Pfaffl, M.W. A new mathematical model for relative quantification in real-time RT-PCR. Nucleic Acids Res. 2001, 29, e45. [Google Scholar] [CrossRef]
  39. Ringø, E.; Zhou, Z.; Vecino, J.L.G.; Wadsworth, S.; Romero, J.; Krogdahl, A.; Olsen, R.E.; Dimitroglou, A.; Foey, A.; Davies, S.; et al. Effect of dietary components on the gut microbiota ofaquatic animals. A never-ending story? Aquac. Nutr. 2016, 22, 219–282. [Google Scholar] [CrossRef] [Green Version]
  40. Yukgehnaish, K.; Kumar, P.; Sivachandran, P.; Marimuthu, K.; Arshad, A.; Paray, B.A.; Arockiaraj, J. Gut microbiota metagenomics in aquaculture: Factors influencing gut microbiome and its physiological role in fish. Rev. Aquac. 2020, 12, 1903–1927. [Google Scholar] [CrossRef]
  41. Bakke-McKellep, A.M.; Penn, M.H.; Salas, P.M.; Refstie, S.; Sperstad, S.; Landsverk, T.; Ringo, E.; Krogdahl, A. Effects of dietary soyabean meal, inulin and oxytetracycline on intestinal microbiota and epithelial cell stress, apoptosis and proliferation in the teleost Atlantic salmon (Salmo salar L.). Br. J. Nutr. 2007, 97, 699–713. [Google Scholar] [CrossRef] [Green Version]
  42. Green, T.J.; Smullen, R.; Barnes, A.C. Dietary soybean protein concentrate-induced intestinal disorder in marine farmed Atlantic salmon, Salmo salar is associated with alterations in gut microbiota. Vet. Microbiol. 2013, 166, 286–292. [Google Scholar] [CrossRef]
  43. Batista, S.; Ozório, R.O.A.; Kollias, S.; Dhanasiri, A.K.; Lokesh, J.; Kiron, V.; Valente, L.M.P.; Fernandes, J.M.O. Changes in intestinal microbiota, immune- and stress-related transcript levels in Senegalese sole (Solea senegalensis) fed plant ingredient diets intercropped with probiotics or immunostimulants. Aquaculture 2016, 458, 149–157. [Google Scholar] [CrossRef]
  44. Scott, K.P.; Gratz, S.W.; Sheridan, P.O.; Flint, H.J.; Duncan, S.H. The influence of diet on the gut microbiota. Pharmacol. Res. 2013, 69, 52–60. [Google Scholar] [CrossRef] [PubMed]
  45. Villasante, A.; Ramírez, C.; Catalán, N.; Opazo, R.; Dantagnan, P.; Romero, J. Effect of dietary carbohydrate-to-protein ratio on gut microbiota in Atlantic salmon (Salmo salar). Animals 2019, 9, 89–106. [Google Scholar] [CrossRef] [PubMed] [Green Version]
  46. Miao, S.; Zhao, C.; Zhu, J.; Hu, J.; Dong, X.; Sun, L. Dietary soybean meal affects intestinal homoeostasis by altering the microbiota, morphology and inflammatory cytokine gene expression in northern snakehead. Sci. Rep. 2018, 8, 113. [Google Scholar] [CrossRef] [PubMed] [Green Version]
  47. Parma, L.; Candela, M.; Soverini, M.; Turroni, S.; Consolandi, C.; Brigidi, P.; Mandrioli, L.; Sirri, R.; Fontanillas, R.; Gatta, P.P.; et al. Next-generation sequencing characterization of the gut bacterial community of gilthead sea bream (Sparus aurata, L.) fed low fishmeal based diets with increasing soybean meal levels. Anim. Feed Sci. Technol. 2016, 222, 204–216. [Google Scholar] [CrossRef]
  48. Parma, L.; Yúfera, M.; Navarro-Guillén, C.; Moyano, F.J.; Soverini, M.; D’Amico, F.; Candela, M.; Fontanillas, R.; Gatta, P.P.; Bonaldo, A. Effects of calcium carbonate inclusion in low fishmeal diets on growth, gastrointestinal pH, digestive enzyme activity and gut bacterial community of European sea bass (Dicentrarchus labrax L.) juveniles. Aquaculture 2019, 510, 283–292. [Google Scholar] [CrossRef]
  49. Banerjee, G.; Ray, A.K. Bacterial symbiosis in the fish gut and its role in health and metabolism. Symbiosis 2016, 72, 1–11. [Google Scholar] [CrossRef]
  50. Ray, A.K.; Ghosh, K.; Ringø, E. Enzyme-producing bacteria isolated from fish gut: A review. Aquac. Nutr. 2012, 18, 465–492. [Google Scholar] [CrossRef]
  51. Munilla-Morán, R.; Saborido-Rey, F. Digestive enzymes in marine species. II. Amylase activities in gut from seabream (Sparus aurata), turbot (Scophthalmus maximus) and redfish (Sebastes mentella). Comp. Biochem. Physiol. B Biochem. Mol. Biol. 1996, 113, 827–834. [Google Scholar] [CrossRef] [Green Version]
  52. Munilla-Morán, R.; Saborido-Rey, F. Digestive enzymes in marine species. I. Proteinase activities in gut from redfish (Sebastes mentella), seabream (Sparus aurata) and turbot (Scophthalmus maximus). Comp. Biochem. Physiol. B Biochem. Mol. Biol. 1996, 113, 395–402. [Google Scholar] [CrossRef] [Green Version]
  53. Rust, M.B. Nutritional physiology. In Fish Nutrition, 3rd ed.; Elsevier: Amsterdam, The Netherlands, 2002; p. 367. [Google Scholar]
  54. Spannhof, L.; Plantikow, H. Studies on carbohydrate digestion in rainbow trout. Aquaculture 1983, 30, 95–108. [Google Scholar] [CrossRef]
  55. Storebakken, T.; Shearer, K.D.; Baeverfjord, G.; Nielsen, B.G.; Asgard, T.; Scott, T.; De Laporte, A. Digestibility of macronutrients, energy and amino acids, absorption of elements and absence of intestinal enteritis in Atlantic salmon, Salmo salar, fed diets with wheat gluten. Aquaculture 2000, 184, 115–132. [Google Scholar] [CrossRef]
  56. Bakke-McKellep, A.M.; Refstie, S. Alternative protein sources and digestive function alterations in teleost fishes. In Feeding and Digestive Functions in Fish; Cyrino, J.E.P., Bureau, D.P., Kapoor, R.G., Eds.; CRC Press: Boca Raton, FL, USA, 2008. [Google Scholar]
  57. Hidalgo, M.C.; Urea, E.; Sanz, A. Comparative study of digestive enzymes in fish with different nutritional habits. Proteolytic and amylase activities. Aquaculture 1999, 170, 267–283. [Google Scholar] [CrossRef]
  58. Fernández, I.; Moyano, F.J.; Díaz, M.; Martínez, T. Characterization of alpha-amylase activity in five species of Mediterranean sparid fishes (Sparidae, Teleostei). J. Exp. Mar. Biol. Ecol. 2001, 262, 1–12. [Google Scholar] [CrossRef]
  59. Giri, S.S.; Sahoo, S.K.; Sahu, A.K.; Meher, P.K. Effect of dietary protein level on growth, survival, feed utilisation and body composition of hybrid Clarias catfish (Clarias batrachus × Clarias gariepinus). Anim. Feed Sci. Technol. 2003, 104, 169–178. [Google Scholar] [CrossRef]
  60. Debnath, D.; Pal, A.K.; Sahu, N.P.; Yengkokpam, S.; Baruah, K.; Choudhury, D.; Venkateshwarlu, G. Digestive enzymes and metabolic profile of Labeo rohita fingerlings fed diets with different crude protein levels. Comp. Biochem. Physiol. B Biochem. Mol. Biol. 2007, 146, 107–114. [Google Scholar] [CrossRef]
  61. Habte-Tsion, H.M.; Liu, B.; Ge, X.P.; Xie, J.; Xu, P.; Ren, M.C.; Zhou, Q.L.; Pan, L.K.; Chen, R.L. Effects of dietary protein level on growth performance, muscle composition, blood composition, and digestive enzyme activity of Wuchang bream (Megalobrama amblycephala) fry. Isr. J. Aquac.-Bamidgeh 2013, 65, 9. [Google Scholar]
  62. Yan, X.; Yang, J.; Dong, X.; Tan, B.; Zhang, S.; Chi, S.; QihuiYang; Liu, H.; Yang, Y. Optimum protein requirement of juvenile orange-spotted grouper (Epinephelus coioides). Sci. Rep. 2021, 11, 6230. [Google Scholar] [CrossRef]
  63. Kortner, T.M.; Skugor, S.; Penn, M.H.; Mydland, L.T.; Djordjevic, B.; Hillestad, M.; Krasnov, A.; Krogdahl, A. Dietary soyasaponin supplementation to pea protein concentrate reveals nutrigenomic interactions underlying enteropathy in Atlantic salmon (Salmo salar). BMC Vet. Res. 2012, 8, 101. [Google Scholar] [CrossRef] [Green Version]
  64. Zhang, J.-X.; Guo, L.-Y.; Feng, L.; Jiang, W.-D.; Kuang, S.-Y.; Liu, Y.; Hu, K.; Jiang, J.; Li, S.-H.; Tang, L.; et al. Soybean β-conglycinin induces inflammation and oxidation and causes dysfunction of intestinal digestion and absorption in fish. PLoS ONE 2013, 8, e58115. [Google Scholar] [CrossRef] [Green Version]
  65. Tan, C.; Zhou, H.; Wang, X.; Mai, K.; He, G. Resveratrol attenuates oxidative stress and inflammatory response in turbot fed with soybean meal based diet. Fish Shellfish Immunol. 2019, 91, 130–135. [Google Scholar] [CrossRef] [PubMed]
  66. Zhang, G.; Mao, J.; Liang, F.; Chen, J.; Zhao, C.; Yin, S.; Wang, L.; Tang, Z.; Chen, S. Modulated expression and enzymatic activities of Darkbarbel catfish, Pelteobagrus vachelli for oxidative stress induced by acute hypoxia and reoxygenation. Chemosphere 2016, 151, 271–279. [Google Scholar] [CrossRef] [PubMed]
  67. Olsen, R.E.; Svardal, A.; Eide, T.; Wargelius, A. Stress and expression of cyclooxygenases (cox1, cox2a, cox2b) and intestinal eicosanoids, in Atlantic salmon, Salmo salar L. Fish Physiol. Biochem. 2012, 38, 951–962. [Google Scholar] [CrossRef] [PubMed] [Green Version]
  68. Wang, T.; Yan, J.; Xu, W.; Ai, Q.; Mai, K. Characterization of cyclooxygenase-2 and its induction pathways in response to high lipid diet-induced inflammation in Larmichthys crocea. Sci. Rep. 2016, 6, 19921. [Google Scholar] [CrossRef] [PubMed]
Figure 1. Schematic representation of sampling methodology applied in the present work. * In microbiota, only 2 of 3 fish per tank were used, and the samples were pooled to reduce individual variation, accounting for n = 3 per treatment.
Fishes 07 00059 g001
Figure 2. Representative histological sections of pyloric caeca mucosa villi (I) and submucosa (II) stained with hematoxylin and eosin of fish fed FM-P50/CH10 (a,e), FM-P40/CH20 (b,f), PF-P50/CH10 (c,g), and PF-P40/CH20 (d,h). enterocytes vacuolization. (I): Lamina propria width was higher in fish fed the PF-P50/CH10 diet (c) than fish fed the FM-based diets (a,b). Enterocytes vacuolization was higher in fish fed the PF-based diets (c,d) than those in the remaining conditions (a,b). (II): Submucosa width was higher in fish fed diet PF-P50/CH10 (g), than those in the remaining conditions (eh).
Fishes 07 00059 g002aFishes 07 00059 g002b
Figure 3. Representative hematoxylin and eosin-stained histological sections of midgut from fish fed FM-P50/CH10 (a), FM-P40/CH20 (b), PF-P50/CH10 (c), and PF-P40/CH20 (d). IF, intestine fold; LP, lamina propria; M, muscularis layer; S, serosa layer; SM, submucosa layer. Intestine fold height showed higher histomorphology deformations in fish fed the PF-based diets (c,d) than in fish fed the FM-based diets (b), except for fish fed the FM-P50/CH10 diet (a), which was not significantly different from fish fed the PF-P40/CH20 (d).
Fishes 07 00059 g003
Figure 4. Dendrogram and PCR-DGGE fingerprints of the microbiota found in digesta and mucosa samples recovered from the gut of gilthead seabream fed the experimental diets. Numbers (1–15) on top of the figure correspond to the gel bands sequenced to identify the corresponding bacterial species, described on Table 5.
Fishes 07 00059 g004
Figure 5. Representative model zymogram of alkaline proteases in pyloric caeca and midgut extracts. The molecular weight of each band with proteolytic activity is indicated. All samples were analyzed individually.
Fishes 07 00059 g005
Table 1. Genes and primers used for qPCR.
ID PrimerSequence (5′–3′)1 Accession n°Tm (°C)Efficiency (%)
ef1αF: CTTCAACGCTCAGGTCATCATAF1841706087.2
R: GCACAGCGAAACGACCAAGGGGA
rps18F: GGGTGTTGGCAGACGTTACAM490061.16088.0
R: CTTCTGCCTGTTGAGGAACCA
hsp70F: AATGTTCTGCGCATCATCAAEU8054815790.1
R: GCCTCCACCAAGATCAAAGA
catF: TTCCCGTCCTTCATTCACTCJQ3088236098.5
R: CTCCAGAAGTCCCACACCAT
cox2F: GAGTACTGGAAGCCGAGCACAM2960296094.6
R: GATATCACTGCCGCCTGAGT
gpx1F: GAAGGTGGATGTGAATGGAAAAGATGDQ5249926091.2
R: CTGACGGGACTCCAAATGATGG
grF: TGTTCAGCCACCCACCCATCGGAJ9378736097.0
R: GCGTGATACATCGGAGTGAATGAAGTCTTG
igMF: CAGCCTCGAGAAGTGGAAACAM4936776087.0
R: GAGGTTGACCAGGTTGGTGT
Il1βF: GGGCTGAACAACAGCACTCTCAJ2771666099.0
R: TTAACACTCTCCACCCTCCA
sodF: CCTGACCTGACCTACGACTATGGJQ3088336091.6
R: AGTGCCTCCTGATATTTCTCCTCTG
tnf αF: TCGTTCAGAGTCTCCTGCAGAJ4131896096.0
R: CATGGACTCTGAGTAGCGCGA
cat: catalase; cox2: cyclooxygenase 2; ef1α: translation elongation factor 1α; F: forward; gpx1: glutathione peroxidase; gr: glutathione reductase; hsp70: 70 kilodalton heat shock proteins; igM: immunoglobulin M heavy chain; il1β: interleukin 1β; R: reverse; rps18: ribosomal protein S18; sod: superoxide dismutase; Tm: melting temperature; tnf α: tumor necrosis factor α. 1 from the GenBank database [36].
Table 2. Details of the score-based evaluation of the pyloric caeca histology of gilthead seabream fed the experimental diets.
Protein SourceFMPFSEMp-Value
P/CH Ratio50/1040/2050/1040/20
Gut fold height1.441.331.721.500.140.97
Lamina propria—width1.61 a1.61 a2.22 b1.94 a,b0.090.04
Lamina propria—cellularity2.22 b1.56 a2.61 b2.00 a,b0.120.03
Submucosa—width1.44 a1.39 a2.00 b1.50 a0.080.04
Submucosa—cellularity1.942.002.111.610.100.28
Intraepithelial leucocytes infiltration2.782.832.672.060.130.11
Eosinophilic granulocytes presence2.111.942.441.890.130.33
Enterocytes nucleus alignment2.332.282.442.610.090.66
Enterocytes vacuolization1.00 a1.11 a1.83 b1.72 b0.100.00
Mean score1.88 a1.78 a2.23 b1.87 a0.060.03
Values presented as means (n = 9) and standard error of the mean (SEM). Different lower-case letters stand for statistical differences across dietary groups as determined by the Kruskal–Wallis all-pairwise comparisons. Furthermore, the significance values have been adjusted by the Bonferroni correction for multiple tests. CH: carbohydrate; FM: fishmeal; PF: plant feedstuffs; P: protein.
Table 3. Details of the score-based evaluation of the midgut histology of gilthead seabream fed the experimental diets.
Protein SourceFMPFSEMp-Value
P/CH Ratio50/1040/2050/1040/20
Gut fold height1.50 a,b1.22 a2.33 c2.00 b,c0.140.02
Lamina propria—width2.672.002.892.440.140.15
Lamina propria—cellularity3.002.673.112.780.140.62
Submucosa—width2.882.113.133.290.180.16
Submucosa—cellularity2.752.443.253.290.150.08
Intraepithelial leucocytes infiltration2.782.723.563.220.230.44
Eosinophilic granulocytes presence3.112.783.133.560.140.39
Enterocytes nucleus alignment2.442.112.562.890.140.29
Enterocytes vacuolization1.001.001.221.220.050.22
Mean score2.44 a,b2.12 a2.79 b2.74 b0.090.01
Values presented as means (n = 9) and standard error of the mean (SEM). Different lower-case letters stand for statistical differences across dietary groups as determined by the Kruskal–Wallis all-pairwise comparisons. Furthermore, the significance values have been adjusted by the Bonferroni correction for multiple tests. CH: carbohydrate; FM: fishmeal; PF: plant feedstuffs; P: protein.
Table 4. Ecological parameters obtained from PCR- DGGE fingerprints of gut microbiota of gilthead seabream fed the experimental diets.
PSFMPFSEMTwo-Way ANOVA
P/CH Ratio50/1040/2050/1040/20PSP/CH RatioI
Digesta
OTUs8.713.710.011.30.90.760.080.29
Richness 10.881.381.021.140.090.750.100.28
Diversity 22.082.562.242.370.090.940.110.33
SIMPER Similarity (%) 334.1 A57.080.4 B65.96.00.010.590.04
Mucosa
OTUs6.08.314.011.71.10.001.000.11
Richness 10.600.871.411.150.110.000.970.08
Diversity 21.672.112.592.390.120.010.480.09
SIMPER Similarity (%) 365.371.272.883.84.30.290.370.78
Values presented as means (n = 3 per treatment pooled from 6 fish), and standard error of the mean (SEM). Different upper-case letters denote significant differences between dietary protein sources. In the case of interaction between factors, one-way ANOVA was performed for the P/CH ratio within each protein source, and for the protein source within each P/CH ratio. The significant interactions between the factors are presented in the upper part of the table. CH: carbohydrate; FM: fishmeal; I: interaction; OTUs: average number of operational taxonomic units; PF: plant feedstuffs; P: protein; PS: protein source. 1 Margalef species richness: d = (S − 1)/log(N). 2 Shannon’s diversity index: H′ = −∑(pi(lnpi)). 3 SIMPER: similarity percentage within group replicates.
Table 5. Identified bacterial species from the DNA sequencing of the allochthonous and autochthonous gut bacteria communities of gilthead seabream fed the experimental diets.
BandClosest Known Species (BLAST)PhylumSimilarity (%)Accession Number of Nearest Neighbor
1Uncultured bacterium from Turkey fecal microbial community-99EU873831.1
2Uncultured Pseudomonas sp.Proteobacteria100LC032367.1
3Lactobacillus aviarius subsp. aviariusFirmicutes96LC071825.1
4Uncultured marine bacterium-96HM437606.1
5Uncultured Lactobacillus sp.Firmicutes97LT571746.1
6Uncultured Pseudomonas sp.Proteobacteria99GU250534.1
7Uncultured bacterium from gut microbiota of Atlantic salmon (Salmo salar L.)-100EU009390.1
8Klebsiella pneumoniaeProteobacteria100CP031798.1
9Uncultured Klebsiella sp.Proteobacteria97MH767054.1
10Uncultured bacterium from gut bacterial communities of Mythimna separata-80JQ013040.1
11Uncultured Vibrio sp.Proteobacteria97HM214586.1
12Uncultured bacterium from environmental samples-95FJ785825.1
13Uncultured bacterium from environmental samples-100LT720113.1
14Uncultured bacterium from intestine of Atlantic cod (Gadus morhua)-98HM115943.1
15Uncultured bacterium from environmental samples-100KC527347.1
Table 6. Specific activity of pepsin (U mg protein−1) in the stomach, and α-amylase, lipase (mU mg protein−1), and proteolytic activity (U mg protein−1) in the pyloric caeca, and midgut of gilthead seabream fed the experimental diet.
PSFMPFSEMTwo-Way ANOVA
P/CH Ratio50/1040/2050/1040/20PSP/CH RatioI
Stomach
Pepsin34.723.722.418.63.70.260.340.64
Pyloric caeca
α-Amylase45.227.119.06.34.00.000.010.42
Lipase0.560.450.610.420.050.910.170.71
Proteolytic activity17.416.545.4 b11.4 a4.70.670.090.03
Midgut
α-Amylase207.3191.057.652.224.60.000.690.39
Lipase3.584.192.863.520.390.390.430.97
Proteolytic activity254.8284.2234.4239.730.30.280.190.53
Values presented as means (n = 9), and standard error of the mean (SEM). Different lower-case letters denote significant differences between dietary P/CH ratios. In the case of interaction between factors, one-way ANOVA was performed for the P/CH ratio within each protein source, and protein source within each P/CH ratio. The significant interactions between the factors are presented in the upper part of the table. CH: carbohydrate; FM: fishmeal; I: interaction; PF: plant feedstuffs; P: protein; PS: protein source.
Table 7. Normalized gene expression 1 of immunology and oxidative stress-related genes in midgut of gilthead seabream fed the experimental diets.
PSFMPFSEMTwo-Way ANOVA
P/CH Ratio50/1040/2050/1040/20PSP/CH RatioI
Immunology
cox20.200.130.190.130.010.750.010.64
igM19.516.011.118.01.50.280.580.09
il1β0.150.110.140.100.020.780.440.48
tnf-α0.130.090.100.110.010.610.370.22
Oxidative Stress
hsp70195.1178.1168.2171.510.80.780.500.42
cat61.546.147.144.04.10.330.260.77
gr8.94.63.84.70.60.010.290.06
gpx113.39.38.78.40.60.020.050.09
sod69.332.442.720.16.90.140.010.97
1 All values expressed as arbitrary unit × 102. Values presented as means (n = 9), and standard error of the mean (SEM). cat: catalase; CH: Carbohydrate; cox2: cyclooxygenase 2; FM: fishmeal; gpx1: glutathione peroxidase; gr: glutathione reductase; hsp70: 70 kilodalton heat shock proteins; igM: immunoglobulin M heavy chain; I: interaction; il1β: interleukin 1β; PF: plant feedstuffs; P: protein; PS: protein source; sod: superoxide dismutase; tnf-α: tumor necrosis factor α.
Publisher’s Note: MDPI stays neutral with regard to jurisdictional claims in published maps and institutional affiliations.

