Abstract
Fisheries in the Curonian Lagoon (1584 km2 coastal lagoon in South-East Baltic) can be classified as artisanal, small-scale, multi-species, and multi-gear. Such types of fisheries are characterised as data-poor and require appropriate investigation methods. We used CMSY (version CMSY_2019_9f. R) to assess maximum sustainable yield (MSY) and related indicators for freshwater bream, roach, pike-perch, and European perch. A decline in pike-perch and roach was identified, while the stocks of freshwater bream and European perch were sustained. As the CMSY model does not consider the impact of environmental factors, the decline in roach stock may be attributed to the increase in salinity rather than to overfishing. In the case of freshwater bream and pike-perch, the method cannot consider the increase of the percentage of small-sized fishes in catches due to the allowance of low-selectivity gears in the fishery. Additionally, in the case of the pike-perch, the model does not take into account the interannual fluctuations in the stock-recruitment system. The assessment of the European perch stock can be considered to be good. However, the accuracy of CMSY is limited, and it should be used for fisheries management only in combination with other methods.
1. Introduction
The Curonian Lagoon has a historically developed fisheries and associated fisheries infrastructure, including fishing enterprises, fleet, and fishing gear. The Curonian Lagoon region underwent major geopolitical changes in the 20th century and corresponding changes in the way fisheries are organised. The peculiarities of fisheries organisation, changes in the structure and capacity of the fishery base have had a significant impact on both fish stocks and their management [1]. The hydrological, hydrochemical, and hydrobiological conditions relevant for most of the fish species in the Curonian Lagoon have not changed much over the last 100 years, but there have been significant quantitative and qualitative changes in the fish community during said time [2]. Most authors consider fisheries to be a key factor in shaping the fish communities in the Curonian Lagoon [3,4,5]; the choice of fishing gear and regime can reduce the abundance of some fish species, favouring others, thus completely altering the structure of the fish communities [1].
Anthropogenic pressure on the Curonian Lagoon’s fish communities has increased with the growth of the population of the region, and consequently with the commercial demand for fish species [5]. The characteristics of fisheries have been shaped and changed depending on the state of fish stocks, fisheries’ regulatory measures, and economic (and political) conditions [1]. The modern shape of the fish community in the Curonian Lagoon was formed in 1958–1968. By this time, stocks of valuable commercial fish had fallen to critical levels. Therefore, all measures were taken to rebuild the resources [4,6]. The seasonal restrictions were extended and restricted areas were increased. A very efficient but non-selective method of fishing, trawling, was banned. During this period, scientific principles were introduced into the Curonian Lagoon fisheries [6]. To rebuild valuable fish stocks as quickly as possible, the Curonian Lagoon’s fish food availability was improved: six species of Malacostraca class crustaceans of the Ponto-Caspian region were successfully introduced into the lagoon [7]. During this period, as recommended by scientists [8], to conserve the food and eggs of valuable fish, the intensive capture of an inedible fish, the three-spined stickleback (Gasterosteus aculeatus Linnaeus, 1758), was commenced. Strict fisheries regulatory measures have brought benefits, and the stocks of valuable commercial fish have increased. The period that followed until the collapse of the Soviet Union (1969–1990) is seen as a period of a stable and predictable fishery [4].
The shift towards market-oriented fisheries development (1991–1999) was triggered by the collapse of the Soviet Union, and the overall transformation of the Lithuanian and Russian economies. This had a strong impact on fisheries, with catches falling after 1991 despite the rapid establishment of new fisheries enterprises. In the Kaliningrad district, 36 fishing enterprises replaced four fishery cooperatives and 71 new fishing enterprises replaced four fishery cooperatives in Lithuania [2,9]. In 1994, catches were the absolute lowest in the history of the Curonian Lagoon fishery, at 12.7 kg/ha, with a total catch of only 2.1 thousand tonnes. The transition to a market economy has also caused problems in the catch accounting system, and therefore, data for this period cannot be considered reliable. Between 1997 and 2000, an increase in catches was observed in the Curonian Lagoon, which was attributed to the fisheries management measures developed and implemented in both countries. On average, annual catches during this period amounted to 3.4 thousand tonnes, which is a 36% decrease compared to catches in the 1960s–1980s [2].
In the modern period (since 2000), fishery practice changes in the Lithuanian part of the lagoon have mostly been due to the ascension of the country to the European Union, which requires adherence to the EU Common Fisheries Policy. Thus, EU legislation on fisheries policy is being introduced. Total catches in the lagoon during this period remain almost stable (3.6 thousand tonnes per year on average), while catches in the Lithuanian part show a slight downward trend while there is an upward trend of catches in the Russian part of the lagoon. In 2000, an agreement between the governments of the Republic of Lithuania and the Russian Federation on cooperation in the field of fisheries was concluded. A joint commission of the two countries was launched, which provides directions for the development of fisheries in the Curonian Lagoon, but the mechanism for the joint management of the Curonian Lagoon’s biological resources has not yet been fully implemented [1].
Legislative regulatory changes in fisheries are usually due to declines in fish stocks. Fisheries management measures are usually tackling the already aggravated situation rather than preventing such changes. The introduction of the maximum sustainable yield (MSY) indicator would be a new step in fisheries management in the Curonian Lagoon. MSY, i.e., maximum sustainable yield, or variants thereof [10,11,12,13], is theoretically the maximum catch that can be consistently taken from a stock under current (average) environmental conditions [14].
Although there are many methods for determining MSY [15], there are important constraints on their application to the Curonian Lagoon, where the fisheries have been, and continue to be, artisanal [5], and thus also small-scale, multi-species and multi-gear. Fisheries with these characteristics tend to be characterised by a scarcity of quantitative catch, catch composition and fishing effort data [16,17], which precludes, e.g., the computation of catch-per-unit effort (CPUE) [12]. CPUE is used as an index of relative biomass, but in this case, even with information on fishing effort, there is a problem of standardisation of CPUE because in this type of fishery the same species is caught with different gears [18], in addition, the fishing gear used by Lithuanian and Russian fishermen is different [9]. Therefore, the list of MSY estimation methods applicable to both parts of the Curonian Lagoon is constrained by the availability of input data and is reduced to a single class of data-limited methods (DLM).
A comparison of the data output capabilities of the various DLMs highlights the strengths of the CMSY method [19], which produces biomass (B), fishing mortality (F), biomass capable of supporting MSY (BMSY), fishing mortality consistent with MSY (FMSY), relative stock size (B/BMSY), exploitation rate (F/FMSY), and MSY [20]. The CMSY method has been applied to global [21] and regional fish stock assessments [22] and has been used to assess stocks of several species of fish in the East China Sea [23], in the Indian Ocean to Narrow-barred Spanish mackerel [24] and the Atlantic shortfin mako shark [25], as well as to many other stocks.
This work aims to assess the stocks of the main commercial fish species, which are dominating the catches of fishermen in both countries, Lithuania, and Russia (freshwater bream, roach, pike-perch, and European perch), using the CMSY method for the period 2000–2020, and to evaluate the applicability of this method in the management of Curonian Lagoon fisheries. During the last 30 years, no joint cross-border assessment of fish stocks in both parts of the lagoon has been carried out—Lithuania and Russia have carried out separate surveys in their territorial waters. The CMSY method allows the assessment of the fish stock for the whole water body. To date, no mathematical modelling methods have been applied to assess the fish stocks in the Curonian Lagoon.
2. Materials and Methods
2.1. Study Area
The Curonian Lagoon is Europe’s largest coastal lagoon and is classified as a transitional waterbody. It is a shallow, low-shored basin in the south-eastern part of the Baltic Sea, separated from it by the Curonian Spit, a 0.5–4.0 km wide sandy strip of land. Its shape resembles a steep triangle with a wider southern part, tapering steadily in a northerly direction and eventually becoming the 0.36–1.20 km wide Klaipeda Strait, connecting the lagoon with the Baltic Sea within the Klaipeda harbour boundary [26]. The lagoon covers an area of 1584 km2, of which 413 km2 belongs to Lithuania. The majority (1171 km2) belongs to the Russian Federation (Figure 1). The lagoon is relatively shallow, with an average depth of only 3.8 m and a maximum depth of 5.8 m. Depths up to 3 m isobath cover more than 2/3 of the lagoon area. Historically, the Curonian Lagoon is divided into 3 parts: (1) the northern part as transitional: where the hydrodynamics is more active due to the exchange of water between the sea, and the lagoon, and the flow of the rivers (it belongs to Lithuania); (2) the middle part as intermediate: between transitional and stagnant (belonging to Lithuania and Russia); (3) the southern part as stagnant or limnic: characterised by fine sediments, and poor water exchange (belonging to Russia) [27]. The lagoon has a total water volume of about 6.2 km3. The Nemunas river runoff accounts for 98% of the total freshwater (22 km3 year−1) entering the Lagoon. Nemunas flows into the lagoon in its central part, dividing the waterbody into different hydrological zones [26]. Nemunas Delta, with its maze of river branches, canals, polders, and wetlands, is protected under the Ramsar Convention as a wetland of international importance and has the status of a regional park. The delta is of exceptional importance for the migration of diadromous fish and is an important spawning ground for key lagoon fish species [9].
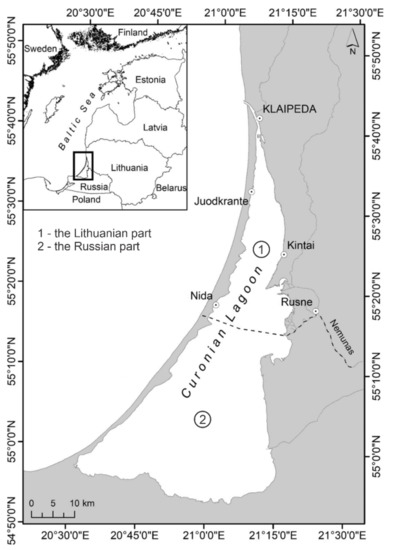
Figure 1.
The study site (①—the Lithuanian part; and ②—the Russian part of the Curonian Lagoon).
2.2. Fisheries Objects and Catch Data
The large water area and geographical position of the Curonian Lagoon mean that it is home to a large ichthyofauna complex, consisting of freshwater, migratory and marine species. The modern list of the ichthyofauna includes 52 species of fish and 2 species of lampreys belonging to 22 families. The species composition of the ichthyofauna of the northern (Lithuanian), and southern (Russian) part of the Curonian Lagoon differs due to the different hydrological regimes and salinity. While in the northern part, where salinity rises to 7‰, marine species are often found, in the southern part, where salinity is less than 1‰, marine species are absent. Therefore, the list of the ichthyofauna of the Russian part of the lagoon is shorter, with 43 fish and lamprey species [28].
Although the Curonian Lagoon is dominated by cyprinids, the structure of the fish community is characterised by significant seasonal differences in the migration of diadromous fish, and lampreys, seasonal migration of freshwater fish to the sea, and migrations within the lagoon itself between the southern, and the northern parts. The lagoon, like other estuaries of a similar type, is a very important feeding, spawning, and nursery habitat for many freshwater or diadromous fish species [9]. Although about 20 fish species have commercial value in the Curonian Lagoon, the catches of fishermen in both countries are based on only 6 species each (Table 1) [9]. According to K. Gaigalas [6], four species listed in the table are common throughout the lagoon: (1) the main stocks of freshwater bream (Abramis brama Linnaeus, 1758) are concentrated in the southern deeper part of the Curonian Lagoon, in larger bays, and the area of Nemunas avandelta; (2) the roach (Rutilus rutilus Linnaeus, 1758) is ubiquitous in the Curonian Lagoon basin; (3) the population of the pike-perch (Sander lucioperca Linnaeus, 1758) in the Curonian Lagoon is not evenly distributed. The majority of the stock is permanently concentrated in the deeper southern part of the area, and the area of Nemunas avandelta; (4) the perch (Perca fluviatilis Linnaeus, 1758) is common throughout the lagoon. Migratory fish species such as vimba bream (Vimba Vimba Linnaeus, 1758), sichel (Pelecus cultratus Linnaeus, 1758) and European smelt (Osmerus eperlanus Linnaeus, 1758) were not included in this study.

Table 1.
The main fisheries objects in the Curonian Lagoon in 2000–2020 and their share in catches (%).
Catch data for the period 2000–2020 for four commercial fish, typical of both countries’ fisheries, in the Lithuanian and Russian parts of the Curonian Lagoon were used for this study. Catch data were obtained from the official statistical source, which is the Environmental Protection Agency database. Catch data are also published on the Nature Research Center (NRC) website [29]. The overall dynamics of catches of freshwater bream, roach, pike-perch, and European perch in the Lithuanian and Russian parts of the Curonian Lagoon are presented in Figure 2.
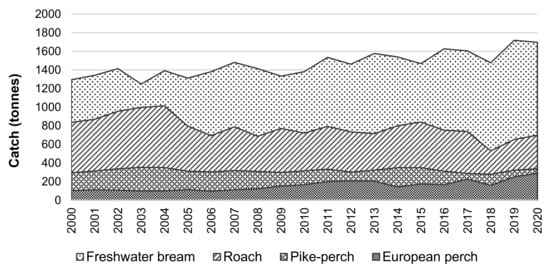
Figure 2.
Catch dynamics of freshwater bream, roach, pike-perch, and European perch in the Lithuanian and Russian parts of the Curonian Lagoon.
2.3. CMSY Model
The stock assessment and MSY of the main commercial fish in the Curonian Lagoon were obtained using the R software (R version 4.1.1, available online: https://cran.r-project.org/bin/windows/base/old/, accessed on 1 September 2021) environment and the CMSY (CMSY_2019_9f.R) model code developed and provided by Froese et al. [30]. This is an open-source fisheries stock assessment model for situations where fisheries data are limited. The model uses retrospective data on the catches of a species and its resilience. Resilience is broadly defined as the ability of a system to respond to and absorb disturbances while maintaining essentially the same function, structure, and feedback [31]. These data are needed to determine the initial parameters of the model. From the catch and resilience data, the model estimates the control parameters of the fishery (MSY, FMSY, BMSY), as well as the relative stock size (B/BMSY) and stock exploitation level (F/FMSY) [30].
The CMSY model is based on Schaefer’s surplus production model (SPM) [32], which is very simple and therefore very popular:
where Bt is the biomass at time step t of the time series, r is the intrinsic growth rate, k is the environmental carrying capacity (assumed equal to the unexploited or initial biomass B0), and Ct is the (known) catch at time step t. This model has two unknown parameters, r, and k. Since depletion (d) is:
the value of k in Equation (1) can be determined using prior information about r and d [18].
Bt+1 = Bt + r·(1 − Bt/k)·Bt − Ct,
d = 1 − Bt/k,
The CMSY model uses production as the basis for population modelling, and information on the resilience of the species allows parameterisation of the intrinsic population growth rate (r) and the size or environmental carrying capacity (k) of the unexploited population, and the retrieval of their viable pairs, using an iterative Markov chain Monte Carlo approach. A pair of parameters is considered viable if the corresponding biomass trajectories estimated from the production model are consistent with catches in the sense that the biomass predicted by Equation (1) does not take negative values, and is consistent with priors pertaining to the relative biomass values at the beginning and end of the time series [30]. After the identification of an optimal pair of r and k, a time series of biomass (B) and fishing mortality (F) can be computed, along with various indicators, i.e., [10,32]:
MSY = r·k/4,
BMSY = 0.5·k,
FMSY = 0.5·r.
Stocks of the species can be defined according to the B/BMSY and F/FMSY of the last year of a time series (Table 2).
Table 2.
Definition of fish stock status for fisheries management, based on B/BMSY and F/FMSY in the final year of a time series (from Froese et al., [33]).
2.4. Input Parameters and Data
The following parameters are used as model inputs: resilience of species and prior relative biomass (B/k) ranges corresponding to depletion levels at the start, intermediate, and end time series. Resilience is a preliminary (or ‘prior’) estimate of the resilience of the species, corresponding to the intrinsic growth rates. Suggested values are ‘high’, ‘medium’, ‘low’, ‘very low’. Table 3 presents the r ranges automatically assigned by CMSY based on resilience categories, which were obtained from www.FishBase.org (accessed on 5 August 2021) [30]. Instead of resilience, a pair of parameters representing the ‘atypical’ range of intrinsic growth rate of a species population may be manually specified as r.low–r.hi. In this case, the ‘Resilience’ column will be ignored.
Table 3.
Resilience and its corresponding r-value pair [30].
Although the resilience categories provided by FishBase are appropriate for 88% of stocks, it is common for the same species to have different resilience in different populations, and it may be possible to take advantage of the relationship of r with other parameters:
where r is the growth rate of the population, FMSY is the fishing mortality rate corresponding to MSY: FMSY = 0.5·r, M is the natural mortality, K is a parameter of the von Bertalanffy growth equation, tgen is the generation time of the population, and tmax is the maximum age of individuals in the population [19]. In this study, we use the resilience categories provided by FishBase.org.
r ≈ 2FMSY ≈ 2M ≈ 3K ≈ 3/tgen ≈ 9/tmax,
Prior relative biomass (B/k) ranges for CMSY are provided by Froese et al. [30]: (1) very strong depletion—0.01–0.2; (2) strong depletion—0.01–0.4; (3) medium depletion—0.2–0.6; (4) low depletion—0.4–0.8; (5) nearly unexploited—0.75–1.0. In this study, these value pairs are obtained by expert judgement according to the assumed depletion levels.
Input parameters for the CMSY model are shown in Table 4.
Table 4.
CMSY model input parameters *.
The expert assessment in this work is based on reference points, which are quartiles 1 and 3 of the catches from the 1969–1990 fishing period (Figure 3).
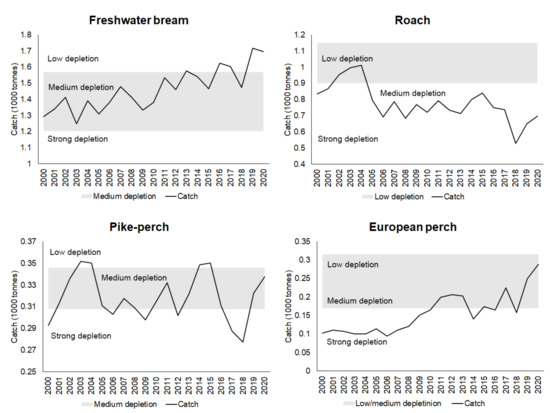
Figure 3.
Status for 2000–2020 by species according to 1 and 3 quartiles of catches of the 1969–1990 period.
In Figure 3, catch quartile 1 corresponds to the lower side of the grey rectangle and quartile 3 to the upper side. It is generally accepted that in the period 1969–1990, freshwater bream and pike-perch stocks recovered to average levels, while roach stocks recovered to high levels (low depletion), and perch stocks varied from average to above-average levels [6].
3. Results
The CMSY model generates a two-part report: CMSY analysis based on viable r–k pairs and results for management based on CMSY analysis. Figure 4 shows the log r–k space explored and the r–k pairs in dark grey, which were found by the model to be consistent with catches and prior information. The dashed rectangle indicates the range of priors given in the input parameters. The point in the centre of the blue cross is the most likely r–k pair predicted by CMSY, and the horizontal and vertical error bars roughly represent the 95% confidence intervals for r and k.
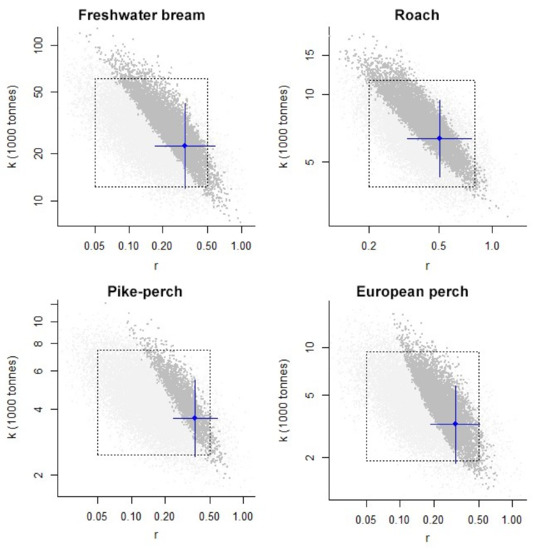
Figure 4.
Viable r–k pairs (r—the maximum intrinsic rate of population increase; k—carrying capacity, i.e., a parameter of the Schaefer model indicating unexploited stock size).
From CMSY analysis based on viable r–k pairs, we can get an overall picture of the environmental capacity and compare the calculated MSY with the catches of the selected year. Table 5 summarises the results of CMSY analysis based on viable r–k pairs and results for management based on CMSY analysis. Comparing MSY with catches in 2020 shows that catches of bream were lower than MSY (1.70 × 10³ t and 1.71 × 10³ t, respectively), catches of roach were lower (0.70 × 10³ t and 0.78 × 10³ t), catches of pike-perch were higher (0.34 × 10³ t and 0.33 × 10³ t), and catches of European perch were also higher (0.29 × 10³ t and 0.25 × 10³ t). From these results, we can only make rough estimates of what species should be caught less, but they do not provide an understanding of the state of the stock.
Table 5.
The results of CMSY analysis are based on viable r–k pairs and results for management based on CMSY analysis.
The next step is CMSY analysis for management, which uses primary r and k data to present the results for decision making. In CMSY analysis for management, the essential parameters for fisheries management were estimated: biomass (B), biomass corresponding to MSY (BMSY), fishing mortality (F), and fishing mortality corresponding to MSY (FMSY). Table 5 shows that the biomass (B2020) of freshwater bream in last year was higher than the sustainable biomass (BMSY) (12.9 × 10³ t and 11.3 × 10³ t, respectively) and the fishing mortality (F2020) was lower than fishing mortality corresponding to MSY (FMSY) (0.132·year−1 and 0.158·year−1). This indicates the good condition of the freshwater bream stock. The parameters B2020 < BMSY (2.42 × 10³ t and 3.18 × 10³ t) and F2020 > FMSY (0.289·year−1 and 0.252·year−1) for roach indicate the poor condition of its stock. The situation is similar with pike-perch stock—B2020 < BMSY (1.27 × 10³ t and 1.82 × 10³ t, respectively) and F2020 > FMSY (0.266·year−1 and 0.186·year−1). The state of European perch stock is similar to freshwater bream—B2020 > BMSY (1.95·103 t and 1.62 × 10³ t) and F2020 < FMSY (0.148·year−1 and 0.155·year−1). The correct status of stocks was determined from the combinations of B/BMSY and F/FMSY pairs, according to the method described in the Materials and Methods (Table 2). Table 6 presents the status of the stocks of species determined from the combinations of B/BMSY and F/FMSY pairs.
Table 6.
The status of the stocks of species is determined from the combinations of B/BMSY and F/FMSY pairs.
Figure 5 shows the graphs meant of CMSY Analysis to inform management.
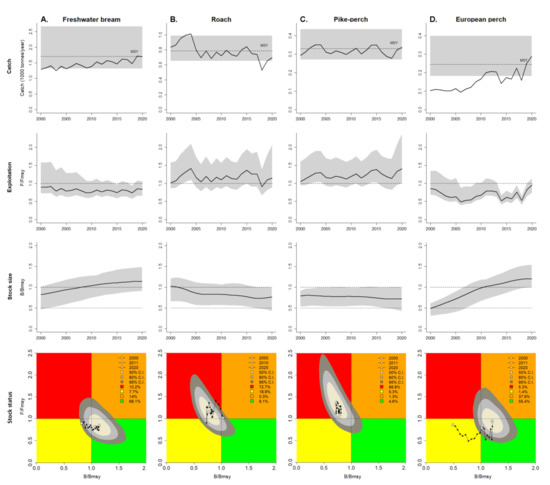
Figure 5.
The graphs of CMSY analysis to inform management (A) of Freshwater bream, (B) of Roach, (C) of pike-perch, and (D) of European perch.
The upper row shows catch relative to MSY, with the indication of 95% confidence limits in grey. The second row of graphs shows relative exploitation (F/FMSY), with FMSY corrected for reduced recruitment below 0.5 BMSY. The third row of graphs shows the development of relative total biomass (B/BMSY), with the grey area indicating uncertainty. The lower row shows a Kobe plot. A Kobe plot represents the time series of pressure (F/FMSY) on the Y-axis and of state (B/BMSY) on the X-axis. The orange area indicates healthy stock sizes that are about to be depleted by overfishing; the red area indicates that it is undergoing overfishing, with biomass levels being too low to produce maximum sustainable yields; the yellow area indicates reduced fishing pressure on stocks recovering from low biomass levels; the green area is the target area for management, indicating sustainable fishing pressure and healthy stock size capable of producing high yields close to MSY. The coloured shape around the assessment of the final year triangle indicates uncertainty with yellow for 50%, grey for 80%, and dark grey for 95% confidence levels. The legend in the upper right graph also indicates the percentage of the 95% confidence area falling into the respectively coloured areas [30].
In 2000–2001, the roach was still in the orange area, although it later entered the red zone, and remains there, except in 2018, when it entered the yellow area. Pike-perch was present in the red area throughout the investigation period from 2000 to 2020. In the yellow area, bream (2000 to 2007) and perch (2000 to 2010) were present in the first half of the investigation period. Later, both species entered the green area.
The status of the main commercial fish stocks in the Curonian Lagoon, as determined by the CMSY method, can be summarised as satisfactory:
- The status of freshwater bream is assessed by the CMSY model as good. F/FMSY was <1 throughout the period under review and remains at the same level; B/BMSY has been >1 since 2008 and continues to increase. The MSY value (1.71 × 10³ t, 95% CI = 1.31–2.63) was only reached and exceeded in 2019.
- The stock of roach is assessed as overexploited by the CMSY model. F/FMSY was >1 throughout the study period, except for 2018, and remains at this level; B/BMSY was <1, except for 2000 and 2001, and has a downward trend. The MSY set by the model (0.786 × 10³ t, 95% CI = 0.649–0.988) was exceeded in the periods 2000–2005, and 2014–2015.
- The CMSY model considers the pike-perch stock to be overexploited. F/FMSY was >1 throughout the study period and continues to increase; B/BMSY was <1 and continues to decrease. The MSY set by the model (0.329 × 10³ t, 95% CI = 0.274–0.433) is periodically reached and exceeded (2003–2004; 2014–2015; 2020).
- The European perch stock is assessed by the CMSY model as good. F/FMSY was <1 for the entire study period but approached ‘1′ in 2000. B/BMSY >1 since 2011, with an increase until 2019, which stopped in 2020. The estimated MSY value (0.247 × 10³ t, 95% CI = 0.181–0.393) was reached, and exceeded in 2019–2020.
4. Discussion
Over the last few years, many new mathematical methods have been developed to assess the state of stocks with limited data. These new methods are a valuable tool both for regional fisheries managers and for global and regional organisations such as the Food and Agriculture Organisation (FAO) and the International Council for the Exploration of the Sea (ICES). FAO is mandated by the United Nations (UN) Sustainable Development Goals (SDGs) (Target 14.4) for tracking global progress in the sustainable use of fisheries resources. The MSY (SDG Indicator 14.4.1) [34] is used as a reference point for assessing sustainability and the CMSY method is used to calculate it. This method inevitably raises the issue of its reliability and the viability of the MSY concept itself.
We can compare the MSY of freshwater bream and pike-perch calculated by the CMSY method with the quotas set for these species. Quotas for catches of these two species and European smelt in the Curonian Lagoon are set by joint Russian–Lithuanian Fishery Commission (RLFC), considering annual monitoring data and historical catches, as well as scientific advice [9]. Quotas do not apply to catches of roach and European perch. A comparison of the MSY for freshwater bream and pike-perch calculated by the CMSY method with the established catch quotas shows, that the quotas for both species fall within the 95% confidence intervals of the estimated MSY (Table 7).
Table 7.
Catch quotas for freshwater bream and pike-perch in 2021 and estimated MSY (in 103 tonnes).
In the period 2000–2020, the quota for freshwater bream was exceeded only in 2019 and 2020, while the quota for pike-perch has never been used up, indicating that it is too high. As the model demonstrates good results with these species, there seems to be no reason to distrust the results of the assessment of other fish stocks. However, several considerations need to be addressed when applying the CMSY method.
Given the increasing dependence of global fisheries stock assessments on the data-limited methods, the assessment of the reliability of these measures and their improvement has been and continues to be a focus of many researchers. Several studies have found that CMSY tends to overestimate fishing mortality and underestimate biomass [35,36,37]. One of the reasons for these shortcomings is the inability of CMSY to estimate fluctuations in a stock-recruitment system under drivers which are highly favourable for the population [38]. Such a situation was observed at the beginning of the time–series when a very abundant 1997 generation of pike-perch [39] appeared in the commercial landings in the period from 2000 to 2004, while later the catches started to decline. In the model, this is referred to rather as a period of increased fishing mortality than an actual stock biomass increase (Figure 5, column C—pike-perch case). Biomass may also be underestimated because the CMSY method commonly uses official commercial catch statistics, which does not take into account catches from recreational and illegal fisheries in the Curonian lagoon, which could amount to several hundred tonnes per year [5]. Considering bream and pike-perch as the main objects of recreational and illegal fishing, it can be assumed that the actual stock biomass of these two fish species is higher than the one estimated by the model. However, it should be noted that absence of recreational and illegal fishing estimates does not affect the setting of limits for commercial fishing in the CMSY method. In the formula for calculating MSY (Equation (3)), the environmental carrying capacity k is reduced to a level that is only covered by commercial fishing. Otherwise, MSY would be set jointly for commercial, recreational, and illegal fisheries, which would be completely useless and even illogical from a management point of view.
Other problems cited for CMSY are related to the heuristic methods used in such types of models. They reveal that it is inappropriate to estimate the stock using default model settings [35,40]. With the default settings, CMSY misjudges stocks that are efficiently managed and fishing pressure at the end of the time series decreases while catches increase [41]. In this case, higher catches are interpreted as increased fishing mortality rather than as a result of successful management [36]. Our study shows (Figure 5, column D—European perch case) that, when initial, intermediate, and final depletion is correctly estimated, catch growth does not affect the exploitation rate F/FMSY < 1 for all years of the catch time series. The model results are predictably more consistent if the modeller’s knowledge of the modelled stock is sufficient. A correct estimate of the initial depletion is critical for the model setup. If time series are short, as is the case with most resource assessment models, it is difficult to estimate initial depletion [35]. As the Northwest European fish stocks have been intensively exploited for several centuries, even a long time series of catches provide only partial knowledge of stock exploitation [36,42]. Another case is that lower catches at the end of the time series related to management restrictions implemented (longer prohibited fishing periods, new prohibited areas, a lower number of gears, quotas, fish size, etc.) are interpreted as overfishing. The paradox is that the information quality of the catch time series ‘deteriorates’ with the introduction of new restrictions on fisheries [20].
Although MSY is enshrined in national (some countries) and international law (e.g., in the UNCLOS—United Nations Convention on the Law of the Sea) the original Schaefer concept [32], which is based on logistic growth of population, has since its inception been subject to considerable criticism and questioning, as it does not take into account recruitment, stock size, stock structure, and environmental conditions [43,44,45]. The concept of MSY is often seen as outdated and should give way to a modern understanding of ecosystems [46,47,48,49]. Aquatic ecologists believe that MSY is single-species-specific, and therefore hinders the implementation of EBFM—ecosystem-based fisheries management [50]. However, Pauly and Froese [50] suggest that the MSY concept is not only consistent with modern EBFM but also compatible with it. Over time, MSY has undergone conceptual changes, and refinements [13,51] so that it has become a boundary to be avoided, rather than a goal to be pursued [52], which aligns with the modern scientific approach and the concept of MSY [13,15,48].
During this study, we have highlighted at least two cases specific to the Curonian Lagoon, related to anthropogenic activities in the northern part of the Curonian Lagoon (belonging to Lithuania) and to the fisheries policy pursued by the Republic of Lithuania, which confirm the weaknesses of the MSY concept. The first consideration is that neither the MSY calculation formula itself (Equation (3)) nor the CMSY model, in selecting viable pairs of r and k parameters, allows variation in the environmental carrying capacity k during the period of stock assessment. The assumption of average environmental conditions used in MSY may lead to erroneous conclusions about the state of the stock [11]. Therefore, a species for which the decline in catches is attributable to environmental changes rather than to fishing is placed in the ‘overfished’ category in the model, as was the case with the roach. Recent studies (Švagždys, in prep.) revealed that the increase in saltwater intrusions from the Baltic Sea into the Curonian Lagoon due to the improvement dredging of the Klaipeda channel has had a significant impact on the population of the roach (reduction in food availability and spawning areas), which has led to a significant decline in the species’ catches in the northern part of the Curonian Lagoon (negative trend, Mann–Kendall trend test: Kendall’s tau = −0.686, alpha = 0.05, p < 0.0001). In the entirely freshwater southern (Russian) part of the lagoon, the catches of roach remain stable (no trend, Mann–Kendall trend test: Kendall’s tau = 0.143; alpha = 0.05; p = 0.381). As the catches of roach in the Lithuanian part and the Russian part of Curonian Lagoon were very similar at the beginning of the study period, the decrease in the northern part has a high impact on the total catches.
A second consideration is that the MSY concept does not take into account the size at first capture and the age structure [53,54,55]. In the case of freshwater bream and to some extent for pike-perch in the Lithuanian part of the Curonian Lagoon, the average size and age of fish caught decreases, while overall catch remains the same or even increases. This is related to the use of highly efficient but low-selectivity fishing gear, introduced in 2014–2017 (modernised lagoon traps and new 50 mm from knot to knot gillnets), which significantly increased the share of smaller freshwater bream and pike-perch specimens in catches. However, this shift in fishing gear does not affect the catch data used as an input in the CMSY model, while a decrease in the percentage of fish caught at the optimum length is one of the overfishing indicators [56]. Fortunately, this does not have a significant impact on the overall state of stocks of freshwater bream and pike-perch, as most of them are concentrated in the southern part of the Curonian Lagoon (Russia), where fisheries management is very conservative and changes in the fishery are negligible [9].
To assess the validity of CMSY model-based assessments of the stock status (Table 6), we correlated with the trends in known overfishing indicators provided by Froese [56]: (1) decrease in the percentage of mature specimens in the catch; (2) decrease in the percentage of fish caught at the optimum length; (3) decrease in the percentage of old, large fish in the catch. We conclude that the overall reliability of the CMSY assessment of main commercial fish stocks in the Curonian Lagoon can be regarded as ‘higher than moderate’: (a) the CMSY model assesses the status of freshwater bream as ‘healthy stock’. Ignoring the shift in the use of different fishing gear types, there is some risk of overfishing, which could be ‘masked’ by the overall catch dynamics not regarding the increased percentage in catches of small–sized fishes (Indicator 2). The use of the new type of gear should be limited to avoid overfishing of freshwater bream. Therefore, CMSY’s assessment of the freshwater bream stock is ‘generally good’; (b) the CMSY model assesses the stock of roach as ‘fully overfished’; however, there are no other indicators of overfishing. Given the evidence that the decline in catches of roach is due to the increased saltwater inflows to the lagoon rather than overfishing, the model assessment should be considered inadequate. The decline in catches of roach may stabilise over time, but is unlikely to reach the level of 20 years ago; (c) the CMSY model treats the pike-perch stock as ‘fully overfished’. This assessment is consistent with all three overfishing indicators. However, as the model does not take into account the fluctuations in the pike-perch stock-recruitment system, the modelling assessments, as in the case of freshwater bream, cannot be considered as ‘very good’. The suggested limitation of low-selective gear would downgrade catch statistics but positively affect the real stock. The overall assessment quality could be regarded as ‘generally good’; (d) the European perch stock is assessed by the CMSY model as ‘healthy stock’, and there are no indicators of overfishing. The model indicates that the European perch stock is approaching risk of overfishing and that future catches above current levels should be avoided. The model’s assessment of European perch stocks could be considered as ‘very good’.
5. Conclusions
For the CMSY modelling to be successful, several conditions that are difficult to fulfil during the period under assessment must be met: (a) the history of the fishery in the study area must be well known; (b) the stock-recruitment system must be stable and free from fluctuations; (c) the impact of the environment on the stock must be minimal and constant; (d) the fishing regime (gear, area, management, etc.) must be steady during the study period; and (e) the impact of recreational and illegal fishing on the stock must be negligible. In summary, the CMSY method has limited accuracy and is likely to lead to errors in fisheries management if it is relied upon alone, especially if it is used to justify new fishery restrictions. Introduction of new legislative constraints on fisheries will alter the relationship between fishing effort, catches and biomass, ‘corrupt’ catch statistics and, if relied upon blindly, can lead to a ‘snowball’ effect: more restrictions lead to lower catches, lower catches could trigger the introduction of tougher regulations. The use of the CMSY method in fisheries management should therefore be only a temporary aid while more detailed data are being collected (e.g., population age structure) for more accurate methods [20].
Author Contributions
Conceptualisation, methodology, software, validation and writing—original draft preparation, V.A.; formal analysis and investigation, E.I.; resources and data curation, A.Š.; writing—review and editing, supervision, A.R.-B. All authors have read and agreed to the published version of the manuscript.
Funding
This research received no external funding.
Data Availability Statement
Not applicable.
Conflicts of Interest
The authors declare no conflict of interest.
References
- Osadtchi, V.M.; Shibajev, S.V.; Fedorov, V.E.; Fedorov, L.S.; Kerosierius, L. Fisheries force. In Fishery Cadastre of Trans–Boundary Reservoirs of Russia (The Kaliningrad Region) and Lithuania; Shibaev, S.V., Khlopnikov, M.M., Sokolov, A.V., Eds.; Mishutkina Co: Kaliningrad, Russia, 2008; pp. 64–76. [Google Scholar]
- Osadtchi, V.M.; Shibajev, S.V.; Sokolov, A.V. Dynamics and species composition of catch. In Fishery Cadastre of Transboundary Reservoirs of Russia (The Kaliningrad Region) and Lithuania; Shibaev, S.V., Khlopnikov, M.M., Sokolov, A.V., Eds.; Mishutkina Co: Kaliningrad, Russia, 2008; pp. 88–93. [Google Scholar]
- Osadchiy, V.M. Regulation of Fishing and the Strategy of Using Fish Resources in the Curonian Lagoon. Ph.D. Thesis, Kaliningrad State Technical University, Kaliningrad, Russia, 2000. Available online: https://www.dissercat.com/download/16197802–0a45–4636–afbf–d30388c6affd/pdf (accessed on 10 September 2021).
- Švagždys, A. Influence of Natural and Anthropogenic Factors on the Change of Fish Catches in the Curonian Lagoon. Ph.D. Thesis, Klaipeda University, Klaipėda, Lithuania, 2010. Available online: http://apc.ku.lt/en/wp–content/uploads/2018/05/ASvagzdys2005–2010.pdf (accessed on 5 September 2021).
- Gushchin, A.V.; Shavrina, I.A. Current state of commercial fish stock in estuaries in the southern part of the Baltic Sea as a consequence of anthropogenic impact. Reg. Ecol. 2018, 52, 54–64. [Google Scholar] [CrossRef]
- Gaigalas, K. Fish and Fishing in the Curonian Lagoon Basin; Eglė: Klaipėda, Lietuva, 2001; Volume 22, pp. 213–228. [Google Scholar]
- Jankevičius, K. Biotechnological measures for the improvement of the feed base of the fish in Curonian Lagoon and other freshwaters. In Biological Treatment of the Environment; Jankevičius, K., Liužinas, R., Eds.; Apyaušris: Vilnius, Lietuva, 2003; pp. 194–204. [Google Scholar]
- Maniukas, J. Ichthyofauna: Status of stock and fisheries in the Curonian lagoon. In Curonian Lagoon; Jankevičius, K., Gasiūnas, I., Gediminas, A., Gudelis, V., Kubilickas, A., Maniukas, J., Eds.; Institute of Biology of the Lithuanian Academy of Sciences: Vilnius, Lietuva, 1959; pp. 375–380. [Google Scholar]
- Zolubas, T.; Kontautas, A.; Shibaev, S.V. Fisheries management in the Curonian Lagoon. In Fisheries Management in Coastal Waters of the Baltic Sea–AQUAFIMA Results of the Szczecin Lagoon, Vistula Lagoon, Curonian Lagoon and Gulf of Riga; Stybel, N., Skor, M., Eds.; Coastline Reports: Rostock, Germany, 2014; Volume 22, pp. 47–69. [Google Scholar]
- Ricker, W.E. Computation and interpretation of biological statistics of fish populations. Bull. Fish. Res. Board Can. 1975, 191, 2–6. [Google Scholar]
- Hilborn, R.; Walters, C. Harvest Strategies and Tactics. In Quantitative Fisheries Stock Assessment: Choice, Dynamics and Uncertainty; Springer Science: Boston, MA, USA, 1992; pp. 453–470. [Google Scholar] [CrossRef]
- Quinn, T.J.; Deriso, R.B. Optimal Harvesting. In Quantitative Fish Dynamics; Oxford University Press: New York, NY, USA, 1999; pp. 437–486. [Google Scholar]
- Mace, P.M. A new role for MSY in single–species and ecosystem approaches to fisheries stock assessment and management. Fish Fish. 2001, 2, 2–32. [Google Scholar] [CrossRef]
- FAO. Term Portal: Maximum Sustainable Yield. 2021. Available online: https://www.fao.org/faoterm/en/?defaultCollId=21 (accessed on 9 August 2021).
- Tsikliras, A.C.; Froese, R. Maximum Sustainable Yield. In Encyclopedia of Ecology, 2nd ed.; Fath, B., Ed.; Elsevier B.V.: Oxford, UK, 2019; pp. 108–115. [Google Scholar] [CrossRef]
- Herrón, P.; Castellanos–Galindo, G.A.; Stäbler, M.; Díaz, J.M.; Wolff, M. Toward Ecosystem–Based Assessment and Management of Small–Scale and Multi–Gear Fisheries: Insights from the Tropical Eastern Pacific. Front. Mar. Sci. 2019, 6, 127. [Google Scholar] [CrossRef]
- Pita, C.; Villasante, S.; Pascual–Fernández, J.J. Managing small–scale fisheries under data poor scenarios: Lessons from around the world. Mar. Policy 2019, 11, 154–157. [Google Scholar] [CrossRef]
- Zhou, S.; Punt, A.E.; Smith, A.D.M.; Ye, Y.; Haddon, M.; Dichmont, C.M.; Smith, D.C. An optimized catch–only assessment method for data poor fisheries. ICES J. Mar. Sci. 2018, 75, 964–976. [Google Scholar] [CrossRef]
- Froese, R.; Demirel, N.; Coro, G.; Kleisner, K.M.; Winker, H. Estimating fisheries reference points from catch and resilience. Fish Fish. 2017, 18, 506–526. [Google Scholar] [CrossRef] [Green Version]
- Free, C.M.; Jensen, O.P.; Anderson, S.C.; Gutierrez, N.L.; Kleisner, K.M.; Longo, C.; Minto, C.; Osio, G.C.; Walsh, J.C. Blood from a stone: Performance of catch–only methods in estimating stock biomass status. Fish. Res. 2020, 223, 105452. [Google Scholar] [CrossRef]
- Costello, C.; Ovando, D.; Clavelle, T.; Strauss, C.K.; Hilborn, R.; Melnychuk, M.C.; Branch, T.A.; Gaines, S.D.; Szuwalski, C.S.; Cabral, R.B.; et al. Global fishery prospects under contrasting management regimes. Proc. Natl. Acad. Sci. USA 2016, 113, 5125–5129. [Google Scholar] [CrossRef] [Green Version]
- Froese, R.; Winker, H.; Coro, G.; Demirel, N.; Tsikliras, A.C.; Dimarchopoulou, D.; Scarcella, G.; Quaas, M.; Matz–Lück, N. Status and rebuilding of European fisheries. Mar. Policy 2018, 93, 159–170. [Google Scholar] [CrossRef]
- Zhang, K.; Zhang, J.; Xu, Y.; Sun, M.; Chen, Z.; Yuan, M. Application of a catchbased method for stock assessment of three important fisheries in the East China Sea. Acta Oceanol. Sin. 2018, 37, 102–109. [Google Scholar] [CrossRef]
- Indian Ocean Tuna Commission (IOTC). Assessment of Indian Ocean Narrow–Barred Spanish Mackerel (Scomberomorus Commerson) Using Data Limited Methods. (IOTC). 2020. Available online: https://iotc.org/documents/WPNT/10/14 (accessed on 10 August 2021).
- Winker, H.; Carvalho, F.; Sharma, R.; Parker, D.; Kerwath, S. Initial results for north and south Atlantic shortfin mako (Isurus oxyrinchus) stock assessments using the Bayesian surplus production model JABBA and the catch–resilience method CMSY. Collect. Vol. Sci. Pap. ICCAT 2017, 74, 1836–1866. [Google Scholar]
- Ferrarin, C.; Razinkovas, A.; Gulbinskas, S.; Umgiesser, G.; Bliūdžiutė, L. Hydraulic regime–based zonation scheme of the Curonian Lagoon. Hydrobiologia 2008, 611, 133–146. [Google Scholar] [CrossRef] [Green Version]
- Umgiesser, G.; Zemlys, P.; Erturk, A.; Razinkovas–Baziukas, A.; Mėžinė, J.; Ferrarin, C. Seasonal renewal time variability in the Curonian Lagoon caused by atmospheric and hydrographical forcing. Ocean Sci. 2016, 12, 391–402. [Google Scholar] [CrossRef] [Green Version]
- Khlopnikov, M.M.; Golubkova, T.A.; Repečka, R. Ichthyofauna. In Fishery Cadastre of Trans–Boundary Reservois of Russia (The Kaliningrad Region) and Lithuania; Shibaev, S.V., Khlopnikov, M.M., Sokolov, A.V., Eds.; Mishutkina Co: Kaliningrad, Russia, 2008; pp. 37–54. [Google Scholar]
- Nature Research Center (NRC). Inland Ecosystem Environmental and Biological Data. Available online: https://fishsize.shinyapps.io/Catches/ (accessed on 10 September 2021).
- Froese, R.; Demirel, N.; Coro, G.; Winker, H. A Simple User Guide for CMSY+ and BSM (CMSY_2019_9f.R); Oceanrep: Kiel, Germany, 2019; pp. 1–16. [Google Scholar]
- Holling, C.S. Resilience and Stability of Ecological Systems. Annu. Rev. Ecol. Syst. 1973, 4, 1–23. [Google Scholar] [CrossRef] [Green Version]
- Schaefer, M.B. Some aspects of the dynamics of populations important to the management of the commercial marine fisheries. Inter-Am. Trop. Tuna Comm. Bull. 1954, 1, 27–56. Available online: https://aquadocs.org/handle/1834/21257 (accessed on 10 September 2021).
- Froese, R.; Garilao, C.; Winker, H.; Coro, G.; Demirel, N.; Tsikliras, A.; Dimarchopoulou, D.; Scarcella, G.; Sampang–Reyes, A. Exploitation and Status of European Stocks. Updated Version; Oceanrep: Kiel, Germany, 2016; Available online: http://oceanrep.geomar.de/34476/ (accessed on 20 September 2021).
- Food and Agriculture Organisation (FAO). Sustainable Development Goals. Indicator 14.4.1—Proportion of Fish Stocks within Biologically Sustainable Levels. Available online: https://www.fao.org/sustainable-development-goals/indicators/14.4.1/en/ (accessed on 20 October 2021).
- Sharma, R.; Winker, H.; Levontin, P.; Kell, L.; Ovando, D.; Palomares, M.L.D.; Pinto, C.; Ye, Y. Assessing the Potential of Catch–Only Models to Inform on the State of Global Fisheries and the UN’s SDGs. Sustainability 2021, 13, 6101. [Google Scholar] [CrossRef]
- Bouch, P.; Minto, C.; Reid, D.G. Comparative performance of data–poor CMSY and data–moderate SPiCT stock assessment methods when applied to data–rich, real–world stocks. ICES J. Mar. Sci. 2021, 78, 264–276. [Google Scholar] [CrossRef]
- Zherdev, N.A.; Pyatinsky, M.M.; Kozobrod, I.D. Stock assessment and long–term dynamics of Azov sea Roach (Russian waters), based on CMSY model for data–limited modelling in period (1999–2019). Fisheries 2020, 6, 88–94. [Google Scholar] [CrossRef]
- Piatinskii, M.M. Data limited stock assessment of population dynamics by CMSY model on the example of Black sea sprat in the Russian waters. Fisheries 2021, 3, 76–82. [Google Scholar] [CrossRef]
- Repečka, R. Ichthyofauna of Curonian Lagoon. In Recovery of Boundary Fish Stocks; Repečka, R., Ed.; Inforastas LTD: Vilnius, Lietuva, 2008; pp. 14–21. [Google Scholar]
- Rosenberg, A.A.; Fogarty, M.J.; Cooper, A.B.; Dickey–Collas, M.; Fulton, E.A.; Gutiérrez, N.L.; Hyde, K.J.W.; Kleisner, K.M.; Kristiansen, T.; Longo, C.; et al. Developing New Approaches to Global Stock Status Assessment and Fishery Production Potential of the Seas; FAO Fisheries and Aquaculture Circular No. 1086 FIRF/C1086; FAO: Rome, Italy, 2014; pp. 9–11. Available online: https://www.fao.org/3/i3491e/i3491e.pdf (accessed on 5 October 2021).
- Pons, M.; Cope, J.M.; Kell, L.T. Comparing performance of catch–based and length–based stock assessment methods in data–limited fisheries. Can. J. Fish. Aquat. Sci. 2020, 77, 1026–1037. [Google Scholar] [CrossRef]
- Wiedenmann, J.; Free, C.M.; Jensen, O.P. Evaluating the performance of data–limited methods for setting catch targets through application to data–rich stocks: A case study using Northeast U.S. fish stocks. Fish. Res. 2019, 209, 129–142. [Google Scholar] [CrossRef]
- Beverton, R.J.H.; Holt, S.J. On the Dynamics of Exploited Fish Populations; Chapman and Hall: London, UK, 1993; pp. 1–5334. [Google Scholar]
- Larkin, P.A. An epitaph for the concept of maximum sustained yield. Trans. Am. Fish. Soc. 1977, 106, 1–11. [Google Scholar] [CrossRef]
- Sissenwine, M.P. Is MSY an adequate foundation for optimum yield? Fisheries 1978, 3, 22–42. [Google Scholar] [CrossRef]
- Corkett, C.J. Fish stock assessment as a non–falsifiable science: Replacing an inductive and instrumental view with a critical rational one. Fish. Res. 2002, 56, 117–123. [Google Scholar] [CrossRef]
- Kell, L.; Fromentin, J.M. The Illusion of MSY. ICES CM2006/R:14. 2006. Available online: https://www.ices.dk/sites/pub/CM%20Doccuments/2006/R/R1406.pdf (accessed on 10 October 2021).
- Mesnil, B. The hesitant emergence of maximum sustainable yield (MSY) in fisheries policies in Europe. Mar. Policy 2012, 36, 473–480. [Google Scholar] [CrossRef]
- Finley, C.; Oreskes, N. Maximum sustained yield: A policy disguised as science. ICES J. Mar. Sci. 2013, 70, 245–250. [Google Scholar] [CrossRef]
- Pauly, D.; Froese, R. MSY needs no epitaph—But it was abused. ICES J. Mar. Sci. 2021, 78, 2204–2210. [Google Scholar] [CrossRef]
- Kesteven, G.L. MSY revisited. A realistic approach to fisheries management and administration. Mar. Policy 1997, 21, 73–82. [Google Scholar] [CrossRef]
- Caddy, J.F.; Mahon, R. Reference Points for Fisheries Management; FAO Fisheries Technical Paper No. 347; FAO: Rome, Italy, 1995; Volume 1–83. [Google Scholar]
- Longhurst, A. Mismanagement of Marine Fisheries; Cambridge University Press: Cambridge, UK, 2010. [Google Scholar]
- Holt, S.J. Sunken billions–But how many? Fish. Res. 2009, 97, 3–10. [Google Scholar] [CrossRef]
- Anderson, C.N.K.; Hsieh, C.; Sandin, S.A.; Hewitt, R.; Hollowed, A.; Beddington, J.; May, R.M.; Sugihara, G. Why fishing magnifies fluctuations in fish abundance. Nature 2008, 452, 835–839. [Google Scholar] [CrossRef] [PubMed]
- Froese, R. Keep it simple: Three indicators to deal with overfishing. Fish Fish. 2004, 5, 86–91. [Google Scholar] [CrossRef] [Green Version]
Publisher’s Note: MDPI stays neutral with regard to jurisdictional claims in published maps and institutional affiliations. |
© 2022 by the authors. Licensee MDPI, Basel, Switzerland. This article is an open access article distributed under the terms and conditions of the Creative Commons Attribution (CC BY) license (https://creativecommons.org/licenses/by/4.0/).