Article

A 90-Day Subchronic Toxicity Study of Consumption of GH-Transgenic Triploid Carp in Wistar Rats

1
Key Laboratory of Precision Nutrition and Food Quality, Key Laboratory of Functional Dairy, Ministry of Education, College of Food Science and Nutritional Engineering, China Agricultural University, Beijing 100083, China
2
Institute of Hydrobiology, Chinese Academy of Sciences, Wuhan 430072, China
3
Anhui Huanghu Fishery Co., Ltd., Anqing 246500, China
4
Key Laboratory of Safety Assessment of Genetically Modified Organism (Food Safety), The Ministry of Agriculture and Rural Affairs of the P.R. China, Beijing 100083, China
5
Beijing Laboratory for Food Quality and Safety, Beijing 100083, China
*
Authors to whom correspondence should be addressed.
These authors contributed equally to this work.
Fishes 2022, 7(1), 10; https://doi.org/10.3390/fishes7010010
Submission received: 1 November 2021 / Revised: 17 December 2021 / Accepted: 23 December 2021 / Published: 5 January 2022

Abstract

:
Genetic modification (GM) offers an alternative strategy to conventional animal breeding. The present study was carried out to investigate the potential health effects of the consumption of growth hormone-transgenic triploid carp (GH-ttc) through a 90-day subchronic rodent feeding study. Wistar rats (n = 10/sex/group) were given formulated diets containing GH-ttc or non-GM carp at an incorporated rate of 2.5%, 5%, or 10% (w/w) for 90 days. An additional control group of rats (n = 10/sex/group) was fed a basic rodent diet. During the 90-day study, clinical observation, ophthalmic examination, body weight, and food intake were evaluated. At the end of the study, rats were killed, and the hematology, serum chemistry, urine test, necropsy, and histopathology were assessed. Compared with the non-GM carp and the basic control groups, no biologically significant differences were observed on clinical signs of toxicity, body weights, food intake, hematology, serum chemistry, urinalysis, organ weight, and histopathology on selected organs for the GH-ttc group. The results of this 90-day subchronic feeding study indicated that, at the dose level used in this study, consumption of GH-ttc showed no subchronic toxicity to Wistar rats.

Graphical Abstract

1. Introduction

Fish constitutes a very important part of the diet in terms of both quantity and contribution to human nutritional requirements and is a major source of animal protein in most developing countries [1]. Meanwhile, according to current projections, by 2030, the world population will exceed eight billion; thus, fisheries and traditional aquaculture will be unable to meet the human demand for fish [2]. Using transgenic technology to produce fish strains with valuable traits may be a promising strategy to address this problem. For example, the application of growth hormone (GH) treatment and altered GH gene expression in genetically modified fishes may increase aquaculture production and efficiency [3]. Fishes have large eggs and external fertilization and incubation; thus, they are more suitable for micromanipulation during embryogenesis. In addition, there are fewer moral reservations regarding genetic modification (GM) in fishes.
In 1984, the human GH gene was first microinjected into goldfish eggs, which was the first GM fish in the world [3]. Since then, over 35 different fish species have been used for gene transfer studies [4], and several stable germ-line transmitted GH transgenic fish lines have been generated, including GH transgenic common carp (Cyprinus carpio) [5], Atlantic salmon (Salmo salar) [6], Coho salmon (Oncorhynchus kisutch) [7,8], mud loach (Misgurrus mizolepis) [9], hybrid tilapia (Oreochromis sp.), and Nile tilapia (Oreochromis nilotius) [10,11]. Nevertheless, up to now, only one type of GM fish, i.e., AquAdvantage Salmon (growth hormone-transgenic female triploid Atlantic salmon), has been approved by the FDA (U.S. Food and Drug Administration) as the first edible commercial product [12,13,14], and are also approved for human consumption in Canada [15]. The commercial use of GM fish, particularly in aquaculture, is still under debate in many countries [16]. One of the major bottlenecks restricting the commercialization of GM fish lies in concerns regarding the potential ecological safety of GM species [17]. Compared with other GM animals, fish have the serious complications of extreme mobility and the ability to interbreed in the wild with native fish, and its release or escape could result in adverse environmental impacts [18].
The production and use of triploid GM fish may offer substantial commercial benefits to aquaculture. In contrast to the diploid fish, triploid fish cannot carry out normal homologous chromosome pairing and separation during meiosis because they have three sets of chromosomes and cannot produce viable gametes. Therefore, gonadal development of triploid fish is inhibited, and triploid fish could drastically reduce the negative environmental impact of GM fish in nature. In addition, triploids are expected to have a higher growth potential [19,20,21]. It is presumed that triploid fish allocate less of their energetic and nutritional resources to reproductive activity and gonadal development and that they will maintain superior growth rates relative to diploids during and after sexual maturation [22]. Common methods of generating triploid fish include heat shock [23,24], cold shock [25], pressure shock [26], and chemical methods [27]. Nevertheless, these methods have problems such as not being 100% effective, they have detrimental side-effects and decreased viability, and they require specific equipment. There is a view that the generation of a hybrid triploid from tetraploid x diploid crosses could address the adverse effects of the above methods [22].
Growth hormone-transgenic triploid carp (GH-ttc) used in the present study comes from the hybridization between tetraploid carp (♀, 4n = 200) and diploid GH-transgenic common carp (Cyprinus carpio L., ♂, 2n = 100). The tetraploid carp is produced by distant hybridization between red crucian carp (Carassius auratus red var., ♀, 2n = 100) × common carp (Cyprinus carpio L., ♂, 2n = 100) [28]. GH-ttc exhibit rapid growth, and its average body weight is 2.3 times higher than that of non-GM triploid carp [28]. Compared with traditional shock methods, the biggest advantage of the hybridization method is that it can obtain 100% triploid fish [22] and could fundamentally solve the potential ecological safety problem.
While fast the growth and sterile characteristics of GH-ttc have been fully studied and the GH-ttc could avoid potential ecological problems [28], the food safety of GH-ttc still needs further assessment before commercial production. Since the emergence of GMOs (genetically modified organisms), a subchronic toxicity study has been recommended for food safety assessment before possible commercialization.
Regarding GM animals, considering they were likely to appear on the market in the future, the Codex Alimentarius Commission (CAC) has established Guideline for the conduct of food safety assessment of foods derived from recombinant-DNA animals (CAC/GL 68-2008) [29], which provide guidance for the safety management of foods derived from recombinant-DNA animals. This approach is based on the principle that the safety of foods derived from recombinant-DNA animals, including recombinant-DNA animals, is assessed relative to the conventional counterpart having a history of safe use. In addition, as part of the premarket registration and assessment procedures, both the EU [30] and P.R. China [31] have decreed that mandatory 90-day rodent feeding studies are performed. In the present study, a 90-day subchronic toxicity study using Wistar rats was performed according to the Chinese Toxicology Assessment Procedures and Methods for Food Safety (Chinese standard GB15193.13-2015). The safety of GH-ttc was compared with its non-transgenic counterpart. This study may provide a scientific basis for further biosafety assessment of GH-ttc.

2. Materials and Methods

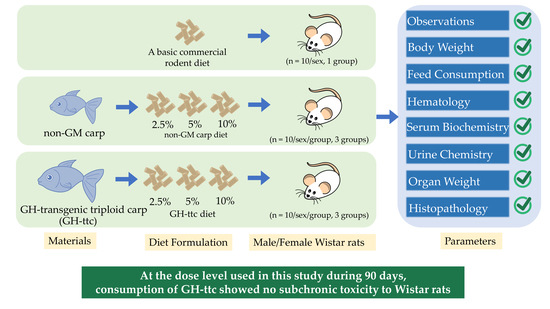
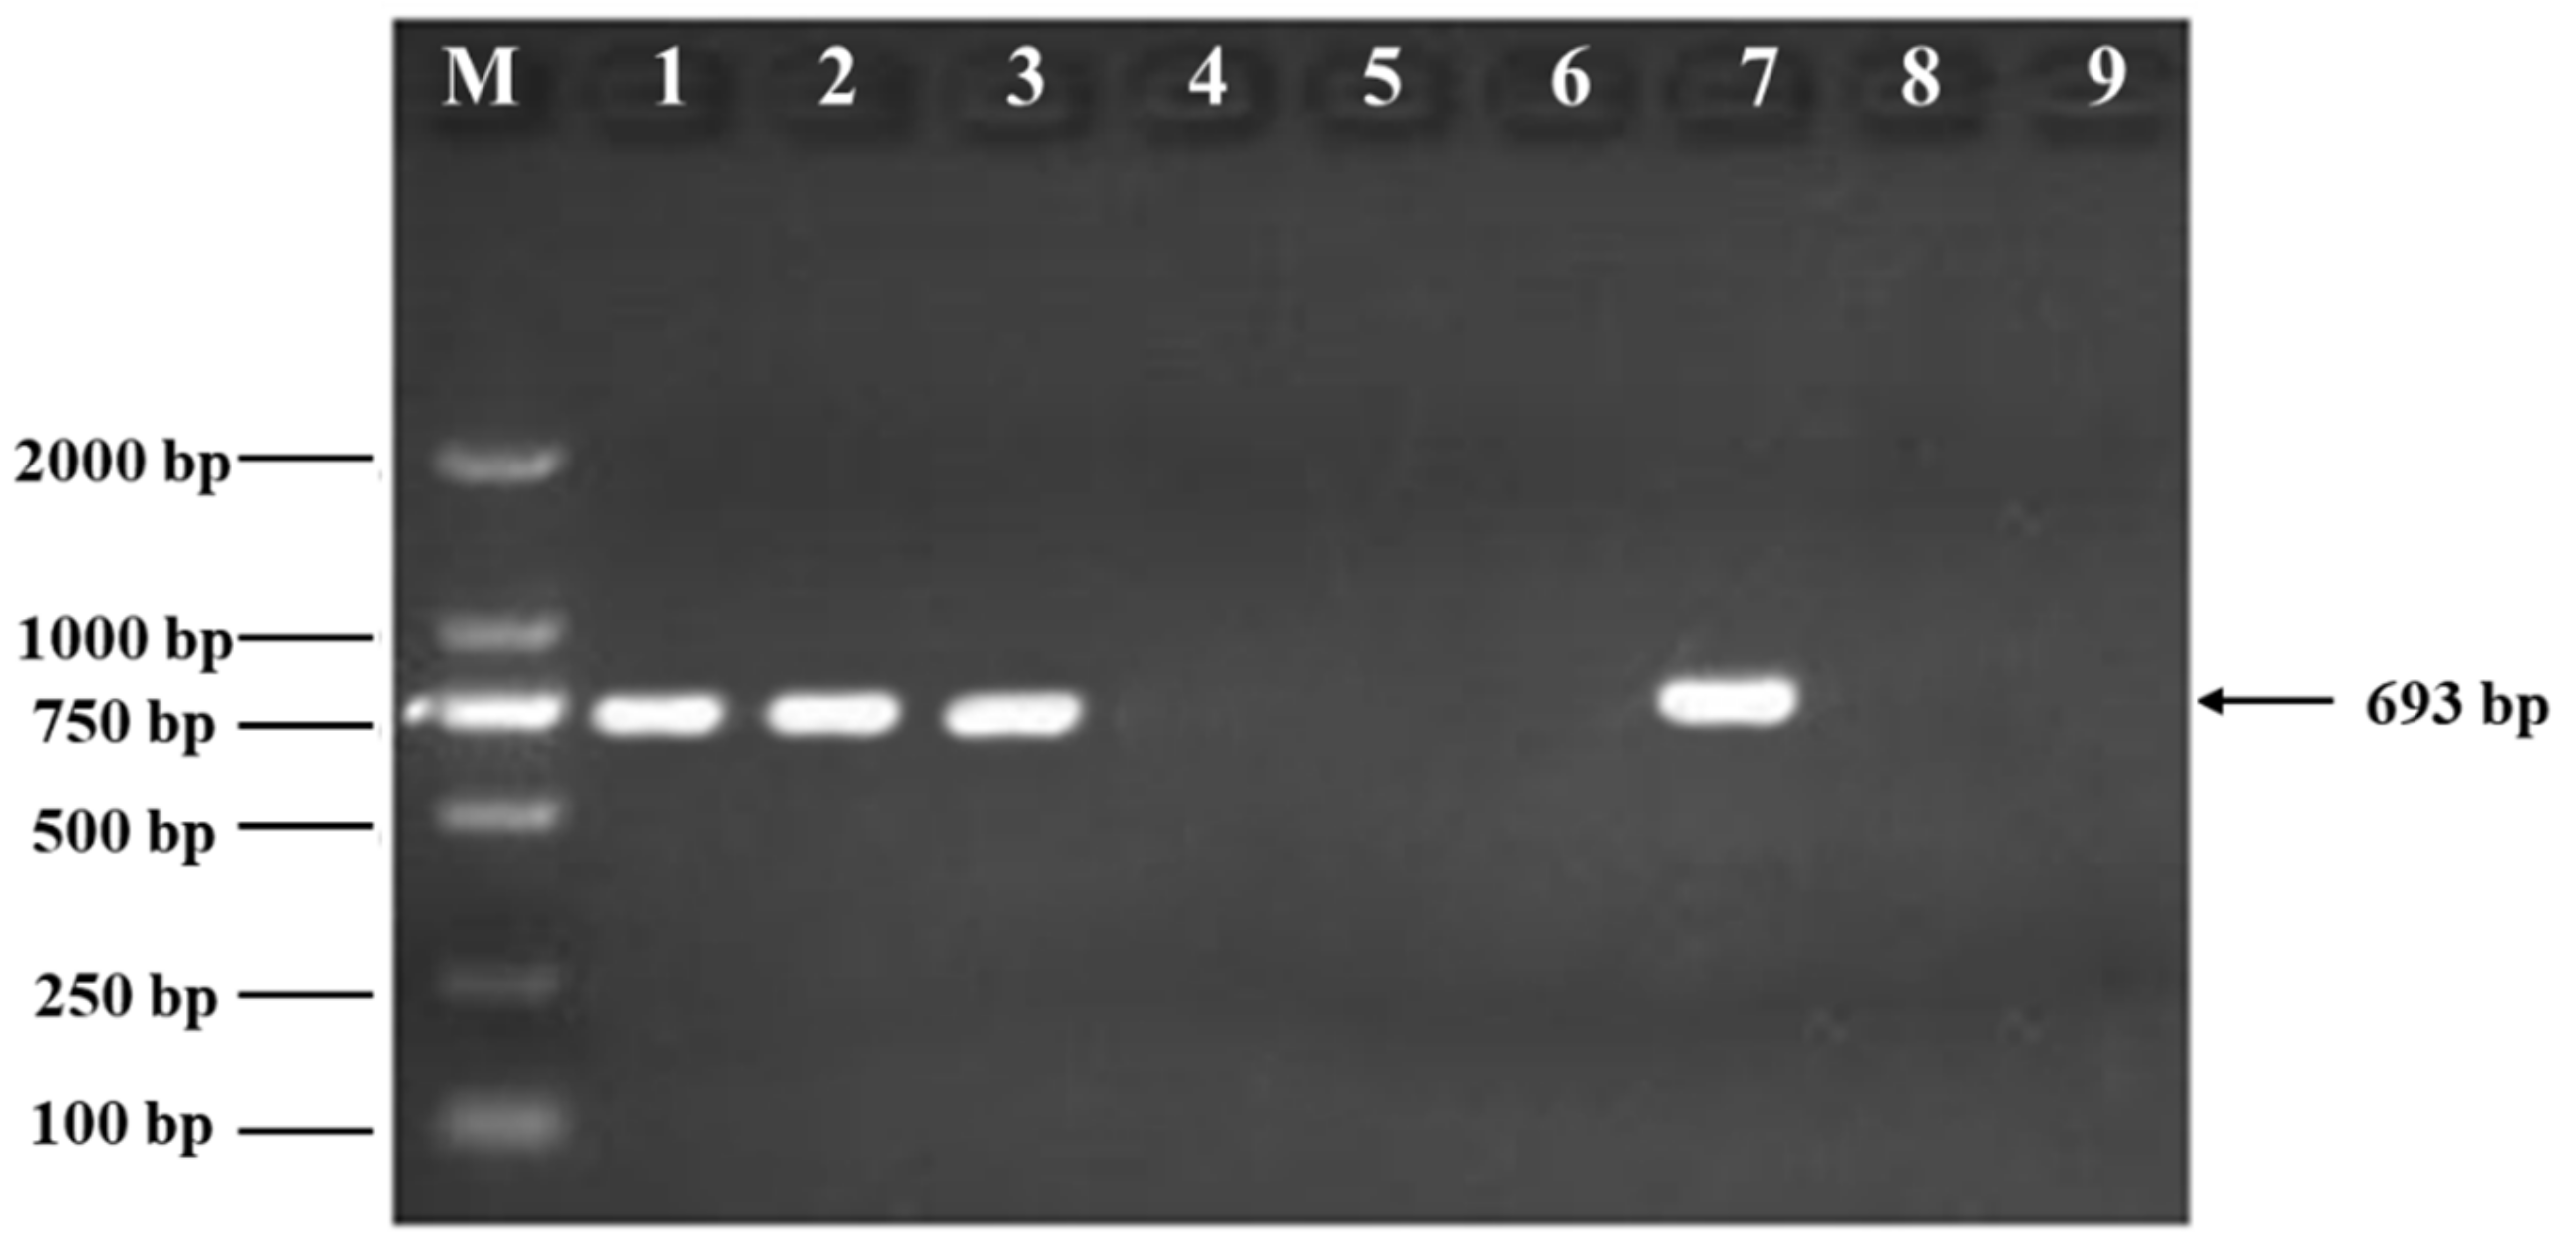
2.1. Materials and Diet Formulation

Both the GH-ttc and the non-GM carp were provided by the Institute of Hydrobiology, Chinese Academy of Sciences (Wuhan, China). GH-ttc with 150 (3n = 150) chromosomes was obtained by crossing female tetraploid carp hybrids (♀, 4n = 200) of red crucian carp (Carassius auratus red var., ♀, 2n = 100) × common carp (Cyprinus carpio L., ♂, 2n = 100) with male diploid GH transgenic common carp (Cyprinus carpio L., ♂, 2n = 100). Similarly, the non-GM carp with 150 (3n = 150) chromosomes was obtained by crossing female tetraploid carp hybrids (♀, 4n = 200) with male diploid wild type common carp (Cyprinus carpio L., ♂, 2n = 100). As indicated by the results of the PCR test, the GH gene was present in the GH-ttc, while it was not detected in the non-GM carp (Figure 1). The nutritional values of GH-ttc and non-GM carp were analyzed (Table 1).

2.2. Diet Formulation

Muscle tissue derived from GH-ttc or non-GM carp was collected independently. After removing the bones, the muscle tissue was ground into powder and was then formulated into a basic commercial rodent diet by Beijing Huafukang Bioscience Co., Inc. (Beijing, China) at inclusion concentrations of 2.5%, 5%, and 10% (w/w). The carp-containing diets were also fortified with cellulose (1.5%, w/w). Regarding the inclusion rate, in the previous studies conducting 90-day safety assessments of meat from transgenic animals, such as sheep, pork, and cattle, the highest inclusion concentration was 15%, 15%, and 10%, respectively [32,33,34]. Empirically, in this preliminary 90-day subchronic toxicity study of consumption of GH transgenic triploid carp, the 2.5%, 5%, or 10% inclusion rates were selected. The basic commercial rodent diet with comparable nutritive values was applied as a negative control diet (Rat and Mouse Maintenance Diet 1025, Beijing Huafukang Bioscience Co., Inc., Beijing, China). All diets were vacuum-packed and sterilized by 60Co by Beijing Huafukang Bioscience Co., Inc. (Beijing, China), and were kept at 4–8 °C prior to use. The nutritional composition of diets was comparable and balanced (Table 2).

2.3. Animals

A total of 140 Wistar rats (70 males and 70 females) weighing 80–100 g was purchased from Vital River Laboratory Animal Technology Co., Ltd. (Beijing, China). The rats were fed in the specific pathogen-free (SPF) animal laboratory of the Supervision and Testing Center for GMOs Safety, Ministry of Agriculture (SYXK, Beijing 2015-0046, China). Rats were randomly divided into seven groups based on body weight, with 10 male and 10 female rats in each group. The rats were housed in stainless steel, open-mesh cages (two per cage) and allowed free access to pelleted feed and tap water during the experiments. The light was set for a 12 h light/dark cycle, and air exchange at 15 times/h. The temperature and humidity of the animal room ranged from 20 to 24 °C and 40–70%, respectively.

2.4. Animal Experimental Design

Following a 5-day acclimation period, 70 male and 70 female rats were randomly divided into seven groups, with 10 male rats and 10 female rats in each group. Six treatment groups were fed with a basal diet containing 2.5%, 5%, or 10% (w/w) GH-ttc or 2.5%, 5%, or 10% (w/w) non-GM carp; the basic control group were fed with a commercially available rodent diet. Animal management and housing procedures were carried out in compliance with the OECD Principles of Good Laboratory Practice. All rats were fed the respective diets for 13 weeks and were weighed weekly.

2.5. Clinical Observation, Optic Examination, Body Weight, and Feed Consumption

Abnormalities, physical appearance, mortality, and signs of toxicity of the rats were observed daily. Observations included, but were not limited to, appearance, fur, changes in the skin, fecal characteristics, respiration, and behavior. At the beginning and the end of the study, ophthalmic examinations were conducted on the 10% GH-ttc group, 10% non-GM carp group, and the control group, including cornea, lens, bulbar conjunctiva, and iris. Body weight and food consumption were measured once a week.

2.6. Hematology

At the end of the feeding trial, the rats fasted for 12 h and blood samples were collected from the orbital sinus under anesthesia using EDTA•K2 as an anticoagulant. The following parameters were measured: white blood cell (WBC) count, red blood cell (RBC) count, hematocrit (HCT), hemoglobin (HGB) level, blood platelet count (PLT), prothrombin time (PT), activated partial thromboplastin time (APTT), neutrophil (NE), lymphocyte (LY) count, eosinophils (EO) count, monocyte (MO) count, and basophils (BA) count. The variables of hematology were measured with a HEMAVET 950FS animal blood cell counter (Drew Scientific, Inc., Dallas, TX, USA).

2.7. Serum Chemistry

For serum collection, the blood samples were collected from the orbital sinus and were centrifuged at 4000× g for 15 min to separate the serum. The following parameters were measured: aminotransferase (ALT), aspartate aminotransferase (AST), total protein (TP), albumin (ALB), alkaline phosphatase (ALP), glutamyl transpeptidase (GGT), urea, creatinine (Cr), total cholesterol (TC), triglyceride (TG), lactate dehydrogenase (LDH), chlorine (Cl), potassium (K), and sodium (Na). Serum chemistry was measured with an automatic Biochemical Analyzer 7020 (Hitchi, Tokyo, Japan).

2.8. Urine Test

At the end of the feeding trial, urine was collected and analyzed for glucose, specific gravity, occult blood, and pH using an Urit-1500 urine analyzer (Unitech Medical Electronics Co., Ltd., Guilin, China).

2.9. Organ Weight and Histopathology

At the end of the experiment, the rats were euthanized by decapitation after anesthesia, and then a gross necropsy was performed to assess any macroscopic pathology of tissues or organs. Selected organs were dissected and weighed, including brain, liver, spleen, heart, thymus, kidney, adrenal gland, testis (or ovary), and epididymis (or uterus). Pathologists from the College of Veterinary Medicine, China Agricultural University, conducted the histopathological examination on the selected organs.

2.10. Statistical Analysis

For the statistical analysis of this study, the effects of each dose of GH-ttc were compared to its non-GM counterpart, and data from each carp-containing dietary group was compared to the basic control group with a one-way analysis of variance (ANOVA) using statistical software Statistical Product and Service Solutions (SPSS) v19.0 (SPSS Inc., Chicago, IL, USA). All the data mentioned were presented as a mean value ± standard deviation (Mean ± SD), and the significance level was set at p < 0.05.

3. Results

3.1. Clinical Evaluations and Optic Examination

During the 90-day experiment, no mortality or treatment-related adverse clinical signs were found. All rats appeared active and healthy. During the ophthalmic examination, all rats in the control and high-dose groups (10% GH-ttc group and 10% non-GM carp group) had normal cornea, crystalline lens, bulbar conjunctiva, and iris.

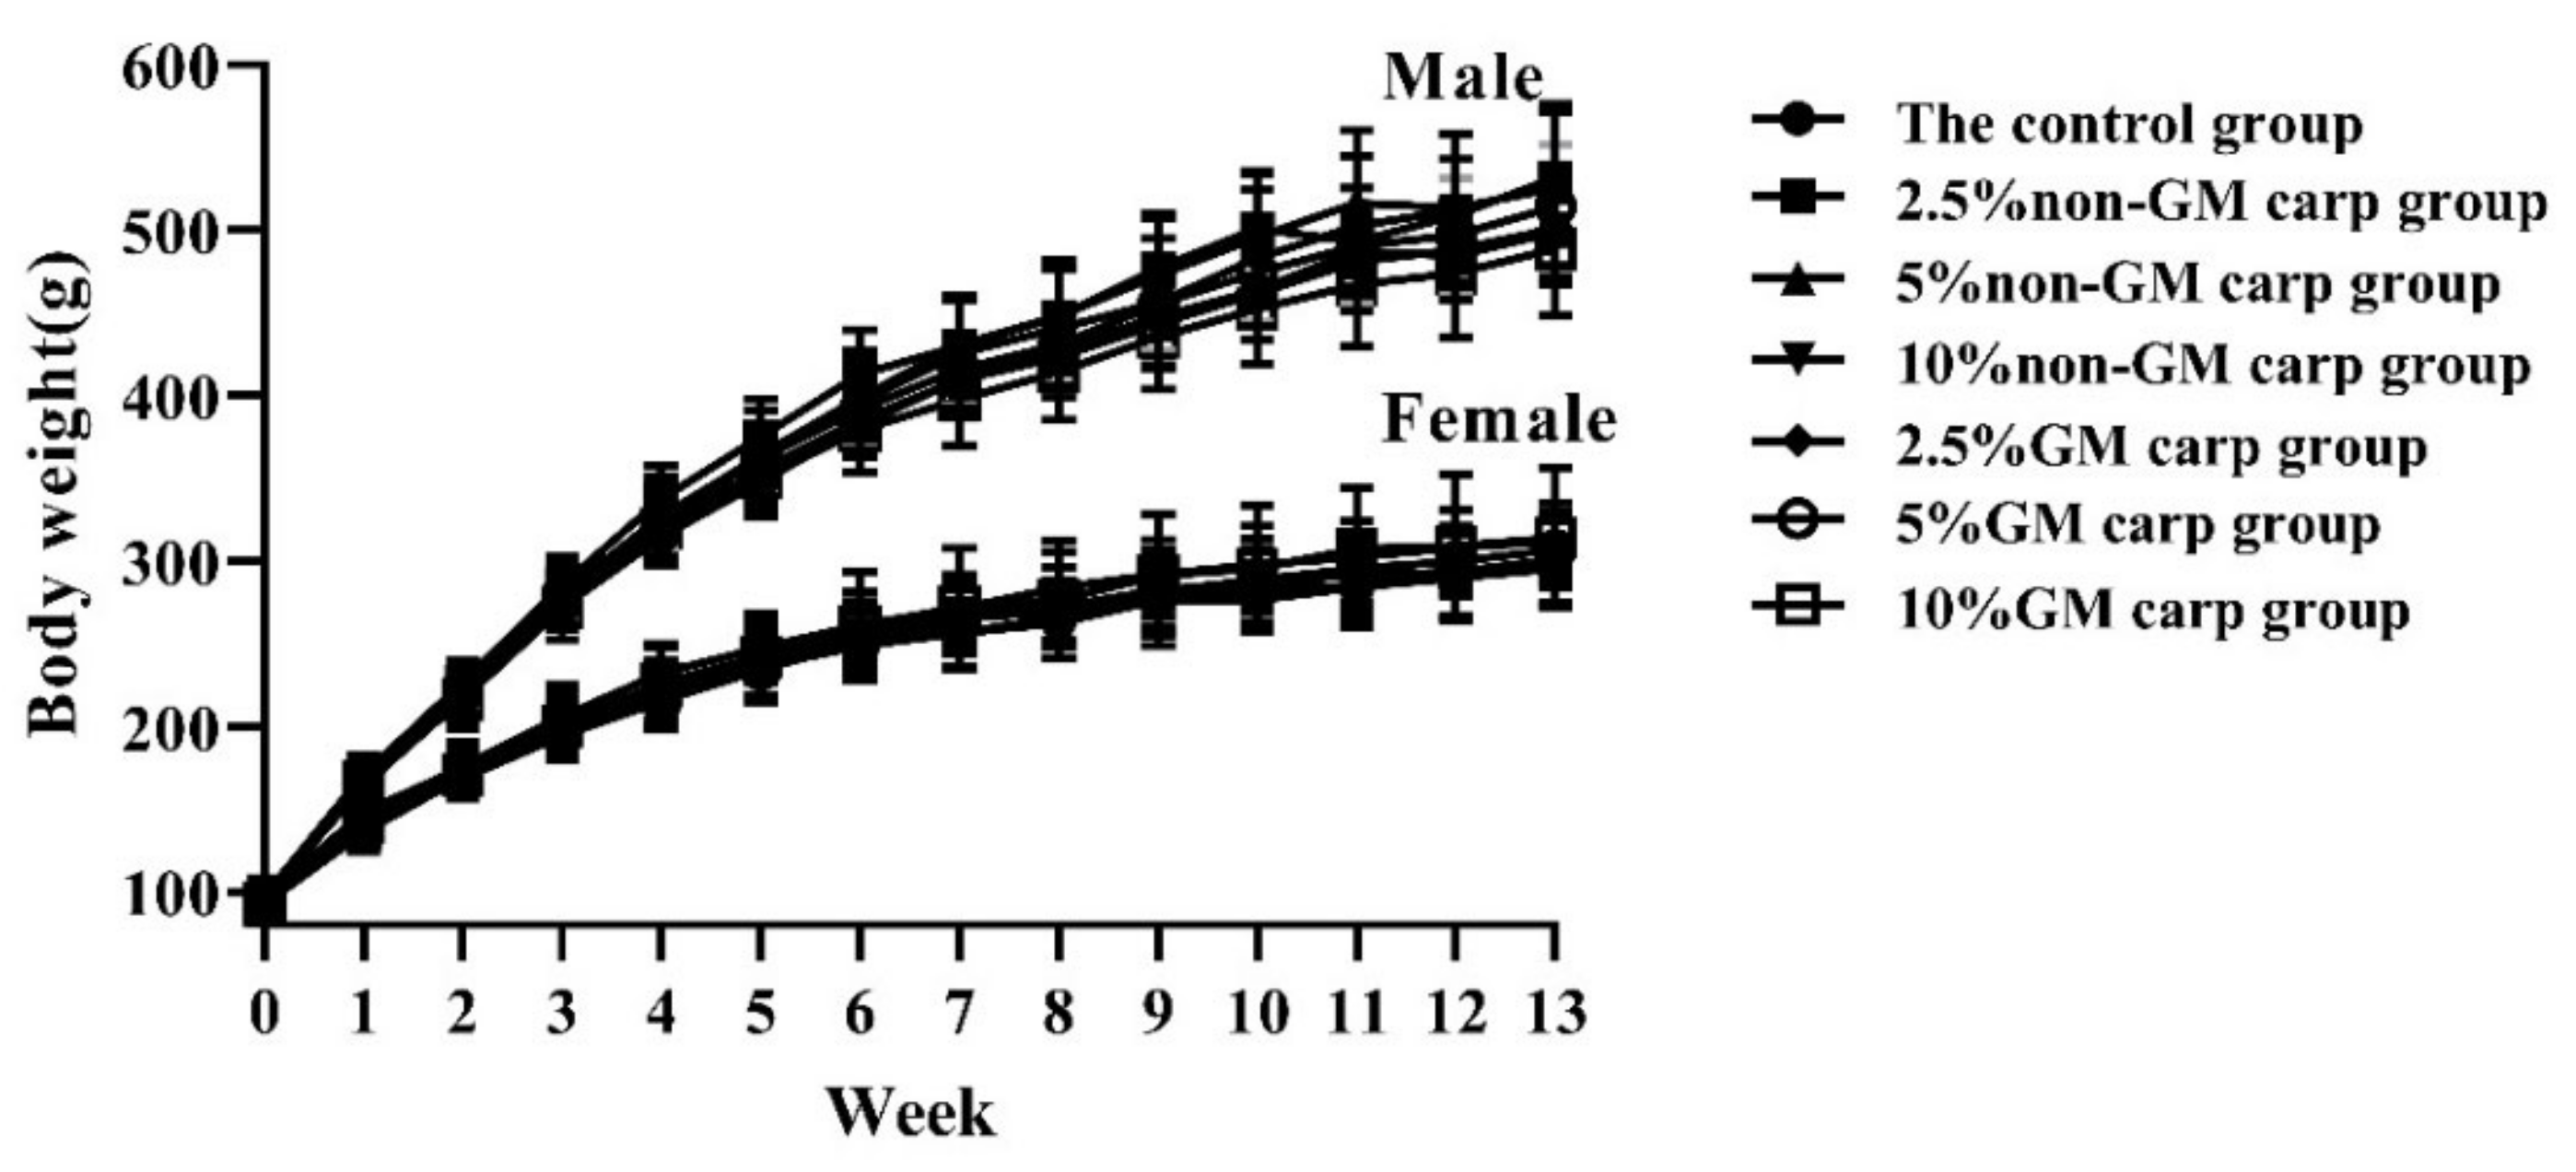
3.2. Body Weight and Feed Consumption

The body weights of the rats during the 90-day period are shown in Figure 2. There were no significant differences in body weight between the GH-ttc group and the corresponding non-GM carp group. Similarly, no significant difference was found for food consumption between the GH-ttc group and the corresponding non-GM carp group during the feeding experiment (Supplementary Table S1).

3.3. Hematology

The terminal hematology parameters for female and male rats are presented in Table 3. For most of the hematology parameters, including WBC, RBC, etc., there were no biologically meaningful differences between the GH-ttc group and the corresponding non-GM carp group. In the male rats, statistical differences (p < 0.05) of LY value between the 10% GH-ttc group and the 10% non-GM carp group were observed. The value of EO in the 5% GH-ttc group was higher (p < 0.05) than that of the 5% non-GM carp group. However, the values of LY in the 10% GH-ttc group and the value of EO in the 5% GH-ttc group were found to be comparable with the corresponding data in the basic control group. This difference was considered to be within the normal range of biological variability. Moreover, the above differences were not observed in the female rats.

3.4. Serum Chemistry Analysis

The data for terminal serum biochemistry for female and male rats are presented in Table 4. Again, there were no biologically meaningful differences between groups in most of the serum biochemistry parameters, such as ALP, AST, etc., while some sporadic, statistically significant differences in certain hematology parameters were observed. In males, ALT level in the 2.5% non-GM carp group, 5% non-GM carp group, 2.5% GH-ttc group, and 5% GH-ttc group were significantly lower (p < 0.05) than that in the basic control group. GGT values of the rats consuming 10% non-GM carp diets were higher (p < 0.05) than those in the basic control group. TC values of the rats consuming 5% GH-ttc diets were lower (p < 0.05) than those in the basic control group. However, there were no significant differences in these parameters between the GH-ttc groups and the corresponding non-GM carp groups, indicating that these changes were not related to the GH-ttc present in the feed.
In females, the TP levels in the 2.5% non-GM carp group, 10% non-GM carp group, and 5% GH-ttc group were significantly lower (p < 0.05) than those in the basic control group. TC level in the 2.5% GH-ttc group was significantly lower (p < 0.05) than that in the basic control group. Na values of the 5% non-GM group were higher (p < 0.05) than those of the basic control group. TG values of female rats consuming 10% GH-ttc diets were significantly higher (p < 0.05) than those in their 10% non-GM counterparts, but not different from those of the basic control group. TG accumulation is known to contribute to cardiovascular disease, chronic liver disease, etc. However, there was no abnormality in heart weight and some liver toxicity-related parameters such as ALT and AST in female rats consuming GH-ttc, which implies that the slightly high TG values of female rats consuming 10% GH-ttc diets might be an accidental phenomenon. In addition, in contrast to the male rats, the TG value in female rats consuming GH-ttc tends to bear a dose-response relationship. Future study is warranted to investigate whether this phenomenon is gender-related or random.

3.5. Urine Chemistry

The urinalysis results of female and male rats are presented in Table 5. There were no statistically significant differences in urinalysis parameters between all groups.

3.6. Organ Weight and Histopathology

Data on organ weights are shown in Table 6. In males, the heart weight in the 5% GH-ttc group was lower (p < 0.05) than that of the counterpart non-GM carp group, but not different from that of the basic control group.
In females, the liver and kidney weight in the 10% GH-ttc group was higher (p < 0.05) than that in the basic control group. However, there were no differences in the above two parameters between the GH-ttc groups and the corresponding non-GM carp groups, demonstrating that these changes were not related to the presence of GH-ttc in the feed. The adrenal gland weights of female rats consuming 2.5% GH-ttc diets were significantly lower (p < 0.05) than those in their 2.5% non-GM counterparts, but not different from those of the basic control group. Additionally, the adrenal gland weights in the 2.5% non-GH carp group were higher (p < 0.05) than those in the basic control group. The differences observed were considered to be random and not related to GH-ttc treatments because they were either within normal biological variability or without any dose-response relationship.
No abnormal macroscopic observations were found during the dissection of all male and female rats. Pathology inspection results on selected organs for the basic control group, 10% GM-ttc, and 10% non-GM carp group are shown in Table 7. The incidences and/or severities of some spontaneous changes in the selected organs, including heart, kidney, lung, thyroid gland, and adrenal gland, did not differ between the control and the treatment groups.

4. Discussion

The common carp is considered to be a source of healthy foods because it contains many minerals and vitamins, especially niacin [35], and has played an important role in the daily diet in many Asian countries. The total world production of common carp was about 4189.5 thousand tonnes in 2020, an increase of about 25% over 2010 [36]. It is now cultured in over 100 countries, and the leading producer is China, followed by India, Bangladesh, and Indonesia [37]. As one of the most important cyprinid species, it accounts for up to 10% of global annual freshwater aquaculture production [38,39]. The application of transgenic technology makes it possible for fish to exhibit promising traits including hypoxia and cold tolerance [40], disease resistance [41,42], metabolic improvements [43], and growth enhancement. Compared with traditional approaches such as interspecific hybridization, transgenic breeding avoids the reproductive isolation between two different species [3,44]. As mentioned above, the triploid carps were developed through diploid-tetraploid crosses [28]. The special feature of GH-ttc is that the sterile characteristics of triploids would address the genetic or evolutionary impacts of the transgenic fish. Due to the reduced gonadal development, triploids are also expected to have higher growth potential [1,21].
So far, the food safety of several GH transgenic carp has been evaluated by conventional toxicological tests or the 90-day subchronic toxicity study. These results showed, at least under the conditions used, there was no subchronic toxicity for the introduction of the GH transgenic carp into rodent feed. For example, Zhang et al. performed physiological and pathological studies on Kunming mice fed with “all-fish” gene transferred Yellow River carp and demonstrated that test mice did not show a significant difference in growth, the general appearance of blood, biochemical analysis on blood, and tissue physiology as compared with control mice in a 6-week study [45]. Chen et al. performed the preliminary test for the safety evaluation of the transgenic common grass carp with the Hu-α-IFN gene and found that there was no significant difference in the hematological index, morphology, and histopathological examination of the main organs between Wistar rats fed transgenic common grass carp and the control rats in a 30-day feeding experiment [46]. Liu et al. conducted a Hershberger assay and reported that GH transgenic carp does not exhibit any androgenic agonist or antagonist properties in vivo screening tests. Subsequently, a 90-day subchronic toxicity study using Sprague–Dawley (SD) rats to evaluate this GH transgenic carp was conducted, and the results showed that the GH transgenic carp had no subchronic toxicity to SD rats [47]. The concentrations of carp incorporated into the SD rat diet were 10% [48], which are the same as the highest concentration used in our study. Recently, Alimuddin et al. performed a 3-week study to observe behavior, histopathology, and physiological responses of Wistar rats fed a diet containing GH transgenic common carp meal and found that there were no significant differences in behavior, histopathology, serum glutamic pyruvic transaminase, serum glutamic oxaloacetic transaminase, or urea and creatinine levels between the Wistar rats fed GH transgenic carp and the control rats [49].
In the present study, according to the results of this 90-day feeding study, no deaths or signs of toxicity were observed during the feeding period. No treatment-related adverse or toxic effects were observed based on an examination of the daily clinical observation, optic examination, body weight, feed consumption, hematology, serum chemistry, urine test, organ weight, and histopathology when comparing the GH-ttc groups to the non-GM carp groups and control groups. Some sporadic, statistically significant changes in hematological and serum chemistry parameters between groups were not considered to be toxicological significant, as the change was not dose-related and the values were within the laboratory’s historical normal range controls. At the end of the study, a gross necropsy was carried out and no macroscopic pathology findings were observed in all rats. The pathological changes observed in the histopathological examination were within the range of normal background lesions and were randomly distributed among different groups; therefore, they were considered to be incidental and spontaneous alterations, unassociated with exposure to the GH-ttc.

5. Conclusions

Collectively, the results from this study demonstrate that, at the dose level used in this study, GH-ttc showed no subchronic toxicity to Wistar rats under the condition of this study. Moreover, given that the GH-ttc has two special traits, rapid growth and sterility, this transgenic triploid carp thus may be suitable for aquaculture products and therefore pose important economic benefits.

Supplementary Materials

The following supporting information can be downloaded at: https://www.mdpi.com/article/10.3390/fishes7010010/s1, Table S1: Food consumption (n = 5/group; mean ± SD, g).

Author Contributions

Conceptualization, K.H., T.T., Y.L. and Y.W.; methodology, X.H. and Y.H.; experimental manipulation, X.H., Y.H. and B.C.; writing—original draft preparation, J.G., T.T. and K.H.; writing—review and editing, J.G., T.T.; Y.M. and K.H. All authors have read and agreed to the published version of the manuscript.

Funding

This research was funded by the Shandong Provincial Natural Science Foundation (ZR2021QC118), the National Key R&D Program of China (2017YFC1600901), and the 2115 Talent Development Program of China Agricultural University.

Institutional Review Board Statement

The study was conducted according to the guidelines of the Declaration of Helsinki and approved by the Animal Experimental Welfare and Ethical Inspection Committee (No. NY180086-087; Date: 2018.04.20) in the Supervision and Testing Center for GMO Food Safety, Ministry of Agriculture (Beijing, China) References.

Data Availability Statement

Data for food consumption (n = 5/group; mean ± SD, g) are available in Supplementary Materials Table S1.

Conflicts of Interest

The authors declare no conflict of interest.

References

  1. Maclean, N. Genetically modified fish and their effects on food quality and human health and nutrition. Trends Food Sci. Technol. 2003, 14, 242–252. [Google Scholar] [CrossRef]
  2. Zhong, C.; Song, Y.; Wang, Y.; Li, Y.; Liao, L.; Xie, S.; Zhu, Z.; Hu, W. Growth hormone transgene effects on growth performance are inconsistent among offspring derived from different homozygous transgenic common carp (Cyprinus carpio L.). Aquaculture 2012, 356–357, 404–411. [Google Scholar] [CrossRef]
  3. Zhu, Z. Novel gene transfer into the fertilized eggs of gold fish (Carassius auratus L. 1758). J. Appl. Ichthyol. 1985, 1, 31–34. [Google Scholar] [CrossRef]
  4. Wei, H.; Zhu, Z.Y. Integration mechanisms of transgenes and population fitness of GH transgenic fish. Sci. China Life Sci. 2010, 53, 401–408. [Google Scholar]
  5. Burns, J.C.; Heimschuessel, R.; Chatakcndi, N.; Dunham, R.A. Transgenic fish: Ideal models for basic research and biotechnological applications. Zool. Stud. 1995, 34, 215–234. [Google Scholar]
  6. Fletcher, G.L.; Shears, M.A.; King, M.J.; Davies, P.L.; Hew, C.L. Evidence for antifreeze protein gene transfer in Atlantic salmon (Salmo salar). Can. J. Fish. Aquat. Sci. 1988, 45, 352–357. [Google Scholar] [CrossRef]
  7. Du, S.J.; Gong, Z.; Fletcher, G.L.; Shears, M.A.; King, M.J.; Idler, D.R.; Hew, C.L. Growth enhancement in transgenic Atlantic salmon by the use of an “all fish” chimeric growth hormone gene construct. Bio/Technology 1992, 10, 176–181. [Google Scholar] [CrossRef] [PubMed]
  8. Devlin, R.H.; Yesaki, T.Y.; Donaldson, E.M.; Du, S.J.; Hew, C.-L. Production of germline transgenic Pacific salmonids with dramatically increased growth performance. Can. J. Fish. Aquat. 1995, 52, 1376–1384. [Google Scholar] [CrossRef]
  9. Nam, Y.K.; Cho, Y.S.; Cho, H.J.; Kim, D.S. Accelerated growth performance and stable germ-line transmission in androgenetically derived homozygous transgenic mud loach, Misgurnus mizolepis. Aquaculture 2002, 209, 257–270. [Google Scholar] [CrossRef]
  10. Martınez, R.; Arenal, A.; Estrada, M.P.; Herrera, F.; Huerta, V.; Vazquez, J.; Sanchez, T.; de la Fuente, J. Mendelian transmission, transgene dosage and growth phenotype in transgenic tilapia (Oreochromis hornorum) showing ectopic expression of homologous growth hormone. Aquaculture 1999, 173, 271–283. [Google Scholar] [CrossRef]
  11. Rahman, M.; Ronyai, A.; Engidaw, B.; Jauncey, K.; Hwang, G.L.; Smith, A.; Roderick, E.; Penman, D.; Varadi, L.; Maclean, N. Growth and nutritional trials on transgenic Nile tilapia containing an exogenous fish growth hormone gene. J. Fish Biol. 2001, 59, 62–78. [Google Scholar] [CrossRef]
  12. Ledford, H. Salmon approval heralds rethink of transgenic animals. Nature 2015, 527, 417–418. [Google Scholar] [CrossRef]
  13. Grossman, M.R. Genetically engineered animals in the United States: The AquAdvantage Salmon. Eur. Food Feed L. Rev. 2016, 11, 190. [Google Scholar]
  14. Smith, M.D.; Asche, F.; Guttormsen, A.G.; Wiener, J.B. Food safety. Genetically modified salmon and full impact assessment. Science 2010, 330, 1052–1053. [Google Scholar] [CrossRef] [PubMed]
  15. Waltz, E. First transgenic salmon sold in Canada. Nature 2017, 548, 148. [Google Scholar] [CrossRef]
  16. Wang, Y.; Hamid, N.; Jia, P.P.; Pei, D.S. A comprehensive review on genetically modified fish: Key techniques, applications and future prospects. Rev. Aquac. 2021, 13, 1635–1660. [Google Scholar] [CrossRef]
  17. Wang, Y.; He, L. Retrospect and prospect of transgenic fish breeding in China. Chin. J. Biotechnol. 2016, 32, 851–860. (In Chinese) [Google Scholar]
  18. Maclean, N.; Laight, R.J. Transgenic fish: An evaluation of benefits and risks. Fish Fish. 2010, 1, 146–172. [Google Scholar] [CrossRef]
  19. Felip, A.; Piferrer, F.; Zanuy, S.; Carrillo, M. Comparative growth performance of diploid and triploid European sea bass over the first four spawning seasons. J. Fish Biol. 2001, 58, 76–88. [Google Scholar] [CrossRef]
  20. Suresh, A.V.; Sheehan, R.J. Muscle fibre growth dynamics in diploid and triploid rainbow trout. J. Fish Biol. 1998, 52, 570–587. [Google Scholar] [CrossRef]
  21. Tiwary, B.K.; Kirubagaran, R.; Ray, A.K. The biology of triploid fish. Rev. Fish Biol. Fish 2004, 14, 391–402. [Google Scholar] [CrossRef]
  22. Bazaz, A.I.; Kashmir, J.A.; Ahmad, I.I.; Nafath-Ul-Arab, I.; Fatima, A. A review on induction of triploidy in fish using heat, pressure and cold shock treatments. J. Entomol. Zool. Stud. 2020, 8, 381–385. [Google Scholar]
  23. Parven, M.A. Triploidy induction and growth performance of hybrid catfish (Clarias macrocephalus × C. gariepinus). Int. J. Fish. Aquat. Stud. 2014, 1, 151–162. [Google Scholar]
  24. Li, F.; Xiang, J.; Zhou, L.; Wu, C.; Zhang, X. Optimization of triploid induction by heat shock in Chinese shrimp Fenneropenaeus chinensis. Aquaculture 2003, 219, 221–231. [Google Scholar] [CrossRef]
  25. Gheyas, A.; Mollah, M.; Hussain, M.G. Triploidy induction in stinging catfish Heteropneustes fossilis using cold shock. Asian Fish Sci. 2001, 21, 323–332. [Google Scholar] [CrossRef]
  26. Peruzzi, S.; Chatain, B. Pressure and cold shock induction of meiotic gynogenesis and triploidy in the European sea bass, Dicentrarchus labrax L.: Relative efficiency of methods and parental variability. Aquaculture 2000, 189, 23–37. [Google Scholar] [CrossRef] [Green Version]
  27. Varadaraj, K.; Pandian, T. Induction of triploids in Oreochromis mossambicus by thermal, hydrostatic pressure and chemical shocks. In Proceedings of the Aquaculture International Congress and Expo, Vancouver, BC, Canada, 6–9 September 1988; pp. 531–535. [Google Scholar]
  28. Yu, F.; Xiao, J.; Liang, X.; Liu, S.; Zhou, G.; Luo, K.; Liu, Y.; Hu, W.; Wang, Y.; Zhu, Z. Rapid growth and sterility of growth hormone gene transgenic triploid carp. Chin. Sci. Bull. 2011, 56, 1679–1684. [Google Scholar] [CrossRef] [Green Version]
  29. FAO/WHO. Guideline for the Conduct of Food Safety Assessment of Foods Derived from Recombinant-DNA Animals. 2008. Available online: https://www.fao.org/fao-who-codexalimentarius/codex-texts/guidelines/zh/ (accessed on 21 December 2021).
  30. EC. Commission Implementing Regulation (EU) No 503/2013 of 3 April 2013 on Applications for Authorisation of Genetically Modified Food and Feed in Accordance with Regulation (EC) No 1829/2003 of the European Parliament and of the Council and Amending Commission Regulations (EC) No 641/2004 and (EC) No 1981/2006. OJEU 2013, L157, 1–57. [Google Scholar]
  31. General Office of the Ministry of Agriculture, China. Notice of the General Office of the Ministry of Agriculture on the Issuance of Guidelines for Safety Assessment of Agricultural GMOs (Plants, Animals and Microorganisms for Animal Use). 2017. Available online: http://www.moa.gov.cn/ztzl/zjyqwgz/sbzn/201703/t20170324_5538055.htm (accessed on 21 December 2021).
  32. Bai, H.; Wang, Z.; Hu, R.; Kan, T.; Li, Y.; Zhang, X.; Zhang, J.; Lian, L.; Han, H.; Lian, Z. A 90-day toxicology study of meat from genetically modified sheep overexpressing TLR4 in Sprague-Dawley rats. PLoS ONE 2015, 10, e0121636. [Google Scholar] [CrossRef]
  33. Zou, S.; Tang, M.; He, X.; Cao, Y.; Zhao, J.; Xu, W.; Liang, Z.; Huang, K. A 90-day subchronic study of rats fed lean pork from genetically modified pigs with muscle-specific expression of recombinant follistatin. Regul. Toxicol. Pharmacol. 2015, 73, 620–628. [Google Scholar] [CrossRef]
  34. Liu, S.; Li, C.X.; Feng, X.L.; Wang, H.L.; Liu, H.B.; Zhi, Y.; Geng, G.Y.; Zhao, J.; Xu, H.B. Safety assessment of meat from transgenic cattle by 90-day feeding study in rats. Food Chem. Toxicol. 2013, 57, 314–321. [Google Scholar] [CrossRef]
  35. Ahmadnia, A.; Sahari, M.A.; Barzegar, M.; Seyfabadi, S.J.; Abdollahi, M. Vitamins contents of some commercially important fish species from south Caspian Sea. Am. Eur. J. Sustain. Agric. 2008, 2, 285–293. [Google Scholar]
  36. FAO. The State of World Fisheries and Aquaculture. 2020. Available online: https://www.fao.org/3/ca9229en/CA9229EN.pdf (accessed on 21 December 2021).
  37. Khan, M.N.; Shahzad, K.; Chatta, A.; Sohail, M.; Piria, M.; Treer, T. A review of introduction of common carp Cyprinus carpio in Pakistan: Origin, purpose, impact and management. Croat. J. Fish. 2016, 74, 71–80. [Google Scholar] [CrossRef] [Green Version]
  38. Xu, P.; Zhang, X.; Wang, X.; Li, J.; Liu, G.; Kuang, Y.; Xu, J.; Zheng, X.; Ren, L.; Wang, G.; et al. Genome sequence and genetic diversity of the common carp, Cyprinus carpio. Nat. Genet. 2014, 46, 1212–1219. [Google Scholar] [CrossRef] [PubMed] [Green Version]
  39. Bostock, J.; McAndrew, B.; Richards, R.; Jauncey, K.; Telfer, T.; Lorenzen, K.; Little, D.; Ross, L.; Handisyde, N.; Gatward, I.; et al. Aquaculture: Global status and trends. Philos. Trans. R. Soc. Lond. B. Biol. Sci. 2010, 365, 2897–2912. [Google Scholar] [CrossRef] [PubMed]
  40. Guan, B.; Ma, H.; Wang, Y.; Hu, Y.; Lin, Z.; Zhu, Z.; Hu, W. Vitreoscilla hemoglobin (VHb) overexpression increases hypoxia tolerance in zebrafish (Danio rerio). J. Mar. Biotechnol. 2011, 13, 336–344. [Google Scholar] [CrossRef] [PubMed]
  41. Fletcher, G.L.; Hobbs, R.S.; Evans, R.P.; Shears, M.A.; Hahn, A.L.; Hew, C.L. Lysozyme transgenic Atlantic salmon (Salmo salar L.). Aquac. Res. 2011, 42, 427–440. [Google Scholar] [CrossRef]
  42. Zhong, J.; Wang, Y.; Zhu, Z. Introduction of the human lactoferrin gene into grass carp (Ctenopharyngodon idellus) to increase resistance against GCH virus. Aquaculture 2002, 214, 93–101. [Google Scholar] [CrossRef]
  43. Krasnov, A.; Pitkänen, T.I.; Mölsä, H. Gene transfer for targeted modification of salmonid fish metabolism. Genet. Anal. 1999, 15, 115–119. [Google Scholar] [CrossRef]
  44. Hallerman, E.M.; McLean, E.; Fleming, I.A. Effects of growth hormone transgenes on the behavior and welfare of aquacultured fishes: A review identifying research needs. Appl. Anim. Behav. Sci. 2007, 104, 265–294. [Google Scholar] [CrossRef]
  45. Zhang, F.; Wang, Y.; Wei, H.; Cui, Z.; Zhu, Z.; Yang, J.; Peng, R. Physiological and pathological analysis of the mice fed with “all-fish” gene transferred yellow river carp. High Technol. Lett. 2000, 10, 17–19. (In Chinese) [Google Scholar]
  46. Kaijian, C.; Huaiyun, Z.; Xuewen, Z.; Tiaoyi, X.; Lixiang, C.; Jianmin, S.; Donggeng, W. A study on the safety of feeding transgenic grass carps to rats. J. Hunan Univ. Nat. Sci. Ed. 2002, 28, 147–149. (In Chinese) [Google Scholar]
  47. Liu, Y.; Zhang, W.; Yong, L.; Zhao, X.; Jia, X.; Li, N. An assessment of androgenic/anti-androgenic effects of GH transgenic carp by Hershberger assay. Biomed. Environ. Sci. 2011, 24, 445–449. [Google Scholar] [PubMed]
  48. Yong, L.; Liu, Y.; Jia, X.; Li, N.; Zhang, W. Subchronic toxicity study of GH transgenic carp. Food Chem. 2012, 50, 3920–3926. [Google Scholar] [CrossRef] [PubMed]
  49. Alimuddin, A.; Murtini, S.; Faridah, N.; Nuryati, S. Behavior, histopathology and physiological responses of rat fed diets containing growth hormone transgenic fish meal. Hayati J. Biosci. 2019, 26, 1. [Google Scholar] [CrossRef]
Figure 1. Identity confirmation of non-GM carp and GH-ttc. M: marker D2000; 1–3: GH-ttc; 4–6: non-GM carp; 7: the positive control for GH gene; 8: the negative control; 9: water control. Primer sequence: F: 5′-TGGCGTGATGAATGTCG-3′; R: 5′-AACACGTATGACTGC-3′.
Fishes 07 00010 g001
Figure 2. Mean weekly body weight. (n = 10/group, g).
Fishes 07 00010 g002
Table 1. Nutritional components of non-GM carp and GH-ttc.
Non-GM CarpGH-ttc
Moisture (g/100 g)77.680.1
Ash content (g/100 g)1.241.27
Protein (g/100 g)19.716.5
Fat (g/100 g)2.01.6
Crude fiber (g/100 g)00
Calcium (mg/kg)4761677
Phosphorus (mg/kg)20642779
Table 2. The basic nutritional ingredients of diets.
Control GroupNon-GM CarpGH-ttc
2.5%5%10%2.5%5%10%
Ash content (g/100 g)6.215.995.875.625.995.875.62
Protein (g/100 g)19.6519.3619.3619.3619.2819.2019.04
Fat (g/100 g)4.434.304.244.124.294.224.08
Crude fiber (g/100 g)3.354.724.634.464.724.634.46
Calcium (g/100 g)1.21.151.121.071.161.131.08
Phosphorus (g/100 g)0.830.800.790.760.800.790.76
Table 3. Terminal hematology parameters for rats fed with different diets (n = 10/group; mean ± SD).
Control GroupNon-GM CarpGH-ttc
2.5%5%10%2.5%5%10%
Males
WBC (109/L)7.36 ± 2.196.57 ± 2.316.61 ± 2.574.87 ± 0.847.36 ± 2.457.39 ± 1.707.92 ± 3.46
RBC (1012/L)7.61 ± 0.257.49 ± 1.106.78 ± 1.368.33 ± 0.377.01 ± 1.617.79 ± 0.377.69 ± 0.40
HCT (%)38.7 ± 1.736.9 ± 8.238.2 ± 0.939.6 ± 3.140.0 ± 5.836.0 ± 8.341.0 ± 3.2
HGB (g/L)129 ± 5126 ± 20112 ± 25136 ± 8116 ± 27131 ± 4131 ± 7
PLT (109/L)569 ± 68616 ± 91572 ± 104639 ± 135543 ± 96553 ± 111600 ± 48
PT (s)9.64 ± 1.129.26 ± 0.639.11 ± 0.179.76 ± 0.719.50 ± 1.199.39 ± 0.729.78 ± 1.38
APTT (s)22.33 ± 5.6524.14 ± 6.5120.38 ± 7.3625.76 ± 6.5419.80 ± 2.8121.06 ± 4.8525.28 ± 8.74
NE (109/L)2.89 ± 1.122.71 ± 1.112.56 ± 0.972.14 ± 0.492.63 ± 1.103.19 ± 0.723.32 ± 2.00
LY (109/L)4.09 ± 1.153.50 ± 1.263.73 ± 1.562.44 ± 0.474.25 ± 1.243.76 ± 1.064.13 ± 1.42 b
EO (109/L)0.10 ± 0.090.06 ± 0.060.03 ± 0.020.06 ± 0.050.12 ± 0.120.11 ± 0.05 b0.09 ± 0.10
MO (109/L)0.26 ± 0.090.29 ± 0.160.28 ± 0.180.21 ± 0.050.30 ± 0.140.31 ± 0.130.37 ± 0.13
BA (109/L)0.03 ± 0.040.01 ± 0.030.00 ± 0.010.01 ± 0.010.05 ± 0.060.03 ± 0.020.01 ± 0.02
Females
WBC (109/L)3.91 ± 1.294.54 ± 2.324.80 ± 1.423.83 ± 2.084.14 ± 1.705.22 ± 1.184.05 ± 1.72
RBC (1012/L)6.34 ± 1.116.31 ± 1.396.41 ± 1.356.96 ± 1.726.94 ± 0.366.27 ± 1.286.50 ± 1.18
HCT (%)35.1 ± 6.337.4 ± 2.033.8 ± 7.036.0 ± 5.834.3 ± 8.034.7 ± 7.137.7 ± 10.0
HGB (g/L)113 ± 22112 ± 27113 ± 25122 ± 32124 ± 5111 ± 24120 ± 22
PLT (109/L)565 ± 95584 ± 102559 ± 112561 ± 132616 ± 82562 ± 120598 ± 114
PT (s)9.29 ± 0.719.28 ± 0.289.47 ± 1.009.33 ± 0.939.26 ± 0.469.85 ± 0.959.33 ± 0.62
APTT (s)28.00 ± 5.3230.18 ± 9.2226.20 ± 7.6026.87 ± 10.5226.09 ± 5.0528.28 ± 8.1530.58 ± 7.33
NE (109/L)1.30 ± 0.631.52 ± 0.761.39 ± 0.541.12 ± 0.641.17 ± 0.361.45 ± 0.501.27 ± 0.48
LY (109/L)2.34 ± 0.632.78 ± 1.343.18 ± 0.922.47 ± 1.382.74 ± 1.323.56 ± 0.732.57 ± 1.11
EO (109/L)0.09 ± 0.080.07 ± 0.100.03 ± 0.030.06 ± 0.080.06 ± 0.050.03 ± 0.030.03 ± 0.02
MO (109/L)0.14 ± 0.070.16 ± 0.140.20 ± 0.080.16 ± 0.090.16 ± 0.080.18 ± 0.080.16 ± 0.17
BA (109/L)0.04 ± 0.050.03 ± 0.070.01 ± 0.010.02 ± 0.030.02 ± 0.030.01 ± 0.020.01 ± 0.01
b p < 0.05 compared to groups with the same concentrations of non-GM carp. WBC: white blood cell; RBC: red blood cell; HCT: hematocrit; HGB: hemoglobin; PLT: platelet; PT: prothrombin time; APTT: activated partial thromboplastin time; NE: neutrophil; LY: lymphocyte; EO: eosinophils; MO: monocyte; BA: basophils.
Table 4. Terminal serum biochemistry of rats fed with different diets (n = 10/group; mean ± SD).
Control
Group
Non-GM CarpGH-ttc
2.5%5%10%2.5%5%10%
Males
ALT (U/L)50.7 ± 5.736.1 ± 7.4 a48.2 ± 6.3 a50.3 ± 4.941.5 ± 3.8 a38.0 ± 2.9 a46.4 ± 4.8
AST (U/L)175 ± 30160 ± 21216 ± 37219 ± 53175 ± 13187 ± 8177 ± 20
TP (g/L)59.7 ± 6.450.3 ± 11.052.6 ± 11.550.0 ± 11.448.2 ± 11.154.5 ± 6.959.9 ± 2.7
ALB (g/L)19.9 ± 2.419.5 ± 2.520.5 ± 2.420.9 ± 1.520.4 ± 1.118.9 ± 1.520.9 ± 1.5
ALP (U/L)92.4 ± 14.073.5 ± 13.676.3 ± 14.081.9 ± 21.173.4 ± 9.873.6 ± 14.280.8 ± 8.8
GGT (U/L)1.50 ± 0.882.90 ± 1.192.26 ± 1.083.56 ± 1.59 a2.87 ± 0.902.63 ± 1.192.69 ± 0.90
Glu (mmol/L)6.39 ± 1.865.65 ± 1.665.24 ± 1.147.22 ± 1.626.38 ± 1.304.65 ± 1.455.81 ± 1.73
Urea(mmol/L)10.17 ± 1.329.99 ± 1.319.13 ± 1.4810.43 ± 1.579.07 ± 1.219.65 ± 2.1311.20 ± 1.77
Cr (μmol/L)38.8 ± 8.035.4 ± 6.435.5 ± 4.742.4 ± 9.538.5 ± 4.134.6 ± 5.939.3 ± 4.4
TC (mmol/L)2.76 ± 0.392.35 ± 0.442.45 ± 0.592.56 ± 0.802.23 ± 0.641.84 ± 0.36 a2.45 ± 0.45
TG (mmol/L)0.43 ± 0.080.44 ± 0.170.46 ± 0.080.54 ± 0.130.47 ± 0.060.52 ± 0.260.43 ± 0.09
LDH (U/L)2696 ± 6252156 ± 7362635 ± 4882682 ± 5402673 ± 3342630 ± 3462456 ± 627
K (mmol/L)4.64 ± 0.504.45 ± 0.294.38 ± 0.314.66 ± 0.264.23 ± 0.234.36 ± 0.304.67 ± 0.22
Na (mmol/L)126.8 ± 3.7124.8 ± 4.0128.7 ± 5.3127.5 ± 4.4127.3 ± 3.9125.2 ± 4.5128.7 ± 2.8
Cl (mmol/L)117.5 ± 5.3123.2 ± 7.6118.1 ± 5.0120.2 ± 8.1131.1 ± 7.9120.3 ± 9.3121.3 ± 7.3
Females
ALT (U/L)70.4 ± 10.366.6 ± 23.067.2 ± 13.657.4 ± 15.556.3 ± 10.756.5 ± 16.068.5 ± 20.3
AST (U/L)169 ± 41196 ± 25164 ± 32187 ± 40187 ± 35181 ± 39203 ± 54
TP (g/L)79.3 ± 10.359.5 ± 6.8 a61.3 ± 18.750.2 ± 19.3 a68.8 ± 10.059.7 ± 9.8 a66.0 ± 19.0
ALB(g/L)29.2 ± 3.530.1 ± 2.528.8 ± 5.225.2 ± 2.627.7 ± 2.425.2 ± 1.929.1 ± 4.7
ALP (U/L)67.0 ± 24.678.9 ± 36.976.1 ± 24.073.8 ± 37.673.4 ± 19.474.8 ± 26.366.1 ± 16.7
GGT (U/L)3.41 ± 1.033.23 ± 1.042.62 ± 0.492.95 ± 1.213.62 ± 1.372.97 ± 1.072.45 ± 0.89
Glu (mmol/L)9.51 ± 2.949.17 ± 1.947.64 ± 3.298.66 ± 2.538.40 ± 2.296.44 ± 2.148.00 ± 1.71
Urea(mmol/L)8.18 ± 1.669.17 ± 1.859.54 ± 2.329.71 ± 1.889.57 ± 1.578.74 ± 1.8911.70 ± 2.77
Cr (μmol/L)63.4 ± 7.857.8 ± 8.557.8 ± 10.958.6 ± 7.360.2 ± 11.753.9 ± 8.468.4 ± 10.9
TC (mmol/L)2.88 ± 0.452.03 ± 0.582.33 ± 0.902.12 ± 0.622.19 ± 0.30 a2.27 ± 0.462.76 ± 0.63
TG (mmol/L)0.54 ± 0.110.51 ± 0.130.53 ± 0.120.45 ± 0.110.44 ± 0.080.72 ± 0.310.89 ± 0.29 b
LDH (U/L)2052 ± 7672380 ± 5381884 ± 6291967 ± 4312314 ± 9452140 ± 4872119 ± 996
K (mmol/L)3.56 ± 0.323.57 ± 0.303.66 ± 0.343.79 ± 0.543.86 ± 0.513.81 ± 0.363.65 ± 0.42
Na (mmol/L)118.4 ± 5.2123.5 ± 2.8125.7 ± 4.0 a118.1 ± 3.2122.5 ± 4.3122.7 ± 4.5120.3 ± 5.1
Cl (mmol/L)136.9 ± 19.1132.8 ± 7.8135.0 ± 5.6140.5 ± 16.4131.2 ± 11.5135.0 ± 7.0143.1 ± 7.9
a p < 0.05 compared to the basic control group. b p < 0.05 compared to groups with the same concentrations of non-GM carp. ALT: aminotransferase; AST: aspartate aminotransferase; TP: total protein; ALB: albumin; ALP: alkaline phosphatase; GGT: glutamyl transpeptidase; Cr: creatinine; TC: total cholesterol; TG: triglyceride; LDH: lactate dehydrogenase; Cl: chlorine; K: potassium; and Na: sodium.
Table 5. Urinalysis of female and male Wistar rats (n = 10/group; mean ± SD).
Control GroupNon-GM CarpGH-ttc
2.5%5%10%2.5%5%10%
Males
Glucose (mmol/L)0 ± 00 ± 00 ± 00 ± 00 ± 00 ± 00 ± 0
Specific gravity1.019 ± 0.0111.012 ± 0.0091.012 ± 0.0081.014 ± 0.0091.016 ± 0.0121.011 ± 0.0041.009 ± 0.004
Occult blood (Cell/μL)0 ± 00 ± 00 ± 00 ± 00 ± 00 ± 00 ± 0
pH5.35 ± 0.755.30 ± 0.635.15 ± 0.475.25 ± 0.794.70 ± 1.775.45 ± 0.725.15 ± 0.47
Females
Glucose (mmol/L)0 ± 00 ± 00 ± 00 ± 00 ± 00 ± 00 ± 0
Specific gravity1.019 ± 0.0101.017 ± 0.0101.010 ± 0.0091.012 ± 0.0071.016 ± 0.0131.011 ± 0.0081.015 ± 0.009
Occult blood (Cell/μL)0 ± 00 ± 00 ± 00 ± 00 ± 00 ± 00 ± 0
pH5.30 ± 0.635.10 ± 0.325.30 ± 0.635.00 ± 05.85 ± 0.785.40 ± 0.665.20 ± 0.42
Table 6. Organ weight of rats fed with different diets (mean ± SD, g).
Control GroupNon-GM CarpGH-ttc
2.5%5%10%2.5%5%10%
Males
Brain2.09 ± 0.082.10 ± 0.102.08 ± 0.132.09 ± 0.132.07 ± 0.082.10 ± 0.072.01 ± 0.25
Liver12.65 ± 0.5513.34 ± 1.6113.32 ± 1.5612.07 ± 1.3312.44 ± 1.9012.22 ± 1.3713.35 ± 3.99
Spleen0.89 ± 0.200.98 ± 0.140.94 ± 0.110.81 ± 0.130.88 ± 0.150.97 ± 0.160.92 ± 0.13
Heart1.45 ± 0.121.43 ± 0.131.55 ± 0.191.41 ± 0.131.55 ± 0.151.33 ± 0.13 b1.38 ± 0.17
Thymus0.39 ± 0.090.47 ± 0.120.51 ± 0.100.40 ± 0.080.44 ± 0.160.42 ± 0.070.40 ± 0.10
Kidney3.52 ± 0.183.92 ± 0.523.87 ± 0.433.79 ± 0.273.70 ± 0.483.77 ± 0.223.86 ± 0.46
Adrenal gland0.064 ± 0.0090.067 ± 0.0140.070 ± 0.0160.062 ± 0.0150.065 ± 0.0120.064 ± 0.0170.063 ± 0.014
Testis3.60 ± 0.333.75 ± 0.413.64 ± 0.213.39 ± 0.123.47 ± 0.313.72 ± 0.283.44 ± 0.46
Epididymis1.55 ± 0.191.74 ± 0.461.63 ± 0.301.55 ± 0.281.60 ± 0.221.65 ± 0.311.68 ± 0.42
Females
Brain1.89 ± 0.061.87 ± 0.101.94 ± 0.101.86 ± 0.091.82 ± 0.091.90 ± 0.071.87 ± 0.10
Liver8.16 ± 1.188.56 ± 0.868.39 ± 0.978.28 ± 0.947.68 ± 0.697.56 ± 0.6210.41 ± 1.3 a
Spleen0.59 ± 0.070.60 ± 0.060.64 ± 0.060.58 ± 0.060.53 ± 0.090.58 ± 0.070.65 ± 0.16
Heart0.95 ± 0.100.93 ± 0.050.98 ± 0.101.00 ± 0.100.94 ± 0.090.95 ± 0.101.07 ± 0.09
Thymus0.31 ± 0.070.32 ± 0.060.36 ± 0.120.30 ± 0.090.31 ± 0.070.35 ± 0.070.36 ± 0.07
Kidney1.90 ± 0.092.05 ± 0.162.06 ± 0.132.08 ± 0.152.05 ± 0.221.94 ± 0.162.26 ± 0.25 a
Adrenal gland0.087 ± 0.0120.112 ± 0.014 a0.098 ± 0.0090.096 ± 0.0150.089 ± 0.021 b0.089 ± 0.0100.100 ± 0.017
Ovary0.16 ± 0.040.17 ± 0.050.20 ± 0.030.16 ± 0.030.18 ± 0.040.19 ± 0.050.17 ± 0.06
Uterus0.69 ± 0.230.74 ± 0.400.68 ± 0.240.56 ± 0.120.63 ± 0.250.67 ± 0.220.64 ± 0.19
a p < 0.05 compared to basic control group. b p < 0.05 compared to groups with the same concentrations of non-GM carp.
Table 7. Summary of anatomic pathology findings.
MaleFemale
Control Group10% Non-GM Carp Group10% GH-ttc GroupControl Group10% Non-GM Carp Group10% GH-ttc Group
HeartFocal inflammation1/101/101/101/100/100/10
KidneyChronic progressive nephropathy1/101/100/100/100/100/10
LungSlight focal inflammation1/100/100/101/102/100/10
Thyroid glandExfoliation of follicle epithelial cell1/100/100/100/100/100/10
Adrenal glandCentral edema0/80/100/100/102/100/10
Publisher’s Note: MDPI stays neutral with regard to jurisdictional claims in published maps and institutional affiliations.

