Article

Modelling Fish Growth with Imperfect Data: The Case of Trachurus picturatus

1
Departamento de Biologia Animal, Faculdade de Ciências, Universidade de Lisboa, Campo Grande, 1749-016 Lisboa, Portugal
2
MARE—Marine and Environmental Sciences Centre, Campo Grande, 1749-016 Lisboa, Portugal
3
MARE—Marine and Environmental Sciences Centre, ESTM, Polytechnic of Leiria, Cetemares, 2520-620 Peniche, Portugal
4
MARE—Marine and Environmental Sciences Centre, Polytechnic of Leiria, Cetemares, 2520-620 Peniche, Portugal
5
CE3C—Centre for Ecology, Evolution and Environmental Changes, Campo Grande, 1749-016 Lisboa, Portugal
*
Author to whom correspondence should be addressed.
Fishes 2022, 7(1), 52; https://doi.org/10.3390/fishes7010052
Submission received: 7 January 2022 / Revised: 14 February 2022 / Accepted: 15 February 2022 / Published: 18 February 2022
(This article belongs to the Special Issue Assessment of Fisheries Impact on Species and Marine Ecosystems)

Abstract

:
Growth modelling is essential to inform fisheries management but is often hampered by sampling biases and imperfect data. Additional methods such as interpolating data through back-calculation may be used to account for sampling bias but are often complex and time-consuming. Here, we present an approach to improve plausibility in growth estimates when small individuals are under-sampled, based on Bayesian fitting growth models using Markov Chain Monte Carlo (MCMC) with informative priors on growth parameters. Focusing on the blue jack mackerel, Trachurus picturatus, which is an important commercial fish in the southern northeast Atlantic, this Bayesian approach was evaluated in relation to standard growth model fitting methods, using both direct readings and back-calculation data. Matched growth parameter estimates were obtained with the von Bertalanffy growth function applied to back-calculated length at age and the Bayesian fitting, using MCMC to direct age readings, with both outperforming all other methods assessed. These results indicate that Bayesian inference may be a powerful addition in growth modelling using imperfect data and should be considered further in age and growth studies, provided relevant biological information can be gathered and included in the analyses.

Graphical Abstract

1. Introduction

Information on growth and age is critical for fisheries assessment, and specifically for defining population structure, recruitment and mortality [1]. For instance, growth parameters are essential to build age structured catch curves and derive natural and total mortality corresponding to the negative components in stock dynamics. Growth in fish has been typically described through length-at-age analysis using the von Bertalanffy growth model. However, it is increasingly recognized that new methods, models, and model selection procedures may be required to account for variability in growth due to multiple species-specific and environmental factors, and for avoiding problems associated with sampling bias and imperfect data (see review in [2]).
Estimating the growth of fish is particularly challenging when not all length or age classes can be effectively sampled [3]. Fishing gear selectivity often leads to unrepresentative samples of the smallest or the largest size classes, which are essential to define the ends of growth curves. Several methods have been used to deal with under-sampling, including back-calculating, length-at-age [4] and constraining model fits by fixing asymptotic length (L), or age at length zero (t0) parameters when large and small individuals are missed, respectively [3]. More recently, Bayesian approaches incorporating prior knowledge into the analysis and producing a combined output from the priors and the data available have also gained emphasis in length-at-age analyses (e.g., [5,6,7,8]). However, applications of Bayesian inference in growth modelling are still limited, and more empirical evidence on the relative benefits of the different methods dealing with poor quality data from biased sampling is needed.
Here, we document the use of a Bayesian approach and traditional methods aiming to overcome under-sampling of small fish in estimating the growth of the blue jack mackerel Trachurus picturatus off the west Portuguese continental coast. This pelagic fish inhabits the neritic zones of island shelves, banks and seamounts, from the southern Bay of Biscay to southern Morocco, including the Macaronesia archipelagos, Tristan de Cunha and Gough Islands, and in the Western part of the Mediterranean Sea and the Black Sea [9]. It is an important commercial fish in the southern northeast Atlantic and was the fifth most landed fish in the Portuguese mainland in 2019, reaching 2376 ton [10]. It is often caught with horse mackerel, T. trachurus, and its landings have suffered strong fluctuations in the last 15 years [11]. Despite its relevance, there is a clear lack of information on growth and mortality for European continental coast.
Specifically, we assess growth parameters for the T. picturatus population off the west Portuguese coast, using different methodologies (Bayesian and frequentist ones, including back-calculating length-at-age and fixing model parameters) to overcome the constraints of under-sampling small individuals from commercial landings. Furthermore, we also provide a valid and prompt approach that overcomes the constraints of commonly used time-consuming methods. Along with growth parameters, species mortality and exploitation rate are also estimated for the area for the first time, providing accurate and useful biological information for fisheries management of this data-limited resource.

2. Materials and Methods

2.1. Fish Sampling and Analysis

Samples of blue jack mackerel were obtained from commercial vessels operating with bottom trawl, longline, gillnets and trammel nets, off mainland Portugal (Peniche). For growth analysis, a total of 588 individuals, were collected monthly between September 2018 and August 2019, measured in fresh for total length (TL to the nearest 0.1 cm) and dissected for sex assessment. Sagitta otoliths (hereinafter mentioned as otoliths) were removed, rinsed with water, air dried and stored in labelled vials for further ageing analysis. For mortality estimation, length distributions of fish in landings were recorded, whenever possible, at least twice a month from April 2018 to August 2019, covering 22 vessels from the different gears that capture the species (Supplementary Table S1), in a total of 1467 specimens.

2.2. Ageing Assignment and Precision

Right otoliths were immersed in water with the sulcus acusticus side down, read under reflected light against a dark background, using a stereomicroscope (Nikon SMZ745T, Tokyo, Japan), and photographed with a coupled digital camera (Leica DFC290, Heerbrugg, Switzerland). Annual growth increments were considered as the succession of one opaque and one translucent increment, following previous validation of periodic increment formation from marginal increment analyses by [12].
Most of the otoliths (67%) were read by three authors (AN, ARV, LSG), while the remaining were read by two. Precision and reproducibility of age readings were evaluated with the average percentage error (APE, [13]), the average coefficient of variation (CV, [14]), and the percentage of perfect agreement (PAgree), using the FSA package [15] in RStudio [16]. Age assignments required at least two equal readings.

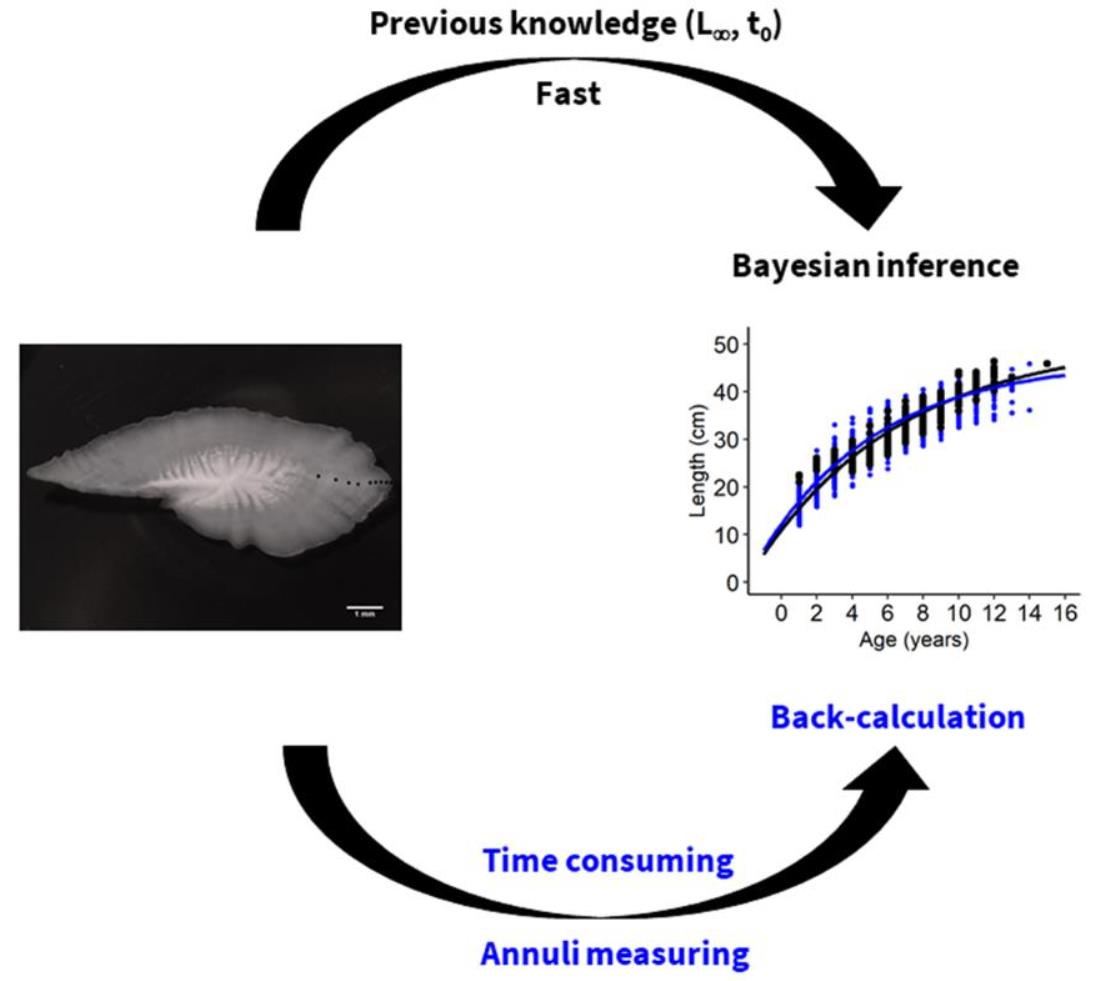
2.3. Back-Calculation of Lengths

Growth increments were measured on otolith images along a single axis from the otolith nucleus to the marginal edge in the otolith’s posterior region, with measurements taken from the outer edge of each translucent increment. Overall, 2679 measurements were taken from images of a representative subsample of 376 otoliths using ObjectJ (a plugin for ImageJ software, https://sils.fnwi.uva.nl/bcb/objectj/, accessed on 22 July 2019).
The relationship between TL and otolith radius (OR) was described using the power function TL = c × ORd. Length-at-age (TLi) was back-calculated from each increment radius (ORi), using the Monastyrsky formula [17]: TLi = (ORi/OR)d × TL.

2.4. Growth Modelling

Model building and assessment involved three steps, and two length-at-age data sets from direct readings (DR) and from back-calculation (BC). In the first step, three commonly used growth functions, the von Bertalanffy (VBGF), the Gompertz, and the logistic, were fitted to each data set using the FSA package [15] in RStudio [16], and screened considering the Akaike Information Criteria (AIC, [18]) with the model minimizing AIC being retained as the best growth function. Models were built separately for males and females and differences in growth between sexes were evaluated for the best growth function with likelihood ratio tests as implemented in the fishmethods package [19]. In the second step, the function retained as the best was used to build two additional models for the length at age data derived from direct readings, by fixing t0 at 0 (DRfix) and by using a Bayesian approach (DRBayes) fitted in R environment with rstan package [20]. In the later, four Markov Chain Monte Carlo (MCMC) chains with 10,000 simulations were used to determine parameter posterior distributions with a burn in period of 2000 simulations and thinning = 1. Normally distributed informative priors were set for L and t0, with mean L determined from the maximum length of fish found in landings (50 cm) and t0 set to 0. Standard deviation was initially defined as 10% of the mean value for L and as 0.1 for t0 and increased or reduced as needed to improve the growth model fit. Priors for L were kept with a mean = 50 and SD = 5 since changing the SD did not affect the model fit. The t0 priors were set to mean = 0 and SD = 0.2, as this increase clearly improved the curve fit to the observed points. For the growth rate coefficient (k) a uniform distribution bounded from 0 to 0.5 was defined, and the residual standard error (σ) prior was also defined with a uniform distribution ranging from 0 to 5. The model code used was based on [21] and is given in Supplementary Texts S1 and S2. The Bayesian model was checked for convergence and efficiency with R-hat convergence diagnostic and Effective Sample Size produced by rstan package [20]. Diagnostic plots produced using the bayesplot R package [22] were examined to check that chains had mixed and that there was no autocorrelation (Supplementary Text S2). Finally, in the third step, the four growth models derived from length-at-age data from direct readings, with and without t0 constraint and using the Bayesian approach and from the back-calculated length-at-age data were evaluated for relative suitability. Because differences in sample sizes precluded the use of model selection statistics such as the AIC [18], models were visually inspected for their fit to the data, and the model that provided the most biologically reliable parameter estimates according to the species biology was judged as most plausible, as in other fisheries studies [8].

2.5. Mortality

Total instantaneous mortality rate, Z, was estimated using the Chapman–Robson mortality estimator [23], with the first age group used being 1 year older than the age of peak abundance [24]. Instantaneous natural mortality rate (M) was estimated using the updated Hoenignls tmax-based estimator, M = 4.899 × tmax−0.916 and the Paulynls-T estimator, M = 4.118 × k0.73 × L−0.33 [25]. Temperature was not included in the Pauly estimator because it added no information to the model [25,26]. The growth parameters used were the ones from the best fitted growth model. Fishing mortality and exploitation rates were estimated as F = Z − M and E = F/Z, respectively. Mortalities estimates were obtained using the R package FSA [15].
Graphics, excluding those from Bayesian analyses, were carried out using ggplot2 package [27] and significance of statistical testing was set at p-value < 0.05.

3. Results

3.1. Ageing Precision

From the 588 otoliths read, 13 (2%) were excluded due to divergent readings.
Precision in ageing among all readers was moderate (CV = 7.04; APE = 5.36%; PA = 36%) but improved between two readers only, with percentage of agreement within yearly intervals above 90% (Table 1). The first four increments were typically wider than the subsequent, which become thinner and closer with age. Mean increment radius showed a large overlay for ages above 3 (Supplementary Figure S1).

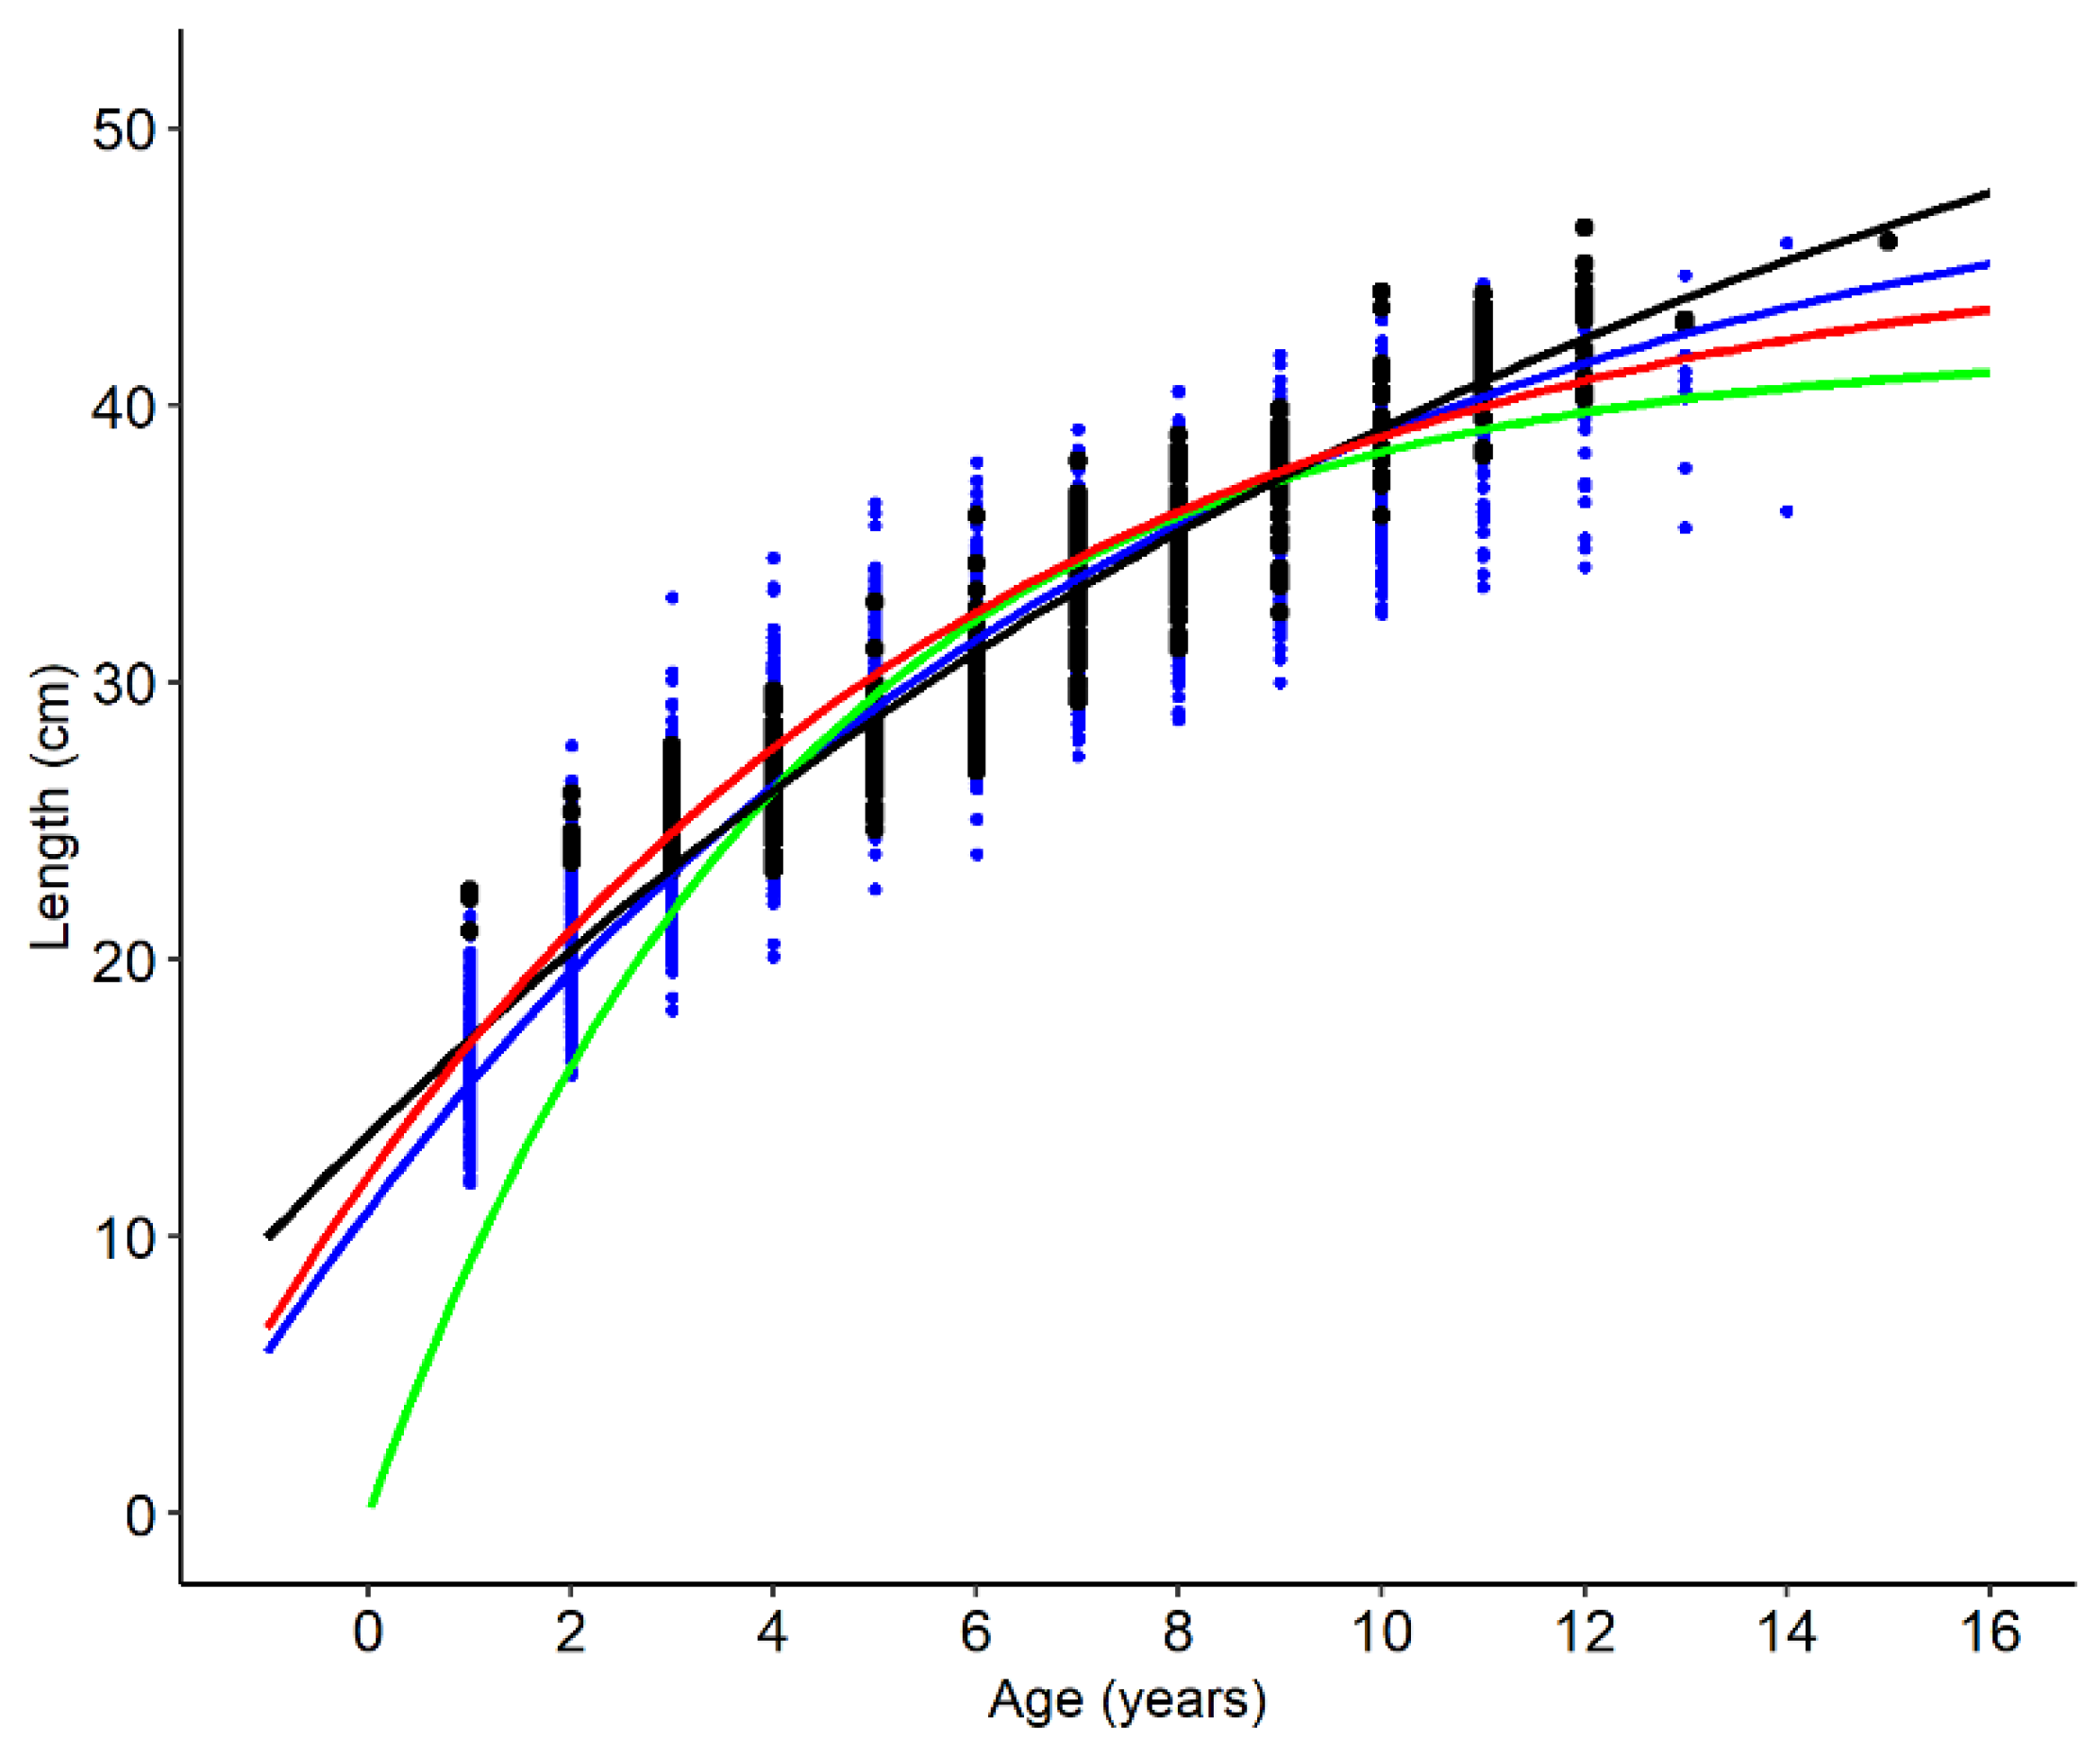
3.2. Growth Modelling

Length distribution for specimens used in each data set (direct reading and back-calculation) had similar ranges and are given in Table 2 and Supplementary Figure S2. Fish were aged 1 to 15 years, but most (67%) were 4 to 8 years (Supplementary Table S2). Age–length keys (ALK) derived using data from direct readings and back-calculation are in Supplementary Tables S2 and S3, respectively. Because no statistical differences in growth between sexes were found (chi-square = 1.11, df = 1, p-value = 0.292), ALK were determined pooling all individuals.
The VBGF showed a better fit than the Gompertz and the logistic functions to DR and BC length data for both sexes (Table 3). Therefore, the VBGF was retained as the best and used for building additional models with constrained growth parameters and using the Bayesian approach. The four models built using the VGBF are presented in Figure 1 and the respective parameter estimates are given in Table 4. The growth parameters estimated from the DR length data varied considerably with the approach used. Common VBGF produced an unreliable large L and a very negative t0, while fixing t0 at 0 considerably underestimated the L. The Bayesian analysis produced more biological reliable estimates for both L and t0. The growth rate coefficient, k, varied accordingly to the estimation of the other parameters, being higher when L was smaller and t0 higher. Parameters estimated by the Bayesian approach were similar to those estimated with the VBGF applied to the BC data set, with the value for L closer to the maximum length found for the species. Growth thus appeared to be more plausibly described by Bayesian inference applied to DR, which showed the most biologically appropriate parameter estimates (Table 4).

3.3. Mortality

Length distribution of landed catches is presented in Supplementary Figure S3. Total mortality (Supplementary Figure S4) was estimated as 0.94 yr−1 (95% CI: 0.87–1.01 yr−1). Natural mortality varied greatly according to the estimator used, from 0.24 yr−1 (95% CI: 0.21–0.25 yr−1) with Paulynls-T estimator to 0.41 yr–1 with Hoenignls tmax-based estimator. Accordingly, the fishing mortality was estimated as 0.70 yr–1 (95% CI: 0.62–0.80 yr–1) and 0.53 yr−1 (95% CI: 0.46–0.60 yr–1), and the estimated exploitation rate varied between 0.56 (95% CI: 0.53–0.59) and 0.74 (95% CI: 0.71–0.79).

4. Discussion

Estimates of growth parameters are critical for fisheries assessment and management. However, sampling biases and consequent underrepresentation of small or large individuals strongly influences growth parameter estimation. Here, different approaches to overcome the under-sampling of small individuals and expedite growth estimation were evaluated, using as case study blue jack mackerel T. picturatus, which is an important commercial fish in the Portuguese continental coast.

4.1. Ageing Precision

Although T. picturatus otoliths present some difficulties in age interpretation, such as the presence of false rings [28], the precision indices obtained for the three readers were within acceptable ranges (CV < 7.6% and APE < 5.5%, [29]), and much lower than those adopted in the literature when evaluated between each pair of readers, indicating reliable age assignment.

4.2. Growth Modelling

Despite the reliable aging process, the lack of small individuals limits the estimation of growth model parameters, and, to overcome this issue, some additional techniques were applied. Back-calculation is commonly used to generate body length at younger ages and has proved to be an important tool for fisheries scientists and fish ecologists [17]. This was also the case in here, with estimated parameters of the VBGF with BC data being more accurate than those from DR data. Even when t0 was fixed at 0 years, the VBGF for DR data set continued to produce less accurate parameter estimates than BC data set. Although BC appears to adequately account for imperfect data for small individuals, this procedure is very time consuming and complex, requiring skilled researchers for reliable results, and additional approaches to facilitate growth estimation would be beneficial.
The Bayesian approach presented here appeared effective in accounting for missing younger ages and modelling fish growth. Parameter estimates for the VBGF obtained from DR data set analysed with Bayesian inference, were similar to those obtained with BC data but better matching the known maximum length. This adds to previous evidence demonstrating the utility of Bayesian inference in modelling fish growth with imperfect data and sample sizes. Bayesian approaches have been shown to produce equivalent or improved growth estimates relative to frequentist approaches in multiple species, except for large samples including all age classes [8]. Although the Bayesian inference needs considerably more statistical and programming expertise, it is simple to implement in open-source statistical environments, such as R [30]. A good prior selection and a careful examination of Bayesian diagnostics are essential to successfully estimate growth parameters [21], and the mean value of 10% as SD should be updated in future studies as this is just a hypothesis. However, the use of the Bayesian approach is clearly a good choice for biased sampling data.

4.3. Age and Growth

Enhanced life history knowledge on commercial fish species is essential for proper resource exploitation, and this is the first time that growth of T. picturatus was evaluated for the Portuguese continental coast. The species lifespan and length range differ considerably across areas, with a maximum of 6 years for individuals under 32 cm TL reported for the Canary Islands [12] and a maximum age of 18 years for individuals around 50 cm fork length in Azores [31]. Nevertheless, for similar lengths, age assignments in both studies were similar to those reported here. It is also worth noting the wide length range per age class reported in all studies, indicative of a high variability in individual growth for the species.
Differences found in growth parameters among the Azores, Madeira, Canary Islands and Portugal mainland are more likely related to the length range sampled in each area than to the methodology used. The higher maximum length sampled the lower the growth rate [32]. However, a sharp decrease in T. picturatus growth rate has been reported in the Portuguese archipelagos in recent decades, decreasing from 0.20 yr−1 [33] to 0.09 yr−1 [31] in Azores and from 0.32 yr−1 [34] to 0.14 yr−1 [35] in Madeira. It would be interesting to explore if such a decrease is primarily related to fishing pressure adaptation or to other biotic and abiotic environmental factors.

4.4. Mortality

Mortality is another important life history parameter in population dynamics; however, direct and reliable estimates of natural mortality rate are difficult to obtain, and several authors defend that such estimates should consider variations in age and size (e.g., [26,36]). Nevertheless, a single value for M can still constitute a useful representation of mortality and the assumption of a constant M in stock assessments is still widely used [25]. For the west Portuguese coast, M was estimated by two different methods, one based on tmax and the other on k and L. Estimated values varied greatly depending on the method used (0.24 yr−1 and 0.41 yr−1), which was expected as the Hoenignls estimator produces higher M estimates than the Paulynls-T for stocks that experience M higher than 0.2 yr−1 [25]. However, despite the used estimator, fishing mortality was high, and E was, in both cases, well above the value of 0.4, suggested as a guideline for the appropriate exploitation of pelagic stocks [37].
The sustainable exploitation of fish stocks is vital to preserve fisheries [38]. T. picturatus is only subject to advice in ICES subdivision 10.a.2 (Azores grounds), yet no assessment is made for this area because no reference points have been defined [39]. A decline in fish length and weight in the catches landed in Madeira, as well as a decrease of 2.78 cm in the length at first maturity throughout the past 14 years, was already detected by [40], suggesting high levels of fishing mortality and indicating that the T. picturatus population of Madeira has been exploited above sustainable levels. For the Portuguese continental coast, no temporal length series was available and therefore it was not possible to evaluate trends in fish length. The exploitation rate estimated in the present study was high, but over 80% of landed individuals were larger than 30 cm TL, which suggests that the species is still not under excessive fishing pressure. However, it is essential that additional information on T. picturatus will be gathered regularly to improve stock status knowledge and avoid future overexploitation of the species.

5. Conclusions

The use of the Bayesian inference seems to be a good choice to model the growth of species where not all length classes are well represented in the sampling, and to avoid time-consuming methodologies such as back-calculation.
T. picturatus is a commercially important species in Portuguese fisheries and the results obtained in this study suggest that catches should be monitored to avoid stock overfishing.

Supplementary Materials

The following supporting information can be downloaded at: https://www.mdpi.com/article/10.3390/fishes7010052/s1, Text S1: Stan code to fit von Bertalanffy growth model; Text S2: R Code and results for Bayesian diagnostic procedures; Figure S1: Frequency distributions of growth increments at age; Figure S2: Length distribution for the two data sets used for Trachurus picturatus growth modelling; Figure S3: Length distribution of Trachurus picturatus from landings in Peniche port; Figure S4: Chapman-Robson estimates of annual survival rate and instantaneous mortality; Table S1: Age and mortality sampling description; Table S2: Age-length-key from direct readings data; Table S3: Age-length-key from back-calculated data.

Author Contributions

L.S.G., M.F.M., R.R. and C.A. funding acquisition and conceptualization, A.N., V.S., A.R.V., E.S., F.S., A.M.D., R.G. and M.M.G. samples collection. A.N., A.R.V. and L.S.G. otolith reading. A.N., M.F.M. and S.M. data analyses. A.N. and M.F.M. original draft writing. All authors have read and agreed to the published version of the manuscript.

Funding

This publication was funded by the European Maritime and Fisheries Fund MAR2020 project “VALOREJET: Valorização de espécies rejeitadas e de baixo valor comercial”, MAR-01.03.01-FEAMP-0003 and by Fundação para a Ciência e Tecnologia through research contracts attributed to Vera Sequeira (CEECIND/02705/2017) and Ana Rita Vieira (CEECIND/01528/2017) and strategic project UIBD/04292/2020.

Institutional Review Board Statement

Not applicable.

Data Availability Statement

The data underlying this article will be shared on reasonable request to the corresponding author.

Conflicts of Interest

The authors declare no conflict of interest.

References

  1. Labropoulou, M.; Papaconstantinou, C. Comparison of otolith growth and somatic growth in two macrourid fishes. Fish. Res. 2000, 46, 177–188. [Google Scholar] [CrossRef]
  2. Flinn, S.A.; Midway, S.R. Trends in Growth Modelling in Fisheries Science. Fishes 2021, 6, 1. [Google Scholar] [CrossRef]
  3. Gwinn, D.C.; Allen, M.S.; Rogers, M.W. Evaluation of procedures to reduce bias in fish growth parameter estimates resulting from size-selective sampling. Fish. Res. 2010, 105, 75–79. [Google Scholar] [CrossRef]
  4. Francis, R.I.C.C. Back-calculation of fish length: A critical review. J. Fish. Biol. 1990, 36, 883–902. [Google Scholar] [CrossRef]
  5. Siegfried, K.I.; Sanso, B. Two Bayesian methods for estimating parameters of the von Bertalanffy growth equation. Environ. Biol. Fishes. 2006, 77, 301–308. [Google Scholar] [CrossRef]
  6. Bijak, J.; Bryant, J. Bayesian demography 250 years after Bayes. Popul. Stud. 2016, 70, 1–19. [Google Scholar] [CrossRef] [PubMed] [Green Version]
  7. Doll, J.C.; Jacquemin, S.J. Introduction to Bayesian modeling and inference for fisheries scientists. Fisheries 2018, 43, 152–161. [Google Scholar] [CrossRef]
  8. Smart, J.J.; Grammar, G.L. Modernising fish and shark growth curves with Bayesian length-at-age models. PLoS ONE 2021, 16, e0246734. [Google Scholar] [CrossRef]
  9. Smith-Vaniz, W.F. Carangidae. In Fishes of the North-Eastern Atlantic and the Mediterranean; Whitehead, P.J.P., Bauchot, M.L., Hureau, J.C., Nielsen, J., Tortonense, E., Eds.; UNESCO: Paris, France, 1986; Volume 2, pp. 815–844. [Google Scholar]
  10. INE. Instituto Nacional de Estatística—Estatísticas da Pesca; INE: Lisboa, Portugal, 2019; Available online: https://www.ine.pt/xurl/pub/435690295 (accessed on 15 July 2021).
  11. ICES. Working Group on Southern Horse Mackerel, Anchovy and Sardine (WGHANSA). ICES Sci. Rep. 2019, 1, 34. [Google Scholar]
  12. Jurado-Ruzafa, A.; Santamaría, M.T.G. Age, growth and natural mortality of blue jack mackerel Trachurus picturatus (Carangidae) from the Canary Islands, Spain (NW Africa). Afr. J. Mar. Sci. 2018, 40, 451–460. [Google Scholar] [CrossRef]
  13. Beamish, R.J.; Fournier, D.A. A method for comparing the precision of a set of age determinations. Can. J. Fish. Aquat. Sci. 1981, 38, 982–983. [Google Scholar] [CrossRef]
  14. Chang, W.Y.B. A statistical method for evaluating the reproducibility of age determination. Can. J. Fish. Aquat. Sci. 1982, 39, 1208–1210. [Google Scholar] [CrossRef]
  15. Ogle, D.H.; Wheeler, P.; Dinno, A. FSA: Fisheries Stock Analysis; R Package Version 0.8.32. 2021. Available online: https://github.com/droglenc/FSA (accessed on 20 June 2021).
  16. RStudio Team. RStudio: Integrated Development for R. RStudio; PBC: Boston, MA, USA, 2021. [Google Scholar]
  17. Vigliola, L.; Meekan, M.G. The back-calculation of fish growth from otoliths. In Tropical Fish Otoliths: Information for Assessment, Management and Ecology; Green, B., Mapstone, B., Carlos, G., Begg, G., Eds.; Springer: Dordrecht, The Netherlands, 2009; pp. 174–211. [Google Scholar]
  18. Sakamoto, Y.; Ishiguro, M.; Kitagawa, G. Akaike Information Criterion Statistics; D. Reidel: Dordrecht, The Netherlands, 1986. [Google Scholar]
  19. Nelson, G.A. Fishmethods: Fishery Science Methods and Models; R Package Version 1.11-1. 2019. Available online: https://CRAN.R-project.org/package=fishmethods (accessed on 11 February 2020).
  20. Stan Development Team. RStan: The R Interface to Stan; R package version 2.21.2. 2020. Available online: https://mc-stan.org/ (accessed on 10 October 2020).
  21. Doll, J.C.; Jacquemin, S.J. Bayesian model selection in fisheries management and ecology. J. Fish Wildl. Manag. 2019, 10, 691–707. [Google Scholar] [CrossRef] [Green Version]
  22. Gabry, J.; Mahr, T. Bayesplot: Plotting for Bayesian Models; R Package Version 1.8.0. 2021. Available online: https://mc-stan.org/bayesplot (accessed on 1 February 2021).
  23. Chapman, D.G.; Robson, D.S. The analysis of a catch curve. Biometrics 1960, 16, 354–368. [Google Scholar] [CrossRef]
  24. Smith, M.W.; Then, A.Y.; Wor, C.; Ralph, G.; Pollock, K.H.; Hoenig, J.M. Recommendations for catch-curve analysis. N. Am. J. Fish. Manag. 2012, 32, 956–967. [Google Scholar] [CrossRef]
  25. Then, A.Y.; Hoenig, J.M.; Hall, N.G.; Hewitt, D.A. Evaluating the predictive performance of empirical estimators of natural mortality rate using information on over 200 fish species. ICES J. Mar. Sci. 2015, 72, 82–92. [Google Scholar] [CrossRef]
  26. Gislason, H.; Daan, N.; Rice, J.C.; Pope, J.G. Size, growth, temperature and the natural mortality of marine fish. Fish Fish. 2010, 11, 149–158. [Google Scholar] [CrossRef]
  27. Wickham, H. ggplot2: Elegant Graphics for Data Analysis; Springer: New York, NY, USA, 2016. [Google Scholar]
  28. ICES. Workshop on Age reading of Horse Mackerel, Mediterranean Horse Mackerel and Blue Jack Mackerel (Trachurus trachurus, T. mediterraneus and T. picturatus) (WKARHOM3). ICES CM 2018/EOSG. Livorno, Italy. 2018, Volume 28. Available online: https://archimer.ifremer.fr/doc/00471/58264/60778.pdf (accessed on 10 March 2021).
  29. Campana, S.E. Accuracy, precision and quality control in age determination, including a review of the use and abuse of age validation methods. J. Fish Biol. 2001, 59, 197–242. [Google Scholar] [CrossRef]
  30. R Core Team. R: A Language and Environment for Statistical Computing; R Foundation for Statistical Computing: Vienna, Austria, 2020. [Google Scholar]
  31. Garcia, A.; Pereira, J.G.; Canha, A.; Reis, D.; Diogo, H. Life history parameters of blue jack mackerel Trachurus picturatus (Teleostei: Carangidae) from northeast Atlantic. J. Mar. Biol. Assoc. 2015, 95, 401–410. [Google Scholar] [CrossRef]
  32. Gallucci, V.F.; Quinn, T.J., II. Reparameterizing, fitting, and testing a simple growth model. Trans. Am. Fish. Soc. 1979, 108, 14–25. [Google Scholar] [CrossRef]
  33. Isidro, H.A. Age and Growth of Trachurus picturatus (Bowdich, 1825) (Teleostei: Carangidae) from the Azores. Arquipel.—Life Earth Sci. 1990, 8, 45–54. [Google Scholar]
  34. Jesus, G.T. Study of the Growth and Reproduction of Trachurus picturatus (Bowdich, 1825) in Madeira; Direcção Regional das Pescas: Horta, Portugal, Doc. Nº 1991, Internal Publication; 1992. [Google Scholar]
  35. Vasconcelos, J.; Alves, A.; Gouveia, E.; Faria, G. Age and growth of the blue jack mackerel, Trachurus picturatus Bowdich, 1825 (Pisces: Teleostei) off Madeira archipelago. Arquipel.—Life Mar. Sci. 2006, 23A, 47–57. [Google Scholar]
  36. Johnson, K.F.; Monnahan, C.C.; McGilliard, C.R.; Vertpre, K.A.; Anderson, S.C.; Cunningham, C.J.; Hurtado-Ferro, F.; Licandeo, R.R.; Muradian, M.L.; Ono, K.; et al. Time varying natural mortality in fisheries stock assessment models: Identifying a default approach. ICES J. Mar. Sci. 2015, 72, 137–150. [Google Scholar] [CrossRef] [Green Version]
  37. Patterson, K. Fisheries for small pelagic species: An empirical approach to management targets. Rev. Fish Biol. Fish. 1992, 2, 321–338. [Google Scholar] [CrossRef]
  38. Beddington, J.R.; Agnew, D.J.; Clark, C.W. Current Problems in the Management of Marine Fisheries. Science 2007, 316, 1713–1716. [Google Scholar] [CrossRef] [PubMed] [Green Version]
  39. ICES. Blue jack mackerel (Trachurus picturatus) in Subdivision 10.a.2 (Azores grounds). In Report of the ICES Advisory Committee, 2020; ICES Advice 2020, jaa.27.10a2; ICES: Copenhagen, Denmark, 2020; Available online: https://www.ccrup.eu/wp-content/uploads/2021/01/ICES_PC_2020_Blue-jack-mackerel-Trachurus-picturatus-in-Subdivision-10.a.2-Azores-grounds_EN.pdf (accessed on 10 March 2021).
  40. Vasconcelos, J.; Sousa, R.; Riera, R.; Delgado, J.; Faria, G.; Gordo, L. Stock assessment of the blue jack mackerel, Trachurus picturatus, in the North-eastern Atlantic. Fish Manag. Ecol. 2018, 25, 233–239. [Google Scholar] [CrossRef]
Figure 1. Comparison between the von Bertalanffy growth function estimated by the four approaches applied to length-at-age of Trachurus picturatus from Portuguese continental coast. Black dots are direct readings and blue dots are back-calculated lengths-at-age. Black line—direct readings (DR); green line—direct readings with t0 = 0 (DRfix); red line—back-calculation (BC); blue line—Bayesian inference (DRBayes).
Fishes 07 00052 g001
Table 1. Precision indices for age readings of Trachurus picturatus from Portuguese continental coast. APE—average percentage error; CV—average coefficient of variation; PAgree—percentage of perfect agreement; PAgree ± 1—percentage of agreement within one year interval; N—number of otoliths read.
Reader1 vs. Reader2Reader1 vs. Reader3Reader2 vs. Reader3
APE4.053.334.42
CV5.724.716.25
PAgree56.8162.0853.75
PAgree ± 192.0395.3491.47
N459490427
Table 2. Sample length description for the two data sets used for Trachurus picturatus growth modelling in Portuguese continental coast. DR—direct readings; BC—back-calculation; N—number of specimens; Mean—mean total length; Range—minimum and maximum total length.
NMean (cm)Range (cm)
DRFemales27632.023.4–46.4
Males29931.921.0–44.6
BCFemales17633.323.5–46.4
Males20033.922.5–44.6
Table 3. Summary results of growth model selection applied to each data set of length-at-age of Trachurus picturatus from Portuguese continental coast. For each model is indicated the Akaike Information Criterion (AIC) with the best value for each data set in bold. VBGF—von Bertalanffy growth function; Gompertz—Gompertz function; Logistic—logistic function; DR—direct readings; BC—back-calculation.
VBGFGompertzLogistic
AICAICAIC
DRFemales130113151324
Males113511541167
Overall243224642485
BCFemales522352535289
Males483748604887
Overall10,07010,12310,185
Table 4. Von Bertalanffy growth parameters’ estimates for Trachurus picturatus from Portuguese continental coast derived from different data sets and approaches. 95% confidence intervals are given in parentheses. For Bayesian inference the prior probability distributions used is given with mean and standard deviation, posterior probability distributions are reported as the mean, with lower and upper limits of the 95% credible interval in parentheses. BC—back-calculation; DR—direct readings; DRfix—direct readings with t0 = 0; DRBayes—direct readings with Bayesian Inference; MCMC—Markov chain Monte Carlo.
BCDRDRfixDRBayes
Parameternls EstimatesPriorMCMC Posterior
L46.68
(45.52–47.83)
63.31
(56.33–70.29)
42.03
(41.19–42.88)
N(50, 5)50.89
(48.78–53.21)
k0.15
(0.14–0.16)
0.07
(0.06–0.09)
0.24
(0.23–0.25)
U(0, 0.5)0.12
(0.11–0.13)
t0−2.04
(−2.19–−1.89)
−3.37
(−3.93–−2.80)
0N(0, 0.2)−2.01
(−1.73–−2.29)
σ2.4122.032.734U(0, 5)2.06
(1.94–2.20)
Publisher’s Note: MDPI stays neutral with regard to jurisdictional claims in published maps and institutional affiliations.

