Abstract
The European Union (EU) launched the Common Fisheries Policy (CFP) in the 1970s. Currently, a large part of the CFP has been financed with the European Maritime and Fisheries Fund (FEMP). This research aims to determine whether there is a high degree of homogeneity in the levels of efficiency achieved by the fishing projects financed by European Funds for the period 2014 to 2020. The Data Envelopment Analysis (DEA) methodology was adopted. The main results showed that there is a high degree of heterogeneity in the level of efficiency achieved by European countries during the analyzed period. Moreover, despite the fact that regional efficiency has been increasing during the years under study, territorial disparities persist over time. This research provides a contribution for policymakers targeting better use of the FEMP funds for the upcoming funding package 2021–2027.
1. Introduction
The Common Fisheries Policy (CFP) was created aimed at the regulation of the conservation, management, and exploitation of living aquatic resources. It also includes the seafood production obtained through aquaculture, and the processes of transformation and marketing of fishery products when such activities are carried out in the territories of the member states, or in community waters, or by community fishing vessels. The CFP aims to guarantee the stability of the income and jobs of fishermen in the European Union (EU), in a worrying situation of a decrease in catches as a consequence of the decrease in the fish population.
This policy attempts to achieve the always difficult balance between the economic aspirations of the fishing sector and environmental sustainability. This balance is necessary and essential to ensure the economic viability for fishermen and their regions in the medium and long term [1,2,3,4].
To this end, a set of action plans have been established:
- Recovery plans for fisheries that exploit stocks that are outside safe biological limits.
- Management plans that allow keeping fish and spawning populations within safe biological limits.
- Plans that establish goals for the sustainable exploitation of fish stocks and including limits on catches.
- Plans for fixing the number and type of fishing vessels authorized to fish.
- Plans of technical measures related to the definition of the design of the fishing gear (fleet restructuring), and the establishment of zones or periods in which fishing activities are prohibited or restricted. Additionally, a definition of the minimum size of the specimens to be captured and specific measures to reduce the effects of fishing activities on marine ecosystems.
Community regulations defined the responsibility of the EU member states for the control, inspection, and application of the rules of the CFP. The financing of the European agricultural policy is carried out mainly by the European Maritime and Fisheries Fund (FEMP) [4,5,6]. This is part of the so-called European Structural and Investment Funds (the ESI Funds), together with the European Regional Development Fund (ERDF), the European Social Fund (ESF), the Cohesion Fund (CF), and the European Agricultural Fund for Rural Development (EAFRD).
The FEMP, as established in its implementing regulations, must fundamentally contribute to meeting the following objectives:
- Promoting competitive, environmentally sustainable, economically viable and socially responsible fisheries and aquaculture. For this, a series of actions are articulated, among which are:
- (1)
- Reduction of the impact of fishing on the marine environment, for which it is necessary to avoid and reduce, as far as possible, unwanted catches.
- (2)
- Protection and recovery of biodiversity and aquatic ecosystems.
- (3)
- Achieve and maintain a lasting balance between fishing capacity and available fishing opportunities.
- (4)
- Promote the competitiveness and viability of companies in the fishing sector, including artisanal coastal fishing, and improve safety and working conditions.
- (5)
- Support the consolidation of technological development, innovation, increased energy efficiency, and knowledge transfer.
- (6)
- Develop professional training, new professional skills, and ongoing training.
- Promotion of a balanced and inclusive territorial economic development of fishing and aquaculture areas. This implies contemplating a series of actions aimed at the promotion of economic growth in the sector and the territories, social inclusion, job creation, and support for employability and labor mobility in coastal and inland communities, dependent of fishing and aquaculture.
In general, the distribution of ESI Funds among European countries is carried out considering the relative wealth of a given region. Specifically, there are currently three categories of regions:
- Less developed regions: those whose GDP per capita is less than 75% of the average GDP of the EU-27.
- Regions in transition: those whose GDP per capita is between 75% and 90% of the average GDP of the EU-27.
- More developed regions: those whose GDP per capita is above 90% of the average GDP of the EU-27.
With regard to FEMP, financial allocations are decided based on sector-specific criteria such as the size and socioeconomic importance of aquaculture and fisheries in each region. Therefore, the level of funding does not depend on GDP per capita.
Recently, two packages of funds have been approved to finance projects related to the fishing sector. One for the period 2014 to 2020, to which EUR 5,749,331,600 was allocated, and another for the period 2021 to 2027 with an amount of EUR 6,108,000,000. In the case of the FEMP, the projects that are approved must have, in general, a co-financing of the member countries that amounts to 75%.
Based on this process of distribution of European Funds among the countries, this research has a goal to determine whether there is a high degree of homogeneity in the levels of efficiency achieved by the fishing projects financed by European Funds for the period 2014 to 2020. In this way, it could be possible to identify which regions have the highest levels of efficiency in the management of funds directed towards the management of fisheries. Thus, once these territorial differences have been detected, the investigation could be expanded to find out which programs have been implemented in the countries and which have obtained the best results.
In addition, the results can be used by public administration bodies to develop regulations that incorporate the degree of efficiency achieved, as another assessment parameter for the approval of projects financed with European Funds. The policymakers can find out the peculiarities of the projects with the best qualification and the regions in which they have implemented such activities.
The rest of the paper is structured as follows. The FEMP and different European regions, and efficiency analysis in the fishing sector are presented in a literature review. DEA methodology is defined, and variables presented. Results of the DEA are presented in Section 3. The paper ends with a conclusion and discussion section, followed by cited references.
2. Literature Review
Efficiency is an economic concept that relates inputs and outputs. From this perspective, one organization is more efficient than another when it achieves the same amount of output using less inputs. Among the main available research on efficiency analysis, there are contributions of Thach, Vo, and Lee [5], Wang et al. [6], Venkadasalam, Mohamad, and Sifat [7], Quynh, Hailu, Schilizzi, and Iftekhar [8], Sangun, Guney, and Berk [9], Laso et al. [10], Pinello et al. [11], Gigentika et al. [12], Chen et al. [13], and Castilla-Espino et al. [14].
For this type of analysis, it has become necessary to define a methodology that is usually used by researchers in efficiency analyses. In this research, a non-parametric methodology, called Data Envelopment Analysis (DEA), has been used, a methodology proposed by Charnes, Cooper, and Rhodes in 1978 [4].
Thach, Vo, and Lee [5] determined the technological efficiency of white leg shrimp farming. They also evaluated the efficiency and adaptability of shrimp farming by comparing the technical efficiency analyses among different species of shrimps. Given unchanged inputs, the calculated technical efficiency was around 72.9%, implying that farmers could increase their production by about 27.1%. The technical efficiency of the two groups was identical.
Wang et al. [6] used DEA, namely the Malmquist model, to evaluate the performance of 17 fisheries firms in decision making units (DMUs) in Vietnam from 2015 to 2018. The purpose of this study was to present a four-year review of the Vietnamese fishery sector in terms of technical efficiency, technological progress, and total factor production. Total assets, equity, total liabilities, cost of sales, revenue, and profit are all variables in the model. The findings of this research suggest that the best performers were Investment Commerce Fisheries Corporation (DMU10) and Hoang Long Group (DMU8).
Venkadasalam, Mohamad, and Sifat [7] studied the efficiency of the shipping industry in five ASEAN countries: Malaysia, Singapore, the Philippines, Thailand, and Vietnam. This research assessed the efficiency dynamics of 45 international and offshore fishing and ferrying shipping companies using DEA and Stochastic Frontier Analysis. The findings showed a persistent decline in efficiency from 2011 to 2017, a trend that continues even in historically efficient businesses.
Quynh, Hailu, Schilizzi, and Iftekhar [8] used survey data for small-scale fisheries in Vietnam under the Territorial Use Rights for Fisheries (TURFs) system. This study used a bootstrapped DEA to measure the extent of excess capacity at the individual fisher level, and an Endogenous Switching Regression model to investigate the effects of fisher participation in monitoring on the level of excess capacity. This investigation employed a bootstrapped DEA, which rectifies estimation problems in the standard DEA method. Even under TURFs, we uncover indications of significant excess capacity, with fishermen operating at 59% capacity on average. However, the findings suggest that monitoring participation leads to a large reduction in excess capacity. Non-monitors are more likely to have short-sighted investment behavior, whereas monitors’ investment behavior is more likely to be influenced by perceptions of TURF management and long-term incentives.
Sangun, Guney, and Berk [9] investigated the economic efficiency of small-scale coastal fishing operations on Turkey’s eastern Mediterranean coast during 2016–2017. The DEA approach was used to estimate small-scale fisheries’ economic efficiency levels, and severe levels of input utilization were demonstrated. According to the findings, the fishers’ consumption of inputs can be reduced by 36.1% while still achieving the same output performance. The primary inputs that lead to inefficiency in a small-scale fishermen’s output performance are vessel maintenance expenditures (15.4%), fishing gear repair or buy expenditures (12.3%), and labor costs (12 percent). In addition, Tobit Analysis was used to study the relationship between economic efficiency outcomes and the small-scale fishermen’s socioeconomic and demographic position. According to this, factors such as household size, labor hours, and vessel ownership lead to economic inefficiency among dedicated fishermen, and the output performances are vessel maintenance expenditures (15.4%), fishing gear repair or buy expenditures (12.3%), and labor costs (12%). In addition, Tobit Analysis was used to study the relation between economic efficiency outcomes and the small-scale fishermen’s socioeconomic and demographic position.
Laso et al. [10] examined the environmental effect of benchmarking results generated from DEA calculations utilizing different cultural theory methodologies. The Cantabrian purse seining fishing fleet was chosen as the case study. As a result, three distinct DEA matrices were created to address the three primary human perspectives on environmental issues: hierarchist, individualist, and egalitarian [15,16]. All three matrices represented the same set of inputs to be optimized, but the output flow, which represented landed fish, energy content, or biomass removal, changed. The findings imply that the cultural perspective chosen has a significant impact on environmental impact optimization.
Pinello et al. [11] used a bias-corrected input-oriented DEA model. This study investigated the technical and scale efficiency of two types of Greek fishing vessels: small-scale vessels and bottom trawlers. In addition, the relations between efficiency scores and vessel and skipper characteristics are investigated. According to the findings, small-scale vessels have a low average technical efficiency score (0.42) but a substantially higher scale efficiency score (0.81). Bottom trawlers, on the other hand, have a smaller scale but superior technical efficiency (0.68 and 0.73, respectively). In contrast to trawlers, the technical efficiency of small-scale vessels is positively associated with the skipper’s experience, according to this study. In a broader sense, small-scale fisheries rely heavily on expertise.
Gigentika et al. [12] determined the capacity of tuna fishing by evaluating its technical efficiency and the usage of three different types of tuna fishing gear based on vessel size (GT). The analysis of fishing capability was carried out using DEA methods. The findings revealed that a number of tuna fishing units were inefficient in their use of fishing capacity and were overusing production inputs. However, a 20 GT pole and line fishing vessel has proven to be effective in terms of fishing capacity and production inputs.
Chen et al. [13] investigated whether the determinants of ambient water quality in the aquatic ecosystem affect the technological efficiency of a fishing sector. The authors calculated the DEA estimates of technical efficiency for each fishing zone using zone-specific data for the Connecticut Long Island Sound lobster fishery from 1998 to 2007 and a method that combined a bootstrapping technique with DEA. The impact of environmental variables on different efficiency percentiles was then assessed using the bootstrapped DEA results and censored quantile regression. When environmental conditions are advantageous (high dissolved oxygen levels), efficiency is low. However, when environmental conditions are unfavorable (high nitrogen levels), efficiency is high.
Castilla-Espino et al. [14] aimed to quantify the fleet’s fishing capacity as well as the structural excess of fishing capacity over sustainable levels (overcapacity) from 2005 to 2009. Two DEA linear mathematical programs were executed. The fishing capacity in the 2008–2009 season was 142.37 mT, according to this research, and it increased following the adoption of a new management system in 2006. This report also concludes that the fleet was significantly overcapacity in 2009 as measured fishing capacity exceeded nearly two times the Total Allowable Catch established by policymakers, and the fleet’s technical efficiency was extremely low.
3. Materials and Methods
The interest on the use of efficiency analyses applied to the fishing sector has been aroused among researchers, expressed by the number of investigations using DEA [17,18,19,20]. Thus, DEA is the method that better fits the requirements needed in this research. Elaborated by Charnes, Cooper, and Rhodes in 1978 [1], DEA has been used as a methodological tool to calculate the efficiency in the use of European Funds by European countries. Their model allows for determining of the relative efficiency obtained by an organization when it is compared with others, as well as the distance with respect to the efficiency frontier by Maza et al. [21]. An optimal level of efficiency is determined, and the distance that exists between each of the DMUs with respect to it is measured. For this reason, the production function must be oriented towards output. Likewise, since there is no certainty about the type of return of the function, a BCC–Output-type model has been assumed, which yields a measure of pure technical efficiency, thus ignoring the size of the scale since it compares only one DMU to a similar scale unit [22].
The fact of being able to include multiple input and output variables in this model has made it an efficiency measurement tool largely used in the assessment of public sector policies [23]. Public organizations pursue multiple objectives, which makes it difficult to determine their performance levels [23,24]. DEA methodology fulfils this need.
The efficiency of the decision unit (DMU) in this model is calculated as
When more inputs are used, the equation would be as follows
The applied model aims to achieve the maximum amount of output given by a certain level of inputs, under a restriction of ignorance of the technological level assumed by each DMU. For this reason, the variable scale returns (VRS) model proposed by Banker, Charles, and Cooper [25] oriented towards the output (BCC–Output model). Thus, the problem to be solved would be the maximization of the following expression
subject to
where:
is the radial enlargement that occurs in all its outputs. It can be identified with the efficiency of j if j is compared with a point belonging to the efficient frontier.
is the rectangular reduction of input i.
is the rectangular magnification of the output k.
Where represents the coefficients of the linear combination of inputs and outputs to which the DMU projection point is referring, on the efficient frontier, it can be interpreted as the proximity of the DMU projection point, with respect to the efficient frontier.
The efficiency frontier would be made up of all those efficient decision units. Once the border has been determined by these entities, it compares each of the entities under study with the border, under the assumption that the detected deviations indicate inefficient behavior. In this way, the relative efficiency of a set of DMUs that produce a type of output from a common set of inputs can be measured.
This type of technical efficiency analysis is needed in an economic, social, and health context, such as the current one, to measure the levels of efficiency achieved in the use of public resources. Its measure is needed to facilitate decision making by public administrations and to judge among different alternatives. Likewise, it can guarantee compliance with the established objectives and improve the management of public programs. This methodology can be considered as a continuous process of learning and training for those responsible for and administrators in charge of implementing fisheries policies. It should also be aware that the financing of the programs is carried out through the collection of taxes from citizens and companies.
In this research, the FEMP distributed in Europe have been used as input variables. The employment generated in the sector and the ships used have been chosen as variables too. As an output variable, the captures obtained have been considered. In this way, the main variables used in the analyzed bibliography are collected, which are related to the use of capital and employment.
Table 1 summarizes the input–output variables used in the production function to be maximized, which will allow a comparative analysis of the relative efficiency of each DMU.

Table 1.
Production function of the degree of efficiency in the use of Sea and Fishing Funds.
Figure 1 presents a schematic representation of the research methodology adopted in this research. The input related to the employment was used in Sangun et al. [9], as well as the fishing fleet [26].
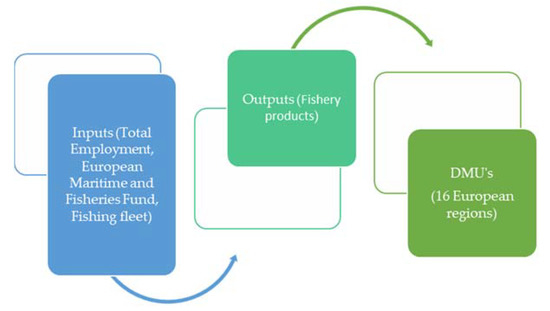
Figure 1.
Summary of the applied methodology.
Table 2 shows the analyzed DMUs, where two criteria have been considered in their choice:
Table 2.
DMUs analyzed.
- Countries belonging to the Eurozone. This choice was motivated by the fact that inclusion in the Euro group ensures that their economies move around certain economic levels.
- Significant level, throughout the analyzed period, in each of the defined variables.
Table 2 presents the countries that satisfied these criteria and were considered in analyses.
The concept of efficiency analyzed in this article is that of economic efficiency defined by Farrell [27], according to which the aforementioned author defines it as the capacity of an entity to achieve the maximum output from a given set of inputs, and which is obtained by comparing each unit with the optimal value that is given by the estimated production frontier. From a business perspective, efficiency is usually defined as the ability to produce the maximum amount of useful products with a given amount of inputs, as well as the ability to produce using the minimum possible inputs, a given amount of products. Basically, it defines the relationship between inputs and outputs. Profit maximization requires the DMUs to correctly adopt the following decisions:
- Choose the output that maximizes the benefit of all possible levels of production.
- Choose the optimal combination of inputs that minimizes the production costs among all the possible combinations of inputs necessary to obtain the product.
- Produce the output using for them the minimum possible amount of inputs.
The adoption of these three types of decisions allows defining the requirement of three types of efficiencies, such as scale efficiency, allocative efficiency, and technical efficiency.
4. Results
4.1. The Fishing Funds
The funds of FEMP were approved by EU Regulation No. 508/2014 of the European Parliament and of the Council of May 15, 2014, and EU Regulation No. 1255/2011 of the European Parliament and of the Council. Figure 1 shows the percentage distribution among the different EU countries.
Figure 2 shows how more than 70% of the resources were distributed among the United Kingdom, Croatia, Greece, Portugal, Poland, Italy, France, and Spain.
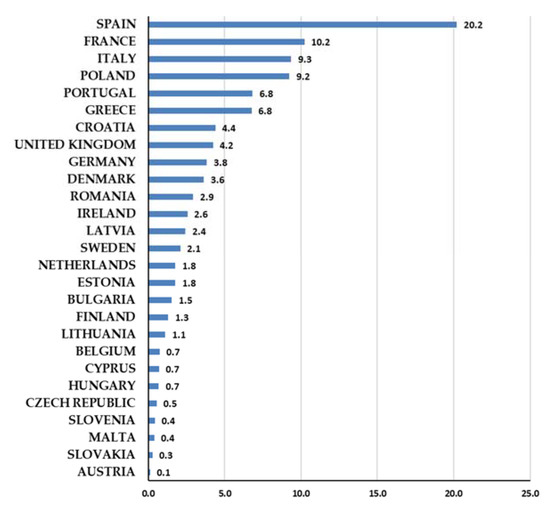
Figure 2.
Percentage distribution of the FEMP for the period 2014–2020. Source: Own elaboration from data published by the European Commission. https://ec.europa.eu/oceans-and-fisheries/funding/european-maritime-and-fisheries-fund-emff_es (accessed on 11 January 2022).
The following Figure 3 shows the distribution of the FEMP for employment generated in the sector. The total amount of FEMP resources distributed by each country was calculated and divided by the total employment. It is observed that more than 30% of the funds are concentrated in four countries: Slovenia, Estonia, Finland, and Sweden.
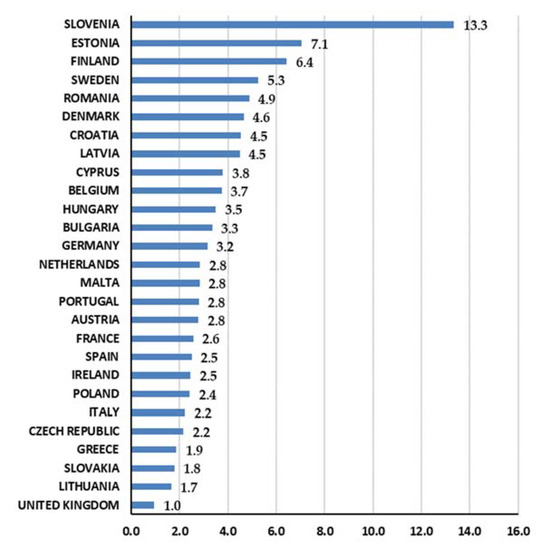
Figure 3.
Percentage distribution of the FEMP by employment generated for the period 2014–2020. Source: Own elaboration from data published by the European Commission. https://ec.europa.eu/oceans-and-fisheries/funding/european-maritime-and-fisheries-fund-emff_es (accessed on 11 January 2022).
Figure 4 shows the distribution of European resources in relation to the catches obtained by each country. Based on this distribution criterion, Slovenia, Romania, Cyprus, Greece, and Bulgaria have obtained more than 70% of the Fisheries Funds.
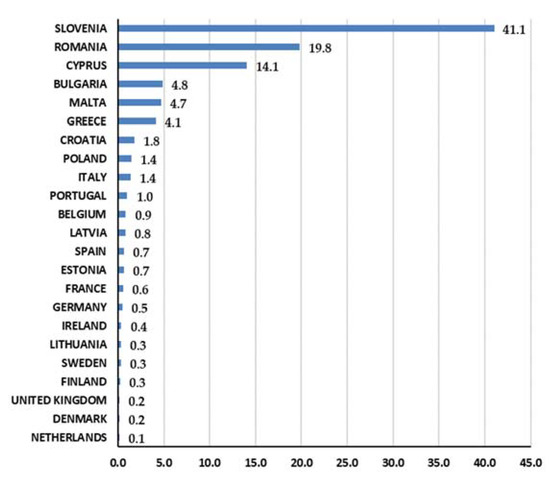
Figure 4.
Percentage distribution of the FEMP by catches for the period 2014–2020. Source: Own elaboration based on data published by the European Commission and Eurostat. https://ec.europa.eu/oceans-and-fisheries/funding/european-maritime-and-fisheries-fund-emff_es (accessed on 11 January 2022).
Finally, in Figure 5 the distribution of the Fishing Funds in relation to the fleet of each country has been analyzed. In this case, it should be noted how the contributions to Romania, Poland, Lithuania, Latvia, and Belgium account for more than 60% of the total.
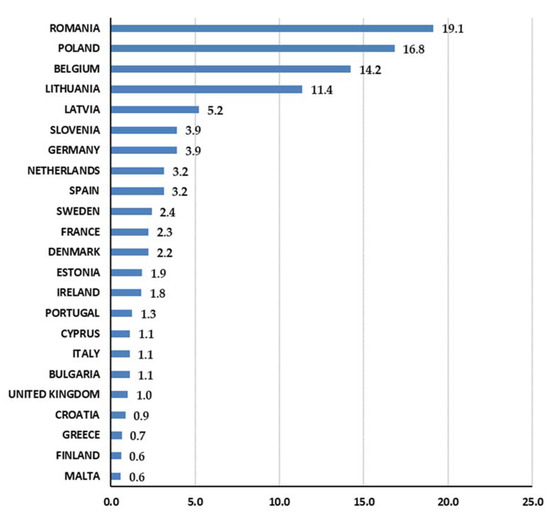
Figure 5.
Percentage distribution of the FEMP among the fleet for the period 2014–2020. Source: Own elaboration based on data published by the European Commission and Eurostat. https://ec.europa.eu/oceans-and-fisheries/funding/european-maritime-and-fisheries-fund-emff_es (accessed on 11 January 2022).
4.2. The DEA Model
The results obtained in this research depend on the variables used and the DMU’s analyzed. The use of other variables could lead to different results than those shown in this article.
The efficiency analysis in the use of the Sea and Fishing Funds for the improvement of the sector has been carried out through a production function. This function considered as inputs the investments in the FEMP, the employment generated in the sector, and the ships. The output would be formed by the catches. The DMUs used are the Eurozone countries defined in Table 3. A DEA has been applied to this function, which assumes an orientation towards output (BCC) and variable returns to scale. The used software was Frontier Analysis Professional.
Table 3.
Relative efficiency of the countries for the period 2014–2019.
Table 3 shows the obtained results. The relative efficiency has been calculated for the years corresponding to the period of funds approved by the EU 2014–2020. The last year for which data are available is 2019. The table shows how the average efficiency level has been maintained throughout the period. However, if the evolution of the countries studied is considered, substantial differences are observed between them. Thus, France, Germany, Greece, Finland, Ireland, Spain, Belgium, Slovenia, and Portugal are above the average, while Italy, the Netherlands, Lithuania, Latvia, Estonia, Malta, and Cyprus are below it.
Table 4 summarizes the average efficiency of the countries in the analyzed period, the number of times that each country has found itself at maximum efficiency, the maximum and minimum efficiency found, as well as the difference between the two measurements.
Table 4.
Summary of efficiency indicators for the period 2014–2019.
Table 4 shows the significant differences achieved in terms of efficiency between the analyzed countries. Only Germany, Slovenia, Finland, Belgium, Spain, France, Greece, and Ireland have ever reached the highest level of efficiency. In the case of Germany, it has achieved this four times and Slovenia and Finland, three times. On the other hand, Cyprus, Estonia, Italy, Latvia, Lithuania, Malta, the Netherlands, and Portugal have not achieved maximum efficiency conditions in any of the years analyzed.
In addition, it should be noted that countries such as France or Germany achieved double the average efficiency obtained throughout the period compared to other countries such as Estonia, Malta, or Cyprus.
Therefore, from the results obtained in the DEA it can be concluded that although it is true that overall there is a high level of efficiency in the use of the FEMP, and that this is maintained throughout the period, there are significant differences in the levels reached by the different countries analyzed.
5. Discussion and Conclusions
This research aimed to determine if there is a high degree of homogeneity in the levels of efficiency achieved by the European countries analyzed in the management of fishing projects financed with the FEMP. For this, a methodology frequently used by researchers in comparative efficiency analyses between various territorial units, the DEA, was used. In doing so, a production function was defined in which the inputs were linked to the use of European funds, the total employment, and the fishing fleet, and the outputs used were the total production of the sector.
The application of the DEA revealed two significant conclusions. First, the existence of a high degree of heterogeneity in the level of efficiency achieved by European countries during the period of time analyzed. Second, despite the fact that regional efficiency has been increasing during the years under study, territorial disparities persist over time.
These data are aligned with the results evidenced in the analyzed bibliography. There is a high degree of correlation between efficiency levels and regional characteristics. In this sense, we consider this type of technical efficiency analysis very necessary since it allows us to determine the existence of specific regional inequalities. Once identified, the results can be used to articulate public policy measures to reduce them, since, in the event that resources are not allocated to reduce them, they will grow and will perpetuate a development project with unequal regions. These models undoubtedly have negative consequences in different aspects of citizens’ lives at the territorial level. Not only of the economic type but also social.
In this research, countries have been identified, such as Germany, that have maintained optimal levels of efficiency throughout the analyzed years, Slovenia and Finland have obtained it for three years. Belgium, Spain, and France for two years. Greece and Ireland for one year. The rest of the analyzed countries have not obtained it during the entire period investigated. With these results, we believe it is convenient to expand the study to identify the specific projects that have been launched during these years in these regions so that they can be replicated in those that have obtained the lowest results.
For this reason, the novelty that this research presents with respect to those published is that this is the first article that studies the levels of efficiency achieved by the fishing projects financed by European Funds for the period 2014 to 2020 in Spain using the Data Envelopment Analysis methodology.
The actual moment is a moment of transition. Currently, the funding package for the period 2021 to 2027 was approved on 17 December 2020. The total allocation for fisheries policy amounts to EUR 6108 million. Of this, EUR 5300 million will be allocated for the management of fisheries, aquaculture, and fishing fleets. The rest will go to scientific advice, controls and verifications, market intelligence, maritime surveillance, and security. For this reason, it is advisable to show as soon as possible the projects that are working best at the agricultural level and publicize them so that they can be implemented in other regions.
In future papers, we will consider fisheries’ sustainability. Sustainability has mostly been achieved through Ecosystem-Based Fisheries Management or Management Strategy Evaluation [28,29,30]. In future works we will take into account the level of illegal, unreported, and unregulated (IUU) fishing and the result of the application of FEMP since countries that improve their management of IUU fishing tend to improve other objectives of managing multiple fisheries with increased follow-up [31,32,33].
Author Contributions
Conceptualization, M.B.; methodology, M.B.; software, M.B.; validation, M.B.; formal analysis, M.B.; investigation, L.B.; resources, M.B.; data curation, M.B.; writing—original draft preparation, M.B., L.B., and M.F.; writing—review and editing, M.B., L.B., and M.F.; visualization, L.B.; supervision, L.B.; project administration, L.B. All authors have read and agreed to the published version of the manuscript.
Funding
This research received no external funding.
Data Availability Statement
Not applicable.
Conflicts of Interest
The authors declare no conflict of interest.
References
- Rahman, L.F.; Alam, L.; Marufuzzaman, M.; Sumaila, U.R. Traceability of Sustainability and Safety in Fishery Supply Chain Management Systems Using Radio Frequency Identification Technology. Foods 2021, 10, 2265. [Google Scholar] [CrossRef] [PubMed]
- Espinoza, C.; Gallardo, V.A.; Merino, C.; Pizarro, P.; Liu, K.M. Sustainability of the Artisanal Fishery in Northern Chile: A Case Study of Caleta Pisagua. Sustainability 2020, 12, 7290. [Google Scholar] [CrossRef]
- Hutchinson, W.F. The dangers of ignoring stock complexity in fishery management: The case of the North Sea cod. Biol. Lett. 2008, 4, 693–695. [Google Scholar] [CrossRef] [PubMed] [Green Version]
- Charnes, A.; Cooper, W.W.; Rhodes, E. Measuring the efficiency of decision making units. Eur. J. Oper. Res. 1978, 2, 429–444. [Google Scholar] [CrossRef]
- Thach, K.S.R.; Vo, H.T.; Lee, J.Y. Technical Efficiency and Output Losses in Shrimp Farming: A Case in Mekong Delta, Vietnam. Fishes 2021, 6, 59. [Google Scholar] [CrossRef]
- Wang, C.N.; Nguyen, T.L.; Dang, T.T.; Bui, T.H. Performance Evaluation of Fishery Enterprises Using Data Envelopment Analysis—A Malmquist Model. Mathematics 2021, 9, 469. [Google Scholar] [CrossRef]
- Venkadasalam, S.; Mohamad, A.; Sifat, I.M. Operational efficiency of shipping companies: Evidence from Malaysia, Singapore, the Philippines, Thailand and Vietnam. Int. J. Emerg. Mark. 2020, 15, 875–897. [Google Scholar] [CrossRef]
- Quynh, C.N.T.; Hailu, A.; Schilizzi, S.; Iftekhar, S. Fisher participation in monitoring: Does it help reduce excessive investment in fishing capacity? Fish. Res. 2018, 206, 138–149. [Google Scholar] [CrossRef]
- Sangun, L.; Guney, O.I.A.N.; Berk, A. Economic Efficiency Performance of Small-Scale Fisheries in the East Mediterranean Coast of Turkey. New Medit. 2018, 17. Available online: https://newmedit.iamb.it/2018/12/15/economic-efficiency-performance-of-small-scale-fisheries-in-the-east-mediterranean-coast-of-turkey/ (accessed on 5 November 2021). [CrossRef]
- Laso, J.; Vázquez-Rowe, I.; Margallo, M.; Irabien, Á.; Aldaco, R. Revisiting the LCA+ DEA method in fishing fleets. How should we be measuring efficiency? Mar. Policy 2018, 91, 34–40. [Google Scholar] [CrossRef]
- Pinello, D.; Liontakis, A.; Sintori, A.; Tzouramani, I.; Polymeros, K. Assessing the Efficiency of Small-Scale and Bottom Trawler Vessels in Greece. Sustainability 2016, 8, 681. [Google Scholar] [CrossRef] [Green Version]
- Gigentika, S.; Nurani, T.W.; Wisudo, S.H.; Haluan, J. Fishing capacity and technical efficiency of tuna fisheries in Kupang, Indonesia. Aquac. Aquar. Conserv. Legis. 2016, 9, 854–863. [Google Scholar]
- Chen, L.; Gupta, R.; Mukherjee, Z.; Wanke, P. Technical efficiency of Connecticut Long Island Sound lobster fishery: A nonparametric approach to aggregate frontier analysis. Nat. Hazards 2016, 81, 1533–1548. [Google Scholar] [CrossRef] [Green Version]
- Castilla-Espino, D.; García-del-Hoyo, J.J.; Metreveli, M.; Bilashvili, K. Fishing capacity of the southeastern Black Sea anchovy fishery. J. Mar. Syst. 2014, 135, 160–169. [Google Scholar] [CrossRef]
- Douglas, M.; Wildavsky, A. Risk and Culture: An Essay on the Selection of Technological and Environmental Dangers; University of California Press: Oakland, CA, USA, 1983. [Google Scholar]
- Xue, W.; Hine, D.W.; Loi, N.M.; Thorsteinsson, E.B.; Phillips, W.J. Cultural worldviews and environmental risk perceptions: A meta-analysis. J. Environ. Psychol. 2014, 40, 249–258. [Google Scholar] [CrossRef]
- Blanco, M.; Bares, L.; Hrynevych, O.; Ferasso, M. Analysis of the Territorial Efficiency of European Funds as an Instrument to Reduce Labor Gender Differences. Economies 2021, 9, 9. [Google Scholar] [CrossRef]
- Ferasso, M.; Blanco, M.; Bares, L. A Data Envelopment Analysis of the Impact of European Funds on Environmental Indicators. Int. J. Environ. Res. Public Health 2021, 18, 2800. [Google Scholar] [CrossRef]
- Pérez, M.C.; Blanco, M.; Sánchez, C. Evaluation of the impact of workshop schools, employment workshops and trade houses programs in the autonomous community of Andalusia: A methodological evaluation proposal. Rev. Prism. Soc. 2016, 16, 1–31. [Google Scholar]
- Blanco, M. Evaluation of active employment policies in Andalusia. Rev. Galega De Econ. 2016, 25, 49–62. [Google Scholar]
- Maza, F.J.; Vergara, J.C.; Navarro, J.L. Efficiency of investment in the subsidized health regime in Bolívar-Colombia. Investig. Andin. 2012, 14, 23–37. [Google Scholar]
- Martić, M.; Novaković, M.; Baggia, A. Data envelopment analysis-basic models and their utilization. Organizacija 2009, 42, 37–43. [Google Scholar] [CrossRef]
- Worthington, A.; Dollery, B. An empirical study of border efficiency measurement techniques in local government. Local Gov. Stud. 2000, 26, 23–52. [Google Scholar] [CrossRef] [Green Version]
- Zhonghua, C.; Ye, W. Research frontiers in the measurement of public sector performance. Phys. Proced. 2012, 25, 793–799. [Google Scholar] [CrossRef] [Green Version]
- Banker, R.D.; Charnes, A.; Cooper, W.W. Some models for estimating technical and scale inefficiencies in data envelopment analysis. Manag. Sci. 1984, 30, 1078–1092. [Google Scholar] [CrossRef] [Green Version]
- Li, C.J.; Jeon, J.W.; Kim, H.H. An Efficiency Analysis of Fishery Output in Coastal Areas of China. Int. J. Adv. Smart Converg. 2020, 9, 127–136. [Google Scholar]
- Farrell, M.J. The measurement of productive efficiency. J R Stat. Soc. Ser. A Stat. Soc. 1957, 120, 253–281. [Google Scholar] [CrossRef]
- López-Martínez, G.; Schriewer, K.; Meseguer-Sánchez, V. Small-Scale Fishing and Sustainability. An Ethnographic Approach to the Case of Self-Employed Fishermen in the South-East of Spain. Sustainability 2021, 13, 10542. [Google Scholar] [CrossRef]
- Tai, T.-H.; Kao, S.-M.; Ho, W.-C. International Soft Laws against IUU Fishing for Sustainable Marine Resources: Adoption of the Voluntary Guidelines for Flag State Performance and Challenges for Taiwan. Sustainability 2020, 12, 6013. [Google Scholar] [CrossRef]
- Richmond, L.; Dumouchel, R.; Pontarelli, H.; Casali, L.; Smith, W.; Gillick, K.; Godde, P.; Dowling, M.; Suarez, A. Fishing Community Sustainability Planning: A Roadmap and Examples from the California Coast. Sustainability 2019, 11, 1904. [Google Scholar] [CrossRef] [Green Version]
- Skerritt, D.J.; Arthur, R.; Ebrahim, N.; Le Brenne, V.; Le Manach, F.; Schuhbauer, A.; Villasante, S.; Sumaila, U.R. A 20-year retrospective on the provision of fisheries subsidies in the European Union. ICES J. Mar. Sci. 2020, 77, 2741–2752. [Google Scholar] [CrossRef]
- Sumaila, U.R.; Ebrahim, N.; Schuhbauer, A.; Skerritt, D.; Li, Y.; Kim, H.S.; Lam, V.; Pauly, D. Updated estimates and analysis of global fisheries subsidies. Mar. Policy 2019, 109, 103695. [Google Scholar] [CrossRef]
- Sumaila, U.R.; Skerritt, D.; Schuhbauer, A.; Ebrahim, N.; Li, Y.; Kim, H.S.; Lam, V.; Pauly, D. A global dataset on subsidies to the fisheries sector. Data Brief 2019, 27, 104706. [Google Scholar] [CrossRef] [PubMed]
Publisher’s Note: MDPI stays neutral with regard to jurisdictional claims in published maps and institutional affiliations. |
© 2022 by the authors. Licensee MDPI, Basel, Switzerland. This article is an open access article distributed under the terms and conditions of the Creative Commons Attribution (CC BY) license (https://creativecommons.org/licenses/by/4.0/).