Article

The Effect of Fishery Management on the Yield of the Critically Endangered European Eel Anguilla anguilla in Mesotrophic Rivers and Streams in Central Europe

Institute for Evaluations and Social Analyses (INESAN), Sokolovská 25, 18600 Prague, Czech Republic
Fishes 2022, 7(1), 42; https://doi.org/10.3390/fishes7010042
Submission received: 30 November 2021 / Revised: 6 February 2022 / Accepted: 8 February 2022 / Published: 10 February 2022
(This article belongs to the Special Issue Assessment of Fisheries Impact on Species and Marine Ecosystems)

Abstract

:
The European eel Anguilla anguilla is a critically endangered catadromous migratory fish species. To conserve eel populations, angling restrictions and stocking activities are often used. This paper aimed to analyze the effect of an increased minimum legal angling size, eel stocking, fishing effort, and important environmental and biological factors on eel yield. This study used data on eel stocking and yield collected by the Czech Fishing Union using angling logbooks. Data regarding 41 tons of harvested eels were collected on 176 fishing sites from 38,000 anglers over the years 2005–2018 in central Bohemia and Prague (the Czech Republic). Eel made up only 0.006% of the overall fish harvest by biomass. It was found that the increased minimum legal angling size led to decreased yield of eel and to a decreased percentage of eel in the overall fish harvested. It also led to larger harvested eels, while the number of fishing sites where anglers harvested eels stayed constant over time. The eel yield was strongly correlated to the angling effort but not to the eel stocking intensity or the environmental and biological factors. In conclusion, implementing the minimum legal angling size did achieve its goal, because it led to decreased eel yield.

1. Introductions

The European eel Anguilla anguilla is a critically endangered migratory diadromous fish species. It came close to extinction during the 20th century due to overharvesting and migration barriers on rivers. Currently, eels do not form sustainable populations in most countries in Europe, and their yields have been steadily decreasing in Europe in the 21st century [1]. Since eels are highly valued in commercial fisheries, the price of juveniles has been increasing rapidly on the black market [2,3]. Eels are a culinary delicacy; they became the most traded animal species on the black market over the years 2010–2019 [4,5].
Even though the eel spends most of its life in freshwater rivers, it spawns in a marine ecosystem in the Sargasso Sea, making it an important marine species. Therefore, the eel fishing that takes place in the inland rivers has a huge impact on the eel marine spawning. Unfortunately, the fishing pressure on eels has been increasing in central Europe in the 20th century [6]. For that reason, the need for studies regarding the analysis of eel yields in both rivers and the sea is becoming more important. The negative effects of overharvesting and anthropogenic pressure on eel populations also forced the Czech Republic to perform European eel reintroduction activities.
The European eel reintroduction activities started after the year 2000. However, they were most intensive over the years 2011–2020, when the eel stocking was financed by the EU from the Operation Program Fisheries. As a part of the reintroduction activities, fishery managers have been buying glass eels and elvers and distributing them among rivers and streams in the Czech Republic, helping the eels to overcome the migration barriers on the fragmented rivers. Furthermore, European countries have agreed to take measurements that allow 40% of adult eels to migrate from inland water to the sea. In addition, they have agreed that at least 60% of small (<12 cm) caught eels must be saved for restocking in EU countries [7]. The countries in the EU have been also implementing national management plans that include the removal of migration barriers, intensive eel restocking, and lower fishing pressure that prevents overharvesting [8]. These actions should stabilize wild eel populations, because they are based on examples of success and failures of other fish species conservation plans [9]. However, studies from European countries suggest that the goals have not been met yet [1,2,3,4].
The fish species conservation plans strongly relied on raising the positive attitudes of anglers and stakeholders towards eel conservation [10,11]. They also elevated the importance of clear communication between anglers and nature conservationists [12,13]. Successful reintroduction programs also relied on effective restocking of the reintroduced fish species, making sure that the stocked fish have high survival rates and decent growth rates.
The previously unsuccessful eel restocking programs often showed poor growth and survival of restocked eels due to high post-stocking mortality and river fragmentation [14,15]. The post-stocking mortality of eels mainly depends on the rearing conditions in the hatchery and on fish handling during transportation. In addition, it also depends on the density of eel prey, the juvenile eel recruitment, the sex ratio between eels, the density of eels, and the size and age of eels [16,17,18,19]. In practical angling, the anglers can also help minimize eel mortality by using proper hooks and careful fish-handling techniques [20]. Both post-stocking and post-release mortalities drive the success of eel reintroduction activities. While the reintroduction activities were a promising start, there was a need to add another level of protection of eel populations—an angling limit.
The minimum legal angling size for eels was increased from 45 cm to 50 cm in January 2011 in the whole Czech Republic. The decision was based on the findings of studies that described the positive effects of stricter bag and slot limits on the sustainability of fish populations [21,22,23]. Similarly, other studies described the negative effects of bag and slot limits on the yields of targeted fish species [24,25,26,27]. To analyze the full effect of angling restrictions on fish populations, we need to add factors such as fish restocking, angler density, angling preferences, and angling effort [28,29,30]. In practical fishery management, a combination of the angling limit and the eel reintroduction program should stabilize eel populations and their yield. However, the scientific literature still does not fully describe how the angling restriction interacts with other important angling factors like angling effort, fish stocking, and the type of a fishery. On top of that, the data regarding the yields of eels are available mostly from Western and Northern Europe, while the eel yields in Central and Eastern Europe are still mostly unavailable. To analyze the interactions, I wanted to utilize the globally relatively unique high-quality data that were collected by the Czech Fishing Union and cover fish harvest and stocking rates as well as angling effort. This dataset provides information about each single harvested and stocked fish, including its length and weight, and about each angling visit of each individual angler on each stream and river from the year 2005 onward.
Firstly, this study aimed to describe the long-term trends in eel yield in the Czech Republic. Secondly, it aimed to evaluate the effect of the two management actions—the increased minimum legal angling size and the eel stocking activities—on the eel yield. Lastly, it aimed to analyze the interactions between the eel yield and the fishery, environmental, and biological factors: eel stocking, angling effort, type of fishery, the biomass of all fishes in the ecosystem, nutrient intake, water discharge, otter Lutra lutra and cormorant Phalacrocorax carbo population densities, the yields of other fish species, the estimated biomass of eels in the ecosystem, and the number of river obstacles. It was tested whether the eel yield is driven by eel stocking, by angling limitations, or by different fishery, environmental, or biological factors. The hypothesis was that the increased minimum legal angling size would lead to lower yield of eels but larger harvested eels. For that, the existence of a correlation of the intensive eel stocking, the angling effort, and fishery, environmental, and biological factors with the eel yield was tested.

2. Materials and Methods
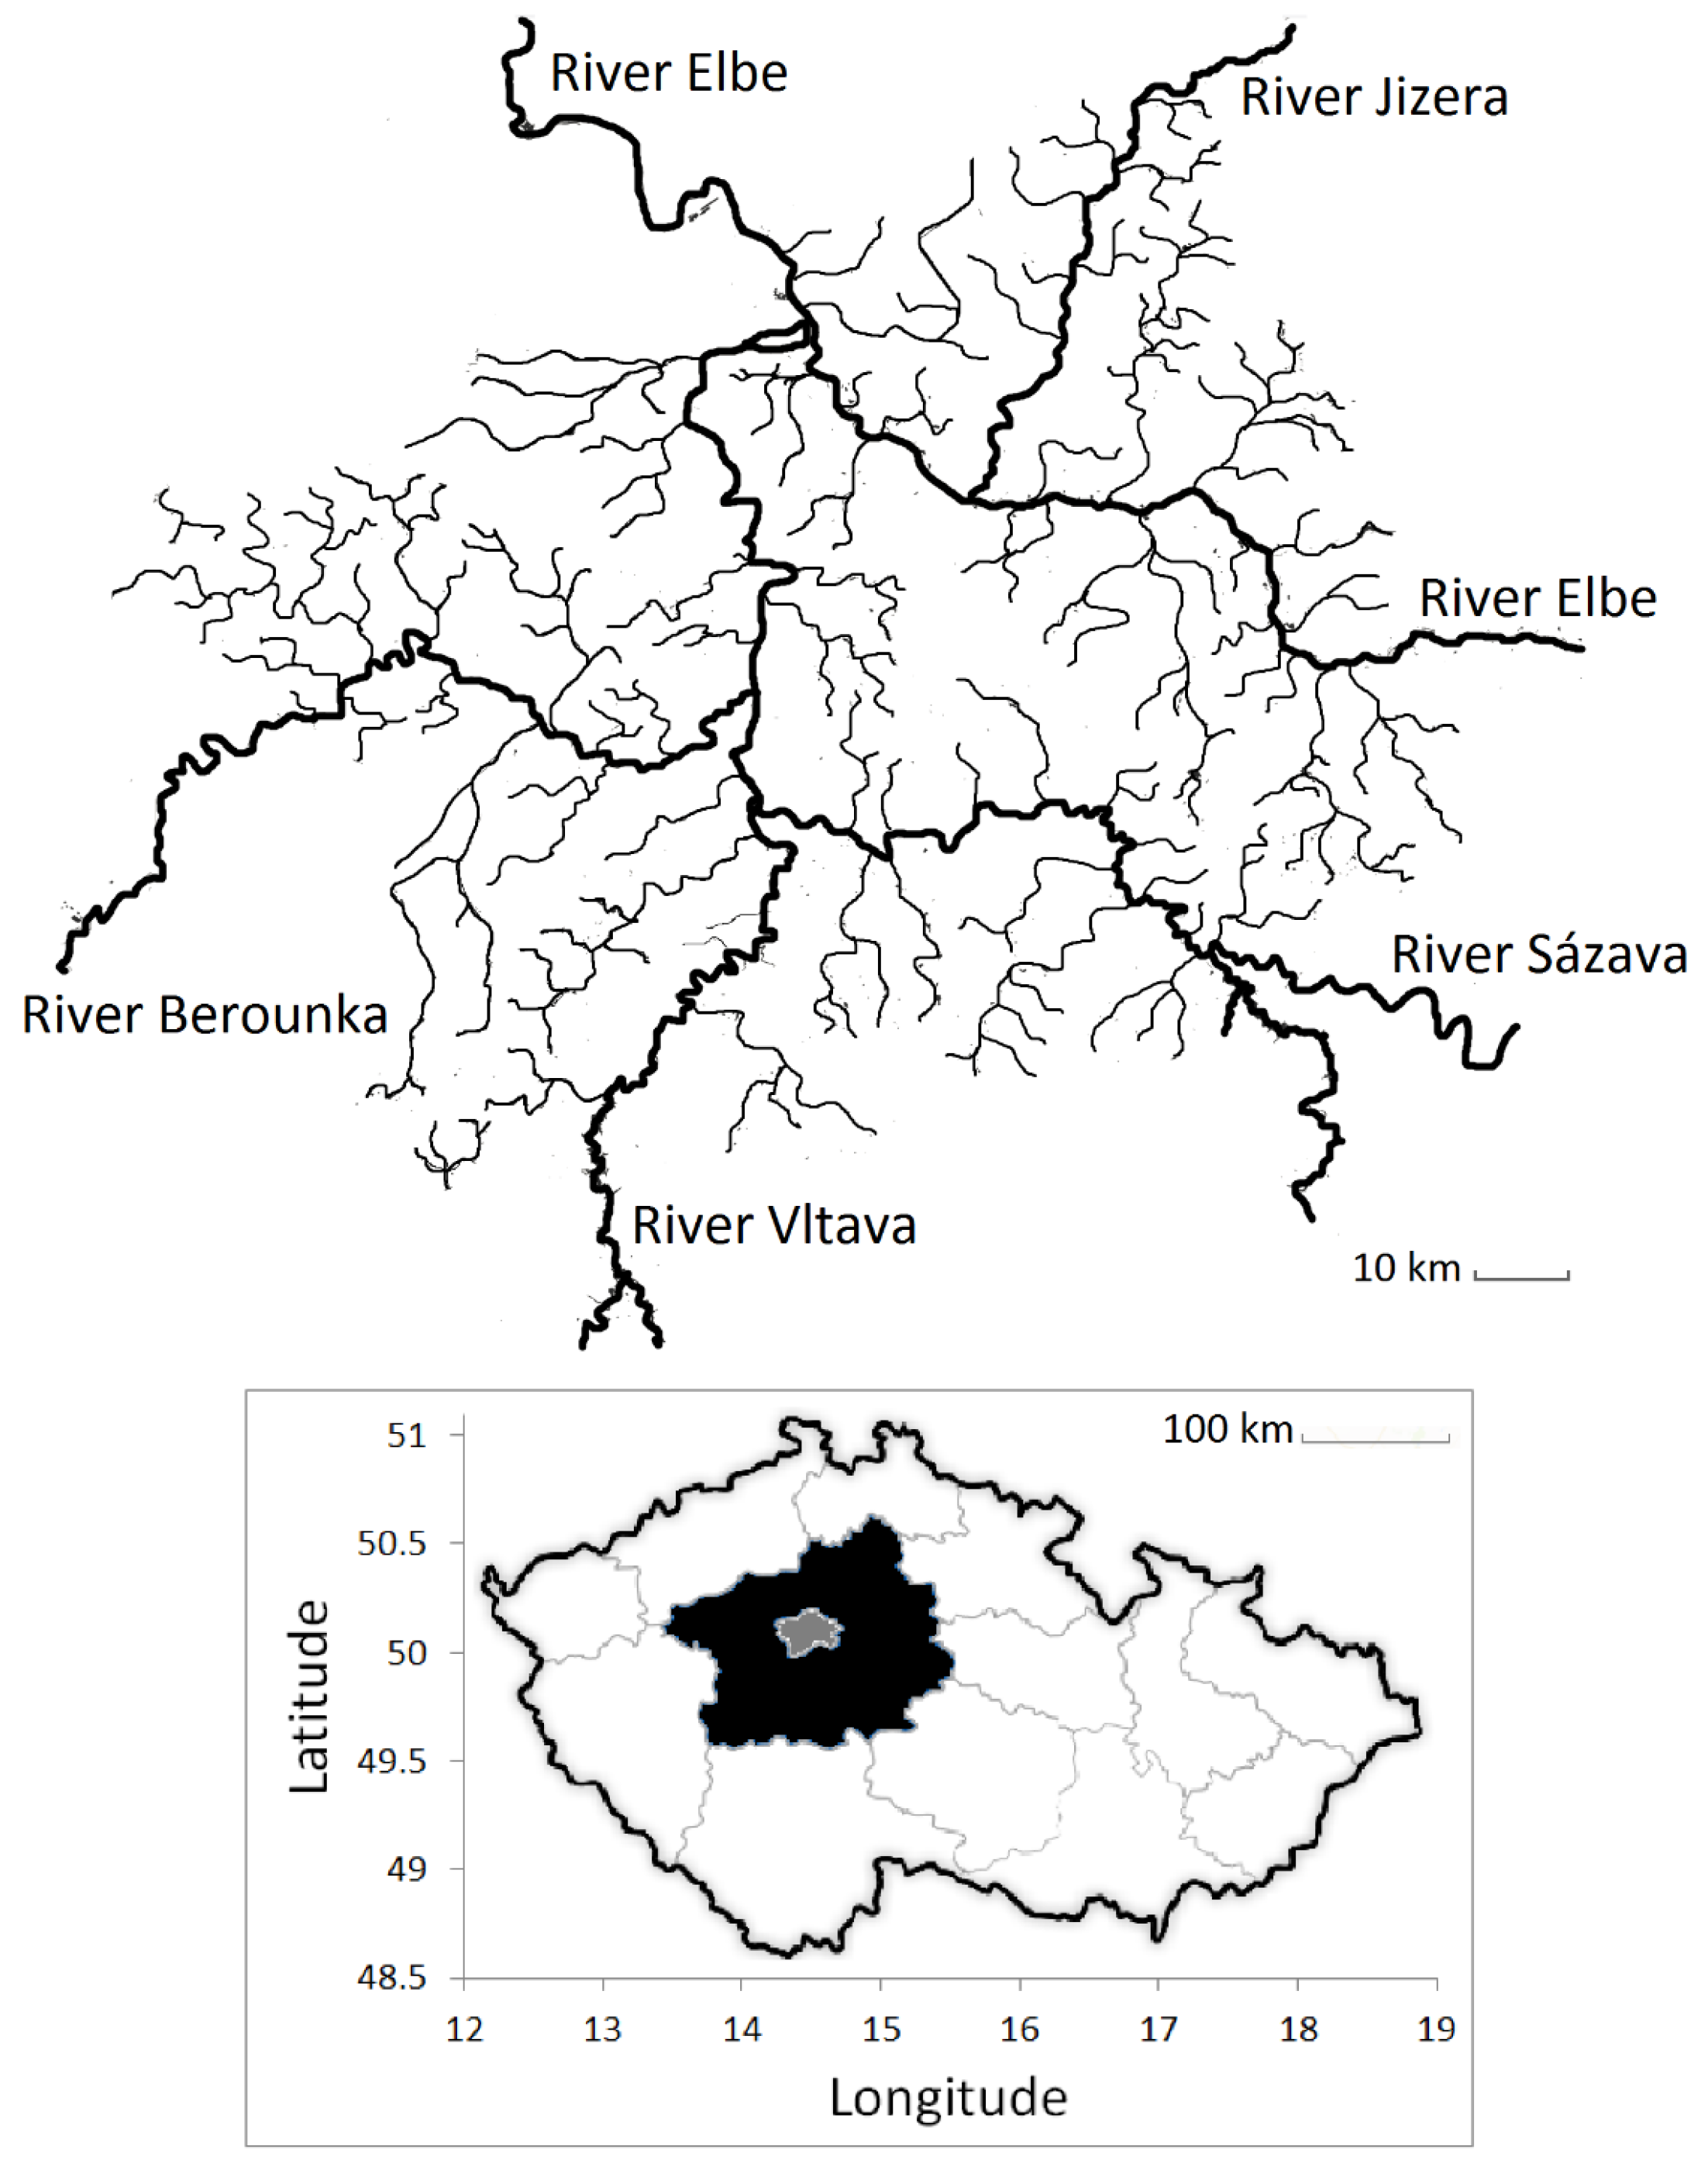
2.1. Study Area

This study was carried out on lowland mesotrophic rivers and streams that are 1–250 m wide, cover an area of 150 km2, and have a fish biomass of 150–300 kg per ha. They are situated in the city of Prague and the agricultural region of central Bohemia (49.5°–50.5° N, 13.5°–15.5° E), the Czech Republic, Central Europe (Figure 1). The regions cover an area of 11,500 km2, are in the temperate zone, and belong to the North Sea drainage area and the Elbe River Basin.
The studied rivers are separated into individual fishing sites—stretches of a river or a stream that are divided by obstacles or structures (a dam, a weir, a bridge, or a hydro-power plant). The 176 fishing sites studied here are 0.2–160.0 ha large (median 9 ha) and located in 38 rivers and streams. The studied rivers and streams were dominated by cyprinid species, mainly roach Rutilus rutilus, bleak Alburnus alburnus, and European chub Squalius cephalus.
In total, 1,733,000 fish weighing 2781 tons were harvested in the streams and rivers in the study area in 2018. This number was declining every year and fell by 10% over the years 2000–2018 [6]. Altogether, more than 60 million fish weighing 80,000 tons were harvested in the area over the years 1986–2017. Anglers mostly harvested common carp Cyprinus carpio (80% by biomass), followed by other cyprinids (bream Abramis brama, European chub, vimba bream Vimba vimba, roach, and bleak—10% altogether), predatory fishes (European catfish Silurus glanis, northern pike Esox lucius, perch Perca fluviatilis, and pikeperch Sander lucioperca—5% altogether), salmonids (brown trout Salmo trutta, rainbow trout Oncorhynchus mykiss, and European grayling Thymallus thymallus—1% altogether), and the remaining 27 species of fish (4% altogether) [26].
The studied rivers were divided into two groups: (1) a study group (the previously described 176 fishing sites where the minimum legal angling size was increased from 45 cm to 50 cm) and (2) a control group (25 different fishing sites where the minimum legal fishing size stayed constant at 45 cm). Both groups included rivers that have similar fishery, environmental, and biological characteristics and, therefore, can be reasonably well compared (Table 1). The differences between both groups were tested using two-sample Wilcoxon tests and two-variance F tests for the median values and the variances, respectively.

2.2. Ecosystem Types

The fish yield (kg per effort) was analyzed on two types of ecosystems: (1) small streams and (2) medium-sized rivers. The small streams were identified as trout streams (1–4 m wide, 0.3–1.0 m deep, 0.2–4 ha large, fast flowing), while the medium-sized rivers were identified as cyprinid rivers (5–250 m wide, 1–10 m deep, 5–160 ha large, slowly flowing). Data regarding the water surface area and the bank length of each fishing site were obtained from the Czech Fishing Union. The Union is obliged to provide the data and updates this data annually. This dataset was taken and used without any modification.

2.3. Fish Stocking Data

The fishery managers from the Czech Fishing Union were stocking elvers (young eels, 5–15 g per fish) and yellow eels (adults before migration, 50–300 g per fish) in the studied streams and rivers annually over the years 2005–2018. The fishery managers reported the numbers, the biomasses, and the sizes of the stocked eels into mandatory stocking logbooks. The information on the sizes and the biomasses of the stocked eels was obtained from aquaculture managers who grow the eels in local and regional hatcheries. The Czech Fishing Union is the sole authority that stocks fish on the studied fishing sites.
To estimate the level of correlation between the eel yield and the eel stocking intensity (kg per ha), a lag phase was incorporated between the year when the eels were stocked and the year when they were harvested. This lag phase was incorporated, because the eels were mostly stocked as elvers and needed time to grow to the minimum legal angling size (45 and 50 cm TL, respectively). The lag phase depended on the size of the stocked eels and on the time that the eels require to grow to the minimum legal angling size. It also depended on the average lifespan of the eel, which was obtained from fish biology studies [31], from FishBase [32], and from eel biology studies [4,5,16]. These data were taken and used without any modification.

2.4. Eel Angling

The European eel is a critically endangered fish species in Central Europe. Eel angling has a daily bag limit (7 kg of eels or two individual eels) and a closed season (1 September–30 November). The minimum legal angling size was increased from 45 cm to 50 cm TL in January 2011. The changes in the angling rules are updated on the web pages of the Fishing Union and distributed to anglers via local angling organizations, making sure the anglers know about the changed minimum legal angling size.
The Czech Fishing Union collected the data from personal angling logbooks and fish stocking reports, and the data were processed by the author of this study. The Union provided an annual summary of the yields, angling visits (anglers per ha), stocking activities, and activities of angling guards from each fishing site individually (Table S1 in the Supplementary Material). This dataset was taken and used without any modification.
Thus, the data from 38,219 individual anglers were analyzed over the years 2005–2018. Since each angler who fishes in the study area must obtain a fishing permit together with a fishing license (and must also report all killed fish into a mandatory angling logbook), the data were collected from almost all anglers (over 99%) who fished on the studied fishing sites. Each angler was a member of one local angling organization and passed a knowledge test on angling rules and fish biology before obtaining an angling license. Each angler delivered a filled angling logbook and a summary of fishing visits and killed fish for the whole year (Table S2 in the Supplementary Material). Anglers did not provide angling hours; only the number of fishing trips was provided. Each angler received a new angling logbook only after submitting the old filled one; this ensured that over 99% of the anglers who fished in the study area submitted a full summary of killed fish (Czech Fishing Union, unpubl. data). Anglers did not report released fish (only killed fish were reported). As a rule, the anglers can release all caught fish; they do not have to kill every single fish they catch. However, they had to release all the fish that (1) were caught during the closed season, (2) did not meet the minimum or maximum legal angling size, or (3) exceeded a daily bag limit. Anglers measured each killed fish to the nearest cm (TL, total length) and assigned a weight to the fish using species-specific length–weight tables. Those were pre-provided by the Fishing Union and were based on length–weight equations from FishBase [32]. Each angler was at least 18 years old (or a child with supervision of an adult) and used no more than two fishing rods. No boats, nets, or other fishing techniques were allowed; anglers used only rods. Netting is not allowed as a fishing technique, and commercial fishing is unimportant and almost absent in the Czech Republic.
To ensure the relative truthfulness of the reported data, professional angling guards (15 people) and amateur angling guards (1218 people) performed random inspections of the anglers in the field (40,276 annually in the year 2018). The guards checked if the anglers wrote down each killed fish (including the date, the ID of a fishery, the species, and the size) and submitted the date of the inspection into the angling logbook.

2.5. Otter and Cormorant Population Data

To analyze the correlations between the eel yield and the population densities (n per ha) of the great cormorant (Phalacrocorax carbo) and the Eurasian otter (Lutra lutra), data from trained watchers were used. Previously trained bird watchers (n = 34) counted roosting cormorants on 22 of the largest and most important roosting sites in the study area. They counted roosting, hunting, sleeping, and feeding cormorants that were present above water, circling near the rivers, or roosting on trees near the water bank. Similarly, previously trained otter trackers (n = 15) counted otter tracks in the study area on spots where otters usually live and where the tracks can be identified. Those were mainly spots under bridges and on water banks. They counted the birds and otters during each winter over the years 2005–2018. The cormorants were counted during winter, because most cormorants in Central Europe are overwintering migratory birds. The otters were also counted during winter, because they are shy and can be reliably and cheaply tracked only using snow tracking. The bird watchers and otter trackers were closely cooperating with the Nature Conservation Agency of the Czech Republic, which is the state agency that shelters and oversees all official nature biodiversity protection actions and all official wildlife population censuses. This dataset was taken and used without any modification.

2.6. Environmental Data

The correlation between the eel yield and the environmental data was analyzed using data from the Czech Hydrometeorological Institute (CHMI). The data regarding the nutrient intake (kg of N per ha), the water discharge (m3 per s), and the river obstacles (n per 100 m of the studied river) were obtained from the CHMI, which is the state agency that has been collecting these data since the 1950s. Trained experts and scientists collected the data in the field, using automatized field stations that collect the data on a daily basis. This dataset was taken and used without any modification.

2.7. Fisheries and Biological Data

Yield data for other fish species, used to analyze the correlation with the eel yield, were obtained using the same methodology that was used to estimate eel yields (Tables S1 and S2 in the Supplementary Material). The fish species were divided into two groups: (1) the non-regulated fishes (the fish species for which the minimum legal angling size remained constant over the years 2005–2018) and (2) the regulated fishes (the fish species for which the minimum legal angling size was increased over the years 2005–2018). The group of regulated fishes consisted of two species (common carp Cyprinus carpio and European perch Perca fluviatilis), while the group of non-regulated fishes consisted of twenty fish species (all fish species listed in the Table S1 in the Supplementary Material except the common carp, European perch, and European eel, which were analyzed separately). This dataset was taken and used without any modification.
The data regarding the overall fish biomass were obtained from the Czech Fishing Union. The Union performs field studies as a part of the annual fish stock assessment analysis. They sample the rivers using electrofishing devices and fishing nets. This dataset was taken and used without any modification.
The biomass of eels in the rivers was estimated using the combination of the following techniques. Firstly, the data collected by the Czech Fishing Union were used. However, since the eel is a rare species that is hard to detect by a random sampling, the biomass of eels in the rivers was estimated using a model that is described in the Supplementary materials of this study.

2.8. Data Analysis

The statistical program R [33] was used for statistical testing. The normality distributions of eel yield across all studied fishing sites, as well as the distributions of the stocking rates and other fisheries, biological, and environmental factors, were tested using the Shapiro–Wilk normality tests. Since all of these factors were not normally distributed, the non-parametric tests and the generalized models were used in the subsequent data analysis.
Specifically, the Kruskal–Wallis non-parametric test was used to analyze the differences in fishery parameters between the years before and after the angling restriction was implemented. In addition, the Wilcoxon test was used to analyze the differences in the fishery parameters between the years 2005 and 2018 (i.e., the first and the last studied year). The Kruskal–Wallis test was also used to analyze the differences between the median values of the fishery parameters before and after the restriction was implemented.
The package for generalized linear mixed models (GLMM) was used to fit the models of the yield [34]. The function lmer in the package lme4 (version 0.999375-42) [35] was used to calculate R-squared values [36]. Three models were made. The first one described the eel yield over the years 2005–2010 (when the minimum eel angling size was 45 cm). The second one described eel yield over years 2011–2018 (after the minimum eel angling size was increased to 50 cm). The third one described the effect of time and the increased minimum legal angling size on the eel yield over the years 2005–2018. The first two models were made to compare their results and to see whether the introduction of the minimum legal angling size affected the correlations between the eel yield and the tested factors. The third model was made to test the effect by using a different statistical method. The response variable in all three models was the eel yield per effort per hectare. Fixed factors in the first two models were: (1) angling effort, (2) the size (median body weight) of stocked eels, (3) the stocking intensity of elvers, (4) the stocking intensity of yellow eels, (5) fish biomass, (6) nutrient intake, (7) water discharge, (8) otter population density, (9) cormorant population density, (10) the yield of non-regulated fishes, (11) the yield of regulated fishes, (12) the biomass of eels, (13) the number of river obstacles, and (14) the bank to surface ratio. Fishing site was added as a random factor to exclude the effect of individual fishing sites on yield and because the individual fishing sites (river and stream stretches) were connected, allowing the stocked fish to migrate between the fishing sites [37]. The mathematical equation for the models was: Yield ~ Angling effort + Size of stocked eels + Stocking intensity of elver eels + Stocking intensity of yellow eels + Fish biomass + Nutrient intake + Water discharge + Otter population density + Cormorant population density + Yield of non-regulated fishes + Yield of regulated fishes + Biomass of eels + River obstacles + Bank to surface ratio + (1|fishing site).
In the third model, three fixed variables were tested: time, the increased minimum legal angling size (management), and the interaction between both variables (time × management). The time variable was marked as 0 or 1 and so was the management variable. A dummy was created to indicate the time when the minimum legal angling size was introduced. The values “0” and “1” were given to the periods of 2005–2010 and 2011–2018, respectively. Similarly, a second dummy was created to indicate the increased minimum legal angling size from 45 to 50 cm TL. The values “0” and “1” were given to the fishing sites where the angling size remained constant (control groups) and where it was changed (study groups), respectively. Then, an interaction between the variables “time” and “management” (time × management) was created to calculate the difference in difference (DiD) estimation. The mathematical equation for the model was: Yield ~ Time + Management + Time × Management.
Collective annual data from one fishing site were used as one sample in the analyses. Gamma error distribution with log link function was used in the models, because the data had continually distributed positive values. A minimum probability level of p = 0.05 was accepted for all two-tailed statistical tests. This method of fishery data analysis was previously used to analyze fish yield in different research papers, e.g., [6,38,39].

3. Results

The European eel made only a small portion (0.006%) of all harvested fish (Table 2). The anglers harvested 1.6 times more eels than what the fisheries managers stocked (by biomass). However, the eel stocking intensity decreased over the years 2005–2018 (Figure 2a) and so did the eel yield (Figure 2b) and the percentage of eel in the overall fish yield (Figure 2c) (stocking intensity: W = 6,329,438, p < 0.01; eel yield: W = 4,253,218, p <0.01; percentage of eel in the overall fish harvest: W = 4,637,214, p < 0.01).
Firstly, the effect of the restriction—the increased minimum angling size from 45 cm to 50 cm TL—on eel yield was tested (Figure 2b). While the eel yield fluctuated over time before the restriction was introduced, it stabilized after (before: Kruskal–Wallis = 3.46, df = 5, p = 0.04; after: Kruskal–Wallis = 7.10, df = 6, p = 0.31). The median yield of the eel was lower after the restriction was introduced (W = 271,31, p < 0.01).
Additionally, the changes were compared in the yields of the eel in the studied rivers where the angling size was increased (the studied group) to the changes in the yields on different rivers where the minimum legal angling size of the eel was not increased and stayed constant over time (the control group). While the yield in the studied group decreased after the angling size was increased, the yield in the control group remained constant over time (Kruskal–Wallis = 42.18, df = 12, p = 0.36).
Two models of the eel yields were created—the first one before the introduction of the restriction, and the second one after it (Table 3). Both models showed that the angling effort was the only important factor explaining the eel yield. The angling effort was strongly negatively correlated with the eel yield, meaning that a higher number of anglers led to a lower CPUE (catch per unit effort). The other factors were only weakly correlated with the eel yield. Importantly, the intensive stocking of elvers and yellow eel did not increase the eel yield, as no strong correlation was observed between the eel stocking intensity and the eel yield. In addition, the correlations were tested between the other biological and environmental factors that could affect the eel yield. However, neither of them was significantly correlated to the yield. The yield of eels did not significantly depend on abiotic environmental factors such as the type and size of a river, nutrient intake, water discharge, and the presence of obstacles in the river. The yield also did not depend on biological factors such as the overall biomass of all fish in the river, the estimated biomass of eels in the river, and the population densities of the fish-eating Eurasian otters and great cormorants. The yield of eels was also not significantly correlated with the yield of other fish species.
Subsequently, the differences were tested between the residuals of both models, and it was found that they differed significantly (V = 932,295, p < 0.01). The restriction has, therefore, led to a change in the eel yield. In addition, the model created to analyze the effect of the increased minimum legal angling size in the eel yield, which used time and management factors as dummy variables, showed a significant effect of the increased angling size on the yield (Table 4).
All models showed that the eel yields were exclusively affected by the angling effort and by the changes in the minimum legal angling size. Conversely, no biological and environmental factors had any strong or significant effect on the changes in the eel yield.
Secondly, the changes in the proportion (in %) of eel in the overall fish harvested were tested before and after the introduction of the restriction (Figure 2c). While the proportion of eel in the overall fish harvested fluctuated over time before the introduction of the restriction, it stabilized afterwards (before: Kruskal–Wallis = 49.50, df = 5, p-value < 0.01; after: Kruskal–Wallis = 7.11, df = 6, p-value = 0.31). The proportion of eels in the overall fish harvested was lower after the restriction was introduced (W = 22,287, p < 0.01). The restriction stabilized the proportion of eels in the overall fish yield. The changes were also compared in the proportion between the studied group and the control group. While the proportion in the studied group decreased after the angling size was increased, the proportion in the control group remained constant over time (Kruskal–Wallis = 23.87, df = 12, p = 0.14).
Thirdly, the effect of the restriction on the size (median body weight) of the eels harvested was tested (Figure 2d). While the size of the harvested eels fluctuated over time before the introduction of the restriction, it stabilized afterwards (before: Kruskal–Wallis = 31.83, df = 5, p-value = 0.03; after: Kruskal–Wallis = 21.81, df = 6, p-value = 0.13). The harvested eels were larger after the restriction was introduced (W = 2.986, p < 0.03). The restriction has stabilized the size of harvested eels. The changes in the median body weights were also compared between the studied group and the control group. While the median body weights in the studied group increased after the angling size was increased, the body weights in the control group remained constant over time (Kruskal–Wallis = 23.87, df = 12, p = 0.14).
Fourthly and lastly, the effect of the restriction on the number of fishing sites where eels were harvested was tested. It was found that the anglers harvested at least one eel per year on a stable number of fishing sites throughout the years 2005–2018. The restriction did not lead to fewer fishing sites where anglers have harvested eels (Kruskal–Wallis = 28.20, df = 12, p = 0.38). The restriction had no effect on the number of fishing sites where anglers harvested eels. The changes were also compared in the number of fishing sites between the studied group and the control group. The number of fishing sites in the control group also remained constant over time (Kruskal–Wallis = 35.88, df = 12, p = 0.28).
When all of the fishery management factors are taken into consideration together with the environmental and biological factors, the data suggest that the eel stocking activities had no significant effect on the sustainability and natural recruitment of the eel population in the Czech Republic.

4. Discussion

The study confirmed the initial hypothesis that the implementation of the minimum legal angling size leads to lower yield of eels and to larger harvested eels. It also confirmed the hypothesis that the eel yield is driven by angling effort. Conversely, the hypothesis that the eel stocking intensity is the main driver of the eel yield was rejected.
The eel yields decreased over the study period, most likely due to four factors: angling slot limits, changes in preferences of anglers towards other fish, increased angling pressure, and shrinking eel populations.
Firstly, the increased minimum legal angling size resulted in the decreased yield of eels. This should release eels from angling pressure and enable their growth and migration to the Sargasso Sea. However, the decreased yield was not exclusive for eels; other fish species also experienced decreased landings in Central Europe and outside of Europe [6,40]. In general, fish yield in inland freshwater Europe has decreased, mainly due to a lower fish abundance caused by lower input of nutrients (N, P, K) into water. Other reasons were the legislative protection of fish-eating otters and cormorants, introduction of parasites (e.g., bladder nematode Anguillicola crassus), increased angling pressure, water pollution (organic pollutants and drug residuals), and inappropriate modifications of rivers and streams [41,42,43,44,45,46]. Therefore, the study tested the effect of those environmental and biological factors on the yield of eels, but none of them turned out to be an important driver of the yield. This was mostly because the factors such as fish biomass, nutrient intake, and water discharge were mostly stable over the period. The rivers in Central Europe form a stable ecosystem that did not undergo any significant change over years 2005–2018 [6]. Similarly, the populational densities of cormorants and otters have also stabilized in Central Europe between the years 2010 and 2020 [43,44]. The parameter that was predicted to be strongly correlated to the eel yield was the yield of other fish species. However, the results have shown that the yields of other fish species have also been decreasing but at a different speed. Secondly, the behavior and preferences of anglers could also be responsible for the decreased eel yield. The critically endangered conservation status of eel could make anglers release caught eels back into the water instead of killing them. Anglers are generally more informed about the awareness campaigns regarding the poor population status of eels than they were 10–20 years ago [47]. The combination of better knowledge and solidarity with eel species could prompt changes in angling behavior. Studies confirmed that anglers acknowledge their part in the poor population status of the European eel [11]. Since the catch-and-release angling strategy has recently been gaining popularity in Europe, this explanation for decrease in yields is quite probable [6,48]. The perceptions and opinions of anglers and stakeholders regarding eel conservation could also be driving their opinions about eel harvest regulations [13].
Thirdly, the decreased eel yield could be caused by the increased angling pressure. The yield of eel was reliably explained by angling effort, suggesting a competition for landings among anglers. It also suggests a significant effect of recreational fishing on eel populations. Both yield and angling effort are closely correlated in other fish species as well [49].
Conversely, eel stocking had only a weak effect on the eel yield. However, anglers killed more eels than what fisheries managers stocked. This is partially because eels have high nutrition value and a great tasting meat [4]. Their catch is also a real and rare angling achievement in Central European waters. When we compare stocking and yield of eel to other fish species, we can see that other native fish species showed a lower ratio of harvest against stocking. Anglers harvested only 1–5% of restocked fish in the case of salmonids and rheophilic fishes (brown trout Salmo trutta, rainbow trout Oncorhynchus mykiss, nase Chondrostoma nasus, vimba bream Vimba vimba, and barbel Barbus barbus) [26,27]. On the other hand, intensively stocked species showed 5–10 times higher yield in comparison to restocking intensity—for example, in the case of European catfish Silurus glanis and common carp Cyprinus carpio [24,25]. The recapture rates of restocked fish usually depend on species and geographical area [50,51,52].
In addition to the food-based reasons to keep a caught eel, there is also the conservation issue. Anglers often perceive eels as a food item and an angling target instead of a species worth saving, knowing that most eels are not able to successfully migrate due to river fragmentation and migration barriers [53,54]. Anglers mostly know that the two main dams on the Elbe River (Geesthacht in Germany and Střekov in the Czech Republic) together with an overabundance of obstacles on Czech rivers prevent effective eel migration. Small hydroelectric power plants are installed on the studied rivers and streams, and their turbines can cause lethal damage to eels due to their strong sense of migration [55].
Fourthly and finally, we have been observing a clear trend of decreasing eel populations in Central Europe over the last 10 years. A similar trend has been noticed in other EU countries as well [54,56]. Since eel angling is not banned in all countries, we support banning eel angling altogether, instead of setting a closed season. To remove survival bottlenecks of migrating eels, their angling should be banned or restricted in every country where eels pass through during their spawning migration. Otherwise, eels will get killed in the country with the lowest level of protection against overharvesting. The need to protect migrating animals in the whole migration range was observed in other migratory fishes but also in migratory birds, insects, and mammals [57,58,59,60].
In addition to the lack of protective measures, the success of eel reintroduction is further hampered by the increasing intensity of illegal eel smuggling and trading on the black market. European eel is expensive, and its market price was increasing over the years 2010–2018. The EU market lacks eels for restocking purposes, because they are sold to Asian countries (Japan and China) for higher prices as a delicacy [5,54].
Although we can reliably say that the eel yields have decreased, we cannot exactly estimate the true yield, due to limitations in data collection and analysis. The three main problems were the lack of knowledge regarding the eel life cycle, the relative rarity of eels, and the errors in mandatory angling logbooks, which will be discussed next.
Firstly, a lag period had to be inserted between eel stocking and eel harvesting, because the eels migrate and spawn in the Sargasso Sea. The estimated eel migration period could be 2–3 years off, because we still do not know exactly how long the migration takes; the eel life cycle is partially unknown [16,61].
Secondly, the yield of a less abundant and endangered fish species was analyzed. The percentage of eel in the overall fish harvest was small (under 1%), because eel populations are not sustainable in Central Europe. However, in other countries, such as Great Britain or Scotland, eels form about 10–40% of the overall fish harvested [18,62]. The studied rivers in Central Europe are fragmented and situated 1154 km upstream from its tributary to the North Sea, making it hard for eel elvers to successfully migrate to the Czech Republic. The small “n” could cause issues in statistical analysis.
Thirdly and finally, angling logbooks were used as the data source of eel yield. These logbooks provided strong data from numerous fishing sites over a longer period, but they are partially burdened with incorrect observations. Sometimes, anglers report an incorrect size of killed fish (for example, an angler kills a 40 cm large eel but reports 50 cm to meet the minimum legal angling size limit). Anglers could also incorrectly identify harvested fish (misinterpreting European eel for brook lamprey Lampetra planeri) or could not comply with angling rules (ignoring the minimum angling size limits). They often prefer specific fish species (they release caught eels to make room for common carp Cyprinus carpio) and, sometimes, they prefer the catch-and-release fishing strategy and release all caught fish [63,64,65,66,67].
Other methods of measuring the effect of the increased angling size and increased stocking intensity on the eel yield could have been used. Those methods would include tagging of stocked eels, creel surveys among anglers, or direct observations of angler behavior via an anthropological approach. However, such methods were too costly in terms of money and time invested.

5. Conclusions

In conclusion, eel stocking management seems to have no effect on the natural eel reproduction and, therefore, does not contribute to the sustainability of the eel population. The eel stocking program should, therefore, be re-evaluated. Possible options are choosing different habitats for eel stocking or choosing a different stocking strategy. Another option is to ban eel angling altogether to encourage anglers to target non-eel fish species instead, further removing the angling pressure from eels so that their population may recover. Even though several important fishery, environmental, and biological factors were tested in the present study, it is possible that eel yield is driven by other factors that were not tested in this study. Those factors could include, especially, the behavior of anglers and their angling preferences towards fish species other than the European eel.

Supplementary Materials

The following are available online at https://www.mdpi.com/article/10.3390/fishes7010042/s1, Table S1: An annual summary of all harvested fish, all angling trips, and all angling guard inspections on one the Berounka River in the year 2014. The data were collected by the Czech Fishing Union and originate from angling logbooks that were collected from all individual anglers who fished on the river during the whole year. Table S2: An example of a fishing permit (a), a report of killed fish (b), and a summary of killed fish for the whole year (c) from one individual angler. The data originated from an angling logbook that was submitted by one individual angler in the year 2014. Table S3: The estimated biomass of the European eel Anguilla anguilla in the 176 studied and 25 control river stretches in the regions of central Bohemia and Prague over years 2005–2018. The biomass was estimated using the equation presented in this appendix. Data S1: This part describes how the eel stock in the studied rivers was estimated in the study.

Funding

This research was funded by Operation Program Research, Development, and Education, European Structural and Investment Funds and by the Ministry of Education, Youth, and Sports of the Czech Republic, grant number/registration number CZ.02.2.69/0.0/0.0/18_054/0014660” as a part of the project “Setting the conditions and the environment for international and cross-sector cooperation”.

Data Availability Statement

The data used to support the findings of this study will be available from the corresponding author upon request. Since the data are owned by a third party, consent will be needed from this party as well.

Acknowledgments

The representatives of the Czech Fishing Union (Pavel Horáček, Dušan Hýbner, Jaroslava Fryšová) provided fisheries data.

Conflicts of Interest

The author declares no conflict of interest.

References

  1. Copp, G.H.; Daverat, F.; Bašić, T. The potential contribution of small coastal streams to the conservation of declining and threatened diadromous fishes, especially the European eel. River Res. Appl. 2020, 37, 111–115. [Google Scholar] [CrossRef]
  2. Baisez, A.; Laffaille, P. Strategy of recreational anglers and estimated eel (Anguilla anguilla) catches in a large European catchment basin, the Loire (France). Knowl. Manag. Aquat. Ecosyst. 2008, 390–391, 3. [Google Scholar] [CrossRef] [Green Version]
  3. Bernotas, P.; Vetemaa, M.; Saks, L.; Eschbaum, R.; Verliin, A.; Järvalt, A. Dynamics of European eel landings and stocks in the coastal waters of Estonia. ICES J. Mar. Sci. 2016, 73, 84–90. [Google Scholar] [CrossRef] [Green Version]
  4. Shiraishi, H.; Crook, V. Eel Market Dynamics: An Analysis of Anguilla Production; TRAFFIC: Tokyo, Japan, 2015. [Google Scholar]
  5. Dekker, W. The history of commercial fisheries for European eel commenced only a century ago. Fish. Manag. Ecol. 2019, 26, 6–19. [Google Scholar] [CrossRef]
  6. Lyach, R.; Čech, M. A new trend in Central European recreational fishing: More fishing visits but lower yield and catch. Fish. Res. 2018, 201, 131–137. [Google Scholar] [CrossRef]
  7. ICES. Joint EIFAAC/ICES/GFCM Working Group on Eels (WGEEL). ICES Sci. Rep. 2019, 1, 177. [Google Scholar] [CrossRef]
  8. European Commission. Council Regulation (EC) No 1100/2007 of 18 September 2007 establishing measures for the recovery of the stock of European eel. Off. J. Eur. Union 2007, 248, 17–23. [Google Scholar]
  9. Belpaire, C.; Geeraerts, C.; Evans, D.; Ciccotti, E.; Poole, R. The European eel quality database: Towards a pan-European monitoring of eel quality. Environ. Monit. Assess. 2011, 183, 273–284. [Google Scholar] [CrossRef] [PubMed] [Green Version]
  10. Dorow, M.; Beardmore, B.; Haider, W.; Arlinghaus, R. Using a novel survey technique to predict fisheries stakeholders’ support for European eel (Anguilla anguilla L.) conservation programs. Biol. Conserv. 2009, 142, 2973–2982. [Google Scholar] [CrossRef]
  11. Dorow, M.; Arlinghaus, R. The relationship between personal commitment to angling and the opinions and attitudes of German anglers towards the conservation and management of the European eel Anguilla anguilla. N. Am. J. Fish. Manag. 2012, 32, 466–479. [Google Scholar] [CrossRef]
  12. Feunteun, E. Management and restoration of European eel population (Anguilla anguilla): An impossible bargain. Ecol. Eng. 2002, 18, 575–591. [Google Scholar] [CrossRef]
  13. Garrido, F.E.; Ruiz-Ruiz, J.; Lafuente-Fernández, R.; Villafuerte, R. Exploring perceptions to manage conflicts: The case of the European eel fishing moratorium in Southern Spain. Hum. Dimens. Wildl. 2020, 25, 136–153. [Google Scholar] [CrossRef]
  14. Essl, K.; Gassner, H.; Schabetsberger, R.; Jagsch, A.; Kaiser, R. The development of stocked eels (Anguilla anguilla) in previously eel-free A ustrian A lpine lakes. Ecol. Freshw. Fish 2016, 25, 17–26. [Google Scholar] [CrossRef]
  15. Matondo, B.; Benitez, J.P.; Dierckx, A.; Rollin, X.; Ovidio, M. An Evaluation of Restocking Practice and Demographic Stock Assessment Methods for Cryptic Juvenile European Eel in Upland Rivers. Sustainability 2020, 12, 1124. [Google Scholar] [CrossRef] [Green Version]
  16. Van Ginneken, V.J.; Maes, G.E. The European eel (Anguilla anguilla, Linnaeus), its lifecycle, evolution and reproduction: A literature review. Rev. Fish Biol. Fish. 2005, 15, 367–398. [Google Scholar] [CrossRef]
  17. Bernotas, P.; Öğlü, B.; Nõges, P. How do environmental factors affect the yield of European eel (Anguilla anguilla) in a restocked population? Fish. Res. 2020, 230, 105649. [Google Scholar] [CrossRef]
  18. Bevacqua, D.; Melià, P.; Schiavina, M.; Crivelli, A.J.; De Leo, G.A.; Gatto, M. A demographic model for the conservation and management of the European eel: An application to a Mediterranean coastal lagoon. ICES J. Mar. Sci. 2019, 76, 2164–2178. [Google Scholar] [CrossRef]
  19. Teichert, N.; Tétard, S.; Trancart, T.; de Oliveira, E.; Acou, A.; Carpentier, A.; Bourillon, B.; Feunteun, E. Towards transferability in fish migration models: A generic operational tool for predicting silver eel migration in rivers. Sci. Total Environ. 2020, 739, 140069. [Google Scholar] [CrossRef]
  20. Weltersbach, M.S.; Strehlow, H.V.; Ferter, K.; Klefoth, T.; de Graaf, M.; Dorow, M. Estimating and mitigating post-release mortality of European eel by combining citizen science with a catch-and-release angling experiment. Fish. Res. 2018, 201, 98–108. [Google Scholar] [CrossRef]
  21. Beardmore, B.; Dorow, M.; Haider, W.; Arlinghaus, R. The elasticity of fishing effort response and harvest outcomes to altered regulatory policies in eel (Anguilla anguilla) recreational angling. Fish. Res. 2011, 110, 136–148. [Google Scholar] [CrossRef]
  22. Ayllón, D.; Nicola, G.G.; Elvira, B.; Almodóvar, A. Optimal harvest regulations under conflicting tradeoffs between conservation and recreational fishery objectives. Fish. Res. 2019, 216, 47–58. [Google Scholar] [CrossRef]
  23. Lai, E.K.; Mueller, U.; Hyndes, G.A.; Ryan, K.L. Comparing estimates of catch and effort for boat-based recreational fishing from aperiodic access-point surveys. Fish. Res. 2019, 219, 105305. [Google Scholar] [CrossRef]
  24. Lyach, R.; Remr, J. Changes in recreational catfish Silurus glanis harvest rates between years 1986–2017 in Central Europe. J. Appl. Ichthyol. 2019, 35, 1094–1104. [Google Scholar] [CrossRef]
  25. Lyach, R. The effect of a large-scale angling restriction in minimum angling size on harvest rates, recapture rates, and average body weight of harvested common carps Cyprinus carpio. Fish. Res. 2020, 223, 105438. [Google Scholar] [CrossRef]
  26. Lyach, R. The effect of fishing effort, fish stocking, and population density of overwintering cormorants on the harvest and recapture rates of three rheophilic fish species in central Europe. Fish. Res. 2020, 223, 105440. [Google Scholar] [CrossRef]
  27. Lyach, R. The effects of fisheries management on harvest rates of native and non-native salmonid fish species. J. Appl. Ichthyol. 2020, 36, 298–314. [Google Scholar] [CrossRef]
  28. Jankovský, M.; Boukal, D.S.; Pivnička, K.; Kubečka, J. Tracing possible drivers of synchronously fluctuating species catches in individual logbook data. Fish. Manag. Ecol. 2011, 18, 297–306. [Google Scholar] [CrossRef]
  29. Post, J.R.; Mushens, C.; Paul, A.; Sullivan, M. Assessment of alternative harvest regulations for sustaining recreational fisheries: Model development and application to bull trout. N. Am. J. Fish. Manag. 2003, 23, 22–34. [Google Scholar] [CrossRef]
  30. Askey, P.J.; Johnston, N.T. Self-regulation of the Okanagan Lake kokanee recreational fishery: Dynamic angler effort response to varying fish abundance and productivity. N. Am. J. Fish. Manag. 2013, 33, 926–939. [Google Scholar] [CrossRef]
  31. Kottelat, M.; Freyhof, J. Handbook of European Freshwater Fishes; Publications Kottelat: Berlin, Germany, 2007. [Google Scholar]
  32. Froese, R.; Pauly, D. (Eds.) FishBase 2000: Concepts, Design and Data Sources; ICLARM: Los Baños, Philippines, 2000; 344p. [Google Scholar]
  33. R Core Team. R: A Language and Environment for Statistical Computing.; R Foundation for Statistical Computing: Vienna, Austria, 2020; Available online: http://www.R-project.org/ (accessed on 15 November 2021).
  34. Hadfield, J.D. MCMC Methods for Multi-Response Generalized Linear Mixed Models: The MCMCglmm R Package. J. Stat. Softw. 2010, 33, 1–22. [Google Scholar] [CrossRef] [Green Version]
  35. Bates, D.; Maechler, M.; Bolker, B.; Walker, S. Fitting Linear Mixed-Effects Models Using lme4. J. Stat. Softw. 2015, 67, 1–48. [Google Scholar] [CrossRef]
  36. Nakagawa, S.; Johnson, P.C.; Schielzeth, H. The coefficient of determination R 2 and intra-class correlation coefficient from generalized linear mixed-effects models revisited and expanded. J. R. Soc. Interface 2017, 14, 213–217. [Google Scholar] [CrossRef] [Green Version]
  37. Coelho, R.; Infante, P.; Santos, M.N. Comparing GLM, GLMM, and GEE modeling approaches for catch rates of bycatch species: A case study of blue shark fisheries in the South Atlantic. Fish. Oceanogr. 2020, 29, 169–184. [Google Scholar] [CrossRef]
  38. Humpl, M.; Pivnička, K.; Jankovský, M. Sport fishery statistics, water quality, and fish assemblages in the Berounka River in 1975–2005. Folia Zool. 2009, 58, 457–465. [Google Scholar]
  39. Boukal, D.S.; Jankovský, M.; Kubečka, J.; Heino, M. Stock–catch analysis of carp recreational fisheries in Czech reservoirs: Insights into fish survival, water body productivity and impact of extreme events. Fish. Res. 2012, 119, 23–32. [Google Scholar] [CrossRef]
  40. Zhang, Y.; Liu, S.F.; Wang, K. Explorations of Charm Factors and Development of Fishing in Southern Taiwan Based on Miryoku Engineering and the Analytic Network Process. Sustainability 2019, 11, 737. [Google Scholar] [CrossRef] [Green Version]
  41. Glatzel, G. The impact of historic land use and modern forestry on nutrient relations of Central European forest ecosystems. Fertil. Res. 1991, 27, 1–8. [Google Scholar] [CrossRef]
  42. Van der Oost, R.; Heida, H.; Satumalay, K.; van Schooten, F.J.; Ariese, F.; Vermeulen, N.P. Bioaccumulation, biotransformation and DNA binding of PAHs in feral eel (Anguilla anguilla) exposed to polluted sediments: A field survey. Environ. Toxicol. Chem. Int. J. 1994, 13, 859–870. [Google Scholar] [CrossRef]
  43. Conroy, J.W.; Chanin, P.R. The status of the Eurasian otter (Lutra lutra) in Europe. A Review. J. Int. Otter Surviv. Fund 2000, 1, 7–28. [Google Scholar]
  44. Sures, B.; Knopf, K. Parasites as a threat to freshwater eels? Science 2004, 304, 209–211. [Google Scholar] [CrossRef]
  45. Marzano, M.; Carss, D.N.; Cheyne, I. Managing European cormorant-fisheries conflicts: Problems, practicalities and policy. Fish. Manag. Ecol. 2013, 20, 401–413. [Google Scholar] [CrossRef]
  46. Piper, A.T.; Wright, R.M.; Walker, A.M.; Kemp, P.S. Escapement, route choice, barrier passage and entrainment of seaward migrating European eel, Anguilla anguilla, within a highly regulated lowland river. Ecol. Eng. 2013, 57, 88–96. [Google Scholar] [CrossRef] [Green Version]
  47. Meulenbroek, P.; Hammerschmied, U.; Schmutz, S.; Weiss, S.; Schabuss, M.; Zornig, H.; Shumka, S.; Schiemer, F. Conservation Requirements of European Eel (Anquilla anquilla) in a Balkan Catchment. Sustainability 2020, 12, 8535. [Google Scholar] [CrossRef]
  48. Arlinghaus, R.; Cooke, S.J.; Lyman, J.; Policansky, D.; Schwab, A.; Suski, C.; Sutton, S.G.; Thorstad, E.B. Understanding the complexity of catch-and-release in recreational fishing: An integrative synthesis of global knowledge from historical, ethical, social, and biological perspectives. Rev. Fish. Sci. 2007, 15, 75–167. [Google Scholar] [CrossRef]
  49. Hunt, L.M.; Arlinghaus, R.; Lester, N.; Kushneriuk, R. The effects of regional angling effort, angler behavior, and harvesting efficiency on landscape patterns of overfishing. Ecol. Appl. 2011, 21, 2555–2575. [Google Scholar] [CrossRef]
  50. Storck, T.; Newman, D. Effects of size at stocking on survival and harvest of channel catfish. N. Am. J. Fish. Manag. 1988, 8, 98–101. [Google Scholar] [CrossRef]
  51. Michaletz, P.H.; Wallendorf, M.J.; Nicks, D.M. Effects of stocking rate, stocking size, and angler catch inequality on exploitation of stocked channel catfish in small Missouri impoundments. N. Am. J. Fish. Manag. 2008, 28, 1486–1497. [Google Scholar] [CrossRef]
  52. Persat, H.; Mattersdorfer, K.; Charlat, S.; Schenekar, T.; Weiss, S. Genetic integrity of the European grayling (Thymallus thymallus) populations within the Vienne River drainage basin after five decades of stockings. Cybium 2016, 40, 7–20. [Google Scholar]
  53. Slavík, O.; Horký, P.; Randák, T.; Balvín, P.; Bílý, M. Brown trout spawning migration in fragmented Central European headwaters: Effect of isolation by artificial obstacles and the moon phase. Trans. Am. Fish. Soc. 2012, 141, 673–680. [Google Scholar] [CrossRef]
  54. Dekker, W.; Beaulaton, L. Climbing back up what slippery slope? Dynamics of the European eel stock and its management in historical perspective. ICES J. Mar. Sci. 2016, 73, 5–13. [Google Scholar] [CrossRef] [Green Version]
  55. Winter, H.V.; Jansen, H.M.; Bruijs, M.C.M. Assessing the impact of hydropower and fisheries on downstream migrating silver eel, Anguilla anguilla, by telemetry in the River Meuse. Ecol. Freshw. Fish 2006, 15, 221–228. [Google Scholar] [CrossRef]
  56. Belpaire, C.G.J.; Goemans, G.; Geeraerts, C.; Quataert, P.; Parmentier, K.; Hagel, P.; De Boer, J. Decreasing eel stocks: Survival of the fattest? Ecol. Freshw. Fish 2009, 18, 197–214. [Google Scholar] [CrossRef]
  57. Myers, J.P. Conservation of migrating shorebirds: Staging areas, geographic bottlenecks, and regional movements. Am. Birds 1983, 37, 23–25. [Google Scholar]
  58. Oberhauser, K.S.; Solensky, M.J. (Eds.) Monarch Butterfly Biology & Conservation; Cornell University Press: Ithaca, NY, USA, 2004. [Google Scholar]
  59. Harris, G.; Thirgood, S.; Hopcraft, J.G.C.; Cromsigt, J.P.; Berger, J. Global decline in aggregated migrations of large terrestrial mammals. Endanger. Species Res. 2009, 7, 55–76. [Google Scholar] [CrossRef]
  60. Lennox, R.J.; Paukert, C.P.; Aarestrup, K.; Auger-Méthé, M.; Baumgartner, L.; Birnie-Gauvin, K.; Boe, K.; Brink, K.; Brownscombe, J.W.; Chen, Y.; et al. One hundred pressing questions on the future of global fish migration science, conservation, and policy. Front. Ecol. Evol. 2019, 7, 286. [Google Scholar] [CrossRef] [Green Version]
  61. Aarestrup, K.; Økland, F.; Hansen, M.M.; Righton, D.; Gargan, P.; Castonguay, M.; Bernatchez, L.; Howey, P.; Sparholt, H.; Pedersen, M.I.; et al. Oceanic spawning migration of the European eel (Anguilla anguilla). Science 2009, 325, 1660. [Google Scholar] [CrossRef] [PubMed]
  62. Aprahamian, M.W.; Evans, D.W.; Briand, C.; Walker, A.M.; McElarney, Y.; Allen, M. The changing times of Europe’s largest remaining commercially harvested population of eel Anguilla anguilla L. J. Fish Biol. 2021, 99, 1201–1221. [Google Scholar] [CrossRef] [PubMed]
  63. Essig, R.J.; Holliday, M.C. Development of a recreational fishing survey: The marine recreational fishery statistics survey case study. Am. Fish. Soc. 1991, 12, 245–254. [Google Scholar]
  64. Pollock, K.H.; Jones, C.M.; Brown, T.L. Angler Survey Methods and Their Applications in Fisheries Management; American Fisheries Society Special Publication 25: Bethesda, MD, USA, 1994; 371p. [Google Scholar]
  65. Cooke, S.J.; Dunlop, W.I.; McLennan, D.M.; Power, G. Applications and characteristics of angler diary programs in Ontario, Canada. Fish. Manag. Ecol. 2000, 7, 473–487. [Google Scholar] [CrossRef] [Green Version]
  66. Bray, G.S.; Schramm, H.L. Evaluation of a state-wide volunteer angler diary program for use as a fishery assessment tool. N. Am. J. Fish. Manag. 2001, 21, 606–615. [Google Scholar] [CrossRef]
  67. Mosindy, T.E.; Duffy, M.J. The use of angler diary surveys to evaluate long-term changes in muskellunge populations on Lake of the Woods, Ontario. Environ. Biol. Fishes 2007, 7, 71–83. [Google Scholar] [CrossRef]
Figure 1. Map of the study area with the highlighted rivers and streams where the anglers reported harvested eels and where fishery managers stocked the eel elvers and yellow eels over the years 2005–2018. The study area is situated in the regions of Prague (gray color) and central Bohemia (black color) in the Czech Republic (49.5°–50.5° N, 13.5°–15.5° E) in Central Europe.
Fishes 07 00042 g001
Figure 2. The European eel yields and stocking rates over the years 2005–2018 (with standard errors of means) in Prague and central Bohemia. The thick black line in the middle of each graph represents the year 2011, when the minimum legal angling size was increased from 45 cm to 50 cm (TL). The figure describes the changes in (a) the biomass of stocked eels, (b) the yield of eels, (c) the percentage of eel in the overall fish harvested, and (d) the size of eels harvested.
Fishes 07 00042 g002aFishes 07 00042 g002b
Table 1. The comparison of the important fishery, ecological, and biological parameters between the studied fishing sites (study group, n = 176) and the control group fishing sites (control group, n = 25). The data were collected by the Czech Fishing Union on 176 studied and 25 control rivers stretches over the years 2005–2018. They originate from angling logbooks that were submitted by recreational anglers.
ParameterStudy Group (Median)Control Group (Median)p-Value (Medians)F-Value (Variances)p-Value (Variances)
Eel yield (kg per effort)0.00070.00090.840.760.09
Regulated fishes yield (kg per effort)0.0270.0180.791.090.21
Non-regulated fishes yield (kg per effort)0.740.680.061.790.06
Angling effort (anglers per ha)53.861.20.120.620.11
Size of stocked eels (kg per eel)0.0020.0020.488.080.08
Stocking intensity of elver eels (kg per ha)0.180.140.311.270.18
Stocking intensity of yellow eels (kg per ha)0.310.260.071.960.23
Fish biomass (kg per ha)2152380.631.010.86
Nutrient intake (kg per ha)101890.771.030.64
Water discharge (m3 per s)31.629.50.730.940.38
Otter population density (n per ha)1.51.10.650.980.76
Cormorant population density (n per ha)4.24.70.191.030.66
Biomass of eels (kg per ha)0.380.430.061.950.07
River obstacles (n per 100 m)0.120.080.741.020.83
Bank to surface ratio5.15.40.680.990.92
The % of eel in the overall fish yield0.0060.0040.410.710.58
Table 2. A summary of angling visit rates, fish harvested, and fish stocked on the studied fishing sites. The data were collected by the Czech Fishing Union on 176 studied river and stream stretches over the years 2005–2018. They originate from angling logbooks that were submitted by recreational anglers. The parameters that were used in the models and in the statistical analyses are in bold.
Fisheries ParameterValue over Years 2005–2018
angling visits9,524,561.000
angling visits per hectare177.399
biomass of harvested fish (kg)6,451,829.000
biomass of harvested fish per hectare (kg)120.168
biomass of harvested fish per effort per hectare (kg)0.677
biomass of harvested European eel (kg)41,276.000
biomass of harvested European eel per hectare (kg)0.769
biomass of harvested European eel per effort per hectare (kg)0.004
median size of harvested fish (kg)1.010
median size of harvested European eel (kg)0.610
% of European eel in overall fish harvest0.006
biomass of stocked fish (kg)4,518,967.000
biomass of stocked fish per hectare (kg)84.168
biomass of stocked European eel (kg)26,288.000
biomass of stocked European eel per hectare (kg)0.490
% of European eel in overall biomass of stocked fish0.006
average size of stocked European eel (kg)0.002
% of fishing sites with harvest of European eel0.570
Table 3. The correlations between the yield of the European eel Anguilla anguilla and the studied fishery parameters. The data are (A) prior and (B) after increasing the legal angling size of the European eel from 45 cm to 50 cm TL. The data were collected by the Czech Fishing Union on 176 studied and 25 control river stretches over the years 2005–2018. They originate from angling logbooks that were submitted by recreational anglers.
(A)
Response VariableFixed VariablesEstimate95 CI: Low95 CI: UpSD (Slope)p-Value
Yield of European eel (kg per effort)(intercept)1.60 × 10⁻¹−7.04 × 10⁻²−4.78 × 10−26.43 × 10−20.01 *
Angling effort (anglers per ha)−8.15 × 10⁻⁶−1.12 × 10⁻⁵−5.86 × 10−64.46 × 10−60.03 *
Size of stocked eels (kg per eel)1.24 × 10−18.92 × 10−21.70 × 10−15.27 × 10−20.08
Stocking intensity of elver eels (kg per ha)1.56 × 10−41.13 × 10−42.14 × 10−41.32 × 10−40.38
Stocking intensity of yellow eels (kg per ha)1.36 × 10−59.81 × 10−61.87 × 10−51.12 × 10−50.26
Fish biomass (kg per ha)−2.96 × 10⁻⁴−4.02 × 10⁻⁴−2.13 × 10−41.76 × 10−40.09
Nutrient intake (kg per ha)−3.23 × 10⁻⁴−4.40 × 10⁻⁴−2.33 × 10−45.15 × 10−40.53
Water discharge (m3 per s)−3.08 × 10⁻⁵−4.18 × 10⁻⁵−2.22 × 10−56.37 × 10−40.51
Otter population density (n per ha)−8.01 × 10⁻³−1.09 × 10⁻²−5.77 × 10−36.95 × 10−30.25
Cormorant population density (n per ha)−4.14 × 10⁻³−5.63 × 10⁻³−2.98 × 10−32.45 × 10−30.09
Yield of non-regulated fishes (kg per effort)−6.40 × 10⁻⁶−8.71 × 10⁻⁶−4.61 × 10−62.49 × 10−40.09
Yield of regulated fishes (kg per effort)5.81 × 10−74.18 × 10−77.90 × 10−73.50 × 10−60.19
Biomass of eels (kg per ha)−7.22 × 10⁻⁶−9.82 × 10⁻⁶−5.20 × 10−61.11 × 10−50.52
River obstacles (n per 100 m)−5.10 × 10⁻⁴−6.94 × 10⁻⁴−3.67 × 10−41.41 × 10−30.72
Bank to surface ratio−2.23 × 10⁻⁶−3.04 × 10⁻⁶−1.61 × 10−63.10 × 10−40.31
(B)
Response VariableFixed VariablesEstimate95 CI: Low95 CI: UpSD (Slope)p-Value
Yield of European eel (kg per effort)(intercept)3.23 × 10−21.45 × 10−24.91 × 10−22.41 × 10−20.18
Angling effort (anglers per ha)−1.31 × 10⁻⁶−2.83 × 10−62.06 × 10−71.52 × 10−60.03 *
Size of stocked eels (kg per eel)2.87 × 10⁻¹−1.19 × 10+001.76 × 10+001.48 × 10+000.86
Stocking intensity of elver eels (kg per ha)−1.36 × 10⁻⁴−2.58 × 10⁻⁴−1.47 × 10−51.22 × 10−40.30
Stocking intensity of yellow eels (kg per ha)1.82 × 10−51.07 × 10−52.57 × 10−57.50 × 10−60.39
Fish biomass (kg per ha)−2.35 × 10⁻⁶−6.83 × 10−56.36 × 10−56.59 × 10−50.25
Nutrient intake (kg per ha)−2.40 × 10⁻⁴−4.32 × 10⁻⁴−4.79 × 10−51.92 × 10−40.21
Water discharge (m3 per s)6.51 × 10⁻⁵−1.75 × 10−43.05 × 10−42.40 × 10−40.79
Otter population density (n per ha)−2.11 × 10⁻³−4.74 × 10−35.18 × 10−42.63 × 10−30.42
Cormorant population density (n per ha)−3.13 × 10⁻⁴−1.25 × 10−36.21 × 10−49.34 × 10−40.74
Yield of non-regulated fishes (kg per effort)−2.90 × 10⁻⁵−1.68 × 10−41.10 × 10−41.39 × 10−40.71
Yield of regulated fishes (kg per effort)−8.58 × 10⁻⁷−2.27 × 10−65.56 × 10−71.41 × 10−60.54
Biomass of eels (kg per ha)−1.83 × 10⁻⁶−6.27 × 10−62.62 × 10−64.45 × 10−60.68
River obstacles (n per ha)−2.64 × 10⁻⁵−5.56 × 10−45.04 × 10−45.30 × 10−40.42
Bank to surface ratio1.03 × 10−49.15 × 10−51.14 × 10−41.15 × 10−50.37
(A) Additional information on the model: df = 1048, R2 = 0.10. Note: 95 CI = 95% confidence interval, DF = degrees of freedom. Regulated fishes are fish species for which the minimum angling size was increased. Non-regulated fishes are fish species for which the minimum angling size stayed constant. (B) Additional information on the model: df = 1408, R2 = 0.13. Note: 95 CI = 95% confidence interval, df = degrees of freedom. Regulated fishes are fish species for which the minimum angling size was increased. Non-regulated fishes are fish species for which the minimum angling size stayed constant. The * symbol in the p-values stands for statistically significant difference.
Table 4. The effect of time and the increased minimum legal angling size on the yield of the European eel Anguilla anguilla. The minimum legal angling size of the European eel was increased from 45 cm to 50 cm TL in 2011. The data were collected by the Czech Fishing Union on 176 studied and 25 control river stretches over the years 2005–2018. They originate from angling logbooks that were submitted by recreational anglers.
Response VariableFixed VariablesEstimate95 CI: Low95 CI: UpSD (Slope)p-Value
Yield of European eel (kg per effort)(intercept)2.08 × 10−21.24 × 10−22.70 × 10−28.11 × 10−3<0.01 *
time−1.52 × 10⁻²−2.03 × 10⁻²−9.30 × 10−39.07 × 10−30.04 *
management−2.12 × 10⁻²−2.70 × 10⁻²−1.24 × 10−21.70 × 10−2<0.01 *
time: management−2.57 × 10⁻²−3.38 × 10⁻²−1.55 × 10−21.80 × 10−2<0.01 *
Additional information on the model: df = 1408, R2 = 0.14. Note: 95 CI = 95% confidence interval, df = degrees of freedom. The variable “management” describes the increased minimum legal angling size for eel from 45 to 50 cm TL in 2011. The * symbol in the p-values stands for statistically significant difference.
Publisher’s Note: MDPI stays neutral with regard to jurisdictional claims in published maps and institutional affiliations.

