Article

Environmental Regulation, Technological Innovation and Development of Marine Fisheries—Evidence from Ten Coastal Regions in China

1
School of Economics, Ocean University of China, Qingdao 266100, China
2
Institute of Marine Development, Ocean University of China, Qingdao 266100, China
*
Author to whom correspondence should be addressed.
Current Affiliation: Heze Medical College, Heze 274000, China.
Fishes 2022, 7(1), 20; https://doi.org/10.3390/fishes7010020
Submission received: 22 October 2021 / Revised: 6 January 2022 / Accepted: 11 January 2022 / Published: 14 January 2022
(This article belongs to the Section Fishery Economics, Policy, and Management)

Abstract

:
This study aims to examine the relationship between environmental regulation, technological innovation and the development of China’s marine fisheries. We make a theoretical overview of the relationship between environmental regulation, technological innovation and the development of marine fisheries. Using data from 10 coastal regions of China, we calculate the comprehensive development level of China’s marine fisheries in each region from 2009 to 2018 through the entropy method. Then, we use a double logit model to analyze the effects of environmental regulation and technological innovation on the development level of China’s marine fisheries, and further test the mediating effect of technological innovation. The results show that environmental regulations have a “U-shaped” effect on the development of China’s marine fisheries. Moreover, technological innovation is crucial in promoting the development of China’s marine fisheries. Further, we identify the mediating role of technological innovation, that is, environmental regulation affects the development of China’s marine fisheries by influencing technological innovation. These findings offer theoretical support for the development of China’s marine fisheries.

1. Introduction

Marine fisheries, as the primary form of developing and utilizing marine biological resources, play an essential part in the ocean economy. Fishery resources provide 40% of the protein supply for two-thirds of the world’s population, making it a vital source of human food [1]. China has a vast coastline stretched for 32,000 km, out of which the mainland coastline amounts to 18,000 km, indicating her remarkable competitive strength in fishery resources. With the improvement of living standards and the upgrading of consumption demands of the Chinese people, marine fishery products, for their flavor and nutrition, have become an important supply of animal protein and healthier diets for the residents. However, in recent years, the expanded population and the advanced fishing techniques have accelerated the needs and the exploitation of marine resources in China. Moreover, ocean pollution has been aggravated, seriously impacting the richness of marine resources and the marine environment. The depletion of fishery resources and the deterioration of the eco-environment of certain coastal waters have become severe constraints holding up the sustainable development of marine fisheries. China’s marine fisheries urgently need to change from a high-speed growth stage to a high-quality development stage.
The key solution to the breakthrough of the bottlenecks in China’s fisheries is to make the construction of China’s marine fisheries meet the necessities of sustainable development which is about satisfying people’s needs, generating more economic benefits and ensuring the development of the ecologically-conscious civilization. Therefore, the participation of relevant departments in the construction of fisheries is not only the active response to the government’s call, but also the fundamental requirement of sustainable development of fisheries. Since the 13th Five-Year Plan, the government’s emphasis on the environment has gradually increased and the quality of the environment has improved significantly. Nevertheless, pollution remains the obstacle to economic development [2]. Environmental harmony is a crucial indicator to measure the development of fisheries while marine fisheries are inevitably affected by marine and atmospheric conditions. Under the new normal of economy, technological innovation, as the driver for economic growth, industrial upgrading and green development, has coordinately advanced with high-quality economic development [3]. The sustainable economic development depends on science and technology [4]. Therefore, it is important to study the mechanism of environmental regulations and technological innovations on the development of China’s marine fisheries, and explore how to promote its development coordinated with technological innovations in order to achieve the balance between environment and development.
Most scholars agree that there is a non-linear relationship between environmental regulation and economic development. Using GLS and GMM, Du et al. [5] investigated the effect mechanism of environmental regulation on the competitiveness of China’s green economy and found a “U-shaped” relationship between them. Zhang et al. [6] argued that when environmental regulation is at the right intensity, it could promote economic development and also effectively reduce pollution emissions. Sadik-Zada et al. [7] found that enhanced environmental regulation can significantly affect the transfer of pollution in the long term. By constructing PVAR model, He et al. [8] proved that environmental regulation has a significant positive effect on industrial structure optimization both in the long and short term, but there is an inverted “U-shaped” relationship between environmental regulation and economic development. Zha [9] argued that the current intensity of environmental regulation was to the left of the critical value. Thus, the enhancement of environmental regulation would significantly promote the ecological development of economy.
Existing studies agree that technological innovation significantly improves the level of economic development. He [10] argued that technological innovation has a significant enhancement effect on the quality and efficiency of economic growth, optimizing industrial structure while enhancing green economic development. Zhao et al. [11] used the manufacturing industry as the research subject and found that the manufacturing industry can promote the transformation and upgrading of industrial structure through technological innovation, and the promotion effect is significantly larger on countries with high economic development than that with low economic development level. Zhang et al. [12] argued that the innovation-driven strategy is an inevitable choice to accelerate the transformation of the economic development mode, maintain the healthy and sustainable development of China’s economy and lead the new normal of China’s economic development. Naveedullah et al. [13] argued that green innovation is easier to achieve in companies which actively seek to be environmentally friendly, and found that environmental regulation promotes the practice of green innovation. From the perspective of the crowding-out effect, Dong et al. [14] argued that an increase in the level of technological inputs could effectively improve the dependence of economic growth on resources.
Fisheries have always been a hot topic in research. Environmental regulation affects different ecosystems differently. Thus, in order to achieve sustainable livelihoods and conservation of fishery resources, fisheries management policies should be developed separately for different regions [15]. Incorporating appropriate environmental regulation policies in the fisheries management process will help to achieve a healthy and sustainable fisheries system [16]. Increased investment in the fisheries sector can mitigate the depletion of fisheries resources. Technology can improve the fisheries production and habitat quality by controlling the pollution of industrial wastes to affect the quality of water bodies [17]. Innovations in technology can increase the success of fishing and thus affect the selectivity of a given fishery [18]. Both used and upcoming technological innovations potentially affect the sustainability of fisheries [19].
It is worth noting that under the backdrop of progressive global ocean warming, the marine environment is threatening the development of marine fisheries. The relationship between carbon emissions and the development of marine fisheries has been studied by many scholars. The biological carbon pump, as the ultimate future home of atmospheric CO2, plays a crucial role in maintaining atmospheric CO2 concentrations [20], which has become one of the hot spots in marine carbon cycle research in the last 30 years [21]. However, this study focuses on the discussion of green fisheries, i.e., measuring the impact of pollutants such as nitrogen, phosphorus and industrial effluents on the development of marine fisheries. Carbon emissions are not within the scope of our study. In addition, marine animals can be divided into zooplankton, nekton and zoobenthos. In these three categories, Zooplankton are relatively nutrient-poor. Zoobenthos are not suitable for large-scale fishing due to their fragile ability to reproduce and repair themselves. Only nekton, which most creatures of this category have high food and medicinal values, can be used as industrial raw materials [22]. As most of the nekton inhabit the mesopelagic zone, this study focuses on the mesopelagic fisheries. Based on this, considering of the pre-existing studies and the availability of data, 10 coastal regions in China (excluding Shanghai, Hong Kong, Macau and Taiwan) are selected as the research objects of this paper. These 10 coastal regions can be divided into three regions, namely the Bohai Sea region, the Yangtze River Delta region and the Pan-Pearl River Delta region. The Bohai Sea region is a vast area surrounded by all of the Bohai Sea and part of the Yellow Sea coastal areas, which means in this study, Tianjin, Hebei, Liaoning and Shandong are designated to the Bohai Sea region. As an inner sea embraced by continent, Bohai Sea region, with high fertility rate and water quality, was conducive to fisheries management and production. However, in recent years, the development of marine fisheries in the Bohai Rim region has been seriously threatened by the sloppy development of the region and the irrational exploitation of fishery resources, resulting in the continuous deterioration of the ecological environment and other problems [23]. The Yangtze River Delta region, located in the downstream area of the Yangtze River in China, is bordered by the Yellow Sea and the East China Sea. In this study, Jiangsu and Zhejiang belong to the Yangtze River Delta region. Because of their proximity to shallow waters of the continental shelf, they are high-quality habitats for various fishery resources and production concentration areas for traditional fisheries. However, the value of high-quality fishery resources has gradually declined in recent years and the proportion of low-value fishery resources has increased [24]. Fujian, Guangdong, Guangxi and Hainan belong to the Pan-Pearl River Delta region. The region has formed a fishery industry layout with its own characteristics and advantages in the process, and there are obvious complementarities. However, this has also led to the problems of scattered fishery resource layout, depletion of high-quality fish resources and low technology [25]. In summary, the development of marine fisheries in China’s coastal regions is almost always constrained by problems such as resource depletion and environmental degradation.
In summary, existing studies have mainly focused on the impact of environmental regulation or technological innovation on the level of economic development. Few studies have explored the intrinsic links among all three. However, none of these studies have addressed the marine fisheries sector, and few studies have been conducted on the mechanisms through which environmental regulation and technological innovation influence the development of fisheries. The mechanism through which environmental regulation and technological innovation promote industrial structure reform and achieve the development of marine fisheries has become essential research in the field of the marine economy today. Therefore, this study extends the relationship between environmental regulation, technological innovation and economic development to the field of marine fisheries. It aims to explain the stages and differences in the development of marine fisheries among Chinese coastal regions. Based on existing research, we explore how environmental regulation affects the development of marine fisheries. Further, we use a mediation model to test whether technological innovation has a mediating role in this influence mechanism and whether it facilitates marine fisheries development. We hope that this study will provide theoretical support for the development of China’s marine fisheries.

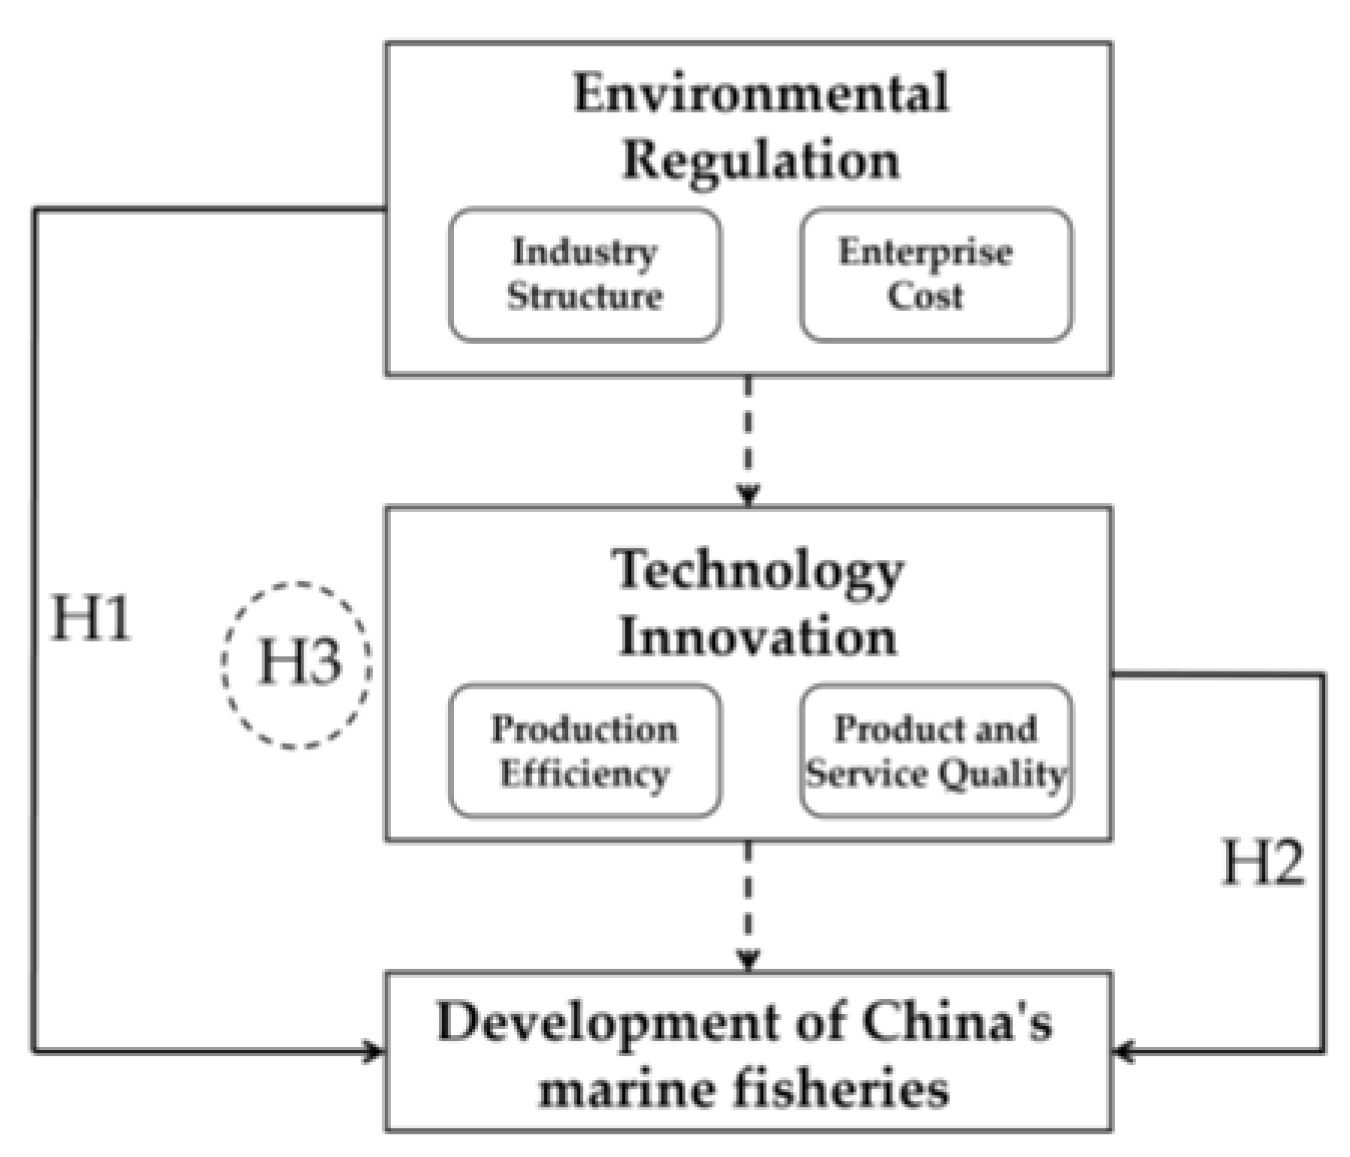
2. Theoretical Analysis and Research Hypothesis

2.1. Environmental Regulation and Development of Marine Fisheries

Environmental regulation impacts the development of marine fisheries by influencing their industrial structure. In the early stages of environmental regulation, as the intensity of environmental regulation enhanced, fishery enterprises with higher pollution are restricted by the environmental regulation due to its failure in timely industrial restructuring [26], resulting in a decrease in the growth rate of labor productivity, which inhibited the development of marine fisheries. In the later stages of environmental regulation, as pollution control strengthened, fishery enterprises have completed the transformation and upgrading of industrial structure. The negative externalities caused by environmental pollution will be gradually reduced [27], thus promoting the development of marine fisheries.
Environmental regulation impacts the development of marine fisheries by influencing the costs of enterprises. In the early stages of environmental regulation, enterprises spend much money on equipment for environmental pollution detection and wastewater treatment to meet environmental requirements, resulting in significantly high environmental costs, which sucks up the capital on technological innovation [28]. The “crowding-out effect” on technological innovation impedes the development of marine fisheries. As the intensity of environmental regulation continues to strengthen, the “Learning by Doing” effect allows enterprises to generate economies of scale in environmental management. Then the level of production technology and resource allocation efficiency increases accordingly. The benefits of technological innovation far outweigh the costs of environmental management inputs [29], thus promoting the development of marine fisheries.

2.2. Technological Innovation and Development of Marine Fisheries

Technological innovation impacts the development of marine fisheries by influencing production efficiency. The improvement in technology enables enterprises to have increasing access to production factors and use them more efficiently. Innovation-driven development promotes the transformation of the original production mode [30], changes the original production resource allocation mode, and reduces the unnecessary waste of production factor resources in production, processing, sales and management of marine fishery enterprises. The production efficiency of enterprises is improved, and thus the development of marine fisheries will be promoted.
Technological innovation impacts the development of marine fisheries by influencing the quality of products and services. “Science and technology are the primary productive forces.” Product replacements throughout history have invariably been the results of major technological breakthroughs. Technological innovation promotes speedy transfer of the latest production models and production technology in the fishing industry to the production process and then into the product, thereby improving the quality of the company’s outputs and services, forming new edges of upgraded products and services [31], and increasing the potential profit margins of enterprises by creating new economic growth drivers, thus promoting the development of marine fisheries.

2.3. The Mediating Effect of Technological Innovation

The impact of environmental regulation on the development of marine fisheries needs to be partially achieved through technological innovation. Environmental regulation policies impose new requirements on enterprises, which stimulates technological innovation [32]. Technological innovation provides a way to implement and realize environmental regulation policies. The environmental pollution reduction could be achieved by reallocating the existing resources to adjust the combination of factor inputs. The enhancement of production efficiency and the improvement of the quality of products and services could be realized by updating the original production model. Thus, promoting the development of marine fisheries.
Based on the above analysis of the mechanisms influencing environmental regulation, technological innovation and the development of China’s marine fisheries, the following three hypotheses are proposed.
Hypothesis 1.
The impact of environmental regulation on the development of China’s marine fisheries shows a “U-shaped” relationship of first inhibiting and then promoting.
Hypothesis 2.
Technological innovation has a significantly positive effect on the improvement in the development of China’s marine fisheries.
Hypothesis 3.
Technological innovation plays a partial mediating effect in the mechanism of environmental regulation’s impact on the development of marine fisheries.
According to the above three study hypotheses, the influence mechanism of environmental regulation and technological innovation on China’s marine fisheries is shown in Figure 1.

3. Measuring the Level of Development of China’s Marine Fisheries

3.1. Indicator System

At this stage, the core requirement of China’s economic development is to promote efficiency improvement, while the constraint to which is the structural problem. The initial success in economic structure optimization has been made in the past period. However, with the deterioration of the development environment at home and abroad, structural problems challenging economic growth have been gradually highlighted [33]. Therefore, marine fisheries development is a development that attaches great importance to qualitative growth, and development of good economic efficiency, coordinated industrial structure and eco-environmental friendliness, with the economy, society and ecological civilization each reinforcing the other. In this study, economic efficiency, industrial structure and ecological environment are used as the first-level indicators of China’s marine fisheries development evaluation system. Under the first-level indicator of economic efficiency, the fishery output value per fisherman, the average annual net income of fishermen, the fishery production value and the unit mariculture sea benefits are introduced as second-level indicators. Under the first-level indicator of industrial structure, the industrial upgrading index, the level of seawater product processing, the mariculture production as a proportion of total production, the proportion of recreational fishery output value to total fishery economic output value, the share of pelagic fishing in total fishing production, and the total exports of fishery products as a proportion of total fishery production are introduced as the second-level indicators. Under the first-level indicator of ecological environment, the economic losses caused by fishery disasters as a proportion of the total economic output of fisheries, the offshore water quality and the mariculture unit value-added equivalent pollutant emissions are introduced as the second-level indicators.
Based on the 13 indicators under the above three dimensions, an evaluation system for the development of China’s marine fisheries was established, as shown in Table 1.
Economic benefits can reflect the level of economic development of a nation or region, including economic efficiency and economic gains. The essence of economic benefits lies in economic efficiency, and to a certain extent, economic efficiency is the determinant of economic benefits [34]. In this study, the fishery output value per fisherman, the average annual net income of fishers, and the fishery production value are selected to measure the economic gains of the development of China’s marine fisheries. Moreover, the unit mariculture sea benefits reflect the economic efficiency of the development of China’s marine fisheries. The coordination and upgrading of industrial structure combination the rationalization and optimization of industrial structure. Through rationalization and optimization, the industrial structure promotes the improvement of the economic level of a country or region. At the same time, the rationalization of industrial structure promotes economic development more than its optimization [35]. In this study, the industrial upgrading index and the level of seawater product processing are selected to reflect the advanced industrial structure of China’s marine fisheries industry. The rationalization of China’s marine fisheries industry structure is reflected by the mariculture production as a proportion of total production, the proportion of recreational fishery output value to total fishery economic output value, the share of pelagic fishing in total fishing production, and the total exports of fishery products as a proportion of total fishery production.
The quality of the ecological environment is one of the factors affecting economic development. On the one hand, the environment carries the industrial waste generated by economic development. The pollutant flows into the sea, which leads to the deterioration of water quality, the deterioration of the living environment of fishery resources, and challenges the sustainable development of fisheries. On the other hand, the chaotic ecological order will restrict the efficiency and level of economic development. Water quality will affect the production efficiency of marine fisheries. With the same cost, the productivity of sea areas with poor water quality will be lower. In order to gain economic benefits, people will overfish and utilize resources, which will produce more pollution emissions. Therefore, the environment’s carrying capacity should be fully considered in the marine fisheries development planning [36]. In this study, the economic losses caused by fishery disasters as a proportion of the total economic output of fisheries, the offshore water quality and the mariculture unit value-added equivalent pollutant emissions are selected to reflect the environmental constraints confronted by the development of China’s marine fisheries.

3.2. Data and Method

The entropy method is an objective weighting method to determine the degree of dispersion based on the actual value of each indicator. The higher the degree of dispersion, the more significant the influence of the indicator on the overall evaluation. The results obtained from the entropy method are more reliable and accurate than those gained from the subjective weighting method. The secondary indicators selected in this study are all objective indicators so that the entropy method is chosen to quantify the level of development of China’s marine fisheries. Considering the availability of data, this study takes ten coastal regions (excluding Shanghai, Hong Kong, Macau and Taiwan) as the research subjects. It selects the relevant data from 2009 to 2018 as the basis of analysis of the study. All the data involved are extracted from the China Marine Statistical Yearbook (2009–2018), China Fisheries Yearbook (2009–2018) and the China Marine Ecological Environment Status Bulletin (2009–2018). The calculation process can be divided into seven steps.
Step1. Data Matrix
With m programs to be assessed and n evaluation indicators, the initial indicator data matrix is formed as X = ( x i j ) m × n :
X = [ x 11 x 1 m x n 1 x nm ]
where x ij is the data for the jth indicator of the ith program.
Step2. Standardization of Data
Since each index differs in magnitude, the standardization of each index is required to eliminate the influence of different magnitudes on the results.
For indicators with positive effects,
μ i j = x ij - min ( x 1 j , x 2 j , x nj ) max ( x 1 j , x 2 j , x nj ) min ( x 1 j , x 2 j , x nj )
For indicators with negative effects,
μ i j = max ( x 1 j , x 2 j , x nj ) - x ij max ( x 1 j , x 2 j , x nj ) min ( x 1 j , x 2 j , x nj )
where μ i j is the data for the jth indicator of the ith program after standardization.
Step3. Calculating the Weight Pij of the ith Program under the jth Indicator
P i j = μ ij i = 1 m μ ij
Step4. Calculating the Entropy Value ej of the jth Indicator
e j = k i = 1 m P i j ln ( P i j )
where k, is a constant; k = 1 ln m .
Step5. Calculation of Difference Coefficient gj
The difference coefficient of the indicator depends on the difference between the information entropy e j of the indicator and 1.
g j = 1 e j
Step6. Calculation of Evaluation Index Weights
The larger the index weight, the greater the degree it contributes to the evaluation results.
ω j = g j j = 1 n g j
Step7. Calculation of the Composite Score of Each Program
S = j = 1 n P i j · ω j
The larger the value of S , the better the evaluation result is. Finally, all values of S are compared to arrive at the evaluation results.

3.3. Measurement Results and Analysis

The comprehensive score of China’s marine fisheries in development level was calculated using the weighted average of the entropy method. Its mean value and ranking are shown in Table 2.

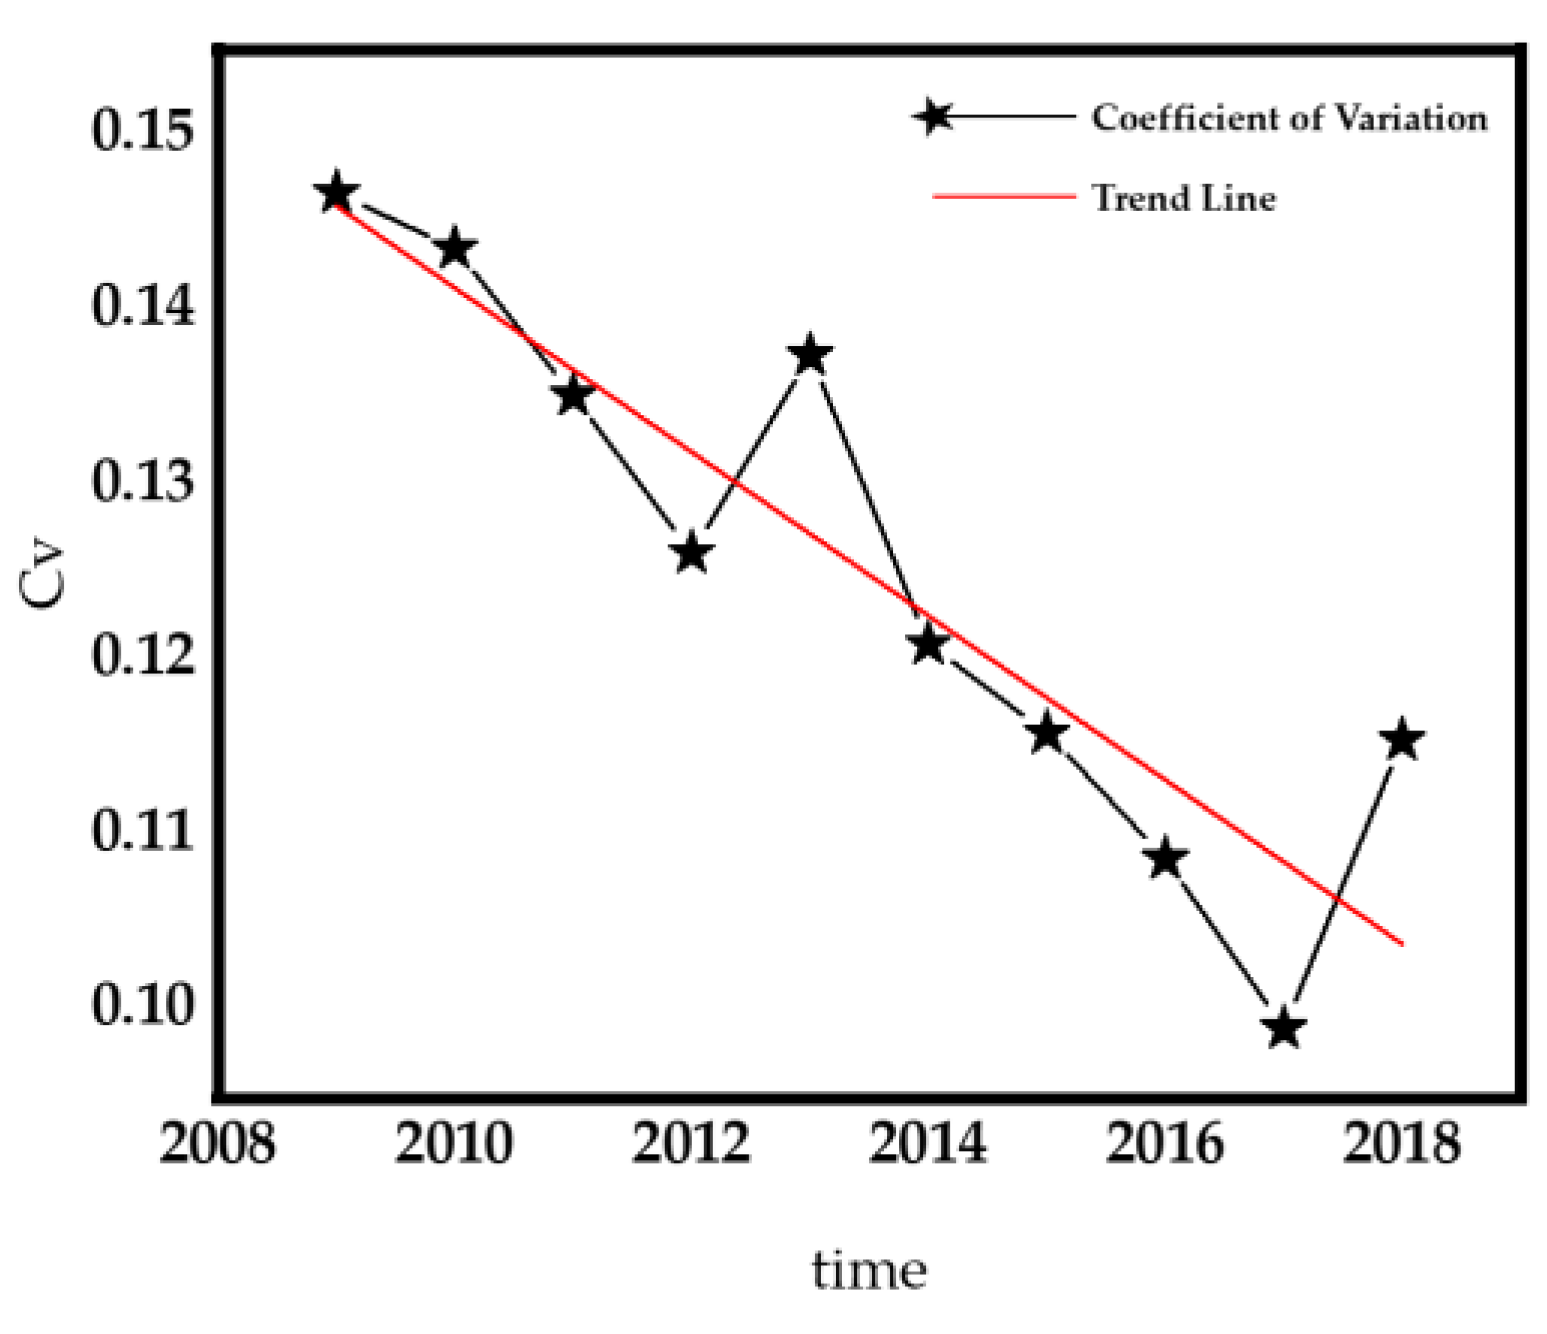
3.3.1. Stages Analysis of Development of China’s Marine Fisheries

As can be seen from Table 2, in the comprehensive ranking of China’s marine fisheries of development level, Shandong, Liaoning and Fujian were ranked in the top third, with the total scores of 0.4589, 0.4523 and 0.4030, respectively, all of which scored above 0.4 and were categorized into the first tier. Then, Guangdong, Tianjin, Guangxi and Zhejiang were also highly competitive in the field of development of China’s marine fisheries, with their total scores ranging between 0.3 and 0.4, all these regions were classified into the second tier. Next, Hainan, scored in the interval between 0.25 and 0.3, showed a minor competitive edge and was ranked into the third tier. Finally, Jiangsu and Hebei scored the lowest among all regions, with their overall total scores between 0.2 and 0.25, and were relatively less competitive, ranking in the fourth tier. The classification of the developmental stages of each region has been listed in Table S1.

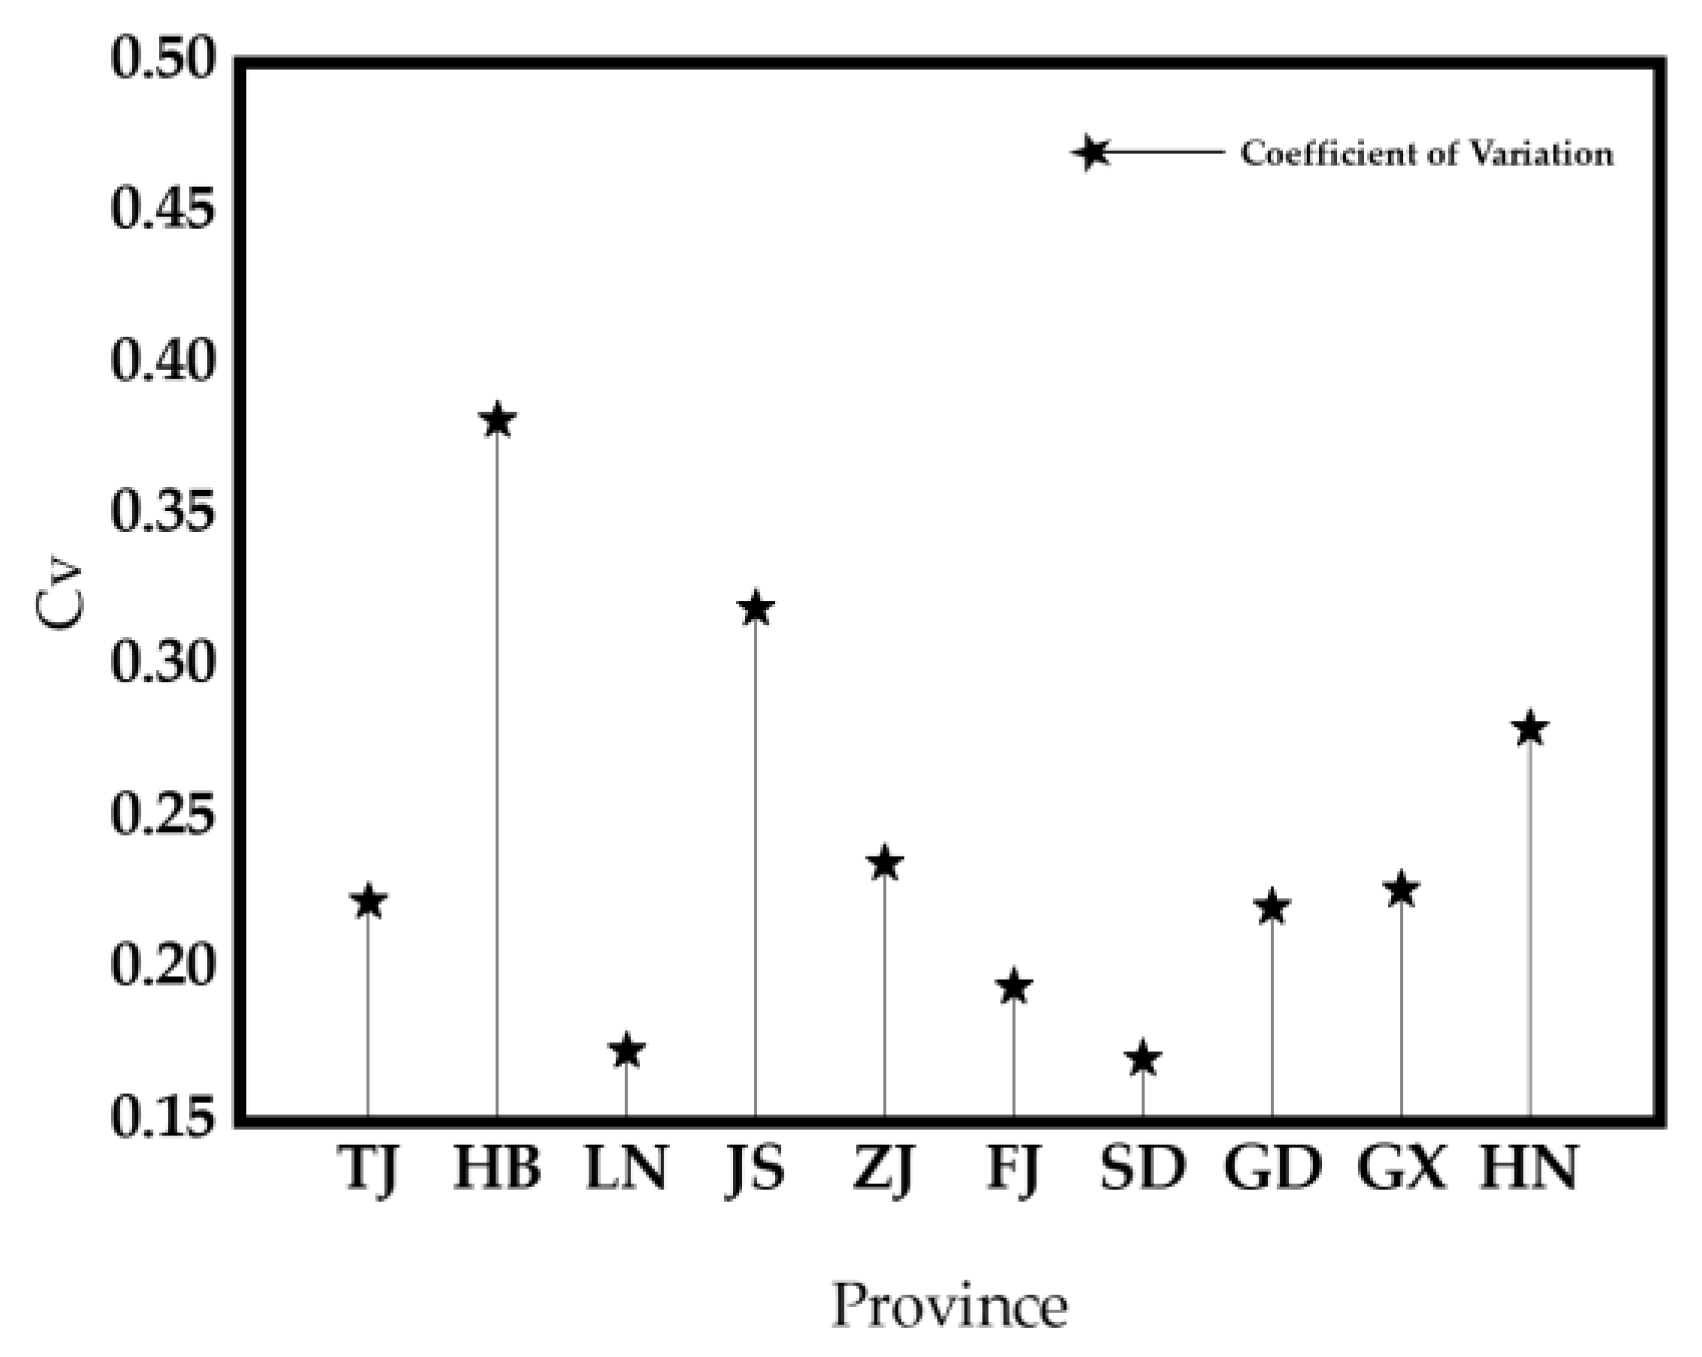
3.3.2. Differential Analysis of Development of China’s Marine Fisheries

To measure the variability of development of marine fisheries in China, the coefficient of variation CV of development of marine fisheries in each region was calculated by drawing on the method of Run et al. [37], as shown in Figure 2 and Figure 3. As can be seen from Figure 2, the smallest CV value was 0.1711 in Shandong Province, which indicated that the development of marine fisheries in Shandong Province has been relatively stable over the years. The CV value of Hebei was the largest (0.3819), indicating that the development of marine fisheries in Hebei Province fluctuated greatly in different years. As noted in the red trend line Figure 3, the overall CV of the development of marine fisheries on the time dimension in each region showed a decreasing trend. This means that the differences in the development level of marine fisheries in different regions show a narrowing trend.

4. Materials and Methods

4.1. Selection and Construction of Regression Models—Mediation Model

Both parametric and non-parametric approaches can discuss the factors influencing the development of marine fisheries. Currently, non-parametric methods are becoming increasingly popular in their ability to relax the functional form assumptions of unknown models and allow the data to determine the functions that fit the data. Standard parametric specifications may overlook this potential ability to reveal the structure of the data. However, based on existing research, this study presents a non-linear hypothesis on the relationship between environmental regulation and marine fisheries development by analyzing of theoretical mechanisms. Despite the growing acceptance of non-parametric methods among scholars, parametric methods remain the most logical research approach when studying non-linear relationships between variables. Therefore, this paper has chosen to use parametric methods to study the non-linear relationship between environmental regulation and fisheries development.
In this study, a mediating effect model [38] is used to investigate the direct effect of environmental regulation (explanatory variable) on the level of quality development of China’s marine fisheries (response variable) and whether technological innovation (mediating variable) mediates the indirect effect of environmental regulation on the level of development of China’s marine fisheries. In a mediating effect model which studies the effect of explanatory variable x on response variable Y through the variable m, if both the direct effect of x on Y and the indirect effect of x on Y mediated by m are both significant, then m is called the mediating variable of the effect of x on Y. Meanwhile, in this study, the regression model is logarithmically varied to form a double-logarithmic model.
The specific regression models are given in Equations (1)–(3).
lnY = c 0 + α 1 ln r e g + α 2 ln r e g 2 + α 3 ln m a r k e t + α 4 ln g d p + e 1
lnTI = c 1 + β 1 ln r e g + β 2 ln r e g 2 + β 3 ln m a r k e t + β 4 ln g d p + e 2
lnY = c 3 + γ 1 ln r e g + γ 2 ln r e g 2 + γ 3 ln m a r k e t + γ 4 ln g d p + γ 5 ln T I + e 3
In the equations, α 1 denotes the total effect of the explanatory variable of environmental regulation (reg) on the response variable of China’s marine fisheries development level (Y), β 1 * γ 4 denotes the mediating effect of the explanatory variable transmitted through the mediating variable technological innovation (TI). γ 1 denotes the direct effect of the explanatory variable reg. The above coefficients satisfy the formula α 1 = γ 1 + β 1 * γ 4 , t which means that the effect of environmental regulation on the development of marine fisheries in China is equal to the sum of the direct effect produced by itself and the indirect effect produced through the mediating variable. In addition, to verify the existence and magnitude of the mediating effect, the significance of the mediating effect will be calculated from γ 1   in Equation (3).
If γ 1 is not significant after adding the mediating effect, it means that the mediating effect is a total mediating effect, that is, all the effects of the explanatory variable reg on the response variable Y are realized through the mediating variable TI. If γ 1 is still significant, it means that the mediating effect is a partial mediating effect, that is, the effect of the explanatory variable reg on the response variable Y is partially realized through the mediating variable TI.

4.2. Variables and Data

4.2.1. Response Variable

The level of development of China’s marine fisheries (Y). The above calculated composite score is selected as a variable to measure the level of development of marine fisheries in China.

4.2.2. Core Explanatory Variable

Environmental regulation (reg). The methods adopted in the current studies to measure the level of environmental regulation mainly contain the following: (1) The number of environmental regulations method [39], which uses the number of environmental regulations and standards promulgated by the government as a proxy variable to indicate the level of environmental regulation. (2) The environmental pollutant emissions method [40], which uses pollutant emissions divided by the gross industrial output of each industry to measure the relative importance of environmental management in each region. (3) The pollutant removal rate method [41], which uses the amount of pollutant removed divided by the sum of the pollutant removed and emissions to measure the environmental management capacity. (4) The pollution control investment method [42], which uses the proportion of annual industrial pollution control investment to regional GDP (Gross Domestic Product) to denote the environmental regulation intensity in that region. In this study, since the construction of China’s marine fisheries is strongly associated with the marine ecological environment, the vast majority of the “three wastes” (waste water, gas and residue) discharged into the ocean is waste water. Therefore, the environmental regulation intensity index of this study is determined by making corrections on the basis of the existing environmental regulation index, denoted as regit = Wit/TWit. Where, regit is the environmental regulation intensity of region i in year t, Wit is the completed investment in wastewater treatment, and TWit is the total completed investment in the treatment of three wastes. Larger regit means that the government attaches more importance to wastewater treatment in environmental management. Therefore, the intensity of environmental regulations faced by fishing enterprises in conducting their production and operation will be greater. In addition, the quadratic term for this variable (reg2) is introduced to improve the reliability of the regression results.

4.2.3. Mediating Variable

Technological innovation (TI). The patent is an important indicator for measuring technological innovation. Enterprises transform their achievements into patents through technological innovation, and obtain economic benefits through their effective use, which expands the scale of R&D (Research and Development) investment and innovation in fisheries. Therefore, in this study, the number of fishing, aquaculture and fish processing patents of each region over the years was collected from the State Intellectual Property Office website to measure the extent of regional fisheries technology innovation.

4.2.4. Control Variables

In addition to the core explanatory variables, the macro factors encountered in the development of China’s marine fisheries should be considered to reduce the bias in the regression results due to the omission of variables. In this study, we mainly consider two aspects, i.e., each region’s business environment and economic development level, measured by the regional marketability index and regional GDP per capita, respectively. The regional marketization index (market) is used to measure the level and extent of regional marketization development. This study employs the marketization index constructed by Fan and Wang to reflect the marketization process of each region in China, the overall progress of the marketization reform and the progress of different aspects are evaluated. The regional GDP per capita (gdp) is obtained by dividing the total value of regional GDP by the region’s total population at the end of the year.
Considering the perfection process of the fisheries system and the availability of data, this study uses the variable data of ten coastal regions (excluding Shanghai, Hong Kong, Macau, and Taiwan) from 2009 to 2018 to constitute the panel data of this study. Among them, the environmental regulation index data and GDP per capita are extracted from the China Statistical Yearbook (2009–2018). The numbers of patents are obtained from the website of the State Intellectual Property Office, and the marketization index is from Fan and Wang’s China Marketization Index Report by Provinces (2009–2018). The specific descriptive statistics for each variable are shown in Table 3. In the data in this study, from 2009 to 2018, the highest level of development of marine fisheries was 0.6237 and the lowest was 0.1696, which belong to areas in the first and fourth tiers of development, respectively, indicating that were development differences between regions at different stages of development. The highest values of the environmental regulation and technological innovation variables are 0.7126 and 176, and the lowest values are 0.00056767 and 0, indicating that there are significant differences in the intensity of environmental regulation and the level of technological innovation in different regions.

5. Results

5.1. Heteroskedasticity Test

Considering that the heteroskedasticity of the data would affect the accuracy of the results, the BP test was first conducted to test the heteroskedasticity of the sample data. The test results are shown in Table 4.
The original hypothesis of the BP test was the homoscedasticity hypothesis. We found that the p-values of all three models were larger than 0. That is, we could not reject the original hypothesis that there was no between-group heteroscedasticity in the sample data.

5.2. Empirical Results

The test for the mediating effect of technological innovation usually consists of three steps: (1) Verifying the relationship between the Y and the reg, and the results should be significant. (2) Verifying the relationship between the reg and TI, and the results should be significant. (3) Taking the TI into the regression equation to verify the relationship between the Y and the reg. If the result is insignificant, it indicates a total mediating effect, and if it is significant, it signifies a partial mediating effect. The specific regression results are presented in Table 5.
The results in column (1) of Table 5 show that the primary coefficient of environmental regulation indicator is negative at 5% significance level, and the secondary coefficient is positive at 5% significance level. That is, there is a significant “U-shaped” relationship between environmental regulation and the level of quality development of China’s marine fisheries at 5% statistical significance. This result verifies Hypothesis 1 (H1).
The results in column (2) of Table 5 show that the estimated coefficient of the environmental regulation indicator is 1.9243, which is significantly different from 0 at the 10% level.
The results in column (3) of Table 5 show that the mediating variable of technological innovation’s estimated coefficient is 0.0238, which is significant at the 1% level. After adding the mediating variable, the relationship between environmental regulation and the level of quality development of China’s marine fisheries still shows a “U-shape”, and the estimated coefficients of the primary and secondary terms are significantly different from 0 at the 1% level. This result verifies Hypotheses 2 (H2) and 3 (H3).

5.3. Robustness Tests

5.3.1. Replacing Variable

This study adopts the method of changing the variable to test the robustness of the model. Here, the regression is conducted again by replacing the number of patents of aquaculture, fishing, and aquatic processing with the number of the aquatic technology promotion agency as the intermediary variable. The number of aquatic technology promotion institutions was obtained from the China Fisheries Yearbook (2009–2018). The regression results after the variable replacement are shown in Table 6 Robustness test (I).
From the regression results, it can be seen that the characteristics of the estimated coefficients after the replacement of the mediating variables are basically consistent with the Table 6, indicating that the findings of this study have high reliability. That is, the environmental legal indicators and the level of quality development of China’s marine fisheries are in a statistically significant “U-shaped” relationship at 1%. Meanwhile, the mediating variable of technological innovation plays a partial mediating effect, and the explanatory variable of environmental regulation at the level of quality development of China’s marine fisheries is partly achieved through technological innovation.

5.3.2. Adding Variable

In this study, a new control variable master (the number of marine professional master’s graduates by region) is added to the model. The data source is the China Marine Statistical Yearbook (2009–2018). The new regression results are presented in Table 6 Robustness test (II).
The empirical results persisted after adding a control variable. Among them, the significance of the impact of environmental regulation on the mediating variable is enhanced. The significance of the estimated coefficients of other variables is basically consistent with that in Table 5, and the magnitude of the estimated coefficients in column (3) is very close to that in Table 5.
In summary, the regression results from the Table 6 show that the findings of this study are robust.

6. Discussion

According to our study, there is a significant “U-shaped” relationship between the environmental regulation and the level of development of China’s marine fisheries. As the intensity of environmental regulation increases, the level of development of China’s marine fisheries tends to increase first and then decrease. In the short term, when companies are suddenly confronted by environmental regulatory policies, the reaction time to adapt to those policies. This includes both the upgrading of industrial structure to meet pollution emission standards and the improvement of production efficiency to compensate for significant environmental costs. The upgrading of industrial structure and the improvement of production efficiency will have a continuous positive effect on enterprises, promoting the development of marine fisheries in the long run. Among the control variables, the estimated coefficient of GDP per capita is also positive and statistically significant at the upper 1% level. This is in line with reality because the more developed the regional economy is, the higher the people’s demand for living standards will be. Furthermore, the demand for fishery products will be more diversified. This will facilitate the upgrading of marine fisheries in the region, thereby contributing to the development of marine fisheries. Technological innovation allows enterprises to improve their production technology and generate more economic benefits at the same cost, which provides financial support for the development of fisheries. The improvement of technology will in turn increase the added value of products and meet the demand for high-end products. After adding the mediating variable in the model, it remains consistent with our hypothesis. That is, the effect of environmental regulation at the level of quality development of China’s marine fisheries is partially realized through the technological innovation. Environmental regulation policies impose new requirements on enterprises, which stimulate the need for technological innovation. Technological innovation provides the means to improve the original production model, and fuels production efficiency and the quality of products and services, thus contributing to the development of marine fisheries. The estimated coefficient of environmental regulation variable decreases as compared to model A, indicating that when the intensity of environmental regulation is low, technological innovation without a focus on industrial restructuring can make the inhibiting effect of environmental regulations on marine fisheries development stronger. In contrast, the estimated coefficient of the quadratic term of the environmental regulation variable increases as compared to model A. It indicates that at higher levels of environmental regulation, technological innovation by enterprises with the completion of industrial restructuring can make environmental regulations play a more significant role in promoting the development of fisheries.

7. Conclusions

This study examines the relationship among environmental regulation, technological innovation and the development of marine fisheries in China. To this end, it selects annual data from 2009 to 2018 for 10 coastal regions in China. Through the entropy value method, the level of development of marine fisheries in China’s coastal regions was comprehensively evaluated. The impact of environmental regulation and technological innovation on the development of China’s marine fisheries is empirically analyzed by constructing a double logit model. We found that, at the 95% significance level, the impact of environmental regulations on the development of China’s marine fisheries follows a “U-shaped” pattern, that is, as the level of environmental regulations increases, they first inhibit and then promote development of China’s marine fisheries. At the 90% significance level, the coefficient of technological innovation is positive, that is, it plays a significant role in promoting the development of China’s marine fisheries. A mediating effects model is introduced to investigate the role played by technological innovation in the mechanism by which environmental regulation affects the development of marine fisheries. It is found that technological innovation has a partial mediating effect in this mechanism, and the effect of environmental regulation on the level of development of China’s marine fisheries is partly achieved through technological innovation. When the intensity of environmental regulation is low, technological innovation can make the inhibitory effect of environmental regulation on marine fisheries development stronger, while when the intensity of environmental regulation is high, technological innovation will make environmental regulation a more significant contributor to fisheries development. Both replacement and additional variables are used in order to verify the robustness of the results and the tests validate that our empirical results are robust. These findings provide important insights for the construction of marine fisheries in China. Of course, this article also has some shortcomings. Due to limitations in data accessibility, this paper only considers the impact of only pollutants such as nitrogen and phosphorus on the development of marine fisheries. It does not take carbon emissions into account. With the gradual warming of the global ocean, biological carbon pumping is gradually becoming the focus of marine environmental research. Therefore, it is hoped that further data can be added to develop a more detailed study on the development of low-carbon fisheries. In addition, this study uses a parametric approach to validate the relationship between environmental regulation and marine fisheries development. However, some scholars have pointed out the advantages of non-parametric methods [43], so the results can be further validated using non-parametric methods in the future. We also hope that our research will provide theoretical basis and a new perspective for the construction of marine fisheries in China.

Supplementary Materials

The following supporting information can be downloaded at: https://www.mdpi.com/article/10.3390/fishes7010020/s1, Table S1: Development stage of China’s marine fisheries.

Author Contributions

Y.L. proposed the research concept and significance, including data sorting, experiment completion, and paper writing. J.K. collected the data and wrote an outline. J.J. conducted verification, writing—review, and supervision. All authors have read and agreed to the published version of the manuscript.

Funding

This research was funded by the National Natural Science Foundation of China (No.71873127, No.71573238), the National Social Science Foundation of China (No.19VHQ007), and Major Project of Social Science Planning of Shandong Province (No. 20AWTJ19).

Institutional Review Board Statement

Not applicable.

Informed Consent Statement

Not applicable.

Data Availability Statement

Not applicable.

Conflicts of Interest

The authors declare no conflict of interest.

References

  1. Ding, Q.; Chen., X.J.; Li, G. Catch statistics and the sustainable utilization of northwest pacific ocean fishery resources. Resour. Sci. 2013, 35, 2032–2040. [Google Scholar]
  2. Chen, S.Y.; Chen, D.K. Air pollution, government regulations and high-quality economic development. Econ. Res. J. 2018, 53, 20–34. [Google Scholar]
  3. Hua, J.; Hu, J.X. Analysis on the coupling relationship between technology innovation and high-quality economic development. Sci. Technol. Prog. Policy 2019, 36, 19–27. [Google Scholar]
  4. Gu, S.Z.; Wu, H.J.; Wu, Q.Q.; Yu, X.W. Innovation-driven and core technology breakthrough: The cornerstone of high-quality development. Chin. Soft Sci. 2018, 10, 9–18. [Google Scholar]
  5. Du, L.Z.; Zhao, Y.H.; Tao, K.T.; Lin, W.F. Compound Effects of Environmental Regulation and Governance Transformation in Enhancing Green Competitiveness. Econ. Res. J. 2019, 54, 106–120. [Google Scholar]
  6. Zhang, C.Y.; Guo, Y.Q. Can Pollution-intensive Industry Transfer Achieve Win-win Development in Economy and Environment? From the Perspective of Environmental Regulation. J. Financ. Econ. 2015, 41, 96–108. [Google Scholar] [CrossRef]
  7. Sadik-Zada, E.R.; Ferrari, M. Environmental Policy Stringency, Technical Progress and Pollution Haven Hypothesis. Sustainability 2020, 12, 3880. [Google Scholar] [CrossRef]
  8. He, W.H.; Zhang, Y.J. Environmental regulation, industrial restructuring and high-quality economic development: Ail analysis based on PVAR model of 11 provinces and cities in the Yangtze River economic belt. Stat. Inf. Forum 2021, 36, 21–29. [Google Scholar]
  9. Zha, J.P. Empirical Study of Environmental Regulation and Industrial Economic Growth Pattern: An Economic Growth Decomposition Perspective. Ind. Econ. Res. 2015, 3, 92–101. [Google Scholar] [CrossRef]
  10. He, X.B. Technological Innovation and Quality of Chinese Economic Growth: An Empirical Analysis Based on Provincial Panel Data. Forum. Sci. Technol. China 2019, 10, 24–32. [Google Scholar] [CrossRef]
  11. Hu, Z.L.; Xia, Q.; Sun, G.Y. Servitization, Technological Innovation and Industrial Structure Upgrading of Manufacturing Industry—Multinational Empirical Research Based on the Data of WIOD. Int. Econ. Trade Res. 2017, 33, 4–21. [Google Scholar] [CrossRef]
  12. Zhang, W.G.; Ji, L.; Laurette, D. Convergence innovation and its significance for China’s innovation-driven development. Manag. World 2016, 6, 1–9. [Google Scholar] [CrossRef]
  13. Naveedullah, M.; Lin, L.F. How Do Proactive Environmental Strategies Affect Green Innovation? The Moderating Role of Environmental Regulations and Firm Performance. Int. J. Environ. Res. Public Health 2021, 18, 9083. [Google Scholar] [CrossRef]
  14. Dong, L.H.; Yan, T.H.; Zou, Q. Institutional quality, extrusion effects of technology innovation and resource curse based on the empirical analysis of China’s provincial panel data. Science. Res. Manag. 2015, 36, 88–95. [Google Scholar] [CrossRef]
  15. Chevallier, A. Diversity of small-scale fisheries in Chile: Environmental patterns and biogeography can inform fisheries management. Environ. Sci. Policy 2021, 124, 33–44. [Google Scholar] [CrossRef]
  16. Guo, C.B. Incorporating environmental forcing in developing ecosystem-based fisheries management strategies. ICES J. Mar. Sci. 2020, 77, 500–514. [Google Scholar] [CrossRef]
  17. Haryadi, J. Fisheries technology innovation supports the Citarum Harum program. IOP Conf. Ser. Earth Environ. Sci. 2020, 521, 012010. [Google Scholar] [CrossRef]
  18. Eigaard, O.R.; Marchal, P.; Gislason, H.; Rijnsdorp, A.D. Technological development and fisheries management. Rev. Fish. Sci. Aquac. 2014, 22, 156–174. [Google Scholar] [CrossRef]
  19. Elmer, L.K.; Kelly, L.A.; Rivest, S.; Steell, S.C. Twardek. W.M.; Danylchuk. A.J. Angling into the future: Ten commandments for recreational fisheries science, management, and stewardship in a good Anthropocene. Environ. Manag 2017, 60, 165–175. [Google Scholar] [CrossRef]
  20. Sun, J.; Li, X.Q.; Chen, J.F.; Guo, S.J. Progress in oceanic biological pump. Haiyang Xuebao 2016, 38, 1–21. [Google Scholar] [CrossRef]
  21. Ducklow, H.W.; Steinberg, D.K.; Buesseler, K.O. Upper Ocean Carbon Export and the Biological Pump. Oceanography 2001, 14, 50–58. [Google Scholar] [CrossRef]
  22. Yin, Y.; Yang, H.Y.; Ping, Y. Spatial and temporal evolution of aquaculture in the Yangtze River Delta Region from 2008 to 2017. Chin. Fish. Econ. 2021, 39, 25–34. [Google Scholar]
  23. Sun, C.Z.; Yu, G.H.; Wang, Z.Y.; Liu, K.; Liu, G.C. Marine Carrying Capacity Assessment and Spatio-temporal Analysis in the Bohai Sea Ring Area, China. Sci. Geogr. Sin. 2014, 34, 513–521. [Google Scholar]
  24. Chen, H.L. Pan-Pearl River Delta Regional Fisheries Economic Cooperation Study. China Fish. 2010, 12, 22–24. [Google Scholar]
  25. Xu, G.Z. Nekton Marine. Sciences 1984, 1, 49. [Google Scholar]
  26. Yuan, Y.J.; Xie, R.H. Research on the Effect of Environmental Regulation to Industrial Restructuring—Empirical Test Based on Provincial Panel Data in China. Chin. Ind. Econ. 2014, 8, 57–69. [Google Scholar] [CrossRef]
  27. Cheng, Y.; Ren, J.L.; Chen, Y.B.; Xu, C.L. Spatial evolution and driving mechanism of China’s environmental regulation efficiency. Geogr. Res. 2016, 35, 123–136. [Google Scholar] [CrossRef]
  28. Tong, J.; Liu, W.; Xue, J. Environmental Regulation, Factor Input Structure and Industrial Transformation. Econ. Res. J. 2016, 51, 43–57. [Google Scholar]
  29. Long, X.N.; Wan, W. Environmental Regulation, Corporate Profit Margins and Compliance Cost Heterogeneity of Different Scale Enterprises. Chin. Ind. Econ. 2017, 06, 155–174. [Google Scholar] [CrossRef]
  30. Shi, L.L.; Zhao, J. Environmental regulation, technological innovation and industrial structure upgrading. Sci. Res. Manag. 2019, 6, 3–16. [Google Scholar] [CrossRef]
  31. Zhu, S.J.; Xie, X.; Duan, F. Manufacturing Servitization, Technological Innovation and Quality of Export Products. Econ. Rev. 2019, 6, 3–16. [Google Scholar] [CrossRef]
  32. Yuan, Y.J.; Chen, Z. Environmental regulation, green technology innovation and the transformation and upgrading of China’s manufacturing industry. Stud. Sci. Sci. 2019, 37, 1902–1911. [Google Scholar] [CrossRef]
  33. Chao, X.J.; Xue, Z.X. Research on the theoretical logic and practical mechanism of high quality of china’s economic development in the new era. J. Northwest Univ. (Philos. Soc. Sci. Ed.) 2018, 48, 12–22. [Google Scholar] [CrossRef]
  34. Liu, T.; Huang, Q. Economic efficiency versus economic effectiveness. Shanghai Stat. 1997, 10, 18–19. [Google Scholar]
  35. Cha, H.W.; Zheng, T.T. Resource dependence, industrial structure and economic development efficiency—analysis based on mediated transmission model. Res. Dev. 2018, 6, 14–22. [Google Scholar] [CrossRef]
  36. Liu, T.C. Examining the coupling degree and interactive stress between ecological environment and economic development in the yellow river basin. Yellow River 2021, 43, 13–18. [Google Scholar] [CrossRef]
  37. Run, J.Y.; Sun, Q.L. Temporal and spatial evolution of county economic difference since the establishment of Chongqing municipality. J. Southwest Univ. (Nat. Sci.) 2020, 42, 106–116. [Google Scholar] [CrossRef]
  38. Sodik, D.P.; Istiqomah, I. Economic Growth and Poverty: The Mediating Effect of Employment. JEJAK J. Ekon. Dan Kebijak. 2019, 12, 238–252. [Google Scholar] [CrossRef]
  39. Li, Y.Y.; Shen, K.R. Emission reduction effect of China’s pollution control policies—An empirical analysis based on inter-provincial industrial pollution data. Manag. World 2008, 07, 7–17. [Google Scholar] [CrossRef]
  40. Fahad, S.; Bai, D.B.; Liu, L.C.; Baloch, Z.A. Heterogeneous impacts of environmental regulation on foreign direct investment: Do environmental regulation affect FDI decisions? Environ. Sci. Pollut. Res. 2021. [Google Scholar] [CrossRef] [PubMed]
  41. Wang, B.; Wu, Y.R.; Yan, P.F. Environmental efficiency and environmental total factor productivity growth in China’s regional economies. Econ. Res. J. 2010, 45, 95–109. [Google Scholar]
  42. Zhang, C.; Lu, Y.; Yu, T.S. The intensity of environmental regulation and technological progress of production. Econ. Res. J. 2011, 46, 113–124. [Google Scholar]
  43. Sadik-Zada, E.R.; Loewenstein, W. Drivers of CO2-Emissions in Fossil Fuel Abundant Settings: (Pooled) Mean Group and Nonparametric Panel Analyses. Energies 2020, 13, 3956. [Google Scholar] [CrossRef]
Figure 1. Influence mechanism.
Fishes 07 00020 g001
Figure 2. CV of regions.
Fishes 07 00020 g002
Figure 3. CV of the time dimension.
Fishes 07 00020 g003
Table 1. The evaluation system.
Target-LevelFirst-Level IndicatorsSecond-Level IndicatorsIndicator Properties
Evaluation system for development of China’s marine fisheriesEconomic BenefitsFishery output value per fisherman+
Average annual net income of fishermen+
Fishery production value+
Unit mariculture sea benefits+
Industrial StructureIndustrial upgrading index+
Level of seawater products processing+
Mariculture production as a proportion of total production+
The proportion of recreational fishery output value to total fishery economic output value+
Share of pelagic fishing in total fishing production+
Total exports of fishery products as a proportion of total fishery production+
Ecological EnvironmentEconomic losses caused by fishery disasters as a proportion of the total economic output of fisheries
Offshore water quality+
Mariculture unit value-added equivalent pollutant emissions
Note: “+” indicates that the indicator has a positive effect and “−” indicates that the indicator has a negative effect.
Table 2. Marine fisheries development level in China’s coastal regions.
Time2009201020112012201320142015201620172018MeanRanking
Provinces
Tianjin0.34790.34910.33650.39750.26650.37940.38740.37120.38880.29570.35205
Hebei0.17490.16960.17430.18950.18240.19620.19090.25640.29540.22650.205610
Liaoning0.39700.39900.40780.42970.40710.48330.46390.48640.62370.42460.45232
Jiangsu0.21500.17080.21420.20750.20570.24030.25900.26380.26310.41520.24559
Zhejiang0.26260.27040.29950.31260.30630.35040.37740.37480.42700.35030.33317
Fujian0.30920.33580.37750.40050.37510.39370.43400.44710.52810.42920.40303
Shandong0.33920.36380.40030.42300.39570.46430.48040.58740.62060.51430.45891
Guangdong0.31210.31600.31990.35150.33100.35460.35720.36610.38390.45900.35514
Guangxi0.29020.32150.32510.34930.32940.34060.39830.41820.44920.23810.34606
Hainan0.22950.24610.26930.28670.27300.28970.29840.31550.28810.30570.28028
Table 3. Descriptive statistics.
VariablesNameSymbolDescriptionMeanMaxMin
Response VariableThe level of development of marine fisheriesYthe score of marine fisheries development level measured by entropy method in this study0.34320.62370.1696
Explanatory VariableEnvironmental Regulationregcompleted investment in wastewater/completed investment in the treatment of the three wastes0.24840.71260.00056767
reg20.09480.50790.00000032
Control VariablesMarketization indexmarketthe marketization index constructed by Fan and Wang8.1210.834.98
GDP per capitagdptotal regional GDP/total population of the region4.678.971.46
Mediating VariableTechnology InnovationTIthe number of fishing, aquaculture and fish processing patents401760
Table 4. Heteroskedasticity test.
Model AModel BModel C
p-value0.70940.13230.9695
Table 5. Model regression results.
Explanatory VariablesModel AModel BModel C
Response Variables
lnYlnTIlnY
lnreg−0.1549 **
(0.0696)
1.9243 *
(1.0780)
−0.2007 ***
(0.0660)
lnreg20.0869 **
(0.0395)
−0.9753
(0.6129)
0.1101 ***
(0.0374)
lnmarket−0.0704
(0.0482)
1.6385 **
(0.7469)
−0.1094 **
(0.0462)
lngdp0.0743 ***
(0.0198)
1.2627 ***
(0.3068)
0.0442 **
(0.0200)
lnTI 0.0238 ***
(0.0062)
Intercept term0.3385 ***
(0.0870)
−2.7430 **
(1.3479)
0.4038 ***
(0.0830)
Note: *, **, *** indicates that the coefficient estimates are significantly non-zero at the 10%, 5%, and 1% levels, respectively, and the values in parentheses are standard errors.
Table 6. Robustness tests.
Robustness Test(I)Robustness Test (II)
Explanatory VariablesModel AModel BModel CModel AModel BModel C
Response Variables
lnYlnTIlnYlnYlnTIlnY
lnreg−0.1549 **
(0.0696)
3.4937 ***
(1.2289)
−0.2151 ***
(0.0697)
−0.1591 **
(0.0698)
2.0931 **
(1.0563)
−0.2148 ***
(0.0656)
lnreg20.0869 **
(0.0395)
−1.5358 **
(0.6987)
0.1133 ***
(0.0388)
0.0870 **
(0.0396)
−0.9798
(0.5991)
0.1131 ***
(0.0369)
lnmarket−0.0704
(0.0482)
−0.1195
(0.8515)
−0.0684
(0.0461)
−0.0728
(0.0483)
1.7326 **
(0.7313)
−0.1188 **
(0.0458)
lngdp0.0743 ***
(0.0198)
0.0764
(0.3497)
0.0730 **
(0.0190)
0.0752 ***
(0.0198)
1.2259 ***
(0.3003)
0.0426 **
(0.0198)
lnmaster −0.0047
(0.0054)
0.1904 **
(0.0818)
−0.0098 *
(0.0051)
lnTI 0.0172 ***
(0.0056)
0.0266 ***
(0.0063)
Intercept term0.3385 ***
(0.0870)
5.3659 ***
(1.5366)
0.2460 ***
(0.0885)
0.3646 ***
(0.0920)
−3.7932 ***
(1.3927)
0.4656 ***
(0.0880)
Note: *, **, *** indicates that the coefficient estimates are significantly non-zero at the 10%, 5%, and 1% levels, respectively, and the values in parentheses are standard errors.
Publisher’s Note: MDPI stays neutral with regard to jurisdictional claims in published maps and institutional affiliations.

