Article

Effect of Partial Soybean Replacement by Shrimp By-Products on the Productive and Economic Performances in African Catfish (Clarias lazera) Diets

by
Ibrahim S. Abu-Alya
1,*,
Yousef M. Alharbi
2,
Said I. Fathalla
1,
Ibrahim S. Zahran
3,
Saad M. Shousha
4,5 and
Hassan A. Abdel-Rahman
1,*
1
Department of Physiology, Faculty of Veterinary Medicine, University of Sadat City, Sadat City 32897, Egypt
2
Department of Veterinary Medicine, College of Agriculture and Veterinary Medicine, Qassim University, Buraydah 51452, Saudi Arabia
3
Department of Physiology, Faculty of Veterinary Medicine, Aswan University, Aswan 11731, Egypt
4
Department of Biomedical Sciences, College of Veterinary Medicine, King Faisal University, Al-Ahsa 31982, Saudi Arabia
5
Department of Physiology, Faculty of Veterinary Medicine, Benha University, Benha 13736, Egypt
*
Authors to whom correspondence should be addressed.
Fishes 2021, 6(4), 84; https://doi.org/10.3390/fishes6040084
Submission received: 15 November 2021 / Revised: 12 December 2021 / Accepted: 14 December 2021 / Published: 20 December 2021
(This article belongs to the Special Issue Fish Nutrition and Physiology)

Abstract

:
The present study was carried out to evaluate the effects of partial replacement of soybean with shrimp by-products (SBp) in African catfish (Clarias lazera) diets on productive (growth, digestibility, body composition, dressing yield, blood parameters, immunity) and economic performances. Therefore, 750 fingerlings (~20.0 g) were distributed into five groups of 150 fingerlings/group with three replicates (n = 50) per group. Group 1 was fed a basal diet, while G2 and G3 were fed diets containing 25% SBp (autoclaved and acid-treated, respectively) as soybean replacer for 12 weeks, while, in G4 and G5, SBp level was 50%. All growth and nutrient utilization parameters (body weight, Wg, ADG, PER, FCR, and digestibility), plasma proteins, and immunity significantly increased in G4 and G5. Anemia screening markers recorded insignificant differences between the tested groups and control one, whereas lipid markers of plasma and fish body decreased by autoclaved SBp and increased by acid-treated SBp. The African catfish body dry matter and crude protein percentages were enriched by the addition of SBp. Replacing the soybean meal decreases diet costs and diet costs/1 kg of weight gain. In conclusion, replacing soybean with SBp (especially 50% acid-treated) positively influenced productive and economic performances with friendly effects to avoid the environmental pollution by these wastes.

Graphical Abstract

1. Introduction

Consumption patterns in the globe today, as a result of a growing population, put a lot of strain on existing natural resources [1]. In recent years, meeting the protein requirements of the world’s rising population has been a major concern [2]. Catfish of the genus Clarias are extensively dispersed in Africa and Asia and have long been a source of aquaculture interest. Catfish are suitable for stocking in ponds and they tolerate low dissolved oxygen with high-quality protein (15% by weight) and low fat contents compared to other common fish species [3]. Because of its fast growth rate, disease resistance, and amenability to high-density culture, a variety of Clarias species and hybrids are produced [4]. African catfish is regarded as one of the greatest proper choices of fish farming alternatives to tilapia in Africa [4]. Catfish production yields from ponds may be larger than tilapia yields of the same area due to the ability to use low-grade feed of agricultural by-products [5]. Fishmeal yield is expected to drop in the future due to decreasing fishing resources, and as a result, the price of fishmeal is steadily rising [6]. Many developing countries will be unable to rely on fishmeal as a primary protein source in aquafeeds for a long time, particularly in intensive fish farming. Finding less expensive sources of protein that give adequate growth is beneficial to both diet manufacturers and aquaculture producers [7].
Fewer studies have been done on replacing soybean meal in most fish feeds, except a trial to use peanut meal as an alternative to soybean meal in Nile tilapia feeds [8]. Soybean meal protein is mostly utilized in African aquaculture diets for omnivorous fish species, such as tilapias (Oreochromis species) and catfish (Clarias species). Soybean meal is tasty and inexpensive compared to fishmeal, but, due to increased competition in poultry and livestock feeding, it has become more expensive and scarce [9]. In addition, antinutritional substances restrict the use of soybean meal in aquafeeds [10].
Meat and bone meal, blood meal, soybean meal, silk worm pupae, different oil cakes, cotton seed meal, chicken by-product meal, dry brewer’s yeast, hydrolyzed feather meal, maize gluten meal, and fish silage have all been explored as protein sources [11,12,13]. These proteins are referred to as secondary protein sources, and they are typically found in low concentrations in actual fish diets [14]. Apart from often unbalanced amino acid profiles, endogenous antinutritional factors, palatability, and feed acceptability are among the reasons that limit the utilization of alternative protein sources, particularly plant feedstuffs [15].
SBp meal has been identified as a possible animal protein source by increasing shrimp production from captures and farms [16] and could reduce environmental problems resulting from the improper dumping of inedible parts of shrimp waste meal due to its high fibee and ash contents [17]. Shrimp by-products have been found as a high-potential animal protein source, as well as a significant source of chitin [18]. Only 65% of the shrimp are edible, with the rest being dumped as waste (cephalothoraxes and exoskeleton). Polymers derived from this waste are promising substitutes of synthetic polymers for the production of bioplastics, which have biodegradable properties [19]. The ratio of shrimp collected to rejected species in shrimp capture fisheries ranges from 1:5 to 1:15, resulting in shrimpers discarding an estimated 15 million tons of undesired fish [20]. SBp meal generally contains 8–10% chitin, 30–40% protein, 0–14% lipids, and 10–20% calcium in dry weights [21]. The acid treatment processing technique of SBp meal using formic acid [22] or acetic acid [17] can reduce its ash and fiber contents, but increases its crude protein contents, while the autoclaving processing technique of SBp meal cannot affect its chemical composition except lowering its ether extract content [23]. These wastes have also been observed to diminish the digestibility of crustacean (Callianassa) meals in tilapia [24], decrease lipid absorption, and increase water content in the stools of Atlantic salmon [25].
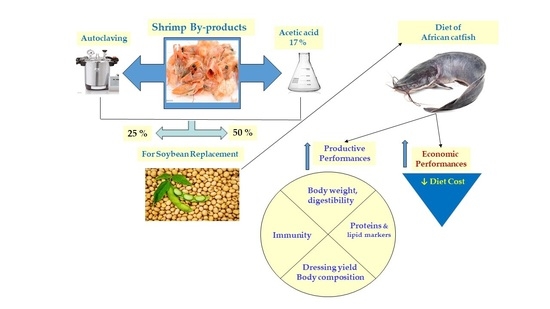
As far as we know, there is an information scarcity on the use of SBp meal as a soybean replacer in the African catfish (Clarias lazera) diet. This study assesses the dietary usage of SBp meal in African catfish through production and nutrient utilization parameters (growth, digestibility, body composition %, dressing %, blood parameters, and immunity) and economic indices.

2. Materials and Methods

2.1. The Experimental System

The experimental unit contained 15 fiberglass aquaria (0.33 m3) each. Each aquarium was connected from the top with a water supply valve, air supply valve, and drain opening, preventing water over flow. From the bottom of each aquarium, fish’s uneaten food and waste product were removed through the valve drain opening every week. The upper draining outlet connected with the waste tank (0.8 m3) and then combined with the biological filter unit (for removal of excessive ammonia). The filtered water returned to the fiberglass tanks through the supplying valves. Partial water change (about 25% of the total water capacity in the closed water circle) was carried out every 48 h.

2.2. Preparing the Shrimp by-product Meal

2.2.1. By Autoclaving

Shrimp by-products (heads, viscera, and shell) were obtained from EL-Obour market—Qulubiya—Egypt. The shrimp by-products were washed using tap water, air and sun dried, autoclaved, dried with forced hot air in a hot air oven (at 65 °C for 12 h), and, finally, the dried material was ground again, passed through a 0.8 mm diameter sieve, and stored in a refrigerator till use.

2.2.2. By Acid Treatment

The shrimp by-products were washed using tap water, air dried, ground in a mill, and manually homogenized to obtain a fine and homogeneous mixture. For the treatment of shrimp by-products, 17 percent acetic acid (v/v) was utilized [17]. Table 1 shows the chemical composition of fresh and treated SBp.

2.3. Preparing of the Diets

Five experimental diets were prepared. The process for the preparation of feeds was formulated according to NRC [26]. The ingredients and chemical analysis of each experimental diet are shown in Table 2 and Table 3.

2.4. Experimental Feeding Regime and Grouping

The fingerlings (n = 1000) of African catfish Clarias lazera (10.0 g) were obtained from the Egyptian fish center, El-Hamol, Kafr El-sheikh governorate, Egypt. The fish were acclimated to laboratory conditions for 3 weeks in 10 fiberglass aquaria of 0.33 m3 capacities (L = 80 cm, W = 52 cm, D = 80 cm) and fed with commercial floating diet containing 32% protein at a feeding regime of 3% of live fish weight. At the end of the acclimation period, the uniform-sized African catfish fingerlings (20.3 g) were randomly distributed into 15 aquaria, with three replicates for each group. Fifty fingerlings were stocked in each aquarium and the study was maintained for 12 weeks as follows: group 1 (G1) was fed diet 1 without replacing the soybean meal (basic diet) and was considered the control group. Group 2 (G2) and group 3 (G3) were fed diets 2 and 3, in which SBp (autoclaved and acid-treated) replaced 25% of the soybean meal inclusion level, respectively. Group 4 (G4) and group 5 (G5) were fed diets 4 and 5, in which SBp (autoclaved and acid-treated) replaced 50% of the soybean meal inclusion level, correspondingly. The prepared experimental diets were given six days/week, twice a day at 9:00 am and 3:00 pm at a feeding regime of 3% of live fish weight. One hour after feeding, the unconsumed feed was collected on a fine-mesh sieve, dried, and its weight subtracted from the food offered. The amount of feed was bi-weekly adjusted according to the change in body weight throughout the experimental period [27].

2.5. Determination of Growth Parameters

The African catfish fingerlings were weighted at zero-day, then weighted every two weeks (10 fingerlings/replicate, randomly) to adjust the amount of food given and to determine the following growth parameters (fish were deprived of food on the day of weighing and tanks were thoroughly scrubbed and rinsed with water). The weight gain, weight gain %, average daily gain, feed conversion ratio, and protein efficiency ratio of the fish were carried out according to the following equations:
  • Weight gain was calculated as follows [28]:
    Weight gain (g) = (Mean body weight (g) at t2) − (Mean body weight (g) at t1)
    where t1 is the first time and t2 is the second time.
  • Weight gain percentage was calculated according to [29]:
    Weight gain % = (Wg2 − Wg1/Wg1) × 100
    where, Wg1 is the mean fish weight at t1 and Wg2 is the mean fish weight at t2.
  • Average daily gain was stated as follows [30]:
    Average daily gain = W2 − W1/T
    where: W1 = fish weight (g) at t1; W2 = the fish weight at t2, and T = period in days (t2 − t1).
  • Feed conversion ratio was listed from the following equation [31]:
    Feed conversion ratio (FCR) = Feed intake (g)/weight gain (g)
  • Protein efficiency ratio was stated as follows [32]:
    Protein efficiency ratio (PER) = Weight gain (g)/Protein intake (g)

2.6. Water Quality

Parameters of the water quality (temperature, pH, and nitrites) were determined. Water temperatures were recorded daily in each tank using an alcohol thermometer suspended at 30 cm water depth (it ranges from 27.0 to 29 °C). Moreover, pH and nitrite were recorded using urine strips (DIGI-GNOST sg10, Digi lab, Germany) before and after water exchange (pH ranges from 7.0 to 8.0 and nitrites range from 0.15 to 0.24) throughout the experimental period.

2.7. Blood Collection

Heparinized blood samples were collected at zero-day and at the end of the experimental period (10 fingerlings/replicate) without using any anesthetic drugs. Blood (1.0 mL) was withdrawn from the vein beneath the lateral line by inserting a needle (25 gauges) of a sterile disposable syringe (2.0 mL capacity). This blood was used for determination of packed cell volume (PCV) by using the micro-hematocrit method [33], hemoglobin by using a Diamond Diagnostic hemoglobin Kit [34], and MCHC were determined by using PCV and Hb content. Furthermore, phagocytic activity and phagocytic index of polymorph nuclear cells (heterophils) were quantified by using Candida albicans methods [35,36] according to the following calculation:
Phagocytic Activity % = (No. of Heterophils ingesting Candida/Total number of Heterophils) × 100
Phagocytic index = Total No. of ingested Candida/Phagocytic activity %
The rest of the blood samples were centrifuged for 10 min at 1500× g and plasma were separated and kept at −20 °C till biochemical analysis.

2.8. Protein and Lipid Markers

Total plasma proteins and albumin (A) were determined by spectrophotometric methods [37,38]. Plasma globulin (G) was determined by subtracting albumin values from total plasma protein values. A/G ratio was calculated by dividing albumin and globulin [39]. Additionally, plasma triglycerides and cholesterol were determined by spectrophotometric methods [40,41].

2.9. Chemical Composition of Fish Body

Fish body samples were taken at day zero and at the end of the experimental period (3 fingerlings/replicate). Fresh fish were washed with tap water several times to remove any adhering mucus, a slimy and slippery layer. All fish samples were separated, individually weighed, and filleted (with skin). All specimens were kept at −20 °C. For chemical analysis, samples were thawed in a refrigerator overnight at 4 °C. Analysis of fish body was performed using the standard methods, according to Xu et al. [42]. The chemical composition percentage included the moisture, ether extract, crude protein, and ash in each specimen of all groups.

2.10. Digestibility Trial

For the determination of apparent digestibility of the diets used in the experiment, chromic oxide (Cr2O3) was used as a biological indicator or inert marker for digestibility determination at a level of 0.5% [43]. Three fecal samples/replicate were collected at the end of the experimental period after cleaning the aquaria to ensure no residue of the diet was left. Firstly, fish were fed in the morning and just after feeding, the diet residues were cleaned from the aquarium bottom to give the chance for fish to excrete feces on a clean bottom surface. Therefore, the collected feces contained no diet residues. The chromic oxide percentage was determined [44] in diets and feces using a spectrophotometer at 350 nm against distilled water by the following equations [45]:
Weight of chromic oxide in sample = (Absorbance − (0.0032/0.2089))
Chromic oxide (%) = (Weight of chromic oxide/sample weight (mg)) × 100
Digestibility of dry matter % was calculated according to McDonald et al., 2010 = ((% of indicator in in feces − % of indicator in feed)/% of indicator in feces) × 100

2.11. Dressing Yield (Dy)

At the end of the experiment, 15 fishes from each group (5 fishes/replicate) were taken randomly and sacrificed by cutting the fish head using a sharp knife, then used to determine the dressing yield [10]. The fish samples from each group were weighted individually, and then the head and viscera of each fish were removed and the fish flesh of each was weighed and the dressing yield was calculated from the following equation:
Dressing yield (%) = (Weight of fish flesh/Weight of whole fish) × 100
where, fish flesh = whole fish without head and viscera.

2.12. Economic Performance

Calculation of economic performance (feed cost/tone, decreased the feed costs (%), diet cost/kg weight gain, and decrease in feed cost/kg weight gain (%)) of different diet formulations in the tested groups was recorded according to Soltan et al. [46].

2.13. Statistical Analysis

The results are expressed as mean ± standard error (SE). A one-way analysis of variance (ANOVA) was used to investigate the significance of differences between means in various groups, followed by Duncan’s test [47]. The statistical analysis of data was carried out by applying the SPSS program (ver. 22). A p-value < 0.05 was considered statistically significant.

3. Results

3.1. Growth Performance Parameters

The obtained data of growth parameters are presented in Table 4 and reveal that the partial replacement of soybean meal (44% CP) with 25% autoclaved and acid-treated SBp had no adverse effect on final body weight (Figure 1), total feed intake/fish, feed conversion ratio (FCR), and protein efficiency ratio (PER), while it had a significant increase (p < 0.05) in body weight gain, weight gain %, and average daily gain (ADG) relative to the control group. Moreover, the partial replacement of soybean meal with 50% autoclaved and acid-treated SBp significantly increases (p < 0.05) the final body weight, body weight gain, WG%, ADG, PER, and significantly improves FCR values relative to the control group (100% soybean meal).

3.2. Anemia Screening Parameters

The obtained data of the current study showed a non-significant difference (p > 0.05) among the African catfish groups for hemoglobin content, PCV, and MCHC throughout the duration of the study (Figure 2).

3.3. Plasma Proteins and Lipid markers

The obtained data in Table 5 revealed that the total protein (TP) was significantly increased (p < 0.05) in G3 and G5 (25% and 50% acid-treated SBp, respectively) compared with the control. Furthermore, there was a significant increase (p < 0.05) in plasma albumin (A) of group 5 relative to values of other groups, including the control (G1—Table 5). Moreover, the levels of globulin (G) recorded a significant (p < 0.05) increase in values of SBp-replaced groups (2, 3, 4, 5) compared to the basal-diet-fed group (G1). The highest values were noted in the 50% acid-treated SBp group (G5) relative to other groups for TP, A, and G (Table 5).
The obtained data of Table 5 detailed that the plasma triglycerides and cholesterol recorded a non-significant (p > 0.05) difference in G1 relative to other SBp-replaced groups (3,4, and 5), except G2.

3.4. Immunity Profile

As shown in Table 6, SBp-replaced groups (2, 3, 4, and 5) exhibited a substantial improvement in the phagocytic activity % of heterophils and phagocytic index relative to the control. Conversely, the SBp-replaced groups had a negatively reduced (p < 0.05) A/G ratio when compared to G1 (Table 6).

3.5. Chemical Composition of Fish Body

The obtained results of the catfish body chemical composition (Table 7) revealed that the moisture % was significantly (p < 0.05) increased in all tested groups (G1, G2, G3, and G4) relative to G5 (50% acid-treated SBp) at the end of the experimental period. The crude protein % was improved in all SBp-replaced groups (2, 3, 4, and 5) at the end of the study period relative to the control (G1). Ether extract % was markedly increased (p < 0.05) in fish samples of G1, G2, G3, and G5 at the end of the experimental period in relation to fish samples of G4. Furthermore, ash % was not significantly (p > 0.05) changed in all tested groups in both initial and final fish samples. Means of G5 have recorded the uppermost values (except moisture %) of the catfish body chemical composition relative to other tested groups (Table 7).

3.6. Fish Dressing Yield

The dressing yield of African catfish recorded the highest values in shrimp by-product treated groups (G2, G3, G4, and G5) when matched with the control (Table 7).

3.7. Digestibility Trial

As shown in Table 8, the highest fecal chromic oxide and dry matter digestibility percentages were recorded in G5 compared to the control (G1) and shrimp by-products-replaced groups (G2, G3, and G4).

3.8. Economic Performance

The economic performance of the current study was calculated and summarized in Table 9. These results indicated that replacing soybean meal with autoclaved and acid-treated SBp meals decreased the diet costs by 3.64, 3.64, 7.28, and 7.28% for D2, D3, D4, and D5 relative to the control diet (D1). These results revealed that the diet costs/one kg of weight gain was EGP 4.80, 4.76, 4.50, and 4.38 for fish fed D2, D3, D4, and D5, respectively, relative to D1 (5.15 L.E.).
Local market price (EGP/ton) for feed ingredients used for formulating the experimental diets when the experiment was started was as follows: fishmeal, EGP 13000/ton; yellow corn, EGP 1200; soybean meal, EGP 3000; wheat bran, EGP 1000; vegetable oil, EGP 8000; vitamin and mineral mixture, EGP 15,000; SBp meal, EGP 1000/ton. D1: basal diet containing 100% soybean (control), D2: 25% autoclaved SBp-replaced diet, D3: 25% acid-treated SBp-replaced diet, D4: 50% autoclaved SBp-replaced diet, D5: 50% acid-treated SBp-replaced diet.

4. Discussion

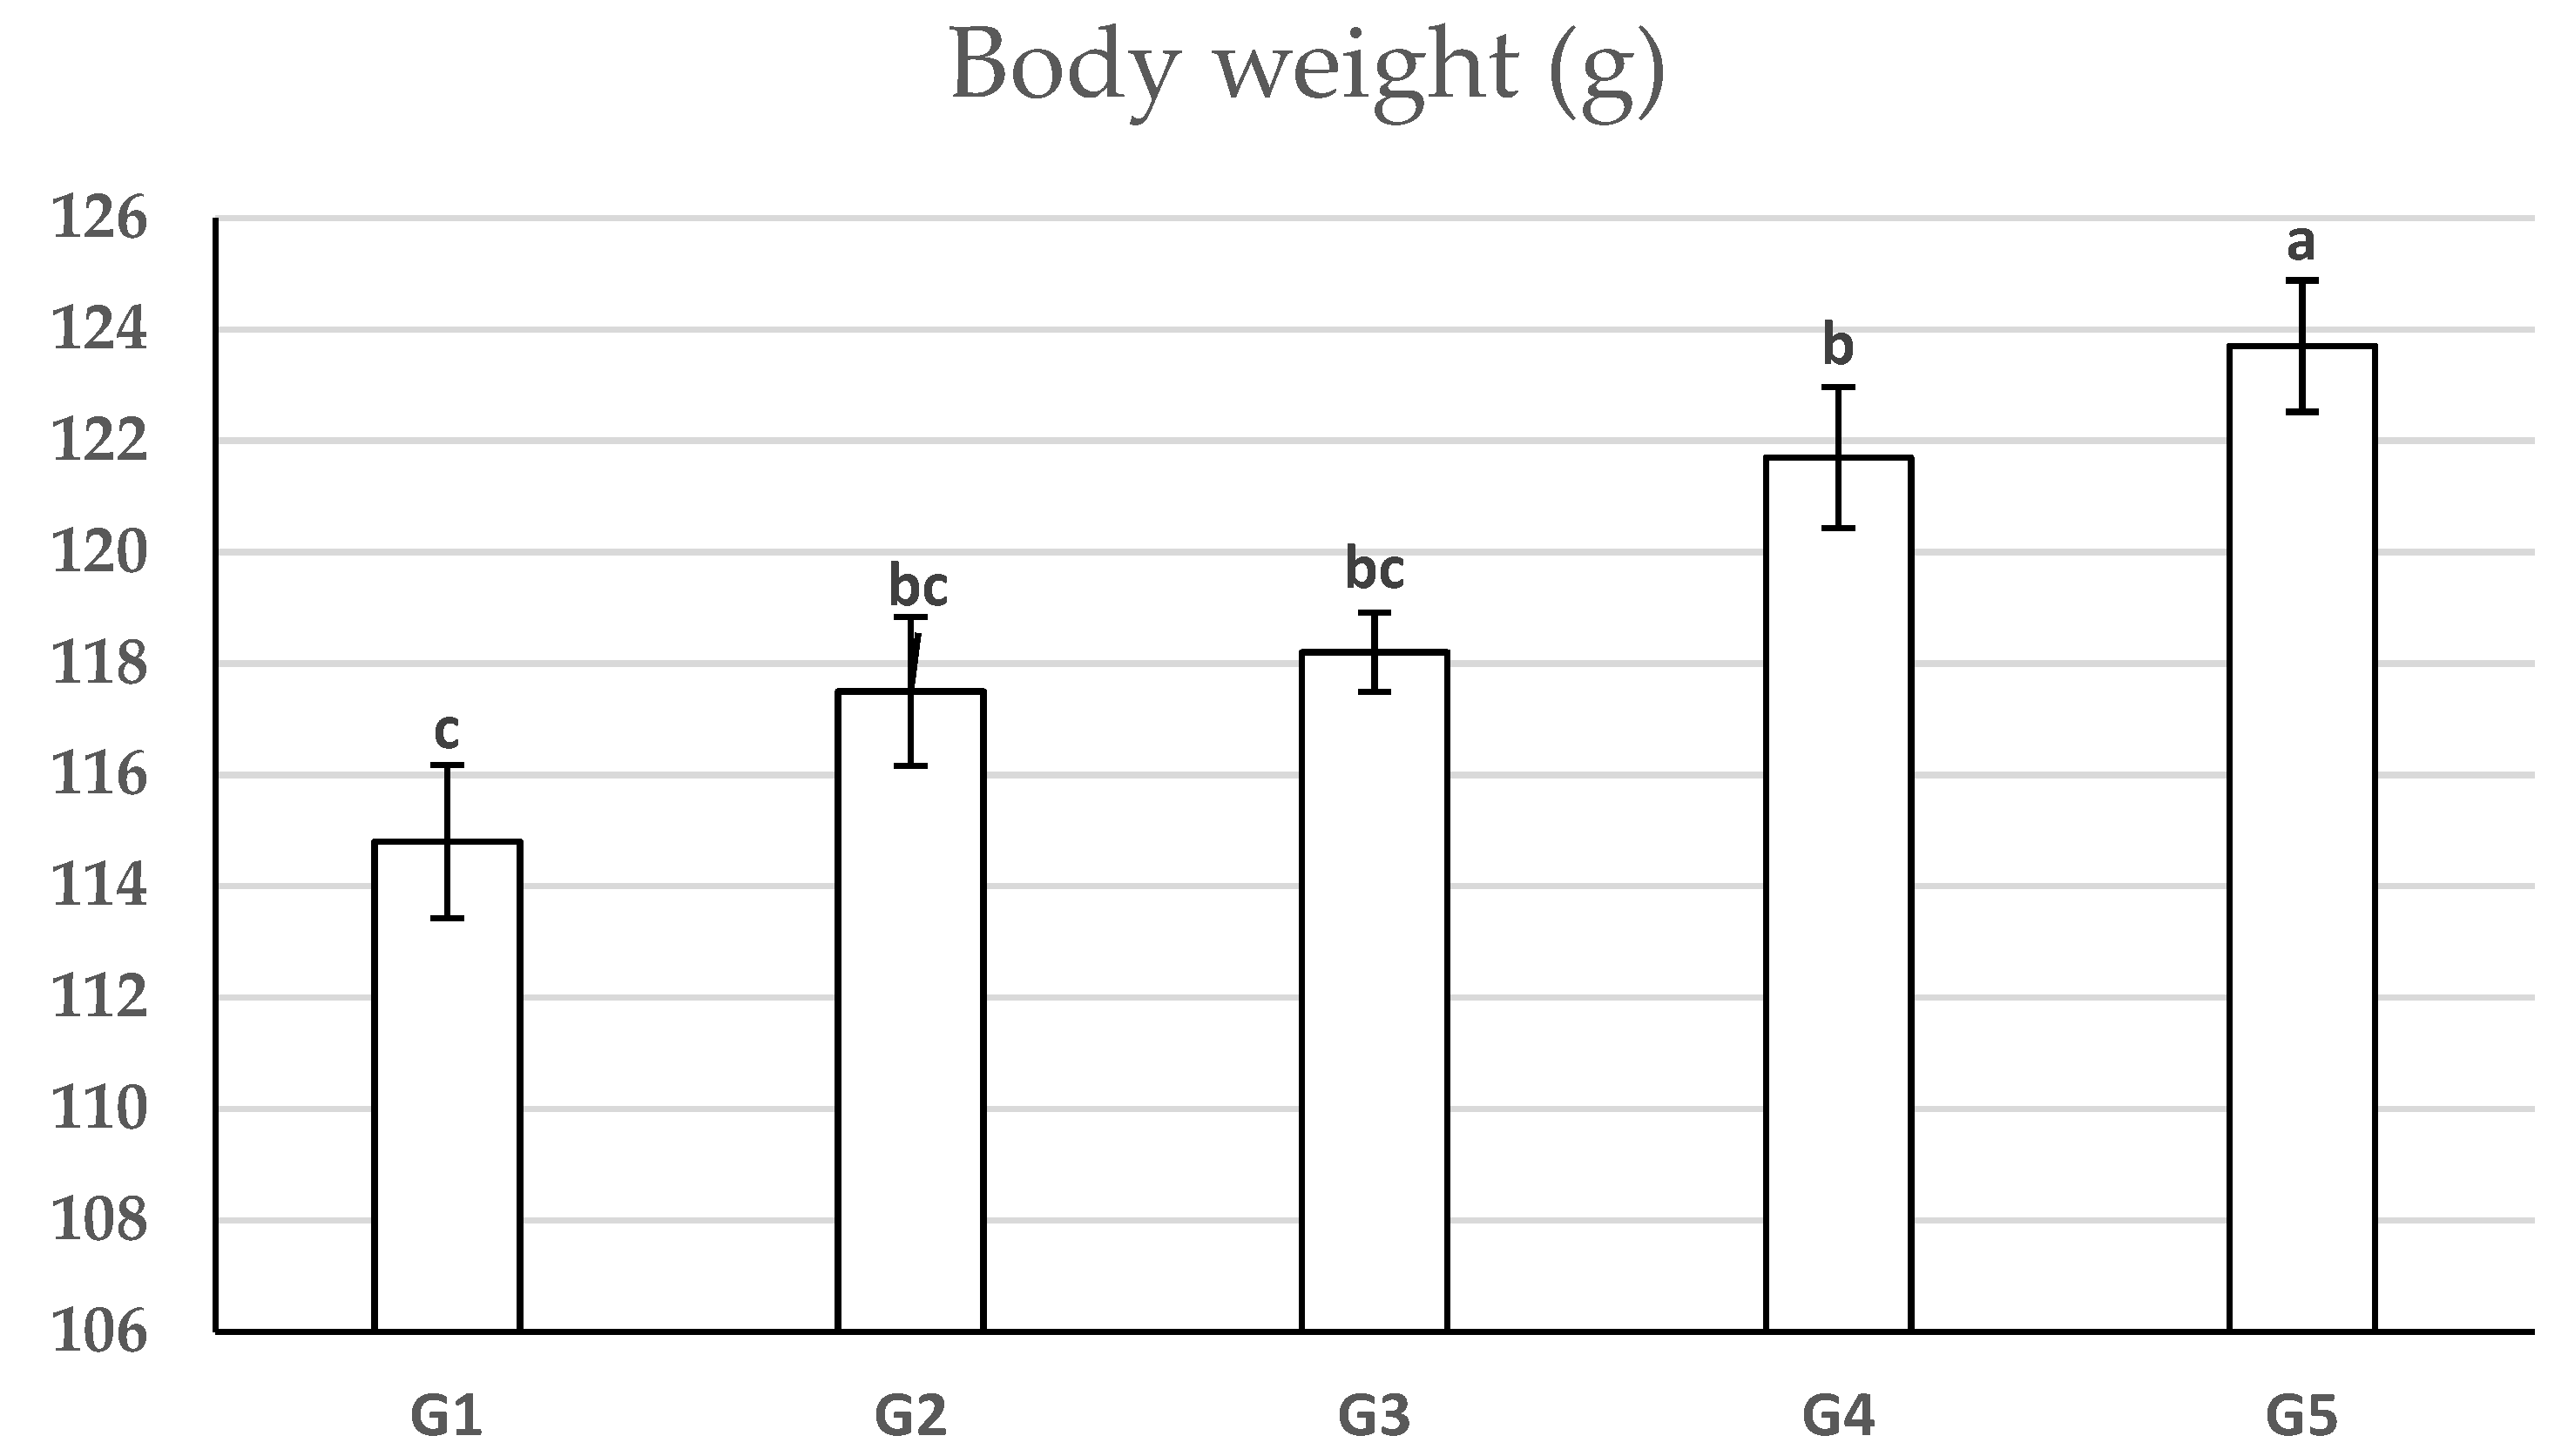
The partial replacement of soybean meal with 25% autoclaved and acid-treated SBp had no adverse effect on final body weight, total feed intake/fish, feed conversion ratio, and protein efficiency ratio. Meanwhile, it showed a significant increase (p < 0.05) in body weight gain, weight gain %, and average daily gain relative to the control group. Moreover, the partial replacement of soybean meal with 50% autoclaved and acid-treated SBp significantly increases (p < 0.05) the final body weight, body weight gain, WG%, ADG, and PER, and significantly improves FCR values relative to the control group (100% soybean meal). The results of the present study were dissimilar to many authors [17,28,30], who found that the increased levels of SBp, in the form of preserved shrimp head, did not improve the growth of catfish and tilapia. On the other hand, the findings of the present study agreed with Li et al. and Hardy et al. [20,48]. They found that the increased levels of SBp and by-catch meal with shrimp trawling at 50% of the dietary protein improve the weight gain and feed efficiency of rainbow trout when compared with those fed the control diet. These effects could be referred to the improvement of digestibility, palatability, and consumption rate of the current treated SBp to enhance catfish growth parameters.
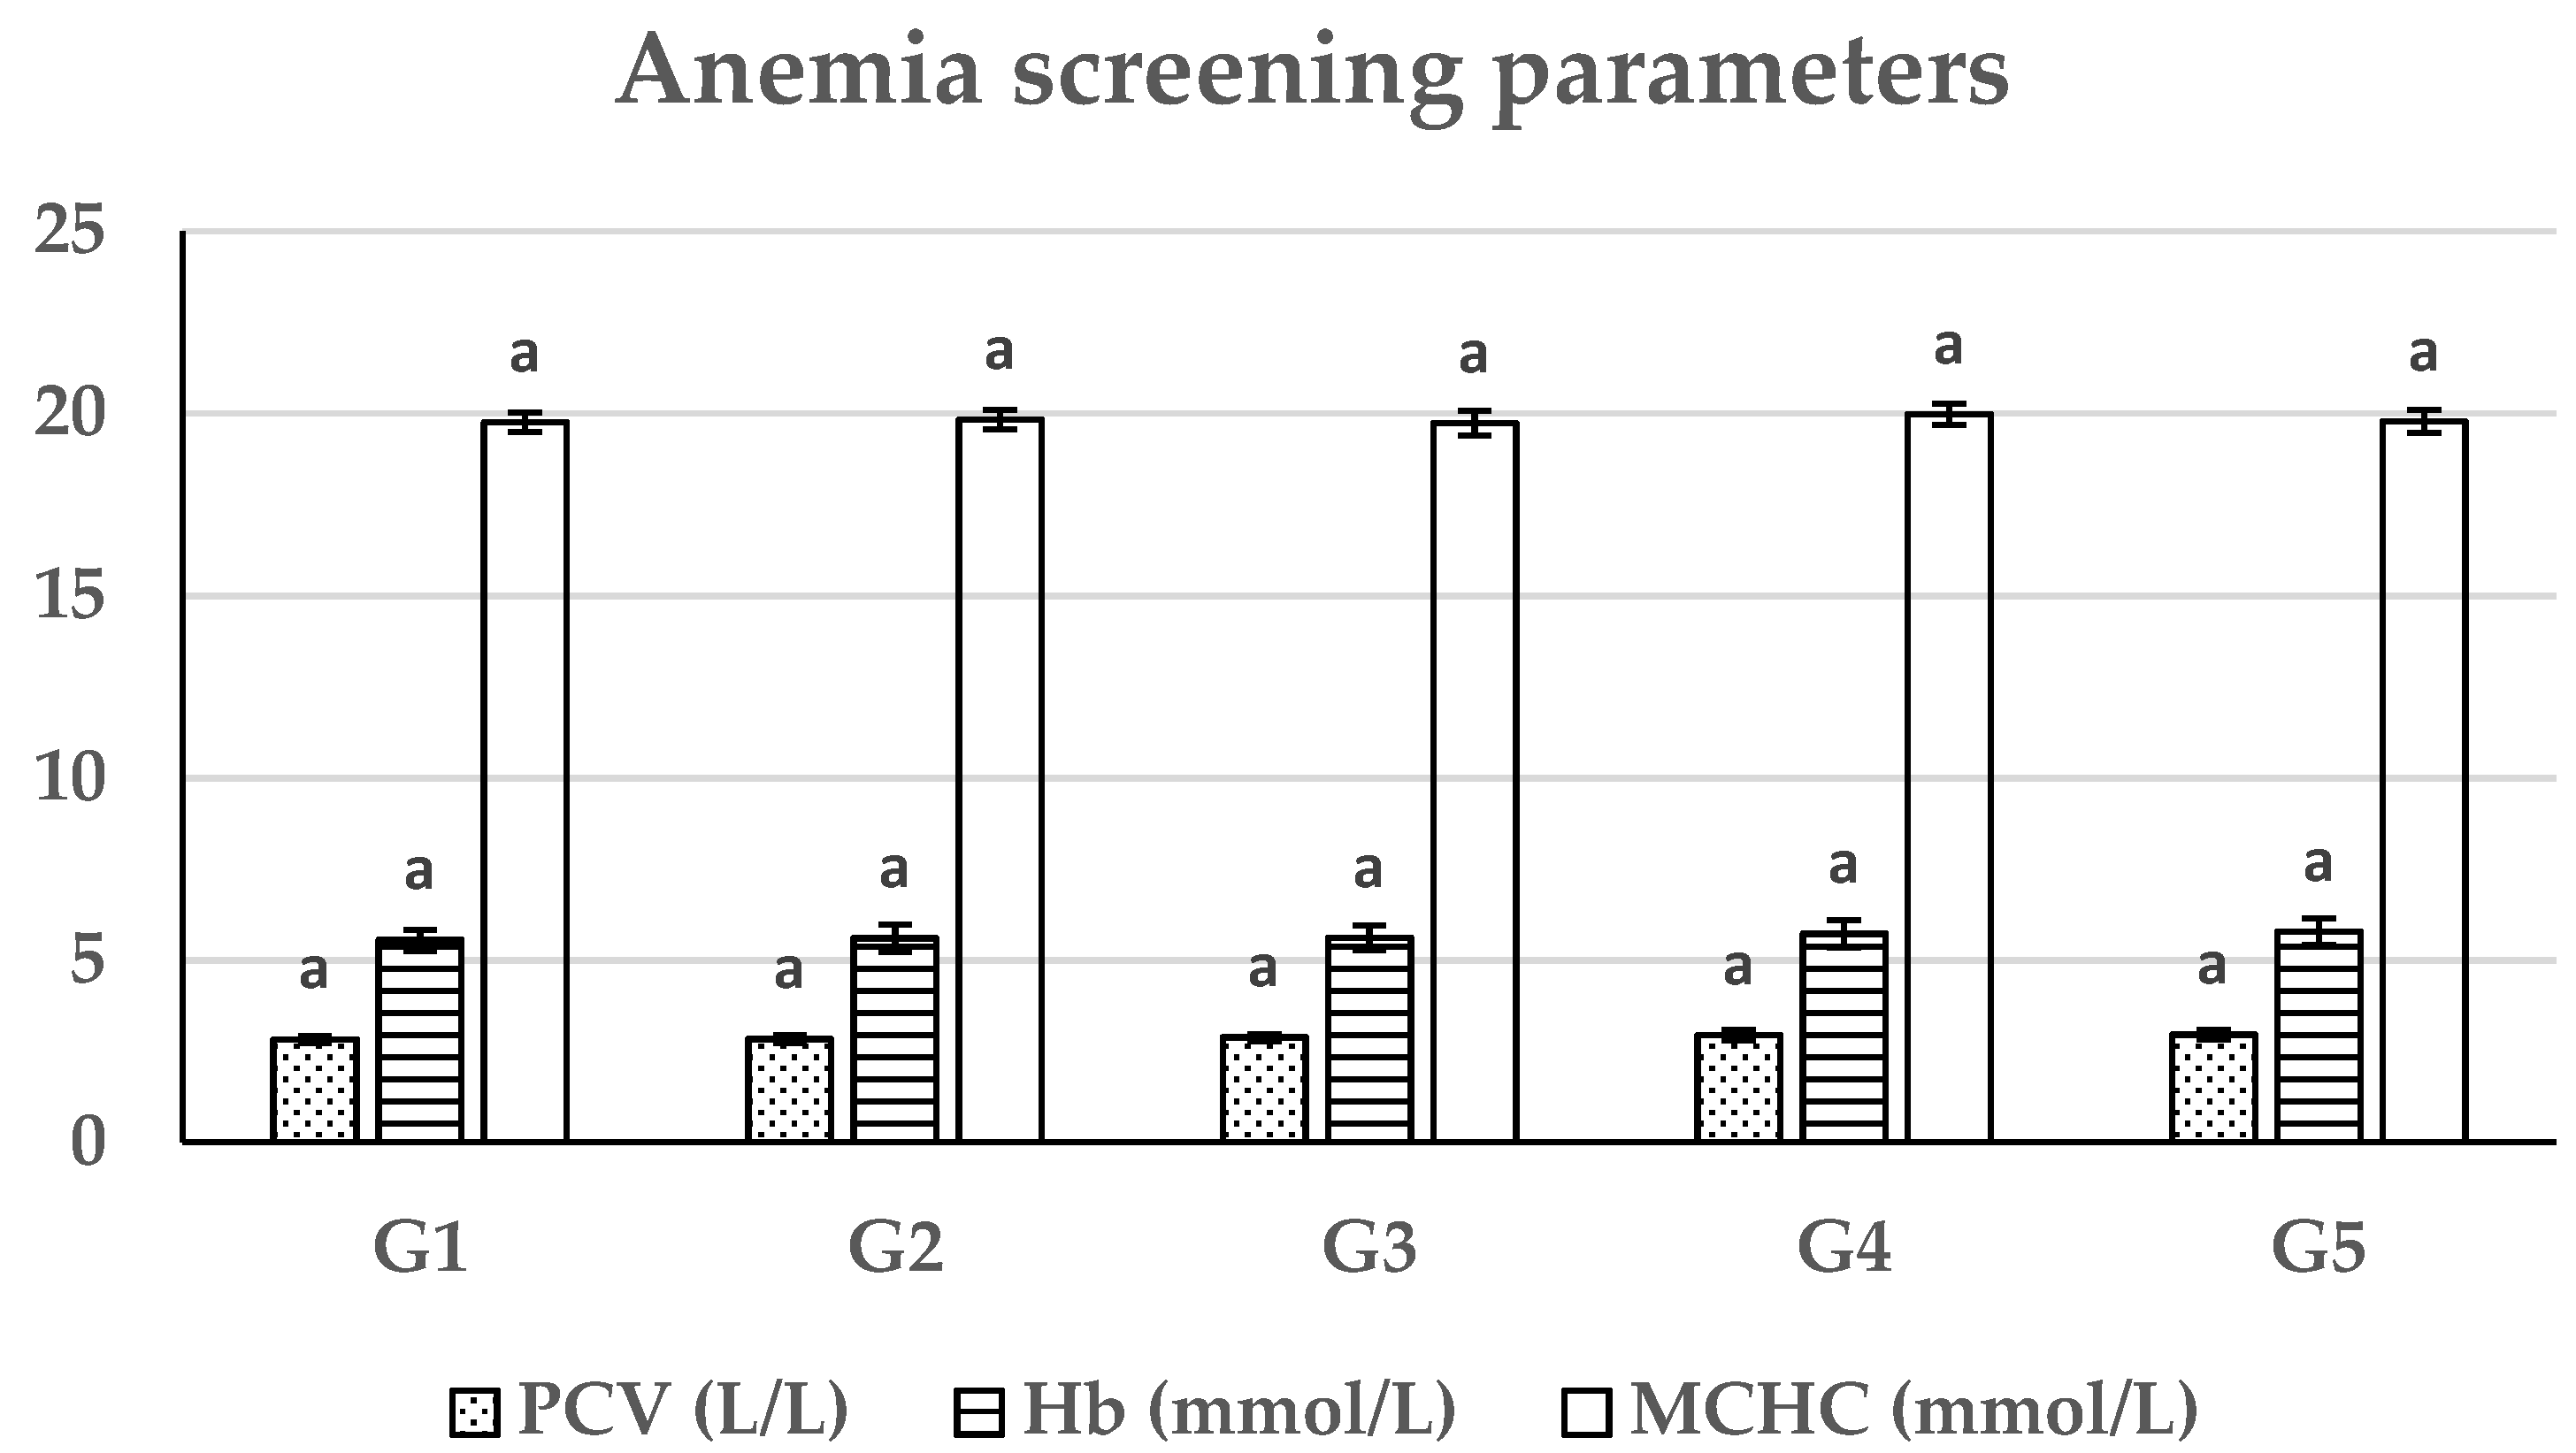
Anemia screening parameters of the existing study showed a non-significant difference between the tested groups for hemoglobin content, PCV, and MCHC. There are no studies seeking the impact of the existing SBp meal feeding on blood profiles of catfish or other fish species. These outcomes could be referred to the contents of autoclaved and acid-treated SBp meals having no adverse effects on the hematopoietic system of the African catfish and keeping the hematological parameters within control group physiological limits.
The protein markers of the present study revealed that the values of total plasma protein were significantly increased in groups 3 and 5 (25% and 50% acid-treated SBp, respectively) compared with the control one. Moreover, there was a significant increase in plasma albumin of group 5 relative to the values of other groups, including the control (G1). Plasma proteins showed a similar trend of improvement in fingerlings fed diets with different levels of fish bio-silage [49] or fermented soy pulp [50] as partial or total replacements of fishmeal. In general, the high crude protein % (40.21, 40.26—Table 1) content with low crude fiber % (13.04, 7.18%—Table 1) of autoclaved and acid-treated SBp meals, respectively, may reflect on increased levels of plasma protein profile for the replaced groups (G2, G3, G4, and G5).
The present study of plasma triglycerides and cholesterol noted a non-considerable variation between control and SBp-replaced groups. These outcomes matched the Oduguwa et al. [51] results, who revealed that the replacement of fishmeal with shrimp waste meal in the diet of growing pigs leads to a non-significant difference in serum cholesterol level. The inedible parts of shrimp waste meal may be restricted due to its high fiber and ash contents [17], which decrease lipid absorption in Atlantic salmon, Salmo salar L. [25]. The high fat content and low fiber contents of acid-treated SBp meal might help in lipid absorption into blood and increase lipid profiles relative to autoclaved SBp meal. In contrast, the high fat and fiber contents of autoclaved SBp meal may decrease lipid absorption into blood and decrease the plasma lipid profiles compared with acid-treated SBp meal (Table 1).
The immunological parameters improvements of the existing study revealed a significant increase in SBp treated groups relative to the control one. Parallel enhancement of phagocytic index and activity were noted in treated groups with fermented earthworms as a feed additive in catfish (Clarias gariepinus) [52]. In contrast, fish fed spirulina and/or β-glucan showed a non-significant change in A/G ratio than the control group in African catfish [53]. Generally, the SBp meals of the current study had good quality proteins and recorded a growth enhancement, which were reflected on immunological parameter augmentation.
African catfish body composition of the present study recorded a major change between treated groups (G2: G5) and the control one (G1). In addition, Leal et al. [30] found that the crude lipid content of fish body significantly increased by increasing the inclusion levels of shrimp head hydrolysate. On a digestible-protein basis, the body composition of red drum fed shrimp waste meal, shrimp processing waste meal, and by-catch meal connected with shrimp trawling did not change appreciably [30]. On the other hand, the tilapia body analysis fed different replacement levels of fishmeal with shrimp head silage (33.3%, 66.7%, and 100%) had statistically no appreciable variation in the moisture and protein content [14]. In the current study, the high fat, protein, and lower fiber contents of acid-treated SBp meal may reflect on ether extract % and crude protein % of African catfish body (chiefly G5). In addition, the high fat, protein, and fiber contents of autoclaved SBp meal were reflected on ether extract % and crude protein % of fish body.
The dressing yield of the current study revealed a significant increase in replacement groups (2, 3, and 5) by SBp in comparison to the control one (G1). The Li et al. [54] results indicated that the fish fed dietary protein (32% protein diet) had a higher body yield than fish fed the lower protein diets (26% and 28%), regardless of fish strain. Generally, the high fat and protein contents of autoclaved and acid-treated SBp meals help protein and fat deposition in the fish muscle that redirected for the current African catfish dressing yield.
The highest means of chromic oxide and dry matter digestibility percentages were recorded in G5 relative to the control (G1) and SBp-replaced groups (G2, G3, and G4). Fanimo et al. [16] reported that the nutritional value of shrimp waste meals depends on the amount of shell or exoskeleton contained in the feed. Many studies used shrimp by-product as a protein source in poultry diets, but its practical use seems to be difficult because of the low digestibility of chitin present in SBp [55]. The outcomes of the present study disagreed with Li et al. [20]. They found a low apparent digestibility coefficient for organic matter and crude protein in red drum fed shrimp processing waste meal. Additionally, the percent apparent digestibility of protein in by-catch meal associated with shrimp trawling and shrimp processing waste meal was significantly lower than anchovy meal [48]. However, Hardy and co-authors [48] showed that amino acid deficiencies and/or imbalances due to low methionine and lysine levels might play a role. Therefore, the shrimp waste meal diet contained large amounts of this indigestible material and low levels of two essential amino acids, resulting in limited utilization by the red drum. Fish fed diets comprising 30% and 40% shrimp head silage had a non-significant improvement in feed digestibility and had a lower digestibility percent [28]. In our opinion, the high content of easily utilized amino acids and lower crude fiber content of acid-treated SBp meal than the autoclaved one may reflect on the dry matter digestibility percentage of the current study. Digestibility values are an important parameter to consider in the diet formulation and in determining feed utilization. Feedstuffs that are poorly digested would be of limited value to an animal. These results suggested that the apparent protein digestibility of SBp is higher than or equal to the soybean for African catfish. Possible reasons for the enhancement of feed utilization, digestibility, and growth parameters recorded at the highest replacing levels of soybean by SBp (50%) may be related to the low crude fiber (7.85% of acid-treated, Table 1) of SBp. These causes were reflected on palatability, feed intake, feed conversion ratio, and protein efficiency ratio [56].
The economic assessment of soybean replacement with SBp can reduce the catfish diet cost that can alleviate the problem of soybean high cost and availability. The fish feed cost (up to 70%) is the largest component in breeders’ total costs [57]. Feed/production income ratio of fish (weighing over 200g) was 0.64 in seabass (Dicentrarchus labrax) [58]. All other costs in the present study were constant. Therefore, the feeding costs required to produce 1 kg weight gain could be used to compare the different experimental groups [27]. The calculated data showed that the feed cost was reduced in all replacing levels of soybean by SBp, and the replacing level of 50% reduced feeding costs by 7.28% and decreased feed costs/kg weight gain by 14.95% for D5 (Table 9). Consequently, partial replacement of soybean by SBp significantly reduced cost indices and improved profit level compared to the basal diet.

5. Conclusions

Based on the findings mentioned above, it was determined that catfish could use SBp as an effective substitute for soybean up to 50% without affecting the catfish’s performance. DM, CP, and EE values for diets incorporating SBp meals confirm this conclusion. The SBp meals enriched the African catfish body dry matter and crude protein percentages. The lipid markers in plasma and fish body decreased by autoclaved SBp and increased by acid-treated SBp meal. Furthermore, this SBp is significantly cheaper in the local market than imported soybean. The current study recommends acid-treatment over the autoclaved one to reach the maximum economic benefits of SBp in replacing soybean outcomes. More research is needed to determine whether it is possible to improve the nutritional value of the SBp and investigate the impact of SBp in diets on large fish sizes under Egyptian field conditions.

Author Contributions

Conceptualization, I.S.A.-A., H.A.A.-R., S.I.F. and Y.M.A.; methodology, I.S.A.-A., S.M.S., S.I.F. and Y.M.A.; investigation, I.S.Z., S.M.S. and I.S.A.-A.; funding acquisition, I.S.A.-A., H.A.A.-R., I.S.Z. and S.M.S.; data curation S.I.F., H.A.A.-R. and Y.M.A.; formal analysis, I.S.A.-A., H.A.A.-R. and S.M.S.; writing—original draft preparation, H.A.A.-R., S.M.S. and S.I.F.; review and editing, I.S.Z., S.I.F. and S.M.S. All authors have read and agreed to the published version of the manuscript.

Funding

This research received no external funding.

Institutional Review Board Statement

All fish handling procedures, as well as sample collection and disposal, were performed according to the regulations of Institutional Animal Care and Use Committee (IACUC), Faculty of Veterinary Medicine, Sadat City University, Egypt (Ethical approval number: VUSC-017/1-20).

Data Availability Statement

The data presented in this study are available on request from the corresponding author.

Conflicts of Interest

The authors declare no conflict of interest.

References

  1. Ytrestøyl, T.; Aas, T.S.; Åsgård, T. Utilisation of feed resources in production of Atlantic salmon (Salmo salar) in Norway. Aquaculture 2015, 448, 365–374. [Google Scholar] [CrossRef] [Green Version]
  2. Müller, O.; Krawinkel, M. Malnutrition and health in developing countries. Cmaj 2005, 173, 279–286. [Google Scholar] [CrossRef] [Green Version]
  3. Onyekuru, N.A.; Ihemezie, E.J.; Chima, C.C. Socioeconomic and profitability analysis of catfish production: A case study of Nsukka Local Government Area of Enugu State, Nigeria. Agro-Science 2019, 18, 51–58. [Google Scholar] [CrossRef]
  4. Oyedeji, F.N. Assessment of the effects of fish density on growth rate of African catfish (Clarias gariepinus). Int. J. Sci. Res. 2016, 6, 567–570. [Google Scholar]
  5. Goda, A.M.; El-Haroun, E.R.; Kabir Chowdhury, M.A. Effect of totally or partially replacing fishmeal by alternative protein sources on growth of African catfish Clarias gariepinus (Burchell, 1822) reared in concrete tanks. Aquac. Res. 2007, 38, 279–287. [Google Scholar] [CrossRef]
  6. Food and Agriculture Organization of the United Nations. The State of World Fisheries and Aquaculture; Food and Agriculture Organization of the United Nations: Rome, Italy, 2016; Available online: http://www.fao.org/3/a-i5555e.pdf (accessed on 15 November 2021).
  7. Coyle, S.D.; Mengel, G.J.; Tidwell, J.H.; Webster, C.D. Evaluation of growth, feed utilization, and economics of hybrid tilapia, Oreochromis niloticus × Oreochromis aureus, fed diets containing different protein sources in combination with distillers dried grains with solubles. Aquac. Res. 2004, 35, 365–370. [Google Scholar] [CrossRef]
  8. Silva, R.L.D.; Damasceno, F.M.; Rocha, M.K.H.R.; Sartori, M.M.P.; Barros, M.M.; Pezzato, L.E. Replacement of soybean meal by peanut meal in diets for juvenile Nile tilapia, Oreochromis niloticus. Lat. Am. J. Aquat. Res. 2017, 45, 1044–1053. [Google Scholar] [CrossRef]
  9. Rumsey, G.L. Fishmeal and alternate sources of protein in fish feeds update 1993. Fish 1993, 18, 14–19. [Google Scholar] [CrossRef]
  10. Li, M.H.; Bosworth, B.G.; Lucas, P.M. Replacing soybean meal with alternative protein sources in diets for pond-raised hybrid catfish, ♀ Ictalurus punctatus×♂ Ictalurus furcatus. J. World Aquac. Soc. 2018, 49, 755–760. [Google Scholar] [CrossRef]
  11. Abdel-Warith, A.A.; Russell, P.M.; Davies, S.J. Inclusion of a commercial poultry by-product meal as a protein replacement of fish meal in practical diets for African catfish Clarias gariepinus (Burchell 1822). Aquac. Res. 2001, 32, 296–305. [Google Scholar] [CrossRef]
  12. Kasper, C.S.; Watkins, B.A.; Brown, P.B. Evaluation of two soybean meals fed to yellow perch (Perca flavescens). Aquac. Nutr. 2007, 13, 431–438. [Google Scholar] [CrossRef]
  13. Soltan, M.A.; Samra, I.M. Partial or complete replacement of fish meal by fermented fish by-products silage in diets of Nile tilapia (Oreochromis niloticus) fingerlings. In Proceedings of the Third Scientific Conference Al Azhar University, Cairo, Egypt, 17–18 October 2010; pp. 1–19. [Google Scholar]
  14. Tacon, A.G.; Hasan, M.R.; Subasinghe, R.P.; FAO. Use of Fishery Resources as Feed Inputs for Aquaculture Development: Trends and Policy Implications, FAO Fisheries Circular No. 1018; Food and Agriculture Organization of the United Nations: Rome, Italy, 2006; pp. 1–114. [Google Scholar]
  15. Tacon, A.G.; Metian, M. Fishing for feed or fishing for food: Increasing global competition for small pelagic forage fish. Ambio 2009, 38, 294–302. [Google Scholar]
  16. Fanimo, A.O.; Oduguwa, O.O.; Onifade, A.O.; Olutunde, T.O. Protein quality of shrimp-waste meal. Bioresour. Technol. 2000, 72, 185–188. [Google Scholar] [CrossRef]
  17. Cavalheiro, J.M.O.; de Souza, E.O.; Bora, P.S. Utilization of shrimp industry waste in the formulation of tilapia (Oreochromis niloticus Linnaeus) feed. Bioresour. Technol. 2007, 98, 602–606. [Google Scholar] [CrossRef]
  18. Jeyaprakashsabari, S.; Aanand, S. Shrimp waste—A valuable protein source for aqua feed. AgriCos E Newsl. 2021, 2, 64–67. [Google Scholar]
  19. Claverie, M.; McReynolds, C.; Petitpas, A.; Thomas, M.; Fernandes, S. Marine-derived polymeric materials and biomimetics: An overview. Polymers 2020, 12, 1002. [Google Scholar] [CrossRef] [PubMed]
  20. Li, P.; Wang, X.; Hardy, R.W.; Gatlin, D.M., III. Nutritional value of fisheries by-catch and by-product meals in the diet of red drum (Sciaenops ocellatus). Aquaculture 2004, 236, 485–496. [Google Scholar] [CrossRef]
  21. Kurita, K. Chitin and chitosan: Functional biopolymers from marine crustaceans. Mar. Biotechnol. 2006, 8, 203–226. [Google Scholar] [CrossRef]
  22. Fox, C.J. The effect of various processing methods on the physical and biochemical properties of shrimp head meals and their utilization by juvenile Penaeus monodon Fab. Aquaculture 1994, 122, 209–226. [Google Scholar] [CrossRef]
  23. Rahman, M.; Koh, K. Improvement in Nutritional Quality of Shrimp Meal with Autoclave and Chemical Treatments: An in vitro Study. J. Poult. Sci. 2016, 53, 124–127. [Google Scholar] [CrossRef] [Green Version]
  24. Li, M.H.; Robinson, E.H.; Lucas, P.M. Apparent phosphorus availabilities of selected traditional and alternative feedstuffs for channel catfish. N. Am. J. Aquac. 2015, 77, 136–140. [Google Scholar] [CrossRef]
  25. Olsen, R.E.; Suontama, J.; Langmyhr, E.; Mundheim, H.; Ringø, E.; Melle, W.; Hemre, G.I. The replacement of fishmeal with Antarctic krill, Euphausia superba in diets for Atlantic salmon, Salmo salar. Aquac. Nutr. 2006, 12, 280–290. [Google Scholar] [CrossRef] [Green Version]
  26. National Research Council. Nutrient Requirements of Fish and Shrimp; National Academies Press: Washington, DC, USA, 2011. [Google Scholar]
  27. Soltan, M.; Hanafy, M.; Wafa, M. An evaluation of fermented silage made from fish by-products as a feed ingredient for African catfish (Clarias gariepinus). Glob. Vet. 2008, 2, 80–86. [Google Scholar]
  28. Nwanna, L.C.; Balogun, A.M.; Ajenifuja, Y.F.; Enujiugha, V.N. Replacement of fishmeal with chemically preserved shrimp head in the diets of African catfish, Clarias gariepinus. J. Food Agric. Environ. 2004, 2, 79–83. [Google Scholar]
  29. Younis, E.S.M.; Al-Quffail, A.S.; Al-Asgah, N.A.; Abdel-Warith, A.W.A.; Al-Hafedh, Y.S. Effect of dietary fishmeal replacement by red algae on growth performance and body composition of Nile tilapia Oreochromis niloticus. Saudi J. Biol. Sci. 2018, 25, 198–203. [Google Scholar] [CrossRef] [PubMed]
  30. Leal, A.L.G.; de Castro, P.F.; de Lima, J.P.V.; de Souza Correia, E.; de Souza Bezerra, R. Use of shrimp protein hydrolysate in Nile tilapia (Oreochromis niloticus, L.) feeds. Aquac. Inter. 2010, 18, 635–646. [Google Scholar] [CrossRef]
  31. Dawood, M.A.; Magouz, F.I.; Mansour, M.; Saleh, A.A.; Asely, A.M.E.; Fadl, S.E.; Al-Misned, F. Evaluation of yeast fermented poultry by-product meal in Nile Tilapia (Oreochromis niloticus) feed: Effects on growth performance, digestive enzymes activity, innate immunity, and antioxidant capacity. Front. Vet. Sci. 2020, 6, 516. [Google Scholar] [CrossRef] [Green Version]
  32. Wei, Y.; Liang, M.; Mu, Y.; Zheng, K.; Xu, H. The effect of ultrafiltered fish protein hydrolysate level on growth performance, protein digestibility and m RNA expression of P ep T 1 in juvenile turbot (S. cophthalmus maximus L.). Aquac. Nutr. 2016, 22, 1006–1017. [Google Scholar] [CrossRef]
  33. Arthanari, M.; Dhanapalan, S. Assessment of the haematological and serum biochemical parameters of three commercially important freshwater fishes in river Cauvery Velur, Namakkal district, Tamil Nadu, India. Int. J. Fish Aquat. Stud. 2016, 4, 155–159. [Google Scholar]
  34. Rathore, S.S.; Yusufzai, S.I. Changes in haematological and serum biochemical indices of Nile tilapia (Oreochromis niloticus) fry fed dietary shrimp head meal. J. Entomol. Zool. Stud. 2018, 6, 663–667. [Google Scholar]
  35. Ahmed, I.; Sheikh, Z.A. Hematological and serum biochemical parameters of five freshwater snow trout fish species from river Jhelum of Kashmir Himalaya, India. Comp. Clin. Path. 2019, 28, 771–782. [Google Scholar] [CrossRef]
  36. Soliman, M. Depression of phagocytosis in grass carp ctenopharyngodon idella following chemical stress, Alex. J. Vet. Sci. 1997, 13, 81–86. [Google Scholar]
  37. Tietz, N. Clinical Guide to Laboratory Tests, 2nd ed.; John Wiley & Sons, Inc.: Philadelphia, PA, USA, 2002. [Google Scholar]
  38. Satpathy, L.; Dash, D.; Sahoo, P.; Anwar, T.S.; Parida, S.P. Quantitation of total protein content in some common edible food sources by lowry protein assay. Lett. Appl. Nano Bio. Sci. 2020, 9, 1275–1283. [Google Scholar]
  39. Kumar, N.; Singh, N.P. Effect of dietary selenium on immuno-biochemical plasticity and resistance against Aeromonas veronii biovar sobria in fish reared under multiple stressors. Fish Shellfish. Immunol. 2019, 84, 38–47. [Google Scholar] [CrossRef] [PubMed]
  40. Gulzar, S.; Zuber, M. Determination of Omega-3 Fatty acid composition in fresh water fish. Int. J. Agric. Biol. 2000, 2, 342–343. [Google Scholar]
  41. De Silva, P.P.; Agarwal-Mawal, A.; Davis, P.J.; Cheema, S.K. The levels of plasma low density lipoprotein are independent of cholesterol ester transfer protein in fish-oil fed F1B hamsters. Nutr. Metab. 2005, 2, 1–9. [Google Scholar] [CrossRef] [Green Version]
  42. Xu, H.; Mu, Y.; Zhang, Y.; Li, J.; Liang, M.; Zheng, K.; Wei, Y. Graded levels of fish protein hydrolysate in high plant diets for turbot (Scophthalmus maximus): Effects on growth performance and lipid accumulation. Aquaculture 2016, 454, 140–147. [Google Scholar] [CrossRef]
  43. Biswas, A.K.; Seoka, M.; Inoue, Y.; Takii, K.; Kumai, H. Photoperiod influences the growth, food intake, feed efficiency and digestibility of red sea bream (Pagrus major). Aquaculture 2005, 250, 666–673. [Google Scholar] [CrossRef]
  44. Panini, R.L.; Freitas, L.E.L.; Guimarães, A.M.; Rios, C.; da Silva, M.F.O.; Vieira, F.N.; Amboni, R.D. Potential use of mealworms as an alternative protein source for Pacific white shrimp: Digestibility and performance. Aquaculture 2017, 473, 115–120. [Google Scholar] [CrossRef]
  45. McDonald, P.; Edwards, R.A.; Greenhalgh, J.F.D.; Morgan, C.A.; Sinclair, L.A.; Wilkinson, R.G. Animal Nutrition Longman Scientific and Technical, 7th ed.; Prentice Hall: New York, NY, USA, 2010. [Google Scholar]
  46. Soltan, M.; Hanafy, M.; Wafa, M. Effect of replacing fishmeal by a mixture of different plant protein sources in Nile tilapia (Oreochromis niloticus L.) diets. Glob. Vet. 2008, 2, 157–164. [Google Scholar]
  47. Mishra, P.; Singh, U.; Pandey, C.M.; Mishra, P.; Pandey, G. Application of student’s t-test, analysis of variance, and covariance. Ann. Card. Anaesth. 2019, 22, 407–411. [Google Scholar] [CrossRef]
  48. Hardy, R.W.; Sealey, W.M.; Gatlin, D.M., III. Fisheries by-catch and by-product meals as protein sources for rainbow trout Oncorhynchus mykiss. J. World Aquac. Soc. 2005, 36, 393–400. [Google Scholar] [CrossRef]
  49. Najim, S.M.; Al-Noor, S.S.; Jasim, B.M. Effects of fishmeal replacement with fish biosilage on some haematological and biochemical parameters in common carp Cyprinus carpio fingerlings. Int. J. Res. Fish Aquac. 2014, 4, 112–116. [Google Scholar]
  50. Kari, Z.A.; Kabir, M.A.; Mat, K.; Rusli, N.D.; Razab, M.K.A.A.; Ariff, N.S.N.A.; Wei, L.S. The possibility of replacing fishmeal with fermented soy pulp on the growth performance, blood biochemistry, liver, and intestinal morphology of African catfish (Clarias gariepinus). Aquac. Rep. 2021, 21, 100815. [Google Scholar] [CrossRef]
  51. Oduguwa, B.O.; Ajasa, O.Y.; Fanimo, A.O.; Oduguwa, O.O.; Jegede, O. Feeding value of shrimp meal for growing pigs. Arch. Zootec. 2004, 53, 77–85. [Google Scholar]
  52. Nugraha, T.A.; Isnansetyo, A.; Djalil, M. Fermented earthworms as a feed additive enhances non-specific immune response in catfish (Clarias gariepinus). Aquac. Int. 2021, 29, 1–16. [Google Scholar] [CrossRef]
  53. Mokhbatly, A.A.; Assar, D.H.; Ghazy, E.W.; Elbialy, Z.; Rizk, S.A.; Omar, A.A.; Dawood, M.A. The protective role of spirulina and β-glucan in African catfish (Clarias gariepinus) against chronic toxicity of chlorpyrifos: Hemato-biochemistry, histopathology, and oxidative stress traits. Environ. Sci. Pollut. Res. 2020, 27, 31636–31651. [Google Scholar] [CrossRef]
  54. Li, M.H.; Manning, B.B.; Robinson, E.H.; Bosworth, B.G.; Wolters, W.R. Comparison of growth, processing yield, and body composition of USDA103 and Mississippi “Normal” strains of channel catfish fed diets containing three concentrations of protein. J. World Aquac. Soc. 2001, 32, 402–408. [Google Scholar] [CrossRef]
  55. Rahman, M.; Koh, K. Effect of shrimp meal of heads of Black Tiger (Penaeus monodon) and White Leg (Litopenaeus vannamei) shrimps on growth performance in broilers. J. Poul. Sci. 2016, 53, 149–152. [Google Scholar] [CrossRef] [Green Version]
  56. Luo, L.; Xue, M.; Wu, X.; Cai, X.; Cao, H.; Liang, Y. Partial or total replacement of fishmeal by solvent-extracted cottonseed meal in diets for juvenile rainbow trout (Oncorhynchus mykiss). Aquac. Nutr. 2006, 12, 418–424. [Google Scholar] [CrossRef]
  57. Gandhy, A. Aquaponics cultivation of Ipome Aquatica and the Peasant Financial income of Cirata Cistern. Shirkah J. Econ. Bus. 2016, 1, 241–256. [Google Scholar] [CrossRef] [Green Version]
  58. Baki, B.; Yücel, S. Feed cost/production income analysis of seabass (Dicentrarchus labrax) aquaculture. Int. J. Ecosyst. Ecol. Sci. 2017, 7, 859–864. [Google Scholar]
Figure 1. Effect of soybean meal replacement by shrimp by-product meals on body weight (g) in African catfish (Clarias lazera) at the 12th week of experimental period (mean ± SE), n = 30. Values with different letters (a–c) differ significantly at p ≤ 0.05. G1: Basal-diet-fed group (control), G2: 25% autoclaved SBp fed group, G3: 25% acid-treated SBp fed group, G4: 50% autoclaved SBp fed group, G5: 50% acid-treated SBp fed group.
Fishes 06 00084 g001
Figure 2. Effect of soybean meal partial substitution with autoclaved and acid-treated SBp meals on anemia screening parameters in African catfish (Clarias lazera) (mean ± SE), n = 30. (G1: Basal-diet-fed group (control), G2: 25% autoclaved SBp fed group, G3: 25% acid-treated SBp fed group, G4: 50% autoclaved SBp fed group, G5: 50% acid-treated SBp fed group.)
Fishes 06 00084 g002
Table 1. Chemical composition of fresh, autoclaved, and acid-treated shrimp by-product (SBp) meals (on a dry matter basis).
Fresh SBpAutoclaved SBpAcid-Treated SBp
Dry matter %91.7192.4891.5
Crude protein %44.4843.4844
Ether extract %4.584.084.60
Crude fiber %16.8414.107.85
Ash %25.4825.7825.15
* NFE %8.6212.5618.40
** Gross energy (GE) Kcal/g3.303.353.67
* Nitrogen-free extract (NFE) = 100 − (CP + EE + CF + Ash + Moisture%). SBp = shrimp by-product. ** Gross energy calculated according to NRC [26], based on 5.64, 4.11, and 9.44 Kcal GE/g CP, NFE, and EE, respectively.
Table 2. Ingredients of the experimental diets.
IngredientsDiets
D1D2D3D4D5
Fishmeal 72%1818181818
Soya bean meal 44%31.0023.2523.2515.5015.50
Shrimp by-products (autoclaved) 40.21%8.2517
Shrimp by-products (acid-treated) 40.26%8.2517
Yellow corn3232323232
Wheat bran13.513131212
Corn oil44444
Mineral and vitamins and premix *11111
Cr2O30.50.50.50.50.5
Total100100100100100
* Composition of premix/kg: vitamin A: 660,000 IU, choline: 28,500 mg, vitamin D: 173,500 IU, niacin: 3300 mg, biotin: 5.5 mg, vitamin B12: 1.1 mg, vitamin E: 1650 mg, Ca salt of pantothenic acid: 660 mg, folic acid: 55 mg, pyridoxine: 220 mg, riboflavin: 550 mg, thiamin: 110 mg, selenium: 16.5 mg, copper: 6875 mg, zinc: 4400 mg, manganese: 5500 mg, iron: 4400 mg, methionine: 102 g, iodine: 110 mg, according to EVICO, Egypt.
Table 3. Chemical analysis of experimental diets (on a dry matter basis).
Diets
D1D2D3D4D5
Dry matter %90.5590.7090.5091.6091.20
CP %35.9035.8935.0534.7334.80
Ether extract %9.409.569.8211.2812.13
Ash %6.545.915.937.667.24
CF %3.183.152.772.952.80
* NFE 44.9845.4946.4343.3843.03
** Gross energy (GE) kcal/kg of diet4760.84796.34812.14806.54876.3
* Nitrogen-free extract (NFE) =100 − (CP + EE + CF + Ash + moisture%). ** Gross energy calculated according to NRC [26], based on 5.64, 4.11, and 9.44 Kcal GE/g CP, NFE, and EE, respectively.
Table 4. Effect of partial replacement of soybean meal with shrimp by-product meals on growth performance parameters in African catfish (Clarias lazera) (mean ± SE), n = 30.
Growth ParametersG1G2G3G4G5
Weight gain (g)94.22 ±1.37 b97.00 ± 0.90 b97.66 ±1.22 b101.38 ± 1.14 a103.68 ± 0.84 a
Weight gain percent (%)458.03 ± 1.86 d473.53 ± 2.75 c479.60 ± 2.73 c499.10 ± 2.33 b518.16 ± 2.40 a
Average daily gain (g)1.12 ± 0.011 b1.16 ± 0.017 b1.16 ± 0.017 b1.21 ± 0.017 a1.23 ± 0.022 a
Total feed intake/fish (g)114.01 ± 1.12 a113.49 ± 0.85 a113.29 ± 0.98 a115.57 ± 1.15 a115.09 ± 1.21 a
Feed conversion ratio1.21 ± 0.022 a1.17 ± 0.022 a,b1.16 ± 0.022 a,b1.14 ± 0.028 b,c1.11 ± 0.022 c
Protein efficiency ratio2.56 ± 0.045 c2.64 ± 0.050 b,c2.71 ± 0.061 b2.78 ± 0.061 a,b2.86 ± 0.061 a
Values with different letters at the same row (a–d) differ significantly at p ≤ 0.05. G1: Basal-diet-fed group (control), G2: 25% autoclaved SBp fed group, G3: 25% acid-treated SBp fed group, G4: 50% autoclaved SBp fed group, G5: 50% acid-treated SBp fed group.
Table 5. Effect of soybean meal replacement by shrimp by-product meals on plasma proteins and lipid markers in African catfish (Clarias lazera) (mean ± SE), n = 30.
ParametersG1G2G3G4G5
Total protein (g/L)57.10 ± 1.39 c59.60 ± 2.01 b,c60.30 ± 1.78 b59.70 ± 2.01 b,c62.40 ± 2.34 a
Albumin (g/L)35.90 ± 0.59 b36.40 ± 0.66 b36.40 ± 0.55 b36.10 ± 0.89 b38.00 ± 0.69 a
Globulin (g/L)21.20 ± 1.28 c23.20 ± 1.62 b23.90 ± 1.67 b23.60 ± 1.73 b24.60 ± 1.730 a
Triglyceride (mmol/L)2.23 ± 0.03 a2.09 ± 0.02 b2.24 ± 0.02a2.14 ± 0.03 a,b2.21 ± 0.04 a
Cholesterol (mmol/L)5.64 ± 0.05 a5.23 ± 0.03 b5.42 ± 0.05 a,b5.49 ± 0.05 a,b5.53 ± 0.06 a,b
Values with different letters at the same row (a–c) differ significantly at p ≤ 0.05. G1: Basal-diet-fed group (control), G2: 25% autoclaved SBp fed group, G3: 25% acid-treated SBp fed group, G4: 50% autoclaved SBp fed group, G5: 50% acid-treated SBp fed group.
Table 6. Effect of partial replacement of soybean meal with shrimp by-product meals on phagocytic activity, phagocytic index, and A/G ratio in African catfish (Clarias lazera) (mean ± SE), n = 30.
ParametersG1G2G3G4G5
Phagocytic activity %67.85 ± 1.11 b71.07 ± 1.83 a,b71.70 ± 1.80 a71.27 ± 2.00 a,b71.53 ± 1.89 a
Phagocytic index2.07 ± 0.15 c2.37 ± 0.13 a2.28 ± 0.12 b2.24 ± 0.11 b2.23 ± 0.10 b
A/G ratio1.91 ± 0.11 a1.71 ± 0.12 b1.71 ± 0.13 b1.71 ± 0.13 b1.76 ± 0.11 b
Values with different letters at the same row (a–c) differ significantly at p ≤ 0.05. G1: Basal-diet-fed group (control), G2: 25% autoclaved SBp fed group, G3: 25% acid-treated SBp fed group, G4: 50% autoclaved SBp fed group, G5: 50% acid-treated SBp fed group.
Table 7. Effect of partial replacement of soybean meal with shrimp by-product meals on chemical composition and fish dressing yield in African catfish (Clarias lazera) (mean ± SE).
ParametersG1G2G3G4G5
Moisture72.25 ± 0.072 b72.54 ± 0.85 a,b72.93 ± 0.095 a,b73.63 ± 0.017 a70.80 ± 0.12 c
Dry matter27.75 ± 0.072 b27.46 ± 0.85 b,c27.07 ± 0.095 b,c26.37 ±0.022 c29.20 ± 0.12 a
Crude Protein18.90 ± 0.240 b19.95 ± 0.173 a19.60 ± 0.117 a,b19.64 ± 0.056 a,b20.37 ± 0.050 a
Ether extract7.23 ± 0.033 a6.58 ± 0.033 b6.47 ± 0.084 b5.67 ± 0.056 c7.49 ± 0.072 a
Ash1.15 ± 0.028 a0.89 ± 0.039 a0.96 ± 0.078 a1.11 ± 0.139 a1.32 ± 0.061 a
Dressing yield67.70 ± 0.18 b69.12 ± 0.15 a69.20 ± 0.16 a68.54 ± 0.21 a,b69.08 ± 0.22 a
Values with different letters at the same row (a–c) differ significantly at p ≤ 0.05. G1: Basal-diet-fed group (control), G2: 25% autoclaved SBp fed group, G3: 25% acid-treated SBp fed group, G4: 50% autoclaved SBp fed group, G5: 50% acid-treated SBp fed group. * Fish body chemical composition was calculated on a dry matter basis.
Table 8. Effect of soybean meal replacement by shrimp by-product meals on fecal chromic oxide % (* FCO) and dry matter digestibility (DMD) % in African catfish (Clarias lazera) (mean ± SE), n = 9.
ParametersG1G2G3G4G5
FCO (%)2.56 ± 0.006 c2.59 ± 0.011 b,c2.65 ± 0.017 a,b,c2.66 ± 0.017 a,b2.74 ± 0.022 a
DMD (%)80.46 ± 0.050 c80.61 ± 0.07 b,c81.16 ± 0.12 a,b81.16 ± 0.13 a,b81.78 ± 0.15 a
Values with different letters at the same row (a–c) differ significantly at p ≤ 0.05. G1: Basal-diet-fed group (control), G2: 25% autoclaved SBp fed group, G3: 25% acid-treated SBp fed group, G4: 50% autoclaved SBp fed group, G5: 50% acid-treated SBp fed group. * FCO was calculated on a dry matter basis.
Table 9. Effect of soybean meal replacement by shrimp by-product meals on economic (1 EGP) performance in African catfish (Clarias lazera).
DietsFeed Cost/ToneDecreased the Feed Costs (%)2 EFCR3 Diet Cost/kg Weight GainRelative to Control (%)Decrease in Feed Cost/kg Weight Gain (%)
D142590.001.215.1510000
D241043.641.174.8093.206.80
D341043.641.164.7692.437.57
D439497.281.144.5087.3812.62
D539497.281.114.3885.0514.95
1 Rat of one USD = EGP 15.7 at experimental period. 2 EFCR = economic feed conversion rate. 3 Feed costs/kg weight gain = EFCR × costs of kg feed.
Publisher’s Note: MDPI stays neutral with regard to jurisdictional claims in published maps and institutional affiliations.

