Article

Identification and Expression Characterization of the Smad3 Gene and SNPs Associated with Growth Traits in the Hard Clam (Meretrix meretrix)

1
Zhejiang Key Laboratory of Aquatic Germplasm Resources, Zhejiang Wanli University, Ningbo 315100, China
2
College of Fisheries, Henan Normal University, Xinxiang 453007, China
3
Ninghai Institute of Mariculture Breeding and Seed Industry, Zhejiang Wanli University, Ningbo 315604, China
*
Authors to whom correspondence should be addressed.
Fishes 2021, 6(4), 83; https://doi.org/10.3390/fishes6040083
Submission received: 6 November 2021 / Revised: 8 December 2021 / Accepted: 13 December 2021 / Published: 16 December 2021

Abstract

:
It has been demonstrated that the sekelsky mothers against decapentaplegic homolog 3 (Smad3) plays an important role in the growth and development of vertebrates. However, little is known about the association between the Smad3 gene and the growth traits of mollusks. In this study, Smad3 from the hard clam Meretrix meretrix (Mm-Smad3) was cloned, characterized, and screened for growth-related single nucleotide polymorphisms (SNPs) in its exons. The full-length cDNA of Mm-Smad3 was 1938 bp, encoding a protein with 428 amino acid residues. The protein sequence included an MH1 (27–135 aa) and MH2 domain (233–404 aa). Promoter analysis showed that the promoter sequence of Mm-Smad3 was 2548 bp, and the binding sites of Pit-1a, Antp, Hb, and other transcription factors are related to the growth and development of hard clams. The phylogenetic tree was divided into two major clusters, including mollusks and vertebrate. The expression level of Mm-Smad3 was predominantly detected in the mantle and foot, while extremely less expression was observed in the digestive gland. The low expression level of Mm-Smad3 was detected at the stages of unfertilized mature eggs, fertilized eggs, four-cell embryos, blastula, gastrulae, trochophore, and D-shaped larvae, whereas an opposite trend was observed regarding the highest expression at the umbo larvae stage (p < 0.05). In the mantle repair experiment, the time-course expression profiles showed that compared to the expression level at 0 h, Mm-Smad3 significantly decreased at 6 h (p < 0.05) but increased at 12 and 48 h. Further, the association analysis identified 11 SNPs in the exons of Mm-Smad3, of which three loci (c.597 C > T, c.660 C > T, c.792 A > T) were significantly related to the growth traits of clam (p < 0.05). Overall, our findings indicated that Mm-Smad3 is a growth-related gene and the detected SNP sites provide growth-related markers for molecular marker-assisted breeding of this species.

1. Introduction

Drosophila mothers against decapentaplegic proteins (Smads) are pivotal intracellular molecules that transfer signals of transforming growth factor-β (TGF-β) super-family members from the cell surface to the nucleus [1]. The TGF-β superfamily members, including TGF-βs, activins, bone morphogenetic proteins, and growth/differentiation factors, transduce signals via serine/threonine kinase receptors on the cell surface, then forming heteromeric complexes, and consequently propagating through phosphorylation of Smad proteins [2]. Eight distinct Smad proteins, which were classified into three functional groups: receptor-activated (R-Smads), common Smads (Co-Smads), and inhibitory Smads (I-Smads), have been identified in mammals [3]. Smad3, one of R-Smads, is an important intracellular signaling effector for the TGF/activin signaling pathway. It has been identified and characterized in a wide range of species ranging from worms to mammals [4,5,6,7,8], and plays a critical role in cell proliferation and differentiation [9], embryonic development [10], tissue homeostasis and growth, fibrosis [11], bone formation [12] and rebuilding [13], disease treatment [14,15], and wound healing [16] in vertebrates. Smad3 has been identified and analyzed in the pearl oyster Pinctada fucata [17], chlamys Azumapecten farreri [18], and blood clam Tegillarca granosa [19], showing that Smad3 has the highest expression level in the mantle. The mantle is the main organ for shell formation and regulates the extracellular growth of crystals, and secretes matrix proteins [20].
The hard clam (Meretrix meretrix) is mainly distributed in the coastal area of Asia, and is one of the four major cultured bivalves in China [21]. The clam has become a popular seafood because of its particularly delicious taste and high nutritional value. In addition, it also has a variety of medicinal effects, such as lowering blood sugar and lowering blood lipids [21]. However, the clams farmed currently still come from genetically wild germplasms, which have decreased the genetic diversity after many years of artificial breeding and frequent inbreeding. As a result, the cultured clams or unselected populations generally show slow growth, small individuals, poor stress resistance, and susceptibility to disease. Though a selective breeding program for genetic growth trait improvement of M. meretrix has been carried out [22], its phenotypic selection and stress resistance traits need further enhancement for genetic breeding programs. It is well known that the application of molecular markers would further increase the selection efficiency for rapid breeding progress [23,24]. At present, limited research has been reported on growth-related genes in M. meretrix, such as growth factor receptor-bound protein 2 (GRB2) [25], sulfotransferase-like [26], and serum amyloid A [27]. It showed that a large number of studies about the application of the Smad3 gene in animal production mainly focused on aspects of growth regulation, development, cell immunity and apoptosis, and the reproductive performance of animals [28]. Therefore, it is necessary to clarify the function of Smad3 gene, and then to carry out molecular-assisted breeding to cultivate new varieties with high quality, high yield, and strong disease resistance for the sustainable development of clam aquaculture industries. In this study, the cDNA and promoter of Mm-Smad3 were cloned, and its expression levels were further detected in different tissues and developmental stages. Furthermore, we also analyzed the association between the SNPs of Mm-Smad3 and growth traits. Our findings will provide valuable information for selective breeding programs of M. meretrix.

2. Materials and Methods

2.1. Sample Collection and Preparation

The adult clams (wet weight = 13.49 ± 3.58 g, shell length = 36.58 ± 3.16 mm) were collected from Ningbo Ocean and Fishery Science and Technology Innovation Base (Ningbo, China). The clams were acclimatized in at 22–25 °C and 20 ppt salinity in the laboratory. The foot tissue of more than 100 individuals was dissected for SNP analysis. Six tissues (gill, siphon, digestive gland, adductor muscle, mantle, and foot) from four clams were sampled for tissue mRNA expression and gene cloning. The embryos and larvae from different developmental stages (unfertilized mature eggs, fertilized eggs, 4-cell embryos, blastula, gastrulae, trochophore, D-shaped larvae, umbo larvae, eyebot larvae, and juvenile clams) were collected through artificial propagation and artificial insemination. The tissues and larvae samples were immediately frozen in liquid nitrogen and then stored at −80 °C until RNA extraction.

2.2. Cloning of Full-Length cDNA and Promoter

Total RNA was isolated from the foot tissue of clams with Trizol reagent (Sangon, Shanghai, China) according to the manufacturer’s instructions. RNA quality was examined by electrophoresis with 1.0% agarose gel and stained with ethidium bromide. RNA quantity was assessed by ultraviolet spectrophotometry. Total RNA was reverse-transcribed into cDNA as the template for full-length cDNA isolation with SMART RACE reagent (Clontech, Mountain View, CA, USA).
The expressed sequence tag (EST) homologous to Mm-Smad3 of clam was detected through the 454 cDNA library of M. meretrix (GenBank accession no. SRX023927). A pair of gene-specific primers, GSP1 for the 5′-end cDNA sequence and GSP2 for the 3′-end cDNA sequence (Table 1), were designed on the basis of the EST sequence of the Mm-Smad3 gene. The PCR amplification of the 5′-end cDNA sequence and 3′-end cDNA sequence was synthesized according to the instructions of the SMARTerTM RACE cDNA amplification kit (Clontech, Mountain View, CA, USA). Polymerase chain reaction (PCR) products were examined on 1.0% agarose gels, and purified by a Gel Extraction Kit (TIANGEN, Beijing, China). The purified PCR products were cloned into pEasy-T1 (Trans, Beijing, China), and the connected vectors were transformed into E. coli DH5α, and the positive plasmids were selected and sequenced. A pair of gene-specific primers, Mm-Smad3-F and Mm-Smad3-R (Table 1), were designed based on the acquired full-length cDNA sequence to confirm the accuracy of cloning and sequencing of Mm-Smad3. The full-length cDNA was re-amplified with high-fidelity polymerase (TaKaRa, Beijing, China). The purified PCR product was cloned into pEasy-T1 Vector and re-sequenced as described above.
Genomic DNA was isolated from the mantle tissues by the phenol–chloroform method and purified with the DNA purification reagent kit (TaKaRa). The diluted DNA (50 ng/µL) was digested respectively by DraΙ, EcoRV, PvuII, and StuΙ enzyme to construct the genomic DNA library using the Universal Genome Walker™ 2.0 (Clontech, Mountain View, CA, USA). The promoter sequence of Mm-Smad3 was synthesized using an Advantage 2 PCR kit (Clontech, Mountain View, CA, USA). The constructed genomic DNA library was used as the template of the PCR reaction. All PCR products were electrophoresed on 1% agarose gels. The purified PCR products were connected, transformed, and sequenced. Then, the accuracy of the cloning and sequencing of Mm-Smad3 was confirmed according to the procedures described above.

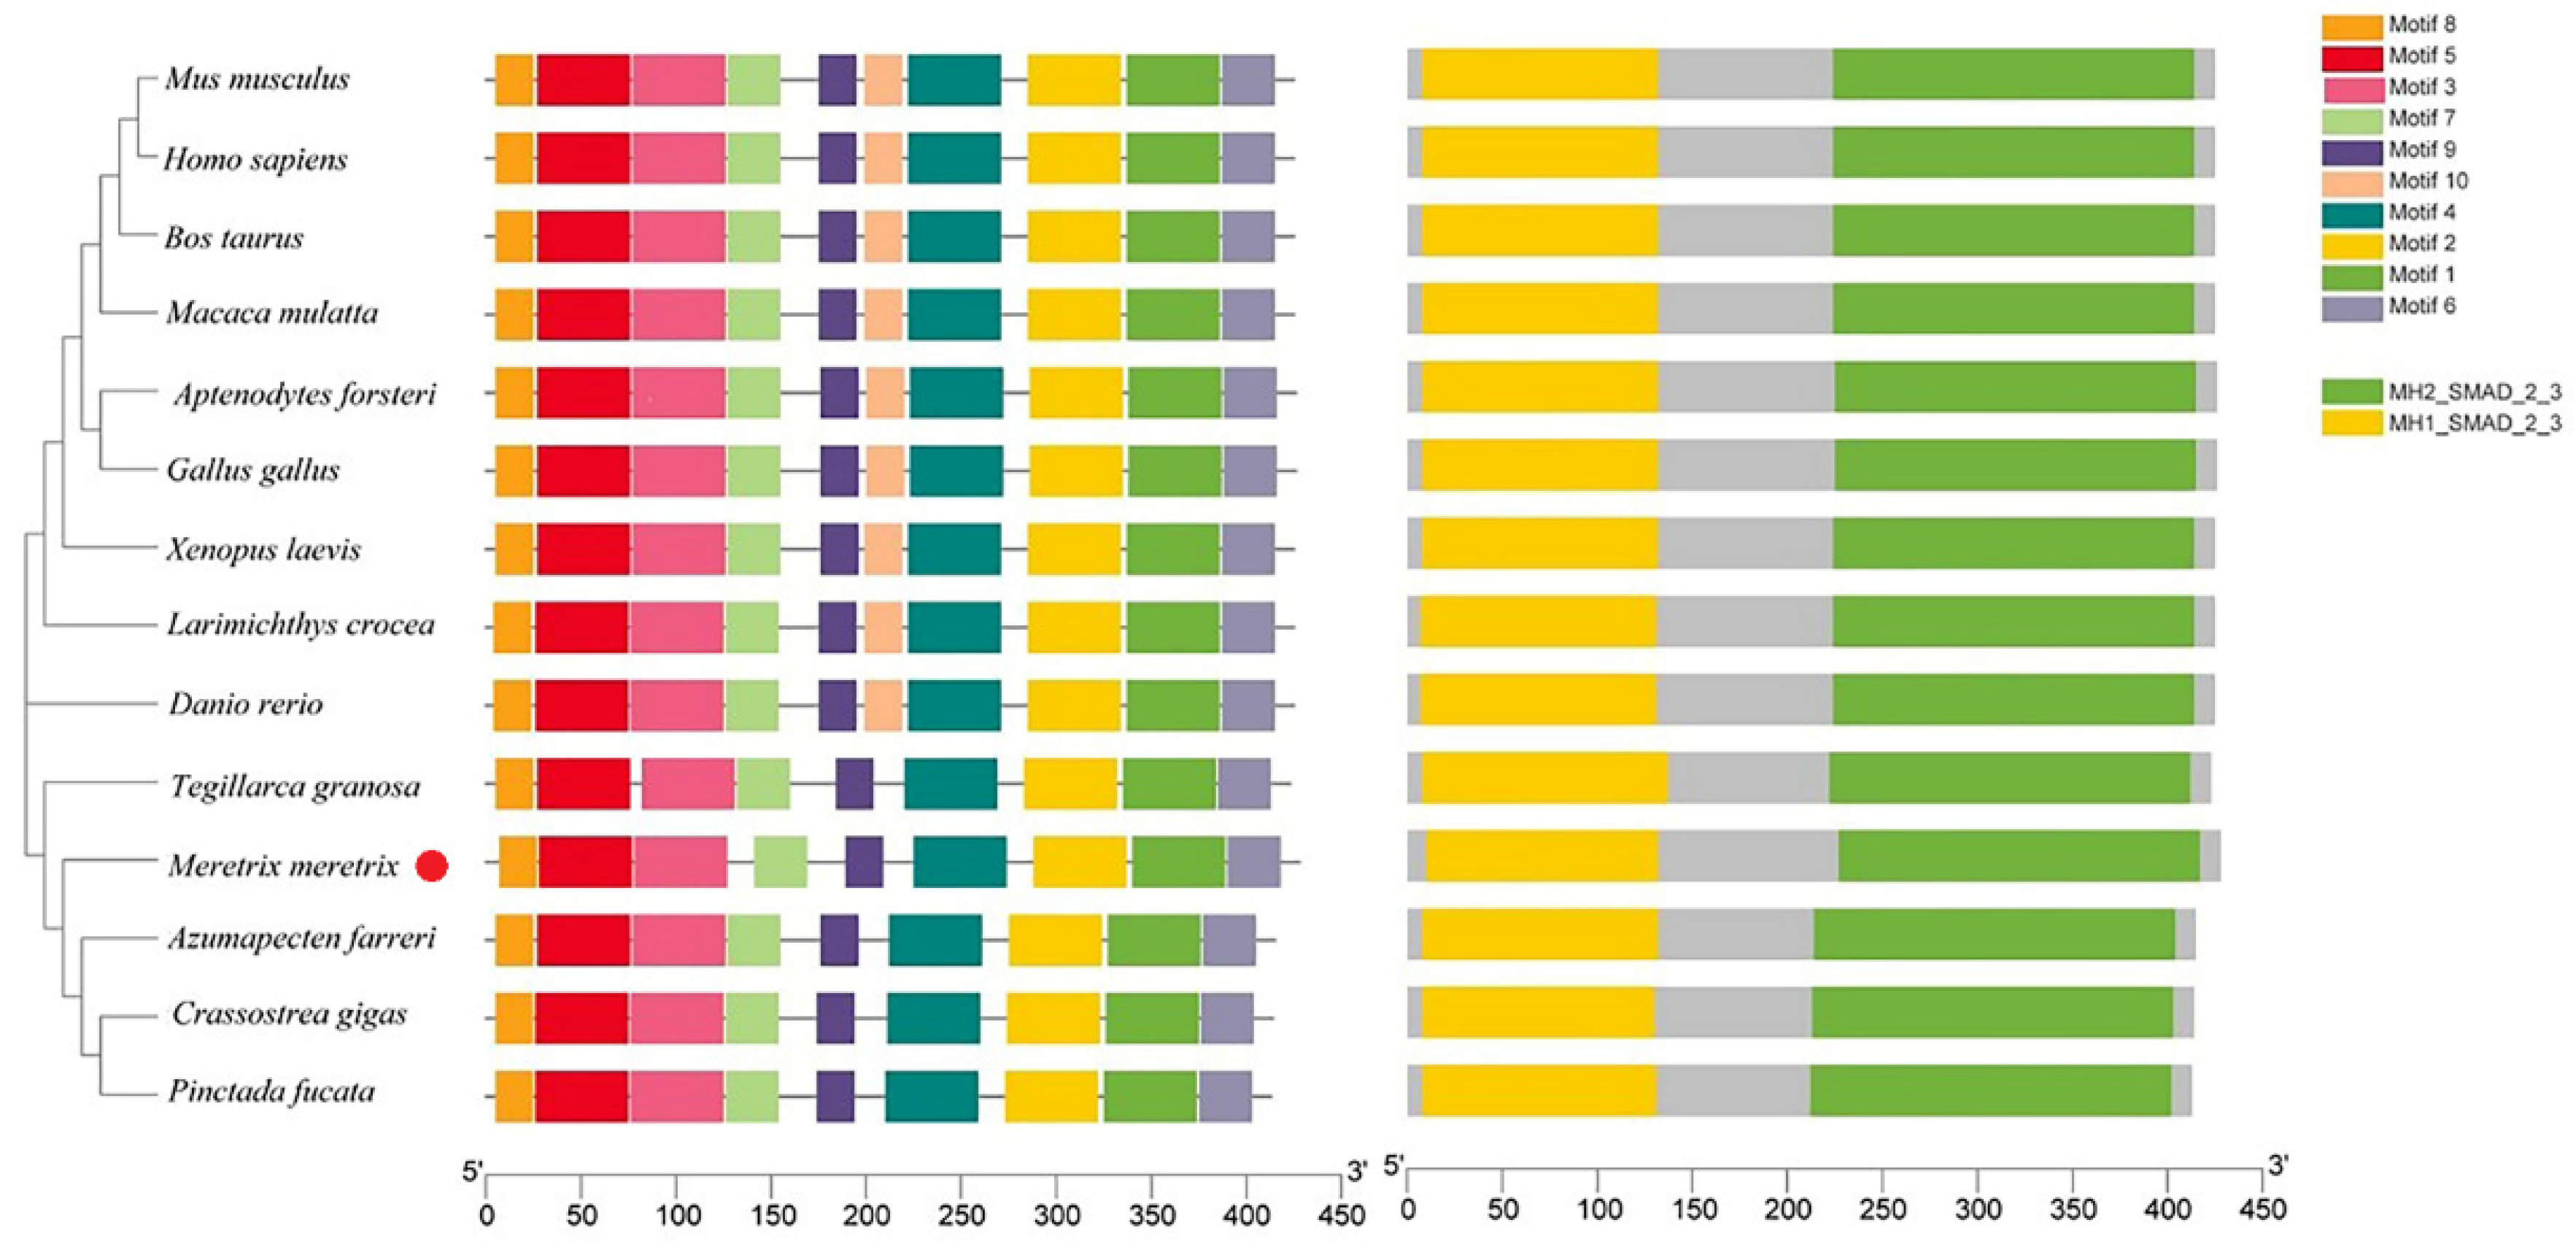
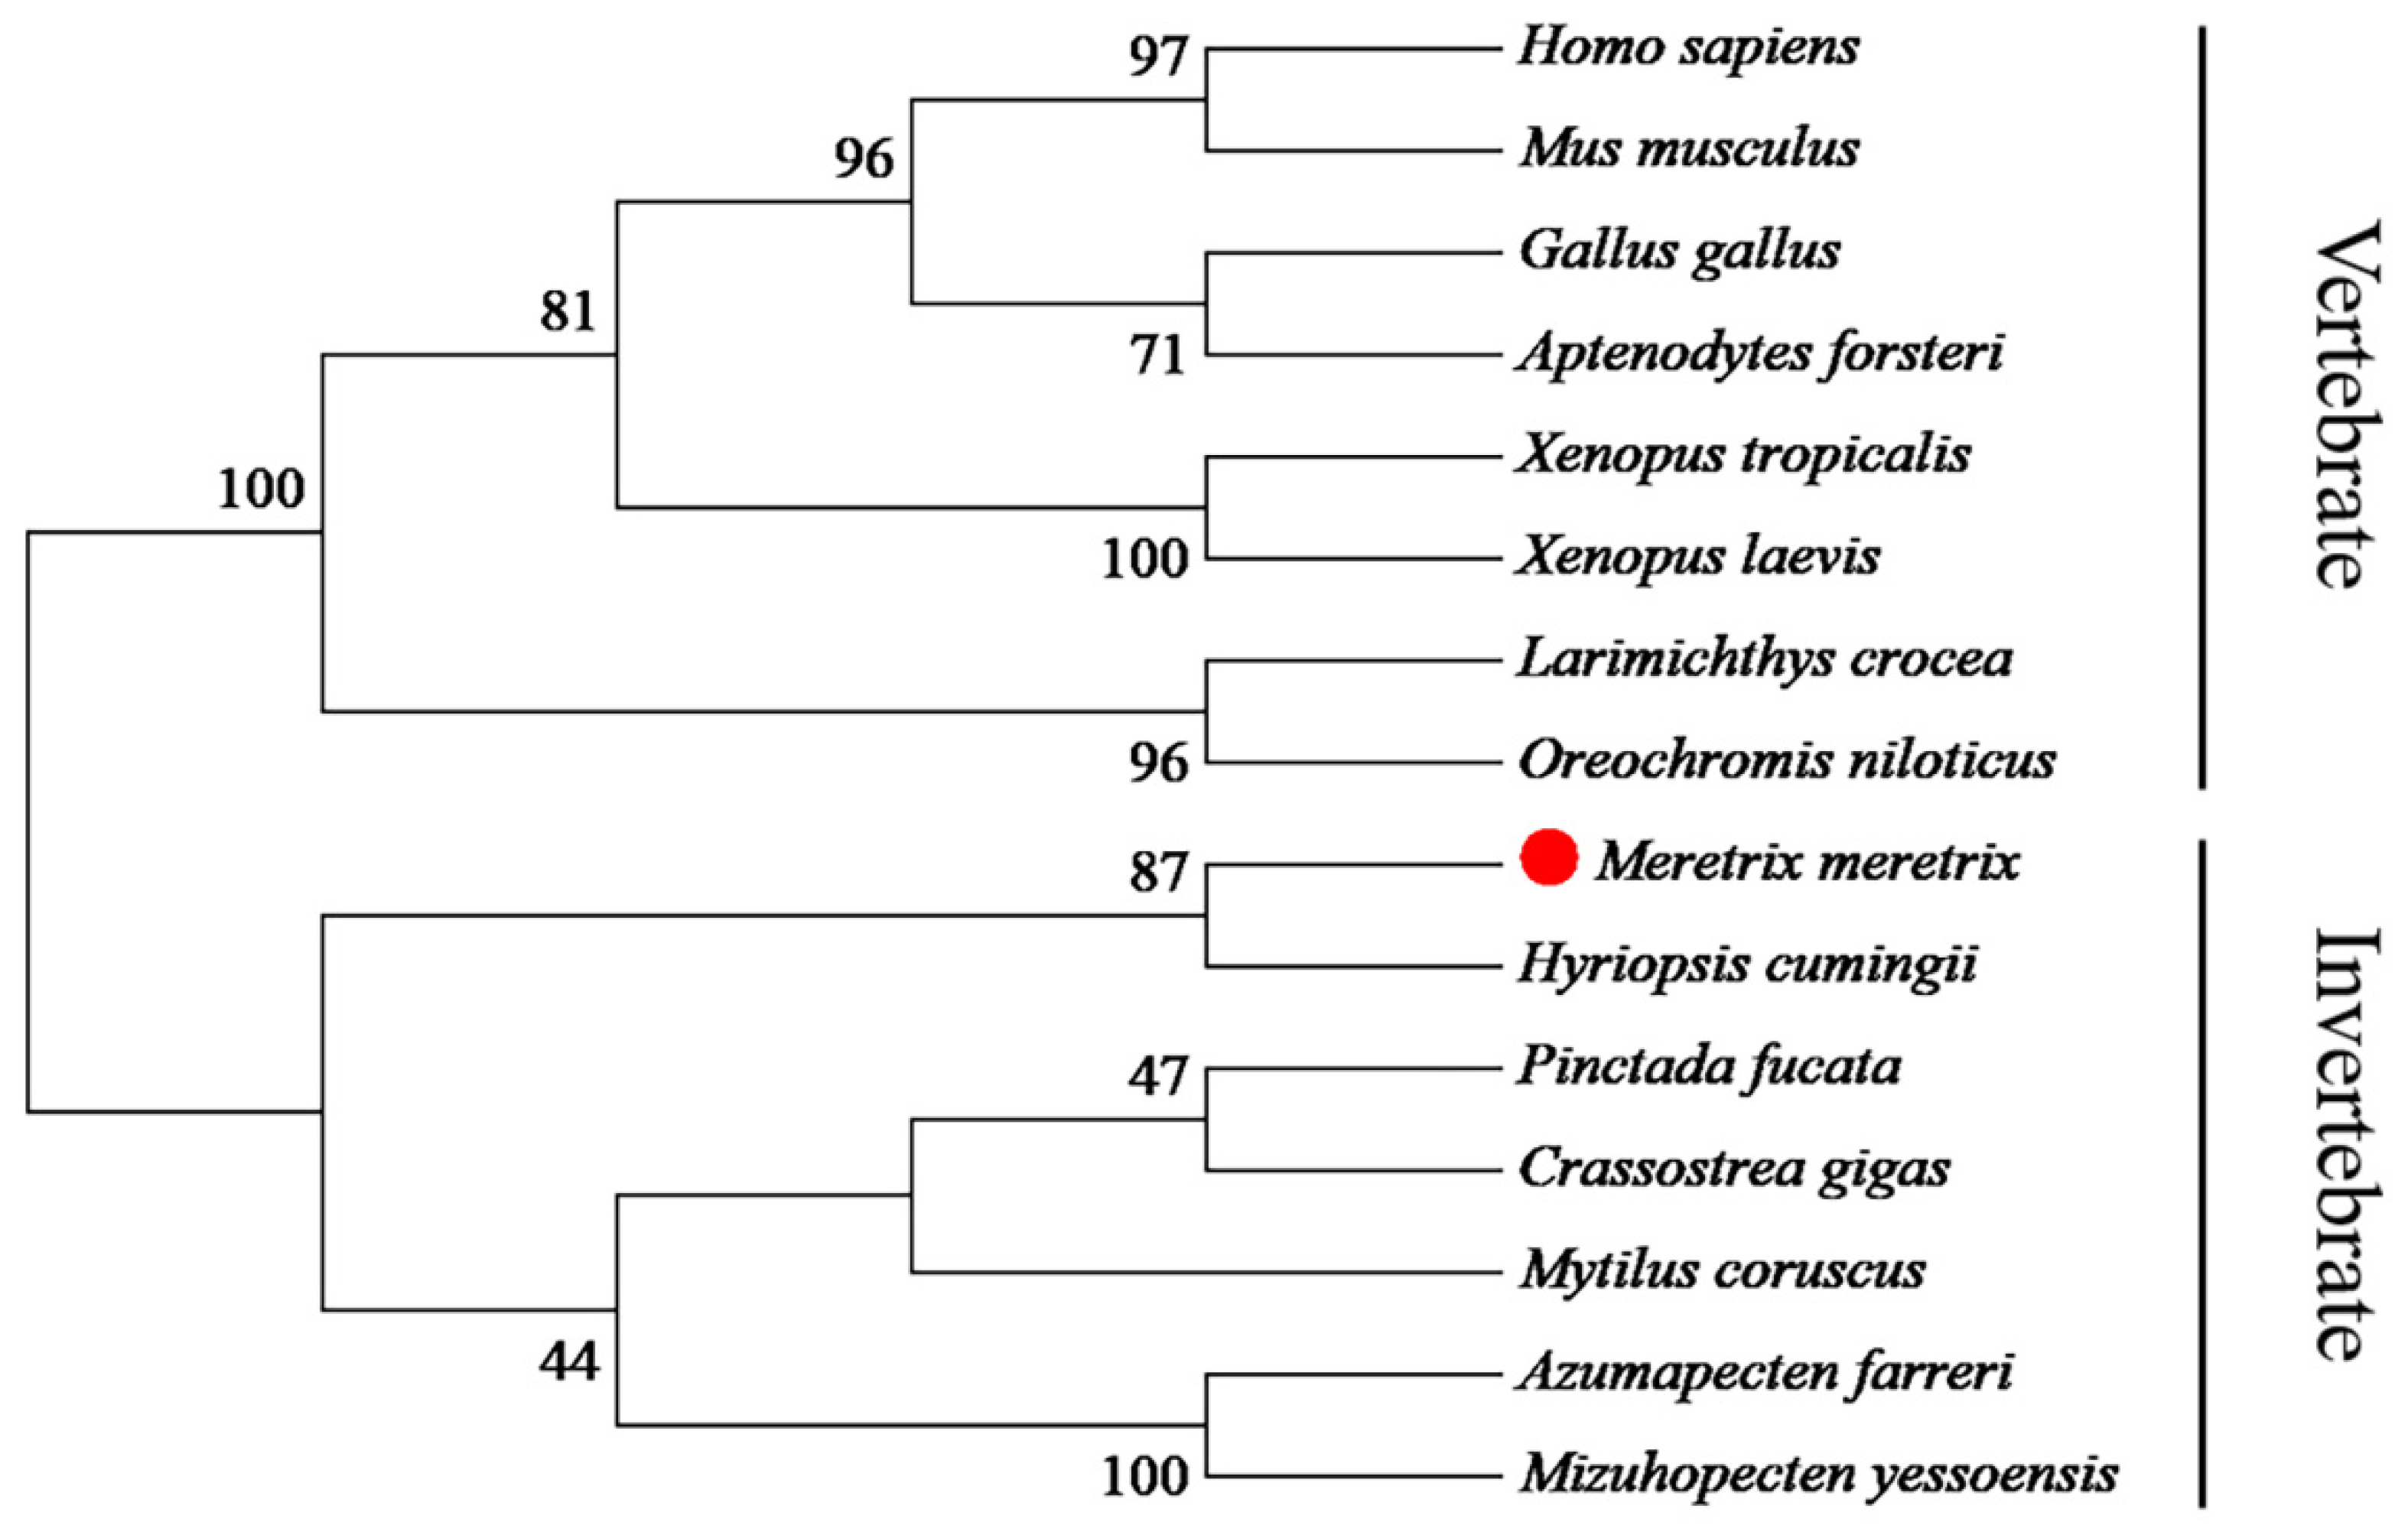
2.3. Sequence and Phylogenetic Analysis

The cDNA sequence was assembled using the BLASTX search program of the National Center for Biotechnology Information (NCBI). The open-reading frame (ORF) and amino acid sequences were deduced by DNAMEN 7.0 software. The theoretical isoelectric point (pI) and molecular weight (Mw) of protein were calculated using Compute pI/Mw Tool. The conserved domain of the deduced Mm-Smad3 was predicted by the simple modular architecture research tool (SMART). The secondary structure of the deduced Mm-Smad3 amino acid sequence was analyzed using the SWISSMODEL tool. Smad3 amino acid multiple sequences of M. meretrix and other species were aligned using ClustalW2 program. The neighbor-joining (NJ) method from Molecular Evolutionary Genetics Analysis (MEGA 6.0) software was used to construct an unrooted phylogenetic tree, based on the deduced amino acid sequences of the Smad3 proteins. The aligned sequences were bootstrapped 1000 times to derive the confidence values for the phylogenetic analysis. Transcription Factor Binding Sites (TFBSs) of the Mm-Smad3 5′ flanking region were predicted using TRANSFAC and AliBaba 2 software. CpG island was analyzed by EMBOSS Cpgplot. BDGP was used to predict the transcription start sites of Mm-Smad3.

2.4. Quantitative Expression Analysis

The real-time quantitative reverse transcription PCR (qRT-PCR) was implemented to analyze the mRNA quantitative expression levels of Mm-Smad3 at different developmental stages (n > 500, three sets of samples per stage) and different adult tissues (n = 4, four sets of samples per tissue). A pair of gene-specific primers (Mm-Smad3 qRT-F/R, Table 1) were used to quantitatively detect the expression level of Mm-Smad3. The 18S rRNA was used as an internal reference. The qRT-PCR reactions were performed in a final volume of 20 µL of iTaq Universal SYBR Green Supermix (Bio-Rad, Herculesc, CA, USA), 7.2 μL of deionized water, 0.8 μL of the first strand cDNA, and 1 μL of each primer. Amplification was carried out in the following conditions: incubation of 20 s at 94 °C, 40 cycles of 3 s at 94 °C, 15 s at 60 °C and 10 s at 72 °C, a final extension of 7 min at 72 °C. All amplifications were performed in triplicate as biological replicates, and negative controls were run in the absence of cDNA templates.

2.5. Mantle Repair Experiment

The mantle incision was carried out after accommodation for 7 days. In the experimental group, a piece of mantle was collected from the clams after anesthesia. No treatment on clams was performed in the control group. All clams were fed with the microalgae Isochrysis galbana in the morning and evening. Four individuals were then sampled from the control group (0 h) and experimental group at 4, 12, 24, 48, 96, and 168 h, respectively. The total RNA of the mantle tissues was extracted for qRT-PCR, as described above.

2.6. SNPs and Their Association with Growth Traits

To detect SNPs in the exons of the Mm-Smad3 gene, two pairs of primers (Mm-Smad3-esF1/R1 and Mm-Smad3-esF2/R2, Table 1) were designed to amplify genomic DNA from 100 clams collected from one population in Ningbo City, Zhejiang Province, China. Before dissection, the shell length, height, width, and wet weight of the clams were measured with a vernier caliper (1 mm accuracy) and an electronic scale (0.01 g accuracy). The RNA was extracted from the adductor muscle of all clams, and then the cDNA was synthetized using the methods described above. The PCR products were verified by sequencing, and the sequence alignment was conducted using MEGA6.0 software. The correlation relationship between SNPs and growth traits was analyzed using SPSS 20.0. One-way ANOVA was adopted to compare the difference among these genotypes.

2.7. Statistical Analysis

The original normalized Ct-values (Ct interest–Ct housekeeping) were used to statistically compare the relative expression level of Mm-Smad3. The CT for the target amplified products of Mm-Smad3 and the internal control 18S were determined for each sample. The difference in the Ct between the target and the internal control is called the normalized Ct(ΔCt). ΔΔCt is a subtraction of the maximum ΔCt from the normalized Ct. The expression level of Mm-Smad3 was calculated by the 2-ΔΔCT comparative Ct method [29]. The relative mRNA expression data and quantitative data of Mm-Smad3 were presented as mean ± standard error. One-way ANOVA using Tukey was adopted for analysis of the expression differences in various developmental stages, in different adult tissues, as well as expression levels and growth-related SNPs. All statistical analysis was performed using software SPSS 20.0. A p-value less than 0.05 (p < 0.05) was considered as statistically significant.

3. Results

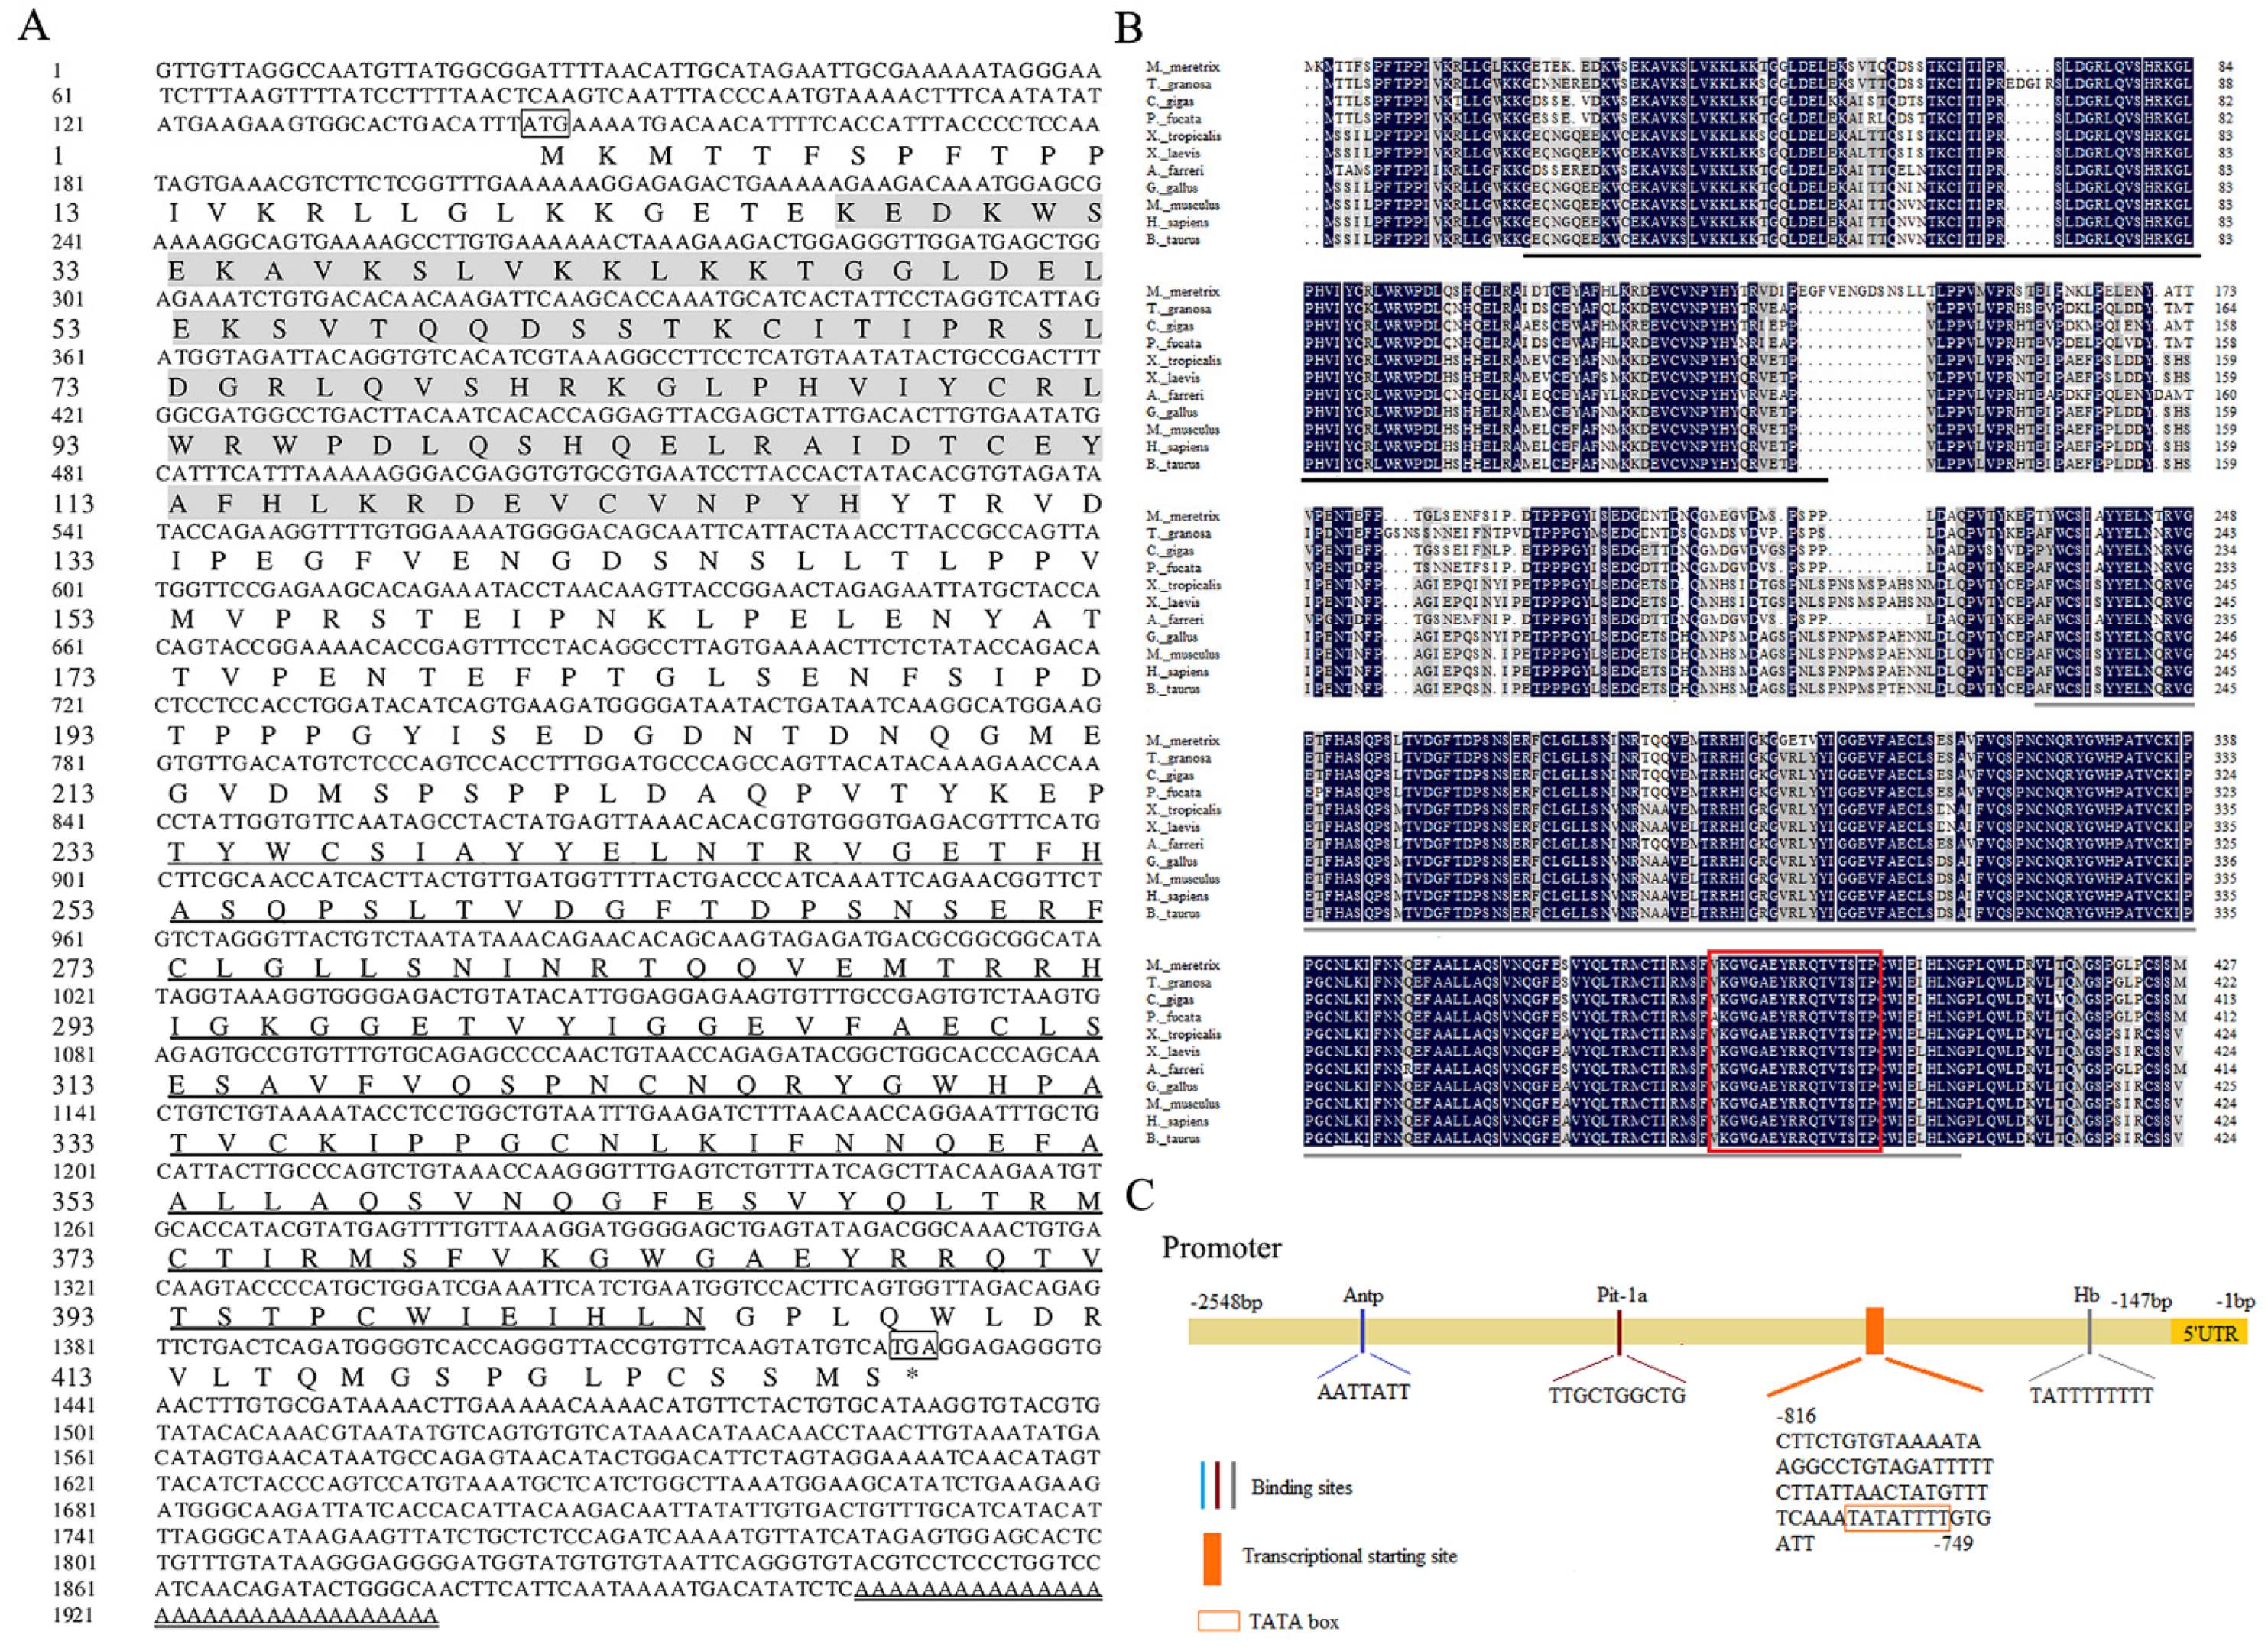
3.1. cDNA and Promoter Sequence Analysis of Mm-Smad3

The cDNA sequence of Mm-Smad3 was deposited in the GenBank database under accession number APW85816.1. The complete length of Mm-Smad3 cDNA was 1938 bp, which contained a 5′ untranslated region (UTR) of 143 bp, an open reading frame (ORF) of 1284 bp encoding a polypeptide of 428 amino acid residues, and a 3′ UTR of 475 bp including a stop codon (TAG), a polyadenylation signal (AATAAA), and a 33 bp poly(A) tail (Figure 1A). The predicted molecular weight of the deduced protein was 48.14 kDa, including a MH1 domain (27–135 aa), a MH2 domain (233–404 aa), and the theoretical isoelectric point was 5.80.
The multiple comparisons between the Smad3 of mollusks and model animals showed that Mm-Smad3 had high similarity with vertebrates. Especially, it exhibited higher similarity with mollusks including Pinctada fucata (85.5%), Azumapecten farreri (84.9%), Crassostrea gigas (83.4%), and Tegillarca granosa (83.1%) (Figure 1B).
The promoter sequence of Mm-Smad3 was amplified by genome walking technology. The length of the 5′ proximal promoter of Mm-Smad3 was 2548 bp. A total of three possible promoter core sequences were predicted, of which only the transcription start site -776A upstream contained the conserved TATA box. The promoter contained 14 potential transcription initiation sites and 258 transcription factor binding sites, among which Pit-1a, Antp, Hb, etc. were related to the growth and development (Figure 1C). In addition, the software predicted that there were no CpG island and random repetitive elements in the proximal promoter sequence of Mm-Smad3.
The phylogenetic tree indicated that Smad3 proteins were divided into two clusters (vertebrate and invertebrate) (Figure 2). The Smad3 from M. meretrix and other mollusks were clustered together as one subgroup, with the other subgroup composed of fish, amphibians, birds, and mammals. Notably, Samd3 of Hyriopsis cumingii was firstly clustered together with Mm-Smad3 in the former subgroup. The domain prediction and motif analysis of Samd3 showed that the MH1 domain, MH2 domain, and motif1 to motif 9 of all tested species were extremely similar but motif 10 only existed in vertebrates, not in bivalves (Figure 3).

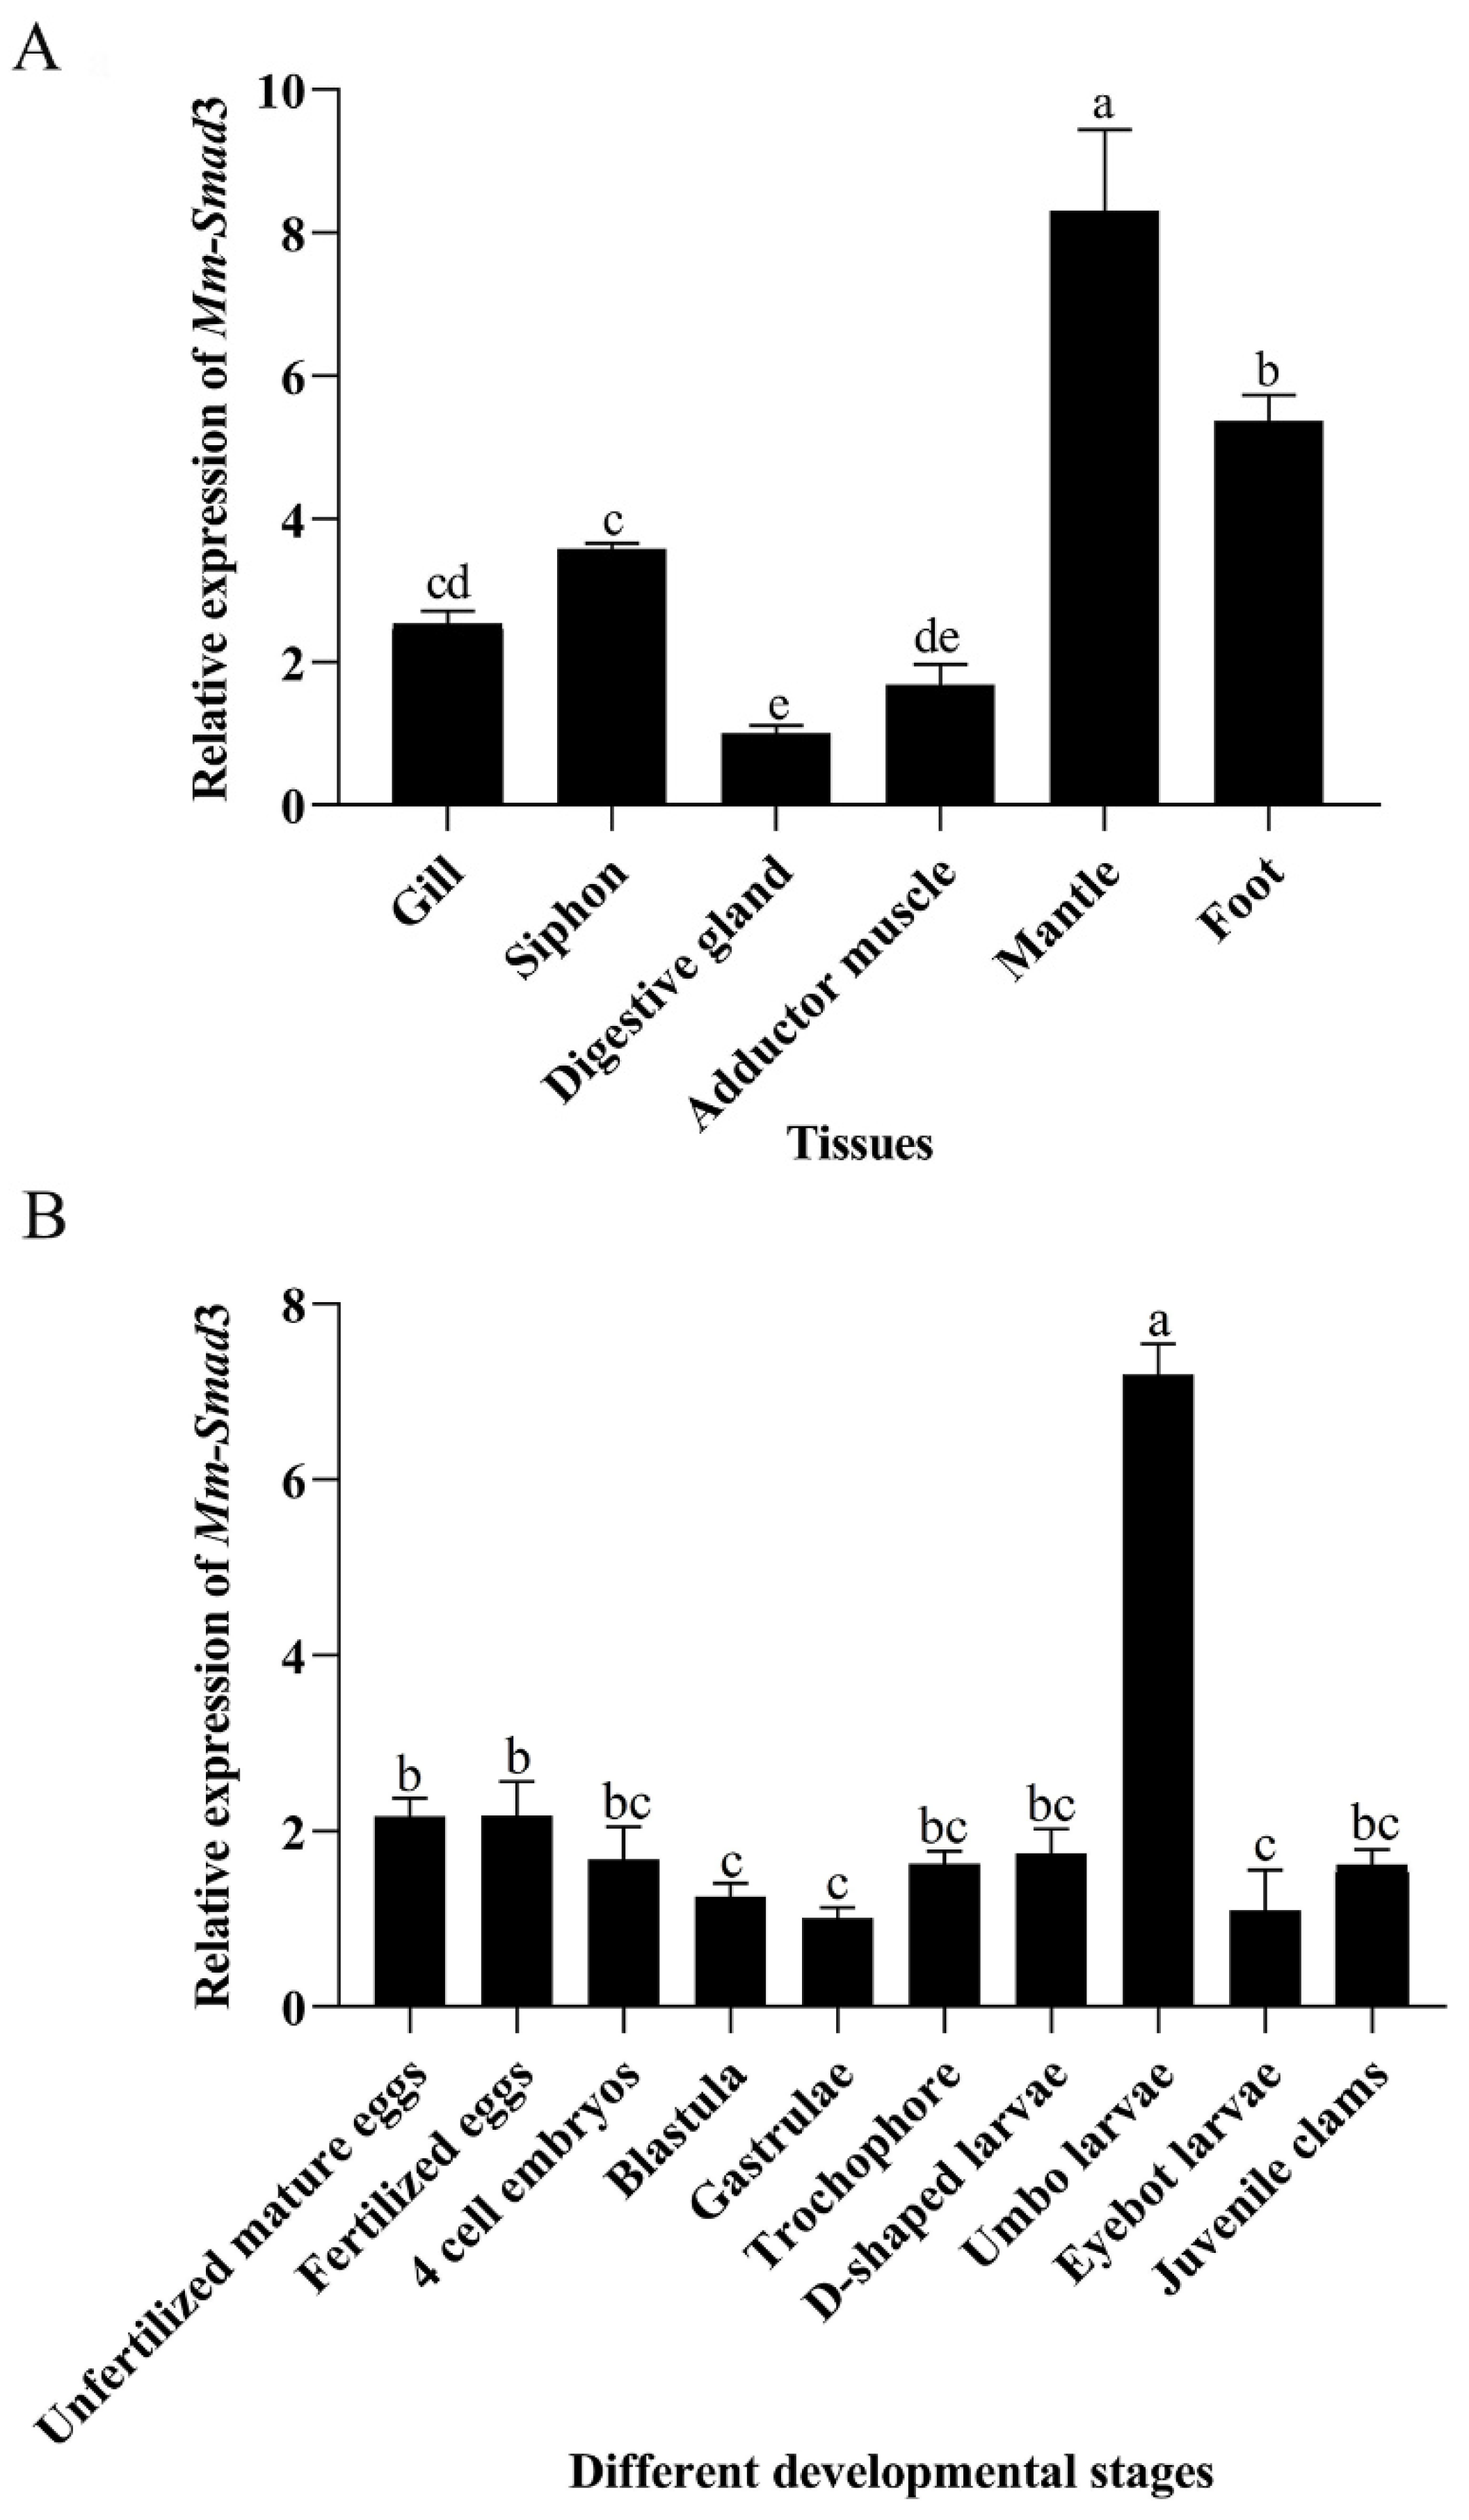
3.2. Tissue and Developmental Stage Quantitative Expression of Mm-Smad3

The tissue and developmental stage-specific expression levels of Mm-Smad3 were determined by qRT-PCR. The result showed that Mm-Smad3 was highly expressed in the mantle and foot, especially in the mantle (p < 0.05), but was lower in the gill, siphon, digestive gland, and adductor muscle (Figure 4A). The expression levels of Mm-Smad3 were much lower prior to the D-shaped larvae, including unfertilized mature eggs, fertilized eggs, 4-cell embryos, blastulae, and gastrulae, but gradually increased in the subsequent developmental stages, with the highest levels in umbo larvae (p < 0.05), and then dropped sharply (Figure 4B).

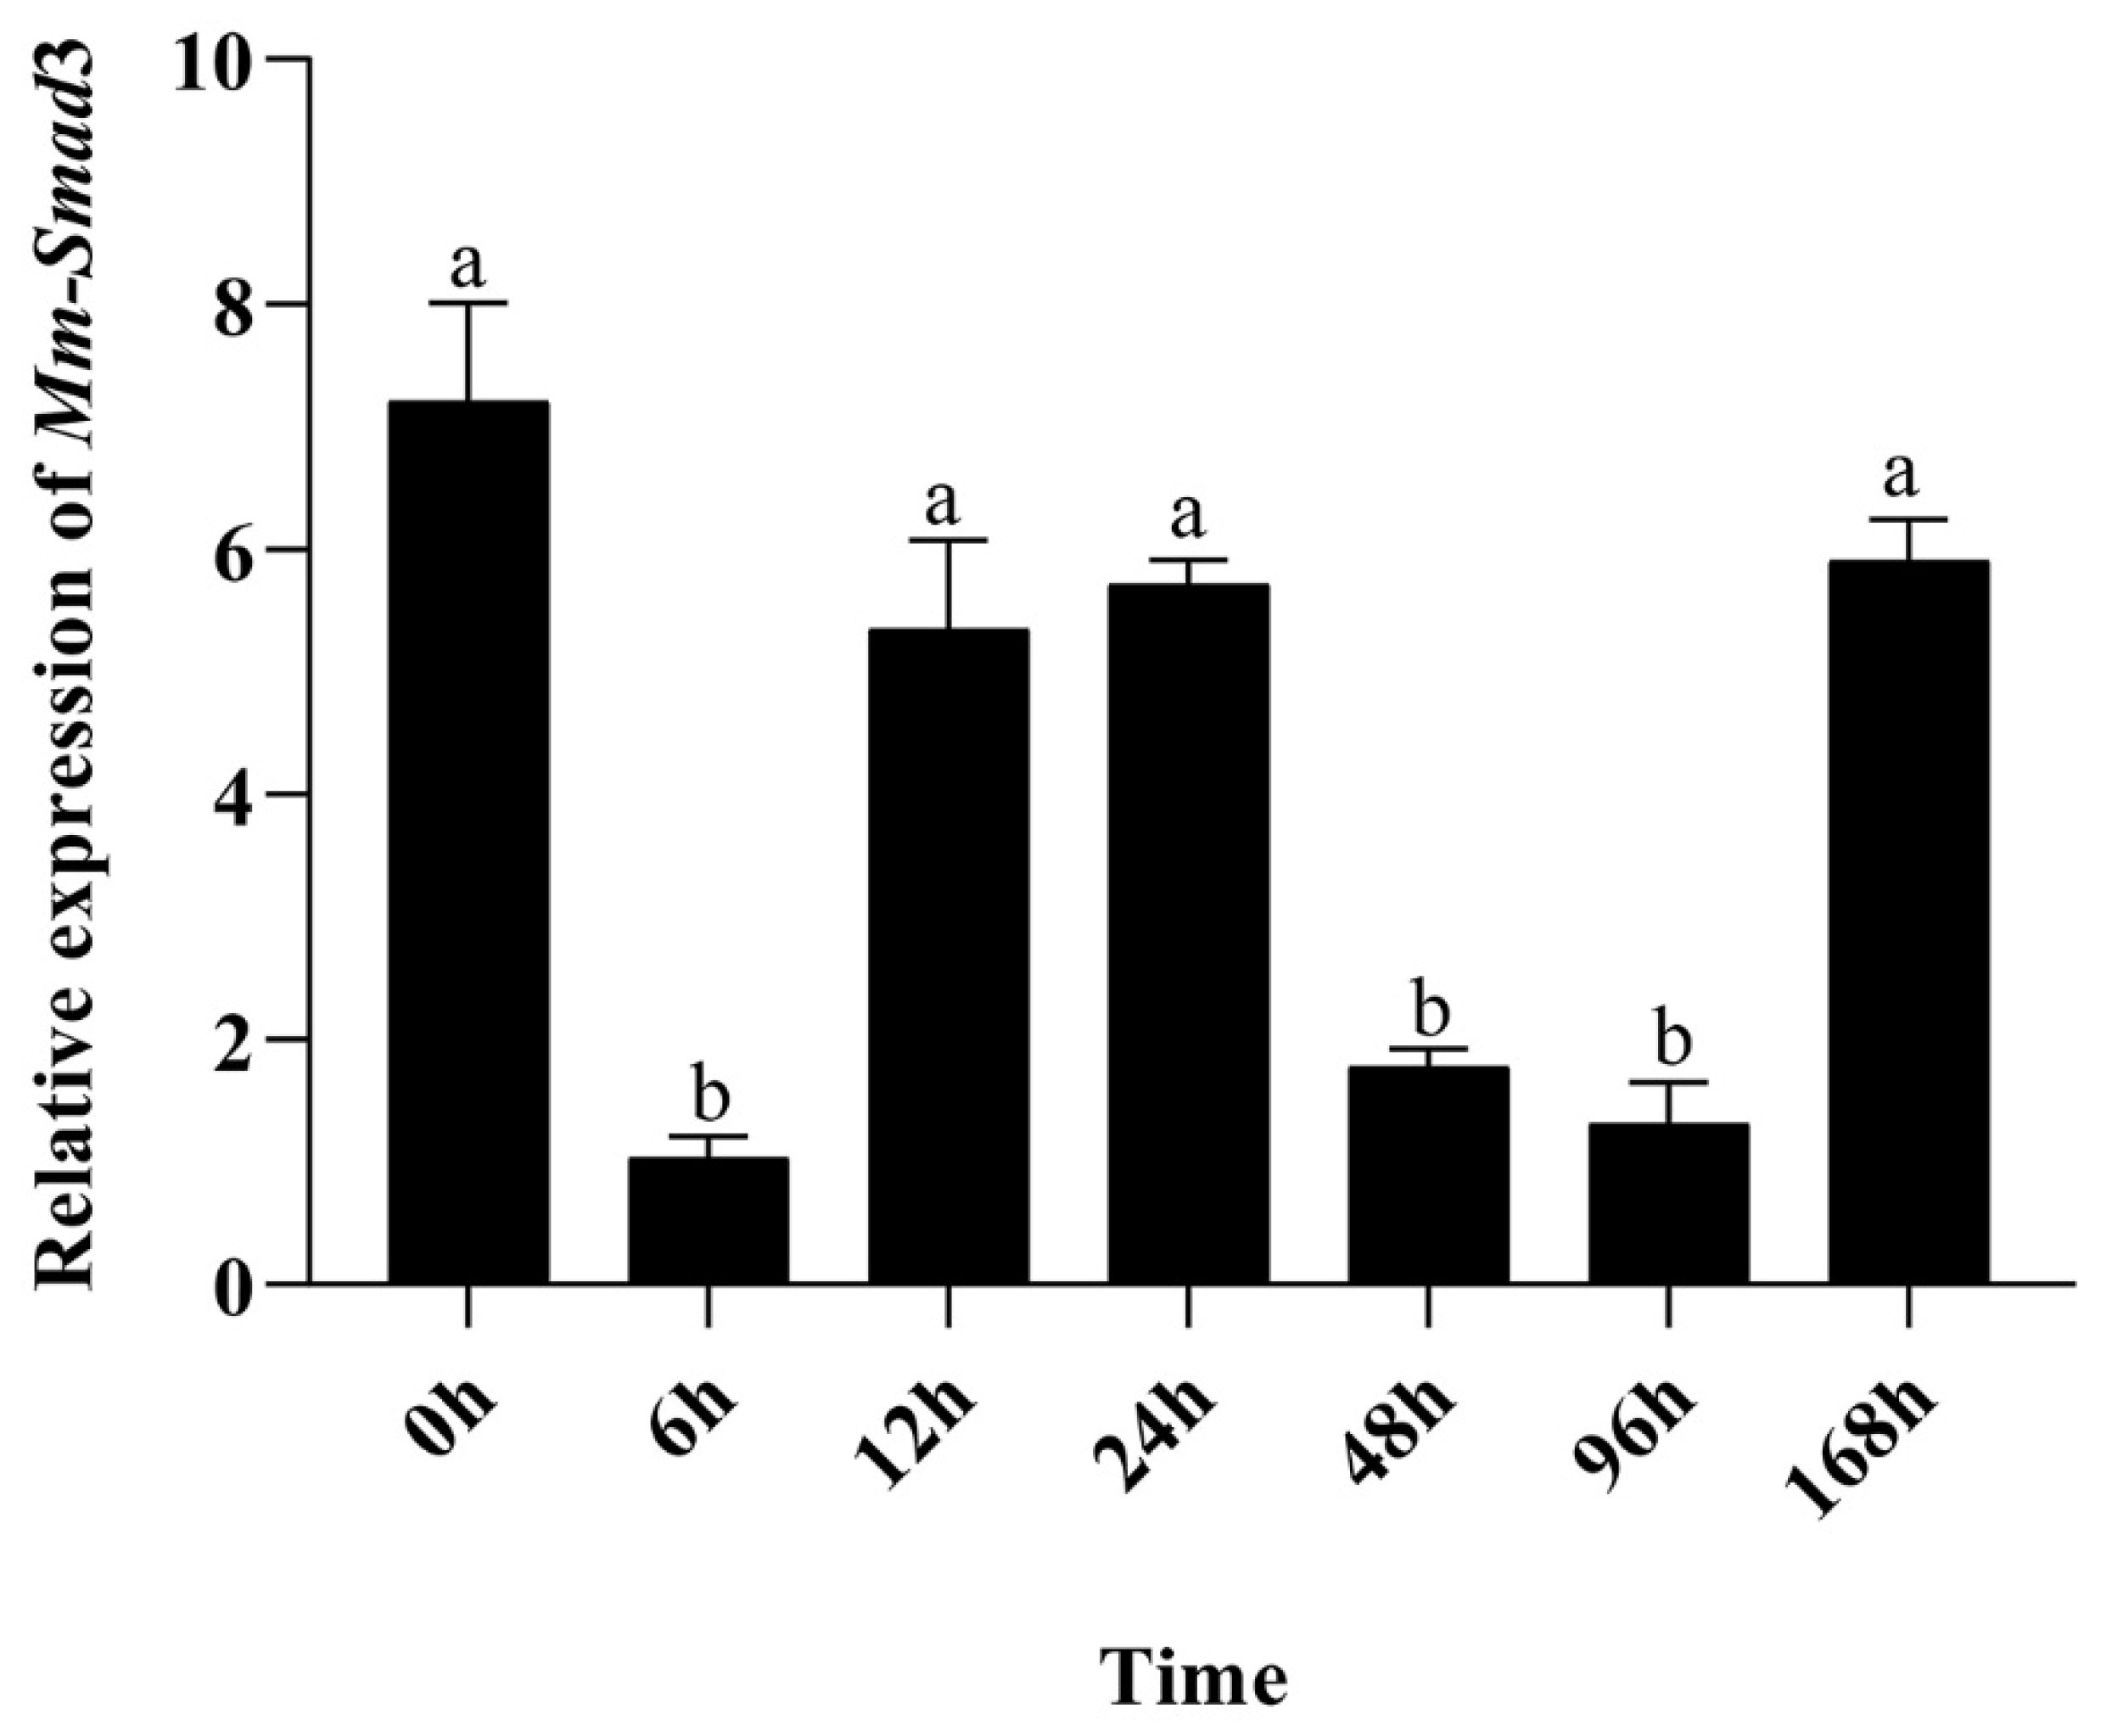
3.3. Time-Course Quantitative Expression of Mm-Smad3 after the Mantle Repair Experiment

The qRT-PCR results showed that the expression levels of Mm-Smad3 in the experiment group decreased during the wound healing process as compared with that in the control group (Figure 5). With mantle repair progression, the expression level of Mm-Smad3 decreased significantly at 6 h but increased significantly after 12 and 24 h, and dropped significantly again at 48 and 96 h, and then began to increase at 168 h (p < 0.05).

3.4. Growth-Related SNPs in Mm-Smad3 Exons

We sequenced the full-length cDNA of Mm-Smad3 of the 100 clams. A total of 11 polymorphic loci were screened in the coding sequence of Mm-Smad3, all of which were synonymous mutations. Of these, one SNP (c.1448 C > T) was in the 3′UTR, and others were in the ORF. Three SNPs (c.597 C > T, c.660 C > T, and c.792 A > T) were significantly associated with the growth traits (including shell length, shell width, shell height, and total weight). The four growth traits of clams with the TT were markedly higher in relation to those in ones with the CC genotype of c.597 C > T (p < 0.05). Similarly, the shell height and shell width of the clams with the CC genotype were significantly higher as compared to that with the CT genotype of c.660 C > T. In addition to shell height, the heterozygous c.792 A > T clams had higher growth traits than the homozygous AA and TT clams (Table 2). c.792 A > T and c.1448 C > T were medium polymorphism sites (0.25 < PIC < 0.5), and the c.660 C > T was a low polymorphism site (PIC < 0.25). The observed heterozygosity of the three loci were 0.4625, 0.2000, and 0.2875, respectively, and the expected heterozygosity of the three loci were 0.4855, 0.1811, and 0.4068, respectively (Table 3). A linkage disequilibrium analysis was conducted on three SNP loci of the Mm-Smad3 gene, where D’ and r2 were used to indicate the degree of linkage disequilibrium. The results showed that three loci were in strong linkage disequilibrium (D′ > 0.75) (Table 4).

4. Discussion

4.1. The Mm-Smad3 Gene and Amino Acid Sequence Features

The growth rate of aquatic animals is a commercially important indicator in aquaculture, which is affected by genotype and environmental factors [30]. Selective breeding may be one effective approach to improve the growth traits of farmed animals under specific conditions. The animal growth and development traits are regulated by somatotropic axis genes [31]. Smad3, a main intracellular signal transduction factor in the TGF/activin signaling pathway, plays an indispensable role in the growth and development of organisms [3]. In this study, the full-length cDNA sequence of Mm-Smad3 showed high identity in sequence size to that from other species, such as mammals and shellfish, in which the MH1 and MH2 domain and the C-terminal SSXS phosphorylation sites were more than 90% identical. The phylogenetic tree showed that Mm-Smad3 was clustered together with Smad3 of other bivalve mollusks and then gathered together with vertebrates, which conforms to the law of species evolution. Additionally, amino acid sequence analysis showed that the motif, MH1, and MH2 functional domains of the Samd3 are extremely conserved, suggesting that it is an evolutionarily conserved gene. MH1 and MH2 regulate the transcription of downstream target genes in the TGF-β signaling pathway and their domains can interact to inhibit each other’s activity [32]. The L3 loop of the MH2 domain and R-Smads directly bind to the L45 loop of type I receptor to transmit TGF-β signals. There is also a continuous hydrophobic channel on the surface of the MH2 domain, which can bind to receptor proteins (SARA, MEK1, ELF, Nup214, Nup153, and DNA binding cofactors) and participate in the localization and signal transduction of Smad3 in cells [33,34,35]. The smallest Smad binding element on DNA is a key element that mediates the binding of DNA to Smad. It can bind to the β hairpin structure composed of 11 amino acid residues on MH1 to affect the transcription of target genes [36]. In these regards, the domains MH1 and MH2 of the Smad3 play an irreplaceable role in transmitting TGF-β signals and acting on target genes. Especially, Smad3 is relatively conservative in the process of species evolution. Therefore, it is speculated that the function of Mm-Smad3 in clams may be similar to that in higher animals.

4.2. Quantitative Expression Analysis of Mm-Smad3

Previous studies on T. granosa [19] and A. farreri [18] found higher expression levels of Smad3 in the mantle and foot. In this study, Mm-Smad3 was expressed in all tissues, with higher expression levels in the mantle and foot (p < 0.05). The classic model of shellfish shell formation proposes that shell mineralization occurs in the secretory matrix of the mantle, and the shell protein is produced by the mantle and secretion [37]. A study on the expression and distribution of Smad3 in the mantle tissue of P. fucata found that it showed strong positive signals in the outer fold epidermal cells and outer fold inner epidermal cells in the mantle, speculating that Smad3 may be involved in the formation of the prismatic layer and cuticle of the shell [17]. In addition, the expression level of Mm-Smad3 was low before the D-shaped larva stage. However, the Mm-Smad3 mRNA level increased significantly at the umbo larvae stage (p < 0.05), with the beginning of shell formation, suggesting its potential roles in the growth and mineralization of the shell of clams. Smad3 is a downstream transcription factor of muscle growth inhibitors (TGF-β, myostatin) that can inhibit the expression of specific and important genes, such as muscle regulatory factor and myocyte enhancer factor 2 in muscle cells, and plays an important regulatory role in the growth and development of muscle [35,38]. The foot is mainly composed of muscle tissue and is an important locomotor organ of clams. In these regards, Mm-Smad3 has the potential to regulate muscle growth.

4.3. Analysis of the Effect of Mm-Smad3 Gene on Tissue Repair

The tissue repair mainly goes through three stages, including early inflammation, middle granulation tissue formation, and late matrix deposition [39]. TGF-β1/Smad3 signaling is one of the main regulatory pathways of the tissue repair process [40]. Smad3 is mainly involved in regulating the growth and chemotaxis of epidermal cells, and their biological effect is to inhibit the process of re-epithelialization [41]. In a study of wound healing in mice, mRNA levels of Smad3, TGF-β1, and monocyte chemotactic protein-1 were found to be significantly downregulated in palatal tissue treated with Smad3-targeted siRNA vs. a control siRNA, indicating that the downregulated expression of Smad3 by siRNA can accelerate wound healing and may inhibit wound contraction [42]. Comprehensive analysis has showed that the expression level of Smad3 decreases after tissue injury, and the downregulation of the expression of Smad3 can promote TGP-β1 to regulate inflammatory factors and chemokines to act on the wound, forming fibroblasts to accelerate wound healing [43,44]. Similarly, here, the expression level of Mm-Smad3 in the experiment group was lower than that in the control group during the process of wound repair. Notably, Smad3 is highly conserved in evolution. These findings suggest that Mm-Smad3 has the same potential role on wound healing as vertebrates. In addition, studies have shown that the expression level of Smad3 in the third stage of tissue healing (about 20d) is higher than that of normal tissues [45]. In this study, the expression of the Mm-Smad3 gene after trauma showed a fluctuating pattern, speculating that the body may regulate the gene expression of Smad3 to inhibit inflammation and the proliferation of fibroblasts to participate in wound healing. In order to better understand the mechanism of post-traumatic repair of Mm-Smad3, it is necessary to conduct a long-term experimental study on the tissue repair of clams.

4.4. Association Analysis of SNPs with Growth Traits in the Mm-Smad3 Gene

It is well known that traditional selection breeding is often time-consuming, while molecular marker-assisted breeding can greatly improve breeding efficiency. SNP, which is a molecular marker-assisted breeding method, has been widely used in animal growth [46,47] and disease resistance [48] breeding. Interestingly, we can also use SNP as a new tool to assess parentage analysis, demonstrating their significant applications in selective breeding programs [49]. At present, many studies have been reported on the association between the polymorphism of the Smad3 gene and disease susceptibility in higher animals, such as osteoarthritis [50], diabetes [51], and coronary artery disease [15]. However, there are few reports on the relationship between SNPs of Smad3 and growth traits. In mammals, the SNP of Smad3 has previously been identified as a candidate growth-related gene in chicken and cattle [7]. In shellfish, a growth-related SNP site was found in the exon region of Smad3 in A. farreri, and the growth traits of GG individuals were significantly higher than those of GT individuals [18]. Consistently, in this study, the three SNPs found in the exon region of Mm-Smad3 were significantly associated with the growth traits of clams, though they did not cause amino acid changes. Many studies have shown that synonymous mutations can also regulate gene transcription and translation. For example, the synonymous mutations in the promoters and introns of dopamine transporter genes may affect the transcription efficiency [52]. In addition, the synonymous mutations in the multidrug resistance 1 gene can change the spatial structure of its coding protein [53]. Therefore, we speculated that the TT genotype at c.597 C > T site of the Smad3, the CC genotype at c.660 C > T site, and the AT genotype at c.729 A > T site of the Mm-Smad3 may be beneficial to improve the growth performance of clams.

5. Conclusions

In summary, we characterized the cDNA and promoter of Mm-Smad3 and then analyzed the sequence characteristics and phylogenetic relationship. Analysis of tissue- and development-specific expression demonstrated that Mm-Smad3 mRNA had the highest expression level in the mantle (p < 0.05) and umbo larvae stage (p < 0.05), suggesting that it may be involved in the organ formation and growth of clam shells. Further, the mantle repair experiment indicated that Mm-Smad3 may play a vital role in tissue repair. To better understand the mechanism of post-traumatic repair of Mm-Smad3, it is necessary to conduct a long-term experimental study on the tissue repair of clams. Moreover, association analysis identified three growth-related SNPs in the exons of Mm-Smad3 that may have potential applications in effective marker-assisted selection to increase the growth rate in M. meretrix. Overall, the Smad3 gene is still a hot research topic in regulating animal growth, development, and repair of tissue damage, but its exact molecular regulation mechanism remains to be further studied.

Author Contributions

Conceptualization, Y.D. and Z.L.; Methodology and software, Y.B., H.Y.; and Y.D.; Validation, Y.D. and L.F.; Formal analysis and investigation, Q.C., H.Y. and L.F.; Resources and data curation, L.F. and Q.C.; Writing—original draft preparation, L.F. and Q.C.; Writing—review and editing, L.F., Y.D. and Z.L.; Visualization, supervision, project administration, and funding acquisition, Y.D. and Z.L. All authors have read and agreed to the published version of the manuscript.

Funding

This work was supported by National Key Research and Development Program of China (2018YFD0901404, Yongbo Bao), National Natural Science Foundation of China (31772846, Yinghui Dong), Ningbo Major Project of Science and Technology (2019B10005, Zhihua Lin), Zhejiang Provincial First-Class Discipline of Bioengineering -A (ZS2019001, Yinghui Dong) and National Marine Genetic Resource Center Program (Yinghui Dong).

Institutional Review Board Statement

In the present study, the adult hard clams (M. meretrix) were collected from the genetic breeding research center of Zhejiang Wanli University, China. All experimental procedures were approved by the Institutional Animal Care and Use Committee (IACUC) of Zhejiang Wanli University, China.

Data Availability Statement

The sequence of Smad3 gene of M. meretrix was deposited in GenBank, and the accession number is SRX023927.

Conflicts of Interest

The authors declare that they have no conflict of interest.

References

  1. Moustakas, A.; Heldin, C.H. The regulation of TGF-β signal transduction. Development 2009, 136, 3699. [Google Scholar] [CrossRef] [Green Version]
  2. Shi, Y.; Massagué, J. Mechanisms of TGF-β signaling from cell membrane to the nucleus. Cell 2003, 113, 685–700. [Google Scholar] [CrossRef] [Green Version]
  3. Hata, A.; Chen, Y.G. TGF-β signaling from receptors to Smads. Cold Spring Harb. Perspect. Biol. 2011, 8, a022061. [Google Scholar] [CrossRef]
  4. Kjellman, C.; Honeth, G.; Järnum, S.; Lindvall, M.; Darabi, A.; Nilsson, I.; Edvardsen, K.; Salford, L.G.; Widegren, B. Identification and characterization of a human smad3 splicing variant lacking part of the linker region. Gene 2004, 327, 141–152. [Google Scholar] [CrossRef] [PubMed]
  5. Savage, C.; Das, P.; Finelli, A.L. Caenorhabditis elegans genes sma-2, sma-3, and sma-4 define a conserved family of transforming growth factor β pathway components. Proc. Natl. Acad. Sci USA 1996, 93, 790–794. [Google Scholar] [CrossRef] [PubMed] [Green Version]
  6. Dick, A.; Mayr, T.; Bauer, H.; Meier, A.; Hammerschmidt, M. Cloning and characterization of zebrafish smad2, smad3 and smad4. Gene 2000, 246, 69–80. [Google Scholar] [CrossRef]
  7. Shi, T.; Xu, Y.; Yang, M.J.; Zhou, Y.; Liu, M.; Lan, X.Y.; Lei, C.Z.; Qi, X.L.; Lin, F.P.; Bai, Y.Y.; et al. Genetic variation, association analysis, and expression pattern of SMAD3 gene in Chinese cattle. Czech J. Anim. Sci. 2016, 61, 209–216. [Google Scholar] [CrossRef] [Green Version]
  8. Tian, Z.H.; Jiao, C.Z.; Cheng, Y.X. Molecular cloning, sequence analysis, and tissue expression of Smad3-like protein from Eriocheir sinensis. J. Fish Sci. China 2018, 25, 316–324. [Google Scholar] [CrossRef]
  9. Fu, L.G.; Liu, H.W.; Lei, W.J. MiR-596 inhibits osteoblastic differentiation and cell proliferation by targeting Smad3 in steroid-induced osteonecrosis of femoral head. J. Orthop. Surg. Res. 2020, 15, 1–10. [Google Scholar] [CrossRef]
  10. Zhang, K.; Rajput, S.K.; Lee, K.B.; Wang, D.; Huang, J.; Folger, J.K.; Knott, J.G.; Zhang, J.; Smith, G.W. Evidence supporting a role for SMAD2/3 in bovine early embryonic development: Potential implications for embryotropic actions of follistatin. Biol. Reprod. 2015, 93, 86. [Google Scholar] [CrossRef] [Green Version]
  11. Roberts, A.B.; Tian, F.; Byfield, S.D.; Stuelten, C.; Ooshima, A.; Saika, S.; Flanders, K.C. Smad3 is key to TGF-β-mediated epithelial-to-mesenchymal transition, fibrosis, tumor suppression and metastasis. Cytokine Growth Factor Rev. 2006, 17, 19–27. [Google Scholar] [CrossRef] [PubMed]
  12. de Kroon, L.M.G.; Narcisi, R.; Van den Akker, G.G.H.; Vitters, E.L.; Blaney Davidson, E.N.; Van Osch, G.J.V.M.; van der Kraan, P.M. SMAD3 and SMAD4 have a more dominant role than SMAD2 in TGFβ-induced chondrogenic differentiation of bone marrow-derived mesenchymal stem cells. Sci. Rep. 2017, 7, 43164. [Google Scholar] [CrossRef] [PubMed] [Green Version]
  13. Pluijm, I.; Vliet, N.; Thusen, J.H.; Robertus, J.L.; Ridwan, Y.; Heijningen, P.M.; Thiel, B.S.; Vermeij, M.; Hoeks, S.; Buijs-Offerman, R.; et al. Defective connective tissue remodeling in Smad3 mice leads to accelerated aneurysmal growth through disturbed downstream TGF-β signaling. Ebiomedicine 2016, 12, 280–294. [Google Scholar] [CrossRef] [Green Version]
  14. Amanda, B.; Anna, R.P.; Kimberlee, T.; Craig, F.; Charlotte, P. Transforming growth factor-β1/Smad3-independent epithelial–mesenchymal transition in type I collagen glomerulopathy. Int. J. Nephrol. Renovasc. Dis. 2017, 10, 251. [Google Scholar]
  15. Turner, A.W.; Martinuk, A.; Silva, A.; Lau, P.; Nikpay, M.; Eriksson, P.; Folkersen, L.; Perisic, L.; Hedin, U.; Soubeyrand, S.; et al. Functional analysis of a novel genome-wide association study signal in SMAD3 that confers protection from coronary artery disease. Thromb. Vasc. Biol. 2016, 36, 972–983. [Google Scholar] [CrossRef] [Green Version]
  16. Patel, P.; Sekiguchi, Y.; Oh, K.H.; Patterson, S.E.; Kolb, M.R.J.; Margetts, P.J. Smad3-dependent and -independent pathways are involved in peritoneal membrane injury. Kidney. Int. 2010, 77, 319–328. [Google Scholar] [CrossRef] [Green Version]
  17. Zhou, Y.J.; He, Z.X.; Li, Q.; Xie, L.P.; Zhang, R.Q. Cloning and expression pattern of a Smad3 homolog from the pearl oyster, Pinctada fucata. Acta. Biochim. Biophys. Sin. 2008, 40, 244–252. [Google Scholar] [CrossRef] [Green Version]
  18. Guo, H. Cloning and Expression Analysis of TGF-β/Smad Signaling Pathway Genes in Azumapecten farreri and Screening of SNP Sites Related to Growth Traits. Ph.D. Thesis, Ocean University of China, Qingdao, China, 2012. [Google Scholar]
  19. Dong, Y.H. High-Throughput Transcriptome Analysis of Tegillarca granosa and the Cloning and Expression of Growth-Related Genes. Ph.D. Thesis, Ocean University of China, Qingdao, China, 2012. [Google Scholar]
  20. Awaji, M.; Machii, A. Fundamental studies on in vivo and in vitro pearl formation—Contribution of outer epithelial cells of pearl oyster mantle and pearl sacs. Aquat. Biosci. Monogr. 2011, 4, 1–39. [Google Scholar] [CrossRef] [Green Version]
  21. Lin, Z.H. Biology and Culture Technology of Meretrix meretrix; Science Press: Beijing, China, 2015; pp. 1–10. [Google Scholar]
  22. Wang, H.; Chai, X.; Liu, B. Estimation of genetic parameters for growth traits in cultured clam Meretrix meretrix (Bivalvia: Veneridae) using the Bayesian method based on Gibbs sampling. Aquacult. Res. 2011, 42, 240–247. [Google Scholar] [CrossRef]
  23. Moreau, L.; Charcosset, A.; Hospital, F.; Gallais, A. Marker-assisted selection efficiency in populations of finite size. Genetics 1998, 148, 1353. [Google Scholar] [CrossRef]
  24. Hospital, F.; Moreau, L.; Lacoudre, F.; Charcosset, A.; Gallais, A. More on the efficiency of marker-assisted selection. Theor. Appl. Genet. 1997, 95, 1181–1189. [Google Scholar] [CrossRef]
  25. Gao, X.Y.; Dong, Y.H.; Shi, S.J.; Yao, H.H.; Ran, W.B.; Zhao, J.X.; Lin, Z.H. Cloning, spatiotemporal expression and SNPs identification of GRB2 gene in hard clam Meretrix meretrix. J. Fish China 2015, 39, 55–63. [Google Scholar]
  26. Wang, C.; Yao, Y.; Wang, H.X.; Liu, B.Z. Genetic diversity of the sulfotransferase-like gene and one nonsynonymous SNP associated with growth traits of clam, Meretrix meretrix. Mol. Biol. Rep. 2012, 39, 1323–1331. [Google Scholar] [CrossRef]
  27. Zou, L.; Liu, B.Z. Identification of a serum amyloid A gene and the association of SNPs with vibrio-resistance and growth traits in the clam Meretrix meretrix. Fish Shellfish. Immunol. 2015, 43, 301–309. [Google Scholar] [CrossRef]
  28. Tan, B.; Yang, S.L.; Yang, R.C.; Wang, X.P.; Zhou, M.D.; Zhou, X.; Yang, S.H. Application research progress of SMAD3 gene in livestock production. China Anim. Husb. Vet. Med. 2019, 46, 185–193. [Google Scholar]
  29. Livak, K.J.; Schmittgen, T.D. Analysis of relative gene expression data using real-time quantitative PCR and the 2−ΔΔCT method. Methods 2001, 25, 402–408. [Google Scholar] [CrossRef]
  30. Gjedrem, T. Trygve Selection and breeding programs in aquaculture. Aquacult. Res. 2005, 37, 287–299. [Google Scholar]
  31. Parmentier, I.; Portetelle, D.; Gengler, N.; Prandi, A.; Renaville, R. Candidate gene markers associated with somatotropic axis and milk selection. Domest. Anim. Endocrinol. 1999, 17, 139–148. [Google Scholar] [CrossRef]
  32. Parviz, M.; Hu, L.; Zhu, N.; Zea, B.; Saverio, B.; John, G.; Dimitris, K.; Li, C. SMAD3 prevents binding of NKX2.1 and FOXA1 to the SpB promoter through its MH1 and MH2 domains. Nucleic Acids Res. 2008, 36, 179–188. [Google Scholar]
  33. Wu, G.; Chen, Y.G.; Ozdamar, B.; Gyuricza, C.A.; Chong, P.A.; Wrana, J.L.; Massagué, J.; Shi, Y. Structural basis of Smad2 recognition by the smad anchor for receptor activation. Science 2000, 287, 92–97. [Google Scholar] [CrossRef]
  34. Randall, R.A.; Germain, S.; Inman, G.J.; Bates, P.A.; Hill, C. Different Smad2 partners bind a common hydrophobic pocket in Smad2 via a defined proline-rich motif. EMBO J. 2014, 21, 145–156. [Google Scholar] [CrossRef] [PubMed] [Green Version]
  35. Dong, L.; Kang, J.; Derynck, R. TGF-β-activated Smad3 represses MEF2-dependent transcription in myogenic differentiation. EMBO J. 2004, 23, 1557–1566. [Google Scholar]
  36. Chai, N.; Li, W.X.; Wang, J.; Wang, Z.X.; Yang, S.M.; Wu, J.W. Structural basis for the Smad5 MH1 domain to recognize different DNA sequences. Nucleic Acids. Res. 2015, 43, 9051–9064. [Google Scholar] [CrossRef] [PubMed] [Green Version]
  37. Budd, A.; Mcdougall, C.; Green, K.; Degnan, B.M. Control of shell pigmentation by secretory tubules in the abalone mantle. Front. Zool. 2014, 11, 62–71. [Google Scholar] [CrossRef]
  38. Sandhya, S.; Subha, S.; Kumar, J.P.; Xiaojia, G.; Sudarsanareddy, L.; Desmond, M.F.C.; Walter, W.; Ravi, K.; Mridula, S. Myostatin augments muscle-specific ring finger protein-1 expression through an NF-kB independent mechanism in SMAD3 null muscle. Mol. Endocrinol. 2014, 28, 317–330. [Google Scholar]
  39. Qian, L.W.; Fourcaudot, A.B.; Yamane, K.; You, T.; Chan, R.K.; Leung, K.P. Exacerbated and prolonged inflammation impairs wound healing and increases scarring. Wound Repair Regen. 2016, 24, 26–34. [Google Scholar] [CrossRef] [PubMed]
  40. Lin, Y.T.; Chen, J.S.; Wu, M.H.; Hsieh, I.S.; Liang, C.H.; Hsu, C.L.; Hong, T.M.; Chen, Y.L. Galectin-1 accelerates wound healing by regulating the neuropilin-1/smad3/nox4 pathway and ros production in myofibroblasts. J. Investig. Dermatol. 2015, 135, 258–268. [Google Scholar] [CrossRef] [Green Version]
  41. Tan, N.S.; Michalik, L.; Di-Poi, N.; Ng, C.Y.; Wahli, W. Essential role of Smad3 in the inhibition of inflammation-induced PPARβ/δ expression. EMBO J. 2014, 23, 4211–4221. [Google Scholar] [CrossRef] [Green Version]
  42. Yoneda, N.; Yasue, A.; Watanabe, T.; Tanaka, E. Down-regulation of Smad3 accelerates palatal wound repair. J. Dent. Res. 2013, 92, 716–720. [Google Scholar] [CrossRef] [PubMed]
  43. Nolte, M.; Margadant, C. Controlling immunity and inflammation through Integrin-dependent regulation of TGF-β. Trends Cell Biol. 2019, 30, 49–59. [Google Scholar] [CrossRef]
  44. Falanga, V.; Schrayer, D.; Cha, J.; Butmarc, J.; Roberts, A.B. Full-thickness wounding of the mouse tail as a model for delayed wound healing: Accelerated wound closure in Smad3 knock-out mice. Wound Repair Regen. 2010, 12, 320–326. [Google Scholar] [CrossRef]
  45. Nong, X.L.; Rajbanshi, G.; Chen, L.; Li, J.Q.; Li, Z.; Liu, T.T.; Chen, S.H.; Wei, G.; Li, J.S. Effect of artesunate and relation with TGF-β1 and SMAD3 signaling on experimental hypertrophic scar model in rabbit ear. Arch. Dermatol. Res. 2019, 311, 761–772. [Google Scholar] [CrossRef] [Green Version]
  46. Ulloa, P.E.; Rincón, G.; Islas-Trejo, A.; Araneda, C.; Iturra, P.; Neira, R.; Medrano, J.F. RNA sequencing to study gene expression and SNP variations associated with growth in zebrafish fed a plant protein-based diet. Mar. Biotechnol. 2015, 17, 353–363. [Google Scholar] [CrossRef] [PubMed]
  47. Yue, X.; Wang, H.X.; Huang, X.H.; Wang, C.; Chai, X.L.; Wang, C.D.; Liu, B.Z. Single nucleotide polymorphisms in i-type lysozyme gene and their correlation with vibrio-resistance and growth of clam Meretrix meretrix based on the selected resistance stocks. Fish Shellfish Immunol. 2012, 33, 559–568. [Google Scholar] [CrossRef] [PubMed]
  48. Guo, M.; Wang, H.H.; Shao, Y.; Xing, R.L.; Zhao, X.L.; Zhang, W.W.; Li, C.H. Gene identification and antimicrobial activity analysis of a novel lysozyme from razor clam Sinonovacula constricta. Fish Shellfish Immunol. 2019, 89, 198–206. [Google Scholar] [CrossRef] [PubMed]
  49. Thongda, W.; Zhao, H.; Zhang, D.; Jescovitch, L.N.; Liu, M.; Guo, X.; Schrandt, M.; Powers, S.P.; Peatman, E. Development of SNP panels as a new tool to assess the genetic diversity, population structure, and parentage analysis of the Eastern Oyster (Crassostrea virginica). Mar. Biotechnol. 2018, 20, 385–395. [Google Scholar] [CrossRef]
  50. Zhang, L.; Zhang, L.M.; Zhang, H.Q.; Wang, W.J.; Zhao, Y. Association between SMAD3 gene rs12901499 polymorphism and knee osteoarthritis in a Chinese population. J. Clin. Lab. Anal. 2018, 32, e22383. [Google Scholar] [CrossRef] [Green Version]
  51. Mcknight, A.J.; Woodman, A.M.; Parkkonen, M.; Patterson, C.C.; Savage, D.A.; Forsblom, C.; Pettigrew, K.A.; Sadlier, D.; Groop, P.H.; Maxwell, A.P. Investigation of DNA polymorphisms in SMAD genes for genetic predisposition to diabetic nephropathy in patients with type 1 diabetes mellitus. Diabetologia 2009, 52, 844–849. [Google Scholar] [CrossRef] [Green Version]
  52. Greenwood, T.A.; Kelsoe, J.R. Promoter and intronic variants affect the transcriptional regulation of the human dopamine transporter gene. Genomics 2003, 82, 511–520. [Google Scholar] [CrossRef]
  53. Sarfaty, C.K.; Oh, J.M.; Kim, I.W.; Sauna, Z.E.; Calcagno, A.M.; Ambudkar, S.V.; Gottesman, M.M. A “silent” polymorphism in the MDR1 gene changes substrate specificity. Science 2007, 315, 525–528. [Google Scholar] [CrossRef] [Green Version]
Figure 1. Sequence analysis of the Mm-Smad3 gene. (A). The full length of cDNA and deduced amino acid sequence of Mm-Smad3. The frames represented the start codon, the stop codon, and the polyadenylation signal sequence. The double line is the polyA tail. The * represents the end of the protein translation. The double underlined bold part is the functional domains of MH1. The bold underlined part is the functional domains of MH2. (B). Multiple alignments of amino acid sequences of Smad3 from M. meretrix and other species. Among these, the completely (=100%), strongly (≥75%), and weakly (≥50%) conserved residues are shaded in black, dark grey, and light gray, respectively. The black and grey line represents the domain MH1 and MH2, respectively; the red box is the L3loop sequence. (C). Structure of the Mm-Smad3 promoter. Antp, Pit-1a, and Hb are transcription factors predicted to be associated with growth.
Fishes 06 00083 g001
Figure 2. Phylogenetic tree analysis of Smad3 proteins between M. meretrix and other species.
Fishes 06 00083 g002
Figure 3. The structure of Smad3 of clams, other bivalves, and vertebrates.
Fishes 06 00083 g003
Figure 4. Quantitative expression analysis of Mm-Smad3 in M. meretrix. (A). Expression profile of Mm-Smad3 in different tissues. (B). Expression profile of Mm-Smad3 in different developmental stages. Different letters on the columns represent statistically significant differences at p < 0.05.
Fishes 06 00083 g004
Figure 5. Time-course quantitative expression of Mm-Smad3 after mantle damage repair. Different letters on the columns represent statistically significant differences at p < 0.05.
Fishes 06 00083 g005
Table 1. Primers and sequences used in the experiments.
PrimerPrimer Sequence 5′–3′ApplicationsTmProduct Length
Mm-Smad3-GSP1ACAGAACACAGCAAGTAGAGATGACGC3′ RACE65.41019 bp
Mm-Smad3-GSP2CGTCATCTCTACTTGCTGTGTTCTGT5′ RACE65.4954 bp
Mm-Smad3-FAAATGGAGCGAAAAGGCAGcDNA identification58918 bp
Mm-Smad3-RACAGACAGTTGCTGGGTGCCcDNA identification60.5
Mm-Smad3-qRT-FCAAATGGAGCGAAAAGGCAGqRT-PCR60.9197 bp
Mm-Smad3-qRT-RATCGCCAAAGTCGGCAGTAqRT-PCR59
18s-FCTATCAAATGTCTGCCCTATCACACInternal reference primer60196 bp
18s-RTCCCGTATTGTTATTTTTCGTCACTInternal reference primer61.9
Mm-Smad3-GSP3TTCACAAGGCTTTTCACTGCCTTPromoter amplification63.1646 bp
Mm-Smad3-GSP4TGTTCGGTTAGTTCCGTCTCTTCACGPromoter amplification64.7
Mm-Smad3-GSP5GCATTTGGTGCTTGAATCTTGTTGTGNested amplification65.52761 bp
Mm-Smad3-GSP6CGTGAAGAGACGGAACTAACCGAACANested amplification64.72175 bp
Mm-Smad3-esF1GACACAACAAGATTCAAGCACCSNP detection57.2838 bp
Mm-Smad3-esR1ACAGACAGTTGCTGGGTGCCSNP detection60.5
Mm-Smad3-esF2AAATGGAGCGAAAAGGCAGSNP detection581635 bp
Mm-Smad3-esR2TTGATGGACCAGGGAGGACSNP detection57.3
Table 2. Correlation analysis between the SNPs and growth traits of M. meretrix.
LocusGenotypeSamplePercent
(%)
Shell Length
(mm)
Shell Height
(mm)
Shell Width
(mm)
Total Weight
(g)
c.597 C > TCC1417.5035.10 ± 2.99 a29.71 ± 2.46 a17.48 ± 1.99 a12.54 ± 3.96 a
CT3746.2536.29 ± 3.15 ab30.34 ± 2.78 ab18.08 ± 1.99 ab13.04 ± 3.83 ab
TT2936.2538.52 ± 3.47 b32.29 ± 2.78 b19.32 ± 1.83 b15.59 ± 4.24 b
c.660 C > TCC6480.0037.34 ± 3.47 a31.29 ± 2.94 a18.74 ± 2.03 a14.39 ± 4.32 a
CT1620.0035.00 ± 2.83 b29.41 ± 2.26 b17.09 ± 1.54 ab11.55 ± 2.51 ab
c.792 A > TAA4657.5036.95 ± 3.35 ab31.00 ± 2.8118.46 ± 1.87 ab13.75 ± 4.05 ab
AT2328.7538.12 ± 3.38 a31.98 ± 2.9119.16 ± 2.14 a15.75 ± 4.34 a
TT1113.7535.33 ± 2.69 b29.29 ± 2.0817.20 ± 1.45 b11.34 ± 1.68 b
Note: The different letters at the top right of the numbers represent statistically significant differences at p < 0.05.
Table 3. Polymorphic parameters of SNP loci of the Mm-Smad3 gene.
LocusAllele FrequencyHoHeNePIC
c.597 C > TC 0.4062
T 0.5938
0.46250.48551.93210.3660
c.660 C > TC 0.9000
T 0.1000
0.20000.18111.21950.1638
c.792 A > TA 0.7188
T 0.2812
0.28750.40681.67870.3225
Table 4. Linkage disequilibrium analysis of four SNP loci of the Mm-Smad3 gene.
Locusc.597 C > Tc.660 C > Tc.792 A > T
c.597 C > T 1.0001.000
c.660 C > T0.076 1.000
c.792 A > T0.2680.284
Notes: the figure above the diagonal represents D′, the figure below the diagonal represents r2.
Publisher’s Note: MDPI stays neutral with regard to jurisdictional claims in published maps and institutional affiliations.

