Article

Genome-Wide Association Study Identifies Loci and Candidate Genes Associated with Body Shape and Muscle Texture in Rice Field Eel (Monopterus albus)
1
Eco-Environmental Protection Research Institute, Shanghai Academy of Agricultural Sciences, Shanghai 201403, China
2
Key Laboratory of Exploration and Utilization of Aquatic Genetic Resources by the Ministry of Education, Shanghai Ocean University, Shanghai 201306, China
*
Authors to whom correspondence should be addressed.
These authors contributed equally to this work.
Fishes 2026, 11(9), 498; https://doi.org/10.3390/fishes11090498
Submission received: 24 July 2026 / Revised: 18 August 2026 / Accepted: 25 August 2026 / Published: 26 August 2026
(This article belongs to the Section Genetics and Biotechnology)

Abstract

The rice field eel (Monopterus albus) is an economically important aquaculture species widely distributed in Southeast Asia. However, the lack of nationally approved varieties and the increasing demand for high-quality eel products have highlighted the necessity of developing improved germplasm resources for aquaculture production. In this study, morphometric morphology and muscle texture traits were evaluated in 367 wild eel individuals, and a genome-wide association study (GWAS) based on whole-genome resequencing was conducted to identify genetic variants and candidate genes associated with economically important traits, including body length (BL), tail length (TL), tail height (TH), head length (HL), head width (HW), head height (HH), hardness, chewiness, springiness, and resilience. The GWAS identified three significant and seventeen suggestive SNPs associated with body shape traits, with most loci located on chromosome 4. Candidate gene analysis of the associated genomic regions revealed several candidate genes potentially associated with growth regulation, nutrient metabolism, and skeletal development, including b4galnt4a, tmem86a, cpt1b, mrpl23, lama1, gcm2, wnt3a, thrab, and bmpr1a. Additionally, four suggestive SNPs associated with muscle texture traits were detected, and candidate genes related to muscle development and extracellular matrix regulation, including fstl1b, col5a3a, and pnn, were identified. These findings provide new insights into the genetic basis underlying morphometric variation and muscle texture diversity in M. albus. The identified SNP markers and candidate genes provide potential molecular resources for understanding the genetic basis of body morphology and muscle texture variation in rice field eel.
Key Contribution: This study represents the first GWAS-based identification of genetic loci and candidate genes associated with body shape and muscle texture traits in Monopterus albus. The identified markers and functional candidate genes provide new insights into the genetic basis of economically important traits and represent potential molecular resources for future genetic improvement of rice field eel germplasm.

1. Introduction

Phenotypic traits have long been a major focus in fish biology and aquaculture research because they directly determine economically important characteristics and production performance. Body shape is not only a key morphological feature for fish taxonomy but also reflects evolutionary processes and environmental adaptation [1]. In aquaculture, body shape represents an important economic trait that influences consumer preference and processing efficiency. For example, shorter head and tail proportions generally contribute to higher edible fillet yields in cultured fish [2]. However, consumer preferences vary among different regions and species. In China, for instance, the head of certain fish species, such as bighead carp (Hypophthalmichthys nobilis), has a higher culinary value and market price than the fillet, resulting in unique selection preferences for head-related traits [3,4].
Muscle texture is another critical quality attribute that determines fish meat quality, consumer acceptance, and product value [5]. Physical properties such as hardness and chewiness are largely influenced by individual and regional dietary habits [6]. The most direct evidence is that feeding tilapia (Oreochromis niloticus) and grass carp (Ctenopharyngodon idellus) with faba bean diets in southern China improves the crispiness of the fish muscles [7,8]. In summary, the diversity of choices provides the possibility to meet the needs of different markets and consumers.
Traditionally, the improvement of desirable phenotypic traits has relied mainly on selective breeding based on population performance or environmental manipulation. However, conventional breeding is generally time-consuming and may be limited by the complex inheritance patterns of quantitative traits and the difficulty of achieving stable trait improvement across populations. With the rapid development of genomic resources and high-throughput sequencing technologies, the genetic architecture underlying economically important traits has become increasingly accessible. Genome-wide association studies (GWAS) have emerged as a powerful approach for identifying genetic variants and genomic regions associated with complex quantitative traits. To date, GWAS has been successfully applied in numerous aquaculture species to identify candidate loci related to growth performance [9,10], stress resistance [11,12], flesh quality [13,14], meat yield [15,16], and pigmentation traits [17,18], providing valuable genetic resources for molecular breeding programs.
The rice field eel (Monopterus albus) is a freshwater teleost species widely distributed in East, South, and Southeast Asia, where it inhabits rice fields, swamps, and muddy ponds [19]. Owing to its high nutritional value, desirable taste, and considerable economic importance, M. albus has become one of the most valuable specialty freshwater aquaculture species in China [20]. In recent years, various nutritional strategies and feed additives have been developed to improve eel growth and production efficiency, contributing to increased aquaculture output [21,22,23]. However, the development of the eel aquaculture industry remains constrained by several challenges. Currently, both juvenile eels used for aquaculture and broodstock are mainly obtained from wild populations, and wild-caught adult eels continue to supply a substantial proportion of market demand. Two major factors limit the genetic improvement and sustainable development of eel farming: (1) wild eels generally exhibit superior muscle texture compared with cultured individuals [24]; and (2) no nationally approved selectively bred eel varieties with desirable economic traits are currently available.

2. Materials and Methods

All animal care and experimental procedures were conducted in strict accordance with the guidelines approved by the Experimental Animal Ethics Committee of the Shanghai Academy of Agricultural Sciences (Approval Number: SAASPZ0520016 on 15 May 2023).

2.1. Sample Collection and Trait Assessment

A total of 367 wild eel samples were collected from 21 sampling sites across Asia (Table S1). Most samples were collected between June and November 2023, with two additional collections conducted in July 2024 (average weight 118.16 ± 16.55 g, range 85.64 to 210.64 g). Using calipers, the head morphology and body shape of each sample were measured (to the nearest 1 mm), including body length (BL), head length (HL), head width (HW), head height (HH), tail length (TL), and tail height (TH). Subsequently, the tail muscle tissue of each sample was collected, immediately frozen in liquid nitrogen, and stored at −80 °C for sequencing analysis.
After wiping the surface of the eel with 75% ethanol, muscle samples were collected from the dorsal muscle above the lateral line using dissection scissors for muscle texture analysis. Frozen muscle samples were thawed at 4 °C for approximately 12 h before texture profile analysis. To minimize variation caused by sampling position, muscle samples were collected from the same anatomical region for all individuals. Texture profile analysis (TPA) was conducted using the TA. XTPlus texture analyzer (Stable Micro Systems, Godalming, UK). The dorsal muscle samples were trimmed into uniform cubes (1.0 cm × 1.0 cm × 0.5 cm), and all samples were analyzed using the same testing procedure and instrument settings. A flat-bottomed cylindrical probe (25 mm × 25 mm) was used with a descent speed of 2 mm/s, a test speed of 1 mm/s, a test interval of 5 s, and a compression rate of 30%. Each sample was measured three times, and the mean value was used for subsequent analysis. The TPA test was performed at room temperature. The measured parameters included hardness (gf), chewiness (gf), springiness, and resilience.

2.2. Library Preparation and Sequencing

Genomic DNA extracted from all individuals was subjected to whole-genome resequencing. Briefly, genomic DNA was randomly fragmented by ultrasonic shearing to obtain DNA fragments with an average insert size of approximately 400 bp. The fragmented DNA was subsequently subjected to end repair, 3′-adenylation, and adapter ligation. After purification, the ligated products were amplified by PCR to construct sequencing libraries with an expected insert size of 400 bp. The quality and fragment distribution of the libraries were evaluated using an Agilent 2100 Bioanalyzer with an Agilent High Sensitivity DNA Kit (Agilent Technologies Inc., Santa Clara, CA, USA). Library concentrations were determined using the Quant-iT PicoGreen dsDNA Assay Kit (Thermo Fisher Scientific, Waltham, MA, USA) on a Promega QuantiFluor fluorescence quantification system (Promega, Madison, WI, USA), and libraries with concentrations above 2 nmol/L were considered suitable for sequencing. Qualified libraries were sequenced at Personalbio Biotechnology Co., Ltd. (Shanghai, China) utilizing the Illumina NovaSeq 6000 platform (Illumina Inc., San Diego, CA, USA) with the 150 bp paired-end reads (PE150) strategy.

2.3. Quality Control, Read Mapping, and SNP Calling

Raw sequencing reads containing adapter contamination or low-quality bases may compromise downstream genomic analyses. Therefore, raw reads were processed using fastp (https://github.com/OpenGene/fastp, accessed on 14 July 2025, v0.20.0) to remove adapter sequences, filter low-quality reads, and generate clean reads, thereby producing high-quality data [25]. The filtered reads from each individual were aligned against the Monopterus albus reference genome using the Burrows–Wheeler Aligner (BWA-MEM; v0.7.12-r1039) algorithm to the Monopterus albus reference genome (accession No. [GCA_001952655.1]), producing SAM files [26]. SAM files were converted into BAM format and sorted using Picard (v1.107), followed by identification and removal of PCR duplicates using the “MarkDuplicates” function. To improve alignment accuracy around insertion/deletion regions (InDels), local realignment of reads surrounding InDels was performed using the “IndelRealigner” module implemented in GATK (Genome Analysis Toolkit, v3.8).
SNP variants were subsequently identified using the HaplotypeCaller pipeline in GATK (v3.8). The initial SNP dataset was filtered according to the following criteria: Quality Depth (QD) ≥ 2.0, Mapping Quality (MQ) ≥ 40.0, Haplotype Score ≤ 13.0, Fisher’s test of strand bias (FS) ≤ 60.0, ReadPosRankSum ≥ −8.0, MQRankSum > −12.5, and Read depth (DP) > 4. nly high-confidence SNP loci meeting these thresholds were retained for downstream population genetic analyses and genome-wide association studies. Functional annotation of candidate SNPs was conducted using ANNOVAR (version 2020Jun08) software [27].

2.4. Statistical Analysis

Population genetic structure was evaluated based on the filtered SNP dataset. Principal component analysis (PCA) was performed using the Genome-wide Complex Trait Analysis (GCTA, v1.93.2) software package to investigate genetic relationships among individuals and identify potential population clusters [28]. In addition, a maximum-likelihood (ML)-based phylogenetic tree was constructed using fastTree (v2.1.11) based on genome-wide SNP markers. The robustness of the inferred phylogenetic relationships was assessed using 1000 bootstrap replicates [29].

2.5. Genome-Wide Association Analysis

Before genome-wide association analysis, the genotype data were filtered with the following conditions: minor allele frequency (MAF) ≥ 0.05, missing genotype rate ≤ 0.20, and sequencing depth (DP) ≥ 3x. Population structure was evaluated using principal component analysis (PCA) based on genome-wide SNP markers. GWAS analysis was performed using the Efficient Mixed-Model Association eXpedited (EMMAX) method, which accounts for population structure and cryptic relatedness by incorporating a genomic relationship matrix (GRM). The mixed linear model used in EMMAX was expressed as y = + Zu + e, where y represents phenotypic observations, represents fixed effects, Zu represents random genetic effects estimated using the genomic relationship matrix, and e represents residual errors. The GRM was constructed using genome-wide SNP markers after quality control filtering to correct for genetic relatedness and population stratification among individuals. Manhattan and quantile–quantile (Q-Q) plots of the GWAS results were generated by “R” software. Threshold p-values for genome-wide significance were calculated using Bonferroni correction, and it was finally determined that the representative significance threshold line −log10(0.05/N) was set at 7.9 and the representative suggestive threshold line −log10(1/N) was set at 6.6.

2.6. Identification and Annotation of Candidate Genes

We mapped SNPs from GWAS to the eel reference genome and searched for candidate genes located near significantly and suggestively related SNPs (within 200 kb upstream and downstream of the SNP). Gene functions of significantly and suggestively related SNPs were analyzed using the Gene Ontology (GO) to annotate SNPs for each trait to their genes, and candidate genes were functionally annotated using BLAST (v2.12.0+) against the non-redundant protein database.

3. Results

3.1. Comparative Body Shape Measurements

Table 1 shows the minimum, maximum, mean ± standard deviation (mean ± SD), and coefficient of variation (CV) of body size and head shape traits of eels. In all samples, the body length ranged from 42.01 to 65.55 cm (mean 50.58 ± 3.09 cm), and the CV among individuals was relatively small at 6.10%, indicating its relative stability within the population. The mean ± SD of head shape traits, including head length, head width, and head height, was 4.02 ± 0.48 cm, 1.82 ± 0.24 cm, and 2.20 ± 0.31 cm, respectively. Among them, the CV of head height was the largest at 14.09%, indicating that the head height varied greatly among different individuals. The mean ± SD of tail traits, including tail length and tail height, was 12.46 ± 1.32 cm and 1.58 ± 0.28 cm, respectively. The CV of tail height was 17.94%, higher than that of tail length (10.63%), indicating that the trait of tail height had a larger variation range within the population. Correlation analysis showed that most of these traits were strongly and significantly correlated (p < 0.01), and the Pearson’s correlation coefficients ranged from −0.671 to 0.859 (Table 2).

3.2. Comparative Muscle Texture Measurements

Table 3 presents the minimum, maximum, mean ± SD and CV of four muscle texture traits of eels. Among them, the CV of springiness was the smallest, which is 12.15%, indicating that this trait is relatively stable in the population. The CV of chewiness is the largest, which is 28.15%, indicating relatively high phenotypic variation among individuals. Correlation analysis shows that hardness has a highly significant correlation with the other three traits (p < 0.01), while there is no correlation among the remaining traits (p > 0.05), and the Pearson’s correlation coefficients range from −0.020 to 0.267 (Table 4).

3.3. Sequencing Results and SNP Variation Calling

Based on the results of the Illumina NovaSeq 6000 sequencing platform, a total of 1677.16 GB of raw data was obtained from 367 samples (Table S2). The total amount of clean data after filtering was 1592.41 GB. The average value of Q20 was 97.97%, and the average value of Q30 was 95.06%. The average sequencing depth was 5.43X (Table S3).
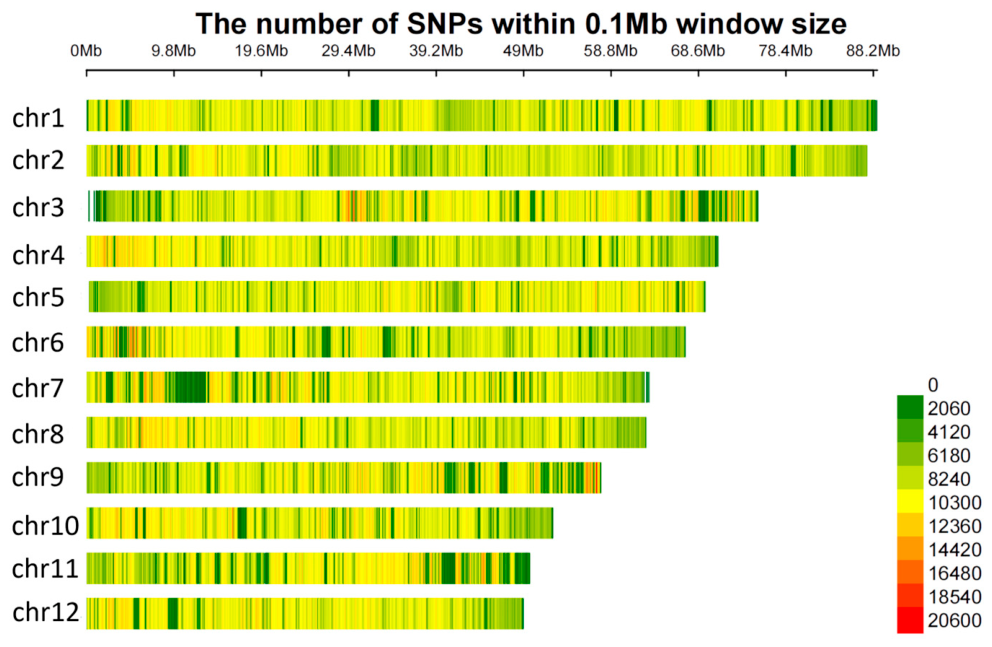
By mapping the sequencing reads of all 367 samples to the reference genome of M. albus, a total of 66,733,948 SNPs were detected, and their distribution on chromosomes is presented in Figure 1. Among them, the vast majority of SNPs were located in intergenic regions (49.49%) and intron regions (41.07%), followed by exon regions (3.51%), upstream (3.04%) and downstream regions (2.76%) of the transcription start site (Table 5). A total of 4,038,812 SNPs were finally filtered and obtained for the GWAS analysis.

3.4. Population Structure and Phylogeny

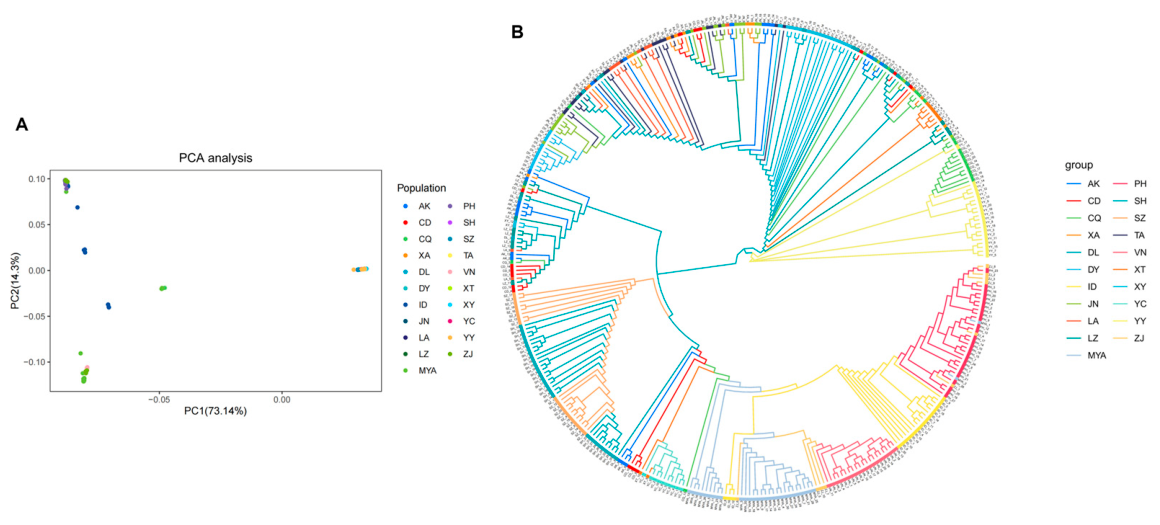
Principal component analysis (PCA) and phylogenetic tree construction were used to examine the differences in population structure. The results indicated population stratification and genetic differentiation among the sampled populations (Figure 2).

3.5. GWAS for Morphometric Traits

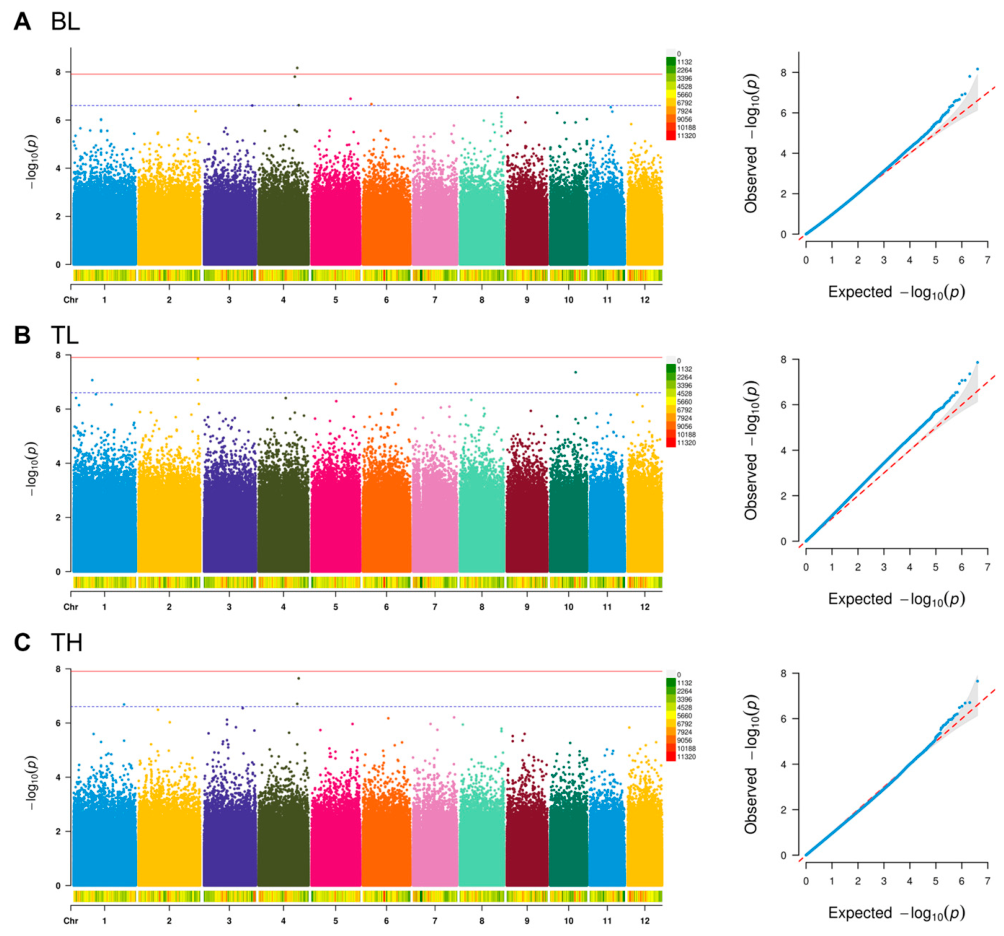
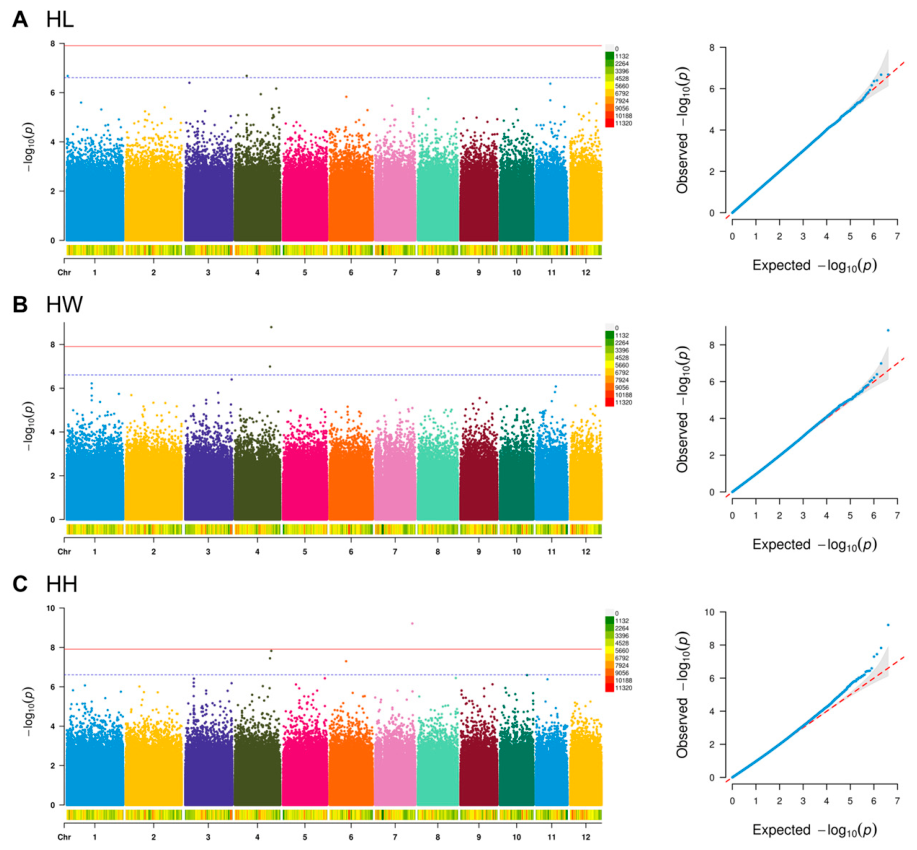
According to the GWAS results, 7.9 and 6.6 were, respectively, regarded as the significant and suggestive thresholds for SNP selection. A total of 3 significantly associated SNPs and 17 suggestively associated SNPs were identified on 7 different chromosomes, and most of the loci were clustered on Chr1, Chr4 and Chr6. For the 3 body size traits (body length, tail length and tail height), 12 SNPs on 6 chromosomes were associated with these traits (Figure 3). For the 3 head size traits (head length, head width and head height), 8 SNPs on 4 chromosomes were associated with these traits (Figure 4). It is worth noting that a SNP at the 54,765,792 bp site on Chr4 was significantly associated with the body length trait and was also suggestively associated with the other three traits of tail height, head width and head height; a SNP at the 56,804,310 bp site on Chr4 was significantly associated with the head width trait and was also suggestively associated with the other three traits of body length, tail height and head height. The inflation factors (λ) for the 6 body and head size traits (body length, tail length, tail height, head length, head width and head height) were 0.901, 1.152, 0.932, 1.009, 0.939 and 0.940, respectively.

3.6. GWAS for Muscle Texture Traits

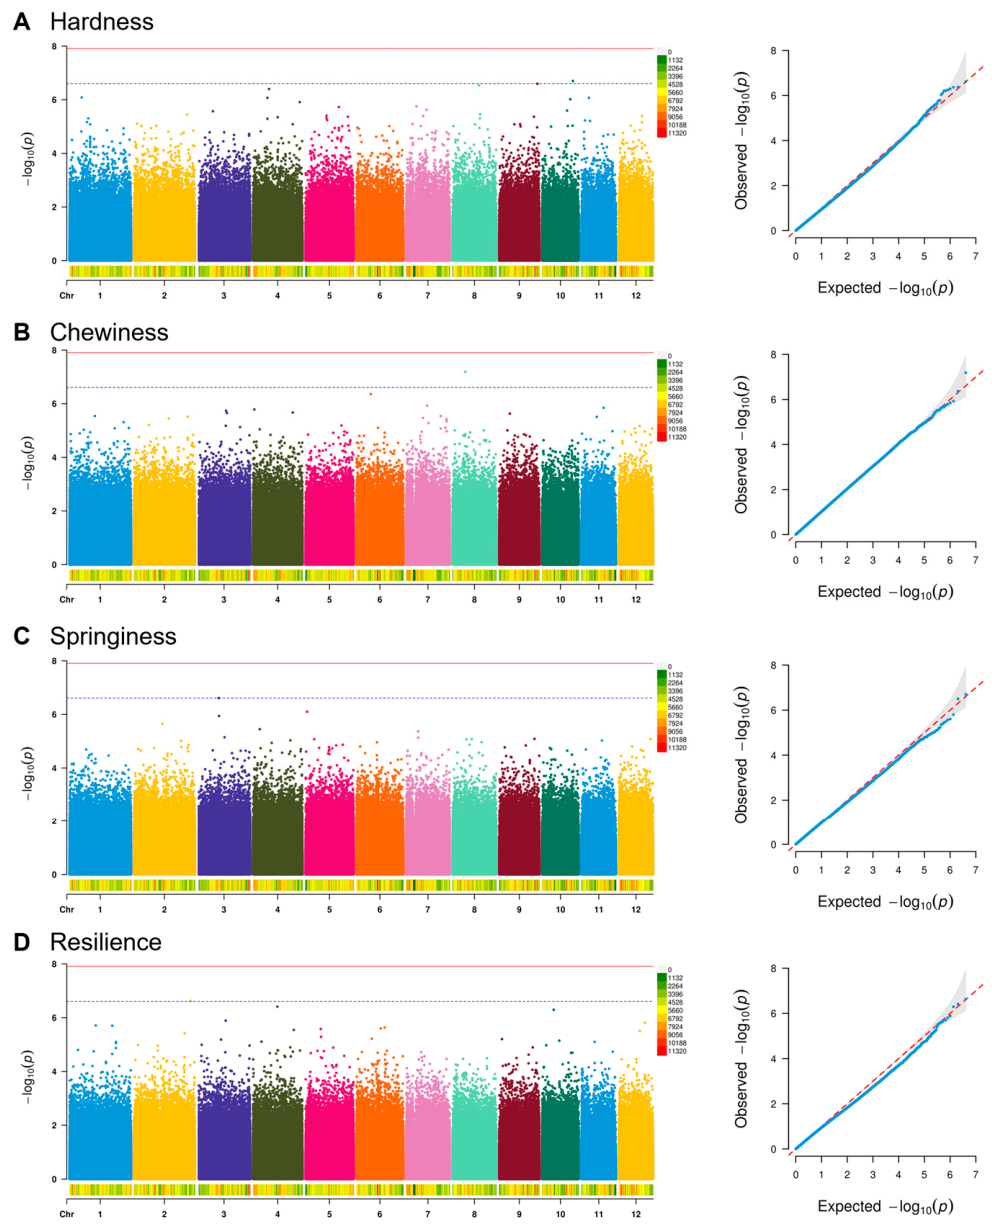
For the four muscle texture traits (hardness, chewiness, springiness, and resilience), a total of 14 suggestively associated SNPs were identified on four different chromosomes, located on Chr10, Chr8, Chr3, and Chr2, respectively (Figure 5). The inflation factors (λ) for these traits were 0.919, 1.028, 0.976, and 0.943, respectively.

3.7. Candidate Genes Associated with Body Shape Traits

By searching the genomic regions within 200 kb upstream and downstream of the 3 significant and 17 suggestive associated SNPs in body shape traits, a total of 13 significant genes (Table 6) and 61 suggestive genes (Table 7) were identified and annotated. For the body length trait, 6 significantly associated genes were identified in the genomic region related to Chr4, such as carnitine palmitoyltransferase 1b (muscle) (cpt1b) and beta-1,4-N-acetyl-galactosaminyl transferase 4a (b4galnt4a); for the head height trait, 5 significantly associated genes were identified in the genomic region related to Chr7, such as laminin alpha 1 (lama1) and glial cells missing transcription factor 2 (gcm2); for the head width trait, 2 significantly associated genes were identified in the genomic region related to Chr4, including tetraspanin 9 (tspan9) and RAS and EF-hand domain-containing gene (rasef). The genes suggestively associated with head length, body length, and tail length traits on Chr1, 9, and 10, respectively, such as bone morphogenetic protein receptor type 1A (bmpr1a), thyroid hormone receptor alpha B (thrab), and CXXC-type zinc finger protein 5b (cxxc5b), are involved in cell growth and skeletal development.

3.8. Candidate Genes Associated with Muscle Texture Traits

By searching the genomic regions within 200 kb upstream and downstream of each of the four suggestively associated SNPs in muscle texture traits, a total of 14 suggestively associated genes were identified and annotated (Table 8). Among these genes, hardness-related genes such as SLAIN motif family, member 2 (slain2), chewiness-related genes such as follistatin-like 1b (fstl1b), and springiness-related genes such as type V collagen α3a (col5a3a) are involved in growth, muscle development, and collagen synthesis.

4. Discussion

4.1. Genetic Architecture Underlying Morphometric Variation in Monopterus albus

Body morphology traits are important economic characteristics in aquaculture species because they directly affect production efficiency, processing yield, and consumer preference [2,30]. In the present study, significant correlations were observed among multiple morphological traits in M. albus. Body length exhibited a significant positive correlation with tail length (r = 0.560, p < 0.01) and head length (r = 0.392, p < 0.01), indicating that the increase in overall body size during eel growth is accompanied by coordinated development of different body regions. Furthermore, head length showed significant positive correlations with almost all measured morphological traits, whereas head width was significantly correlated with other traits except the ratio of head length to body length. These results suggest that morphological traits in rice field eel may share partially overlapping genetic and developmental mechanisms, providing a foundation for further genetic dissection of body shape variation. The research on fish morphology is mainly described through traditional measurement and geometric morphometry [31,32]. With the development of molecular biology techniques, it has become a trend to combine them with morphological research [33]. GWAS is currently widely used to evaluate the associations between SNPs scattered in the genome and target complex traits, such as analyzing the relationships between fish genes and morphological traits and mining key genes and molecular markers that affect morphological characteristics [1,34,35].
In this study, a significant SNP located on chromosome 4 was simultaneously associated with four morphological traits, including body length, tail height, head width, and head height. Several candidate genes located within the surrounding genomic region were identified. Based on their previously reported biological functions, some of these genes may be involved in processes related to growth regulation, nutrient metabolism, and skeletal development; however, their specific roles in rice field eel morphology require further validation. Among these genes, b4galnt4a belongs to the β-1,4-N-acetylgalactosaminyltransferase family and encodes an enzyme involved in the biosynthesis of glycan structures in glycoproteins and glycolipids [36]. Glycosylation modification plays an essential role in extracellular matrix organization, cell adhesion, and signal transduction. Previous studies have demonstrated that glycopeptide–calcium complexes can enhance calcium transport efficiency, stimulate osteogenic factor secretion, and promote mineralized nodule formation in Caco-2 cells [37]. These findings suggest that glycosylation-associated pathways may participate in skeletal development. Although the biological function of b4galnt4a in fish remains unclear, its location within the associated genomic region suggests that it may represent a potential regulator of body morphology through effects on bone development and extracellular matrix remodeling.
Several other candidate genes identified in this region are closely associated with energy metabolism and growth regulation. The tmem86a gene encodes a plasmalogen lysophospholipase involved in maintaining plasmalogen homeostasis and regulating lipid metabolism in mammalian adipose tissue [38]. Given that lipid metabolism provides essential energy and structural components for growth and tissue development, variation in tmem86a may influence growth-related traits by affecting lipid storage and utilization in metabolically active tissues, including liver and muscle. In addition, carnitine palmitoyltransferase 1B (cpt1b) is a rate-limiting enzyme controlling mitochondrial fatty acid β-oxidation and plays an important role in lipid metabolism regulation. Previous studies in grass carp (Ctenopharyngodon idella) and gilthead sea bream (Sparus aurata) have demonstrated that cpt1b contributes to the regulation of lipid utilization and energy metabolism [39,40]. These findings support the possibility that lipid metabolic regulation contributes to morphological variation in rice field eel.
The mrpl23 gene was also identified within the candidate region. Comparative genomic analyses have revealed that the chromosomal region containing mrpl23 is evolutionarily conserved between fish and terrestrial vertebrates and overlaps with genomic regions associated with insulin-like growth factor 2 (igf2), a well-established regulator of growth and development [41]. Therefore, mrpl23 may represent another potential candidate gene involved in growth regulation, although its specific function in fish requires further experimental validation. A shared SNP associated with body length, head width, head height, and tail height was also detected on chromosome 4. Two additional candidate genes, tspan9 and rasef, were annotated within the surrounding genomic region. However, functional studies of these genes in fish are currently limited. Future investigations integrating gene expression profiling, functional assays, and population validation will be necessary to clarify their potential roles in regulating morphological traits.

4.2. Candidate Genes Associated with Growth and Skeletal Development

For the head height trait, a significant SNP locus was identified through GWAS analysis, and five candidate genes located within the associated genomic region were annotated. These genes are potentially involved in biological processes related to muscle development, extracellular matrix organization, and skeletal morphogenesis, suggesting that genetic variation within this region may contribute to differences in head morphology among rice field eel populations.
Among these candidate genes, lama1 encodes the laminin α1 subunit, which is a key component of the laminin family and plays essential roles in extracellular matrix (ECM) formation, cell adhesion, tissue morphogenesis, and signal transduction [42,43]. Laminins are major structural proteins of the basement membrane and provide important regulatory signals for cell proliferation, differentiation, and tissue development. In mammals, lama1 and lama2 contribute to the maintenance of skeletal muscle integrity by forming laminin networks in the muscle basement membrane, whereas mutations in lama2 result in severe muscular dystrophy and impaired muscle development [36,44]. Although the function of lama1 in fish skeletal development remains largely unexplored, its conserved role in ECM organization suggests that it may participate in muscle and craniofacial development in M. albus by regulating cell–matrix interactions and tissue remodeling. The gcm2 gene is another potential candidate associated with head morphology. Previous studies in zebrafish have demonstrated that gcm2 regulates gill arch development by controlling the expression of parathyroid hormone 1 (pth1), thereby influencing craniofacial skeletal formation [45]. In teleost fish, the gill arches represent important skeletal structures that support respiration and feeding functions. Therefore, genetic variation in gcm2 may affect head-related morphological traits by altering gill arch development and craniofacial skeletal patterning. This finding provides a potential molecular explanation for the association between the identified SNP locus and head height variation in rice field eel.
In addition to significantly associated loci, several genes located near suggestively associated SNPs were also identified as potential regulators of body morphology. Among these, wnt3a is a core component of the Wnt/β-catenin signaling pathway, which plays fundamental roles in embryonic development, body axis formation, cell proliferation, and differentiation [46]. Previous studies have shown that dietary arginine supplementation in grass carp (Ctenopharyngodon idella) enhances wnt3a expression and promotes growth and muscle development through activation of the Wnt/β-catenin pathway [47]. Therefore, variation in wnt3a-associated genomic regions may influence body size-related traits in rice field eel by affecting developmental signaling pathways and tissue growth. The thrab gene encodes a thyroid hormone receptor subtype involved in thyroid hormone-mediated transcriptional regulation. Thyroid hormones are essential regulators of vertebrate growth, metabolism, and development. In zebrafish, thyroid hormone signaling interacts with the growth hormone (GH)/insulin-like growth factor (IGF) axis through thyroid hormone receptors, thereby modulating GH secretion and IGF-1 activity and ultimately influencing body size and growth rate [48,49]. Given the central role of the GH/IGF pathway in fish growth regulation, thrab represents a biologically plausible candidate gene underlying morphological variation in M. albus. Furthermore, bmpr1a, a member of the bone morphogenetic protein receptor (BMPR) family, was identified within the candidate regions associated with body morphology traits. BMP signaling is a highly conserved pathway involved in multiple developmental processes, including skeletal formation, cartilage differentiation, and bone remodeling [50,51]. Previous studies in fish have demonstrated that BMP family members regulate skeletal traits, including intermuscular bone formation. For example, bmp6a, another member of the BMP signaling family, has been associated with intermuscular bone development in several fish species [52,53]. Therefore, variation in bmpr1a may influence body morphology through modulation of BMP signaling pathways involved in skeletal development. Collectively, the candidate genes identified in this study encompass diverse biological pathways, including extracellular matrix organization, skeletal development, growth regulation, and metabolic processes. Although further functional validation is required to confirm their direct roles, these genes provide valuable molecular clues for understanding the genetic mechanisms underlying body shape variation in rice field eel. The identified genomic regions and candidate genes may serve as potential targets for future molecular breeding programs aimed at improving economically important morphological traits.

4.3. Genetic Basis of Muscle Texture Variation and Implications for Flesh Quality Improvement

Muscle texture is a key quality attribute of aquatic products and directly influences consumer acceptance, processing characteristics, and the economic value of cultured fish. It is determined by complex interactions among muscle fiber characteristics, extracellular matrix (ECM) composition, collagen structure, and postmortem biochemical changes [54]. In the present study, several candidate genes associated with muscle texture traits were identified through GWAS analysis, providing new insights into the potential genetic mechanisms regulating flesh quality variation in M. albus.
Among the candidate genes identified, fstl1b represents a strong functional candidate associated with muscle texture traits. The fstl1 gene belongs to the follistatin-like protein family and encodes a secreted protein that interacts with members of the transforming growth factor-β (TGF-β) superfamily, including growth differentiation factors (GDFs) and bone morphogenetic proteins (BMPs), thereby regulating skeletal muscle development and tissue remodeling [55]. Previous studies in zebrafish have demonstrated that overexpression of fstl1b significantly increases skeletal muscle fiber number and promotes muscle growth [56]. Furthermore, follistatin-related proteins can antagonize myostatin (mstn) activity, thereby releasing the inhibitory effect of myostatin on muscle development [57]. In rainbow trout (Oncorhynchus mykiss), overexpression of fst resulted in a double-muscling-like phenotype characterized by increased muscle mass and enhanced muscle fiber density [58]. These findings collectively suggest that variation in fstl1b may influence muscle texture traits in rice field eel by regulating muscle fiber development, although the underlying molecular mechanism requires further validation.
Collagen-related genes were also identified as potential regulators of muscle texture variation. The col5a3a gene encodes a component of type V collagen, which functions as an important regulator of collagen fibril assembly and extracellular matrix organization. Type V collagen interacts with other collagen subtypes, such as type I collagen, to form a stable extracellular fibrous network that provides structural support and mechanical strength to muscle tissues [59]. Previous studies in fish have demonstrated that degradation of collagen networks is closely associated with muscle softening during storage. For example, in sardine (Sardina pilchardus), degradation of type V collagen after refrigeration weakens the connective tissue surrounding muscle cells, resulting in reduced muscle firmness [60]. Therefore, genetic variation in col5a3a may affect muscle texture by altering collagen deposition, ECM stability, and resistance to structural degradation. The identification of col5a3a as a candidate gene provides new evidence that ECM-related pathways contribute to flesh quality variation in rice field eel.
The pnn gene was also located within genomic regions associated with muscle texture traits. pnn encodes a nuclear and desmosome-associated serine/arginine-rich protein involved in RNA processing, cell adhesion, and epithelial integrity. Although its function in fish muscle quality remains largely unknown, emerging evidence suggests that pnn may participate in skeletal and cartilage development. In zebrafish, knockdown of pnn resulted in impaired expression of sox9a, a key chondrogenic transcription factor involved in cartilage formation [61]. In Nile tilapia (Oreochromis niloticus), sox9 signaling has been shown to play important roles in cartilage development and skeletal formation [62]. Considering the close relationship between connective tissue development, skeletal structure, and muscle attachment, pnn may indirectly influence muscle texture by affecting cartilage formation, ECM organization, or tissue structural integrity. However, further functional studies are required to clarify the biological role of pnn in fish muscle quality regulation.

4.4. Limitations

This study has several limitations. First, the samples were collected from geographically diverse wild populations, and potential environmental and geographic effects cannot be completely excluded despite the use of a mixed-model GWAS approach. Second, body mass was not included as an additional covariate; therefore, potential effects of overall body size on absolute morphometric traits cannot be completely excluded. In addition, muscle texture traits may be influenced by sample handling and storage conditions. Finally, the identified loci and nearby genes represent statistical associations and positional candidate genes, and further validation is required to confirm their biological functions. Future studies using controlled breeding populations, larger population panels, and functional validation approaches will be necessary to further confirm the biological effects of these candidate regions.

5. Conclusions

In summary, we conducted a GWAS on the body shape and muscle texture traits of eels to reveal the regulatory genes controlling these traits. We identified a total of 3 significantly associated SNPs and 17 suggestively associated SNPs related to the body shape traits of eels, most of which are located on Chr4. By analyzing the genomic regions of these SNPs, we identified a set of candidate genes involved in regulating biological processes such as fish growth, nutrient metabolism, and skeletal development, including b4galnt4a, tmem86a, cpt1b, mrpl23, lama1, gcm2, wnt3a, thrab, and bmpr1a, among others. Additionally, we revealed 4 suggestively associated SNPs related to the muscle texture traits of eels. Through analysis of the genomic regions surrounding these SNPs, several candidate genes were identified, including fstl1b, col5a3a, and pnn. These results help further understand the genetic mechanisms of body shape, skeletal development, and muscle texture in eels. By identifying relevant genes, this study supports the future selection of eel germplasm with superior traits based on molecular marker-assisted breeding.

Supplementary Materials

The following supporting information can be downloaded at https://www.mdpi.com/article/10.3390/fishes11090498/s1, Table S1: Detailed sampling information for 367 wild M. albus collected from 21 sites; Table S2: Raw data statistics of 367 M. albus whole genome re-sequencing samples; Table S3: Clean data statistics of 367 M. albus whole genome re-sequencing samples.

Author Contributions

W.L.: Funding acquisition; Investigation; Project administration; Resources; Writing—original draft; Writing—review and editing. M.L. (Muyan Li): Data curation; Formal analysis; Software; Visualization; Writing—original draft. Y.G.: Software; Writing—original draft. W.H.: Writing—review and editing. M.L. (Mingyou Li): Funding acquisition; Project administration; Resources; Supervision; Writing—review and editing. W.Z.: Funding acquisition; Conceptualization; Resources; Software; Writing—review and editing. All authors have read and agreed to the published version of the manuscript.

Funding

This research was funded by the National Key Research and Development Program of China, grant number 2024YFD2401503; National Key Research and Development Program of China, grant number 2022YFD2400102; the China Agriculture Research System of MOF and MARA, grant number CARS-46; and the Outstanding team of Shanghai Academy of Agricultural Sciences, grant number 2025-031.

Institutional Review Board Statement

All animal care and experimental procedures were conducted in strict accordance with the guidelines approved by the Experimental Animal Ethics Committee of the Shanghai Academy of Agricultural Sciences (Approval Number: SAASPZ0520016 on 15 May 2023).

Informed Consent Statement

Not applicable.

Data Availability Statement

The datasets generated for this study are available on request to the corresponding author.

Conflicts of Interest

The authors declare no conflicts of interest.

References

  1. Geng, X.; Liu, S.; Yao, J.; Bao, L.; Zhang, J.; Li, C.; Wang, R.; Sha, J.; Zeng, P.; Zhi, D.; et al. A Genome-Wide Association Study Identifies Multiple Regions Associated with Head Size in Catfish. G3-Genes Genomes Genet. 2016, 6, 3389–3398. [Google Scholar] [CrossRef] [Scilit]
  2. Rutten, M.J.M.; Bovenhuis, H.; Komen, H. Genetic parameters for fillet traits and body measurements in Nile tilapia (Oreochromis niloticus L.). Aquaculture 2005, 246, 125–132. [Google Scholar] [CrossRef] [Scilit]
  3. Hong, H.; Luo, Y.; Zhou, Z.; Bao, Y.; Lu, H.; Shen, H. Effects of different freezing treatments on the biogenic amine and quality changes of bighead carp (Aristichthys nobilis) heads during ice storage. Food Chem. 2013, 138, 1476–1482. [Google Scholar] [CrossRef] [Scilit]
  4. Zhou, Y.; Fu, B.; Yu, X.; Chen, G.; Wang, J.; Luo, W.; Feng, Y.; Tong, J. Genome-wide association study reveals genomic regions and candidate genes for head size and shape in bighead carp (Hypophthalmichthys nobilis). Aquaculture 2021, 539, 736648. [Google Scholar] [CrossRef] [Scilit]
  5. Cheng, J.; Sun, D.; Han, Z.; Zeng, X. Texture and Structure Measurements and Analyses for Evaluation of Fish and Fillet Freshness Quality: A Review. Compr. Rev. Food Sci. Food Saf. 2014, 13, 52–61. [Google Scholar] [CrossRef] [Scilit]
  6. Alexi, N.; Byrne, D.V.; Nanou, E.; Grigorakis, K. Investigation of sensory profiles and hedonic drivers of emerging aquaculture fish species. J. Sci. Food Agr. 2018, 98, 1179–1187. [Google Scholar] [CrossRef] [Scilit]
  7. Li, Q.; Huang, Y.; Zhang, X.; Qin, Z.; Zou, C.; Tan, X.; Xie, X.; Liang, S.; Lin, L. Effects of faba beans (Vicia faba L.) on growth performance, textural quality and physiological indices of tilapia (Oreochromis niloticus). Aquaculture 2023, 574, 739640. [Google Scholar] [CrossRef] [Scilit]
  8. Fu, B.; Zheng, M.; Yang, H.; Zhang, J.; Li, Y.; Wang, G.; Tian, J.; Zhang, K.; Xia, Y.; Li, Z.; et al. The effect of broad bean diet on structure, flavor and taste of fresh grass carp: A comprehensive study using E-nose, E-tongue, TPA, HS-SPME-GC-MS and LC-MS. Food Chem. 2024, 436, 137690. [Google Scholar] [CrossRef] [Scilit]
  9. Hao, Y.; Jia, X.; Yuan, L.; Liu, Y.; Gui, L.; Shen, Y.; Li, J.; Xu, X. Genome-wide association study reveals growth-related SNPs and candidate genes in grass carp (Ctenopharyngodon idella). Aquaculture 2023, 577, 739979. [Google Scholar] [CrossRef] [Scilit]
  10. Yu, Y.; Wan, S.; Zhang, S.; Liu, J.; Sun, A.L.; Wang, Y.; Zhu, Y.; Gu, S.; Gao, Z. Identification of SNPs and candidate genes associated with growth using GWAS and transcriptome analysis in Coilia nasus. Aquaculture 2024, 586, 739979. [Google Scholar] [CrossRef] [Scilit]
  11. Han, S.; Wang, J.; Zhang, J.; Wang, Y.; Luo, Y.; Liu, Q.; Chen, L. GWAS and selective sweep analysis reveal the genetic basis of cold tolerance in the domesticated pufferfish (Takifugu obscurus). Aquaculture 2025, 598, 742018. [Google Scholar] [CrossRef] [Scilit]
  12. Yan, F.; Xu, Y.; Feng, W.; He, Q.; Hua, G.; Li, W.; Xu, P.; Zhou, J.; Tang, Y. Genomic analysis of hypoxia-tolerant population of the Chinese mitten crab (Eriocheir sinensis). Fish Shellfish Immunol. 2024, 154, 109931. [Google Scholar] [CrossRef] [Scilit]
  13. Ali, A.; Al-Tobasei, R.; Lourenco, D.; Leeds, T.; Kennet, B.; Salem, M. Genome-wide scan for common variants associated with intramuscular fat and moisture content in rainbow trout. BMC Genom. 2020, 21, 529. [Google Scholar] [CrossRef] [Scilit]
  14. Zhang, J.; Wang, Q.; Cao, Y.; Hou, M.; Zhao, R.; Chen, Y.; Yu, S.; Wang, K.; Zhang, Q.; Li, S.; et al. Genome-wide association analysis identifies genetic variants associated with muscle fatty acids and amino acids in grass carp (Ctenopharyngodon idella). Agric. Commun. 2024, 2, 100043. [Google Scholar] [CrossRef] [Scilit]
  15. Van Vu, S.; Kumar, M.; Rastas, P.; Boudry, P.; Gheyas, A.; Bean, T.P.; Nguyen, M.T.; Tran, K.D.; Geist, J.; Nguyen, H.H.; et al. High-density linkage map and single nucleotide polymorphism association with whole weight, meat yield, and shell shape in the Portuguese oyster, Crassostrea angulata. Aquacult. Int. 2024, 32, 10109–10122. [Google Scholar] [CrossRef] [Scilit]
  16. Van Vu, S.; O’Connor, W.; Van Vu, I.; Gondro, C.; Nguyen, T.T.A.; Kundu, S.; Woo, K.H.; Lee, S.R.; Khanh, T.D.; Nguyen, T.K.; et al. Genome wide association study of shell growth, condition index, shell and mantle colour in the Portuguese oyster, Crassostrea angulata. Aquac. Int. 2025, 33, 551. [Google Scholar] [CrossRef] [Scilit]
  17. Shi, X.; Zhu, W.; Guo, J.; Lin, K.; Fu, J.; Wang, L.; Dong, Y.; Luo, M.; Dong, Z. Genome-wide association study reveals candidate genes critical for skin pigmentation in common carp (Cyprinus carpio) strains including koi. Aquaculture 2024, 590, 741075. [Google Scholar] [CrossRef] [Scilit]
  18. Xu, W.; Luo, H.; Jiang, Y.; Song, Y.; Tao, B.; Luo, D.; Chen, J.; Hu, W. Identification of body coloration related genes in ricefield eel (Monopterus albus) using GWAS. Aquaculture 2025, 595, 741489. [Google Scholar] [CrossRef] [Scilit]
  19. Matsumoto, S.; Kon, T.; Yamaguchi, M.; Takeshima, H.; Yamazaki, Y.; Mukai, T.; Kuriiwa, K.; Kohda, M.; Nishida, M. Cryptic diversification of the swamp eel Monopterus albus in East and Southeast Asia, with special reference to the Ryukyuan populations. Ichthyol. Res. 2010, 57, 71–77. [Google Scholar] [CrossRef] [Scilit]
  20. Zhang, J.; Zhong, L.; Chi, S.; Chu, W.; Liu, Y.; Hu, Y. Sodium butyrate supplementation in high-soybean meal diets for juvenile rice field eel (Monopterus albus): Effects on growth, immune response and intestinal health. Aquaculture 2020, 520, 734952. [Google Scholar] [CrossRef] [Scilit]
  21. Lv, W.; Li, M.; Mao, Y.; Huang, W.; Yuan, Q.; Li, M.; Zhou, Q.; Yang, H.; Zhou, W. Effects of dietary melatonin supplementation on growth performance and intestinal health of rice field eel (Monopterus albus). Comp. Biochem. Physiol. D 2024, 52, 101273. [Google Scholar] [CrossRef] [Scilit]
  22. Yang, H.; Wu, C.; Yuan, Q.; Lv, W.; Qiu, J.; Li, M.; Zhang, Q.; Zhou, W. Effects of Dietary Chlorogenic Acid on the Growth, Lipid Metabolism, Antioxidant Capacity, and Non-Specific Immunity of Asian Swamp Eel (Monopterus albus). Fishes 2024, 9, 496. [Google Scholar] [CrossRef] [Scilit]
  23. Yuan, Q.; Wu, C.; Yang, H.; Lv, W.; Huang, W.; Zhang, Q.; Zhou, W. Effects of four types of natural bait on water quality, feeding, growth, and antioxidant enzyme activity of Monopterus albus in a recirculating aquaculture system. Front. Physiol. 2024, 15, 1403391. [Google Scholar] [CrossRef] [Scilit]
  24. Yang, H.; Yuan, Q.; Rahman, M.M.; Lv, W.W.; Huang, W.W.; Hu, W.; Zhou, W.Z. Biochemical, Histological, and Transcriptomic Analyses Reveal Underlying Differences in Flesh Quality between Wild and Farmed Ricefield Eel (Monopterus albus). Foods 2024, 13, 1751. [Google Scholar] [CrossRef] [Scilit]
  25. Chen, S.; Zhou, Y.; Chen, Y.; Gu, J. fastp: An ultra-fast all-in-one FASTQ preprocessor. Bioinformatics 2018, 34, 884–890. [Google Scholar] [CrossRef] [Scilit]
  26. Li, H.; Durbin, R. Fast and accurate short read alignment with Burrows-Wheeler transform. Bioinformatics 2009, 25, 1754–1760. [Google Scholar] [CrossRef] [Scilit] [PubMed]
  27. Wang, K.; Li, M.; Hakonarson, H. ANNOVAR: Functional annotation of genetic variants from high-throughput sequencing data. Nucleic Acids Res. 2010, 38, e164. [Google Scholar] [CrossRef] [Scilit] [PubMed]
  28. Yang, J.; Lee, S.H.; Goddard, M.E.; Visscher, P.M. GCTA: A Tool for Genome-wide Complex Trait Analysis. Am. J. Hum. Genet. 2011, 88, 76–82. [Google Scholar] [CrossRef] [Scilit]
  29. Price, M.N.; Dehal, P.S.; Arkin, A.P. FastTree: Computing Large Minimum Evolution Trees with Profiles instead of a Distance Matrix. Mol. Biol. Evol. 2009, 26, 1641–1650. [Google Scholar] [CrossRef] [Scilit]
  30. Kause, A.; Ritola, O.; Paananen, T.; Mäntysaari, E.; Eskelinen, U. Coupling body weight and its composition: A quantitative genetic analysis in rainbow trout. Aquaculture 2002, 211, 65–79. [Google Scholar] [CrossRef] [Scilit]
  31. Abu Hanif, M.; Chaklader, M.R.; Siddik, M.A.B.; Nahar, A.; Foysal, M.J.; Kleindienst, R. Phenotypic variation of gizzard shad, Anodontostoma chacunda (Hamilton, 1822) based on truss network model. Reg. Stud. Mar. Sci. 2019, 25, 100442. [Google Scholar] [CrossRef] [Scilit]
  32. Ferreira, I.; Schroeder, R.; Mugerza, E.; Oyarzabal, I.; McCarthy, I.D.; Correia, A.T. Chelidonichthys lucerna (Linnaeus, 1758) Population Structure in the Northeast Atlantic Inferred from Landmark-Based Body Morphometry. Biology 2024, 13, 17. [Google Scholar] [CrossRef] [Scilit]
  33. Zhang, C.; Chen, X.; Yuan, L.; Wu, Y.; Ma, Y.; Jie, W.; Jiang, Y.; Guo, J.; Qiang, L.; Han, C.; et al. Genetic diversity and population structure of Chinese Gizzard Shad Clupanodon thrissa in South China based on morphological and molecular markers. Glob. Ecol. Conserv. 2023, 41, e02367. [Google Scholar] [CrossRef] [Scilit]
  34. Fenton, S.; Jacobs, A.; Bean, C.W.; Adams, C.E.; Elmer, K.R. Genomic underpinnings of head and body shape in Arctic charr ecomorph pairs. Mol. Ecol. 2024, 33, e17305. [Google Scholar] [CrossRef] [Scilit]
  35. Kong, S.; Zhou, Z.; Zhou, T.; Zhao, J.; Chen, L.; Lin, H.; Pu, F.; Ke, Q.; Bai, H.; Xu, P. Genome-Wide Association Study of Body Shape-Related Traits in Large Yellow Croaker (Larimichthys crocea). Mar. Biotechnol. 2020, 22, 631–643. [Google Scholar] [CrossRef] [Scilit]
  36. Amado, M.; Almeida, R.; Schwientek, T.; Clausen, H. Identification and characterization of large galactosyltransferase gene families: Galactosyltransferases for all functions. Biochim. Biophys. Acta-Gen. Subj. 1999, 1473, 35–53. [Google Scholar] [CrossRef] [Scilit]
  37. Wu, X.; Wang, F.; Cai, X.; Wang, S. Characteristics and osteogenic mechanism of glycosylated peptides-calcium chelate. Curr. Res. Food Sci. 2022, 5, 1965–1975. [Google Scholar] [CrossRef] [Scilit]
  38. Cho, Y.K.; Yoon, Y.C.; Im, H.; Son, Y.; Kim, M.; Saha, A.; Choi, C.; Lee, J.; Lee, S.; Kim, J.H.; et al. Adipocyte lysoplasmalogenase TMEM86A regulates plasmalogen homeostasis and protein kinase A-dependent energy metabolism. Nat. Commun. 2022, 13, 4084. [Google Scholar] [CrossRef] [Scilit]
  39. Xu, Y.; Luo, Z.; Wu, K.; Fan, Y.; You, W.; Zhang, L. Structure and Functional Analysis of Promoters from Two Liver Isoforms of CPT I in Grass Carp Ctenopharyngodon idella. Int. J. Mol. Sci. 2017, 18, 2405. [Google Scholar] [CrossRef] [Scilit]
  40. Boukouvala, E.; Leaver, M.J.; Favre-Krey, L.; Theodoridou, M.; Krey, G. Molecular characterization of a gilthead sea bream (sparus aurata) muscle tissue cDNA for carnitine palmitoyltransferase 1B (CPT1B). Comp. Biochem. Physiol. B 2010, 157, 189–197. [Google Scholar] [CrossRef] [Scilit]
  41. Rotwein, P. The insulin-like growth factor 2 gene and locus in nonmammalian vertebrates: Organizational simplicity with duplication but limited divergence in fish. J. Biol. Chem. 2018, 293, 15912–15932. [Google Scholar] [CrossRef] [Scilit]
  42. Pickering, J.; Cunliffe, V.T.; Van Eeden, F.; Borycki, A.-G. Hedgehog signalling acts upstream of Laminin aiphal transcription in the zebrafish paraxial mesoderm. Matrix Biol. 2017, 62, 58–74. [Google Scholar] [CrossRef] [Scilit]
  43. Hamill, K.J.; Kligys, K.; Hopkinson, S.B.; Jones, J.C.R. Laminin deposition in the extracellular matrix: A complex picture emerges. J. Cell Sci. 2009, 122, 4409–4417. [Google Scholar] [CrossRef] [Scilit]
  44. Lake, N.J.; Phua, J.; Liu, W.; Moors, T.; Axon, S.; Lek, M. Estimating the Prevalence of LAMA2 Congenital Muscular Dystrophy using Population Genetic Databases. J. Neuromuscul. Dis. 2023, 10, 381–387. [Google Scholar] [CrossRef] [Scilit]
  45. Hogan, B.M.; Hunter, M.P.; Oates, A.C.; Crowhurst, M.O.; Hall, N.E.; Heath, J.K.; Prince, V.E.; Lieschke, G.J. Zebrafish gcm2 is required for gill filament budding from pharyngeal ectoderm. Dev. Biol. 2004, 276, 508–522. [Google Scholar] [CrossRef] [Scilit]
  46. Kim, S.-E.; Lee, W.-J.; Choi, K.-Y. The PI3 kinase-Akt pathway mediates Wnt3a-induced proliferation. Cell. Signal. 2007, 19, 511–518. [Google Scholar] [CrossRef] [Scilit]
  47. Ma, Y.; Zhou, X.; Wu, P.; Jiang, W.; Liu, Y.; Ren, H.; Zhang, R.; Li, S.; Tang, L.; Feng, L. New sight in arginine-improved flesh quality: Role of MRFs, cyclins, and WNT signaling in grass carp (Ctenopharyngodon idellus). Aquaculture 2024, 585, 740706. [Google Scholar] [CrossRef] [Scilit]
  48. Marelli, F.; Persani, L. Role of TRs in Zebrafish Development. Methods Mol. Biol. 2018, 1801, 287–298. [Google Scholar] [CrossRef] [Scilit]
  49. Vancamp, P.; Houbrechts, A.M.; Darras, V.M. Insights from zebrafish deficiency models to understand the impact of local thyroid hormone regulator action on early development. Gen. Comp. Endocrinol. 2019, 279, 45–52. [Google Scholar] [CrossRef] [Scilit]
  50. Wentworth, K.L.; Lalonde, R.L.; Groppe, J.C.; Brewer, N.; Moody, T.; Hansberry, S.; Taylor, K.E.; Shore, E.M.; Kaplan, F.S.; Pignolo, R.J.; et al. Functional Testing of Bone Morphogenetic Protein (BMP) Pathway Variants Identified on Whole-Exome Sequencing in a Patient with Delayed-Onset Fibrodysplasia Ossificans Progressiva (FOP) Using ACVR1R206H-Specific Human Cellular and Zebrafish Models. J. Bone Miner. Res. 2022, 37, 2058–2076. [Google Scholar]
  51. Chen, C.; Wang, X.; Li, Y.; Zhao, T.; Wang, H.; Gao, Y.; Feng, Y.; Wang, J.; Shang, L.; Wang, Y.; et al. Hypobaric hypoxia causes low fecundity in zebrafish parents and impairment of skeletal development in zebrafish embryos and rat offspring. Reprod. Toxicol. 2024, 127, 108603. [Google Scholar] [CrossRef] [Scilit]
  52. Xu, H.; Tong, G.; Yan, T.; Dong, L.; Yang, X.; Dou, D.; Sun, Z.; Liu, T.; Zheng, X.; Yang, J.; et al. Transcriptomic Analysis Provides Insights to Reveal the bmp6 Function Related to the Development of Intermuscular Bones in Zebrafish. Front. Cell Dev. Biol. 2022, 10, 821471. [Google Scholar] [CrossRef] [Scilit]
  53. Li, X.; Zhang, C.; Feng, C.; Zhang, Z.; Feng, N.; Sha, H.; Luo, X.; Zou, G.; Liang, H. Transcriptome Analysis Elucidates the Potential Key Genes Involved in Rib Development in bmp6-Deficient Silver Carp (Hypophthalmichthys molitrix). Animals 2024, 14, 1451. [Google Scholar] [CrossRef] [Scilit]
  54. Hyldig, G.; Nielsen, D. A review of sensory and instrumental methods used to evaluate the texture of fish muscle. J. Texture Stud. 2001, 32, 219–242. [Google Scholar] [CrossRef] [Scilit]
  55. Gajos-Michniewicz, A.; Piastowska, A.W.; Russell, J.A.; Ochedalski, T. Follistatin as a potent regulator of bone metabolism. Biomarkers 2010, 15, 563–574. [Google Scholar] [CrossRef] [Scilit]
  56. Li, X.; Nie, F.; Yin, Z.; He, J. Enhanced hyperplasia in muscles of transgenic zebrafish expressing Follistatin1. Sci. China Life Sci. 2011, 54, 159–165. [Google Scholar] [CrossRef] [Scilit]
  57. Rebhan, Y.; Funkenstein, B. Inhibition of fish myostatin activity by recombinant fish follistatin and myostatin prodomain: Potential implications for enhancing muscle growth in farmed fish. Aquaculture 2008, 284, 231–238. [Google Scholar] [CrossRef] [Scilit]
  58. Medeiros, E.F.; Phelps, M.P.; Fuentes, F.D.; Bradley, T.M. Overexpression of follistatin in trout stimulates increased muscling. Am. J. Physiol.-Regul. Integr. Comp. Physiol. 2009, 297, R235–R242. [Google Scholar] [CrossRef] [Scilit]
  59. Hoffman, G.G.; Branam, A.M.; Huang, G.; Pelegri, F.; Cole, W.G.; Wenstrup, R.M.; Greenspan, D.S. Characterization of the six zebrafish clade B fibrillar procollagen genes, with evidence for evolutionarily conserved alternative splicing within the pro-α1 (V) C-propeptide. Matrix Biol. 2010, 29, 261–275. [Google Scholar] [CrossRef] [Scilit]
  60. Sato, K.; Ando, M.; Kubota, S.; Origasa, K.; Kawase, H.; Toyohara, H.; Sakaguchi, M.; Nakagawa, T.; Makinodan, Y.; Ohtsuki, K.; et al. Involvement of type V collagen in softening of fish muscle during short-term chilled storage. J. Agr. Food Chem. 1997, 45, 343–348. [Google Scholar] [CrossRef] [Scilit]
  61. Hsu, S.-Y.; Cheng, Y.-C.; Shih, H.-Y.; Ouyang, P. Dissection of the role of Pinin in the development of zebrafish posterior pharyngeal cartilages. Histochem. Cell Biol. 2012, 138, 127–140. [Google Scholar] [CrossRef] [Scilit]
  62. Li, X.; Tang, Y.; Deng, W.; Zheng, Y.; Wang, L.; He, X.; Xie, Q.; Li, Y.; Deng, L.; Wang, D.; et al. Involvement of Sox9a in chondrogenesis and gonadal development in teleost Nile tilapia (Oreochromis niloticus). Zool. Res. 2023, 44, 729–731. [Google Scholar] [CrossRef] [Scilit]
Figure 1. Density distribution map of SNPs on the chromosome within 0.1 Mb window size, chr1–12 represents chromosomes 1–12.
Fishes 11 00498 g001
Figure 2. Population structure analysis results. (A) PCA plots of the 21 populations based on SNPs. (B) Phylogenetic tree constructed from 367 individuals based on SNPs by the maximum likelihood method, different colors represent different regional groups.
Fishes 11 00498 g002
Figure 3. Manhattan and Q-Q plots of GWAS for body size traits in M. albus. (A) BL, body length. (B) TL, tail length. (C) TH, tail height. Significance levels are shown by red line (7.9) and suggestive levels are represented by blue line (6.6).
Fishes 11 00498 g003
Figure 4. Manhattan and Q-Q plots of GWAS for head shape traits in M. albus. (A) HL, head length. (B) HW, head width. (C) HH, head height. Significance levels are shown by red line (7.9) and suggestive levels are represented by blue line (6.6).
Fishes 11 00498 g004
Figure 5. Manhattan and Q-Q plots of GWAS for muscle texture traits in M. albus. Significance levels are shown by red line (7.9) and suggestive levels are represented by blue line (6.6).
Fishes 11 00498 g005
Table 1. Statistical summary of morphometric measurements of body size and head shape for the GWAS M. albus population (n = 367).
TraitsMinMaxMean ± SDCV
BL (cm)42.0165.5550.58 ± 3.096.10%
HL (cm)2.765.804.02 ± 0.4812.05%
HW (cm)1.172.851.82 ± 0.2413.32%
HH (cm)1.513.412.20 ± 0.3114.09%
TL (cm)8.9517.9912.46 ± 1.3210.63%
TH (cm)1.052.751.58 ± 0.2817.94%
TL/BL (%)18.8831.1524.64 ± 2.188.85%
HL/BL (%)5.5211.007.96 ± 0.9011.27%
HL/HW (%)128.37369.60224.49 ± 36.3516.19%
Note: BL, body length; HL, head length; HW, head width; HH, head height; TL, tail length; TH, tail height; CV, coefficient of variation.
Table 2. Pearson’s correlation between nine body size and head shape traits of the M. albus population.
BLHLHWHHTLTHTL/BLHL/BLHL/HW
BL1
HL0.392 **1
HW0.211 **0.205 **1
HH0.196 **0.147 **0.291 **1
TL0.560 **0.403 **0.310 **0.271 **1
TH0.0890.224 **0.255 **0.539 **0.277 **1
TL/BL−0.0160.213 **0.223 **0.198 **0.817 **0.276 **1
HL/BL−0.130 **0.859 **0.0970.0520.123 *0.192 **0.238 **1
HL/HW0.0990.565 **−0.671 **−0.0820.036−0.026−0.0210.562 **1
Note: ** means p < 0.01, * means p < 0.05. BL, body length; HL, head length; HW, head width; HH, head height; TL, tail length; TH, tail height.
Table 3. Statistical summary of muscle texture profile for the GWAS M. albus population (n = 367).
TraitsMinMaxMean ± SDCV
Hardness/gf235.521299.06692.71 ± 174.1825.14%
Chewiness/gf67.36289.76147.79 ± 42.1328.15%
Springiness0.510.940.75 ± 0.0912.15%
Resilience0.070.280.16 ± 0.0425.23%
Table 4. Pearson’s correlation between four muscle texture profile traits of the M. albus population.
HardnessChewinessSpringinessResilience
Hardness1
Chewiness0.267 **1
Springiness0.209 **−0.0201
Resilience0.137 **0.0210.1001
Note: ** means p < 0.01.
Table 5. Statistical outcomes of SNP identification across different genomic regions.
TypeSNP NumberPercentage
Intergenic33,026,17249.49%
Intronic27,404,34141.07%
Exonic2,343,7843.51%
Upstream2,029,7593.04%
Downstream1,838,7862.76%
Upstream & downstream83,8540.13%
Splicing72520.01%
Total66,733,948100%
Note: Upstream: variant overlaps 1 kb region upstream of transcription start site. Downstream: variant overlaps 1 kb region downstream of transcription end site. Upstream & downstream: variant in regions upstream and downstream of the transcription start site. Splicing: variant is within 2 bp of a splicing junction.
Table 6. Information on 13 candidate genes in 3 SNPs regions based on GWAS that are significantly associated with body size and head shape traits in M. albus.
TraitsSNP
Position/bp
Chr−log10
(p-Value)
Gene Start/bpGene End/bpGene
Name
Gene Annotation
BL54,765,79248.1754,797,09054,811,033tmem86atransmembrane protein 86a
54,813,73154,817,671spty2d1SPT2 chromatin protein domain containing 1
54,822,58154,847,407usp6nlUSP6 N-terminal like
54,888,25354,913,544cpt1bcarnitine palmitoyltransferase 1b (muscle)
54,947,91954,983,835mrpl23mitochondrial ribosomal protein L23
54,639,19754,776,945b4galnt4abeta-1,4-N-acetyl-galactosaminyl transferase 4a
HH62,253,38379.2162,064,33662,158,225lama1laminin, alpha 1
62,173,96062,187,777l3mbtl3L3MBTL histone methyl-lysine binding protein1b
62,204,12162,222,943arhgap18Rho GTPase activating protein 18
62,232,33362,242,818gnalG protein subunit alpha L
62,271,34162,279,190gcm2glial cells missing transcription factor 2
HW56,904,31048.7956,743,58456,811,912tspan9tetraspanin 9
57,001,86557,020,229rasefRAS and EF-hand domain containing
Table 7. Information on 61 candidate genes in 17 SNPs regions identified based on GWAS that are suggestively associated with body size and head shape traits in M. albus.
TraitsSNP Position/bpChr−log10
(p-Value)
Candidate Gene Name
BL51,385,31647.80pdp2, neto2, arf4, rab12, frmd4a, shank2
56,904,31046.62tspan9, rasef
55,751,78656.89mov10, fkbp1, ccdc115, rhoab, ebp
12,072,53466.66edf1, prag1, nacc2, nup214
22,342,96596.94wnt3a, psmd11b, thrab, cdk5r1, nsf, ormdl3, myo1d
TL26,709,67117.07adcyap1b, enosf1, tyms
46,578,54466.93c4b, aif1l, kcnk5, tyrobp, nfkbid, fxyd6, fhod3a, rxraa, csnk2b
25,212,094107.36cisd1, cxxc5b, b3gnt2, eif1ad, ctsf, ube2d2, nrg2b, psd2
TH71,866,45716.69dock4, ifrd2
54,865,79246.71tmem86a, spty2d1, usp6nl, cpt1b, mrpl23, b4galnt4a
56,904,31047.65tspan9, rasef
HL1,750,90916.67pdlim5, clhc1, bmpr1a, rps27a
18,466,30746.68b4galnt1a, gpr84, endou, os9, smarcc2, stat2
HW54,865,79246.99tmem86a, spty2d1, usp6nl, cpt1b, mrpl23, b4galnt4a
HH54,865,79247.44tmem86a, spty2d1, usp6nl, cpt1b, mrpl23, b4galnt4a
56,904,31047.82tspan9, rasef
25,692,71967.30anxa1, zfand5, ccnb1, pmch1, slc30a5, tmc2, tjp2
Table 8. Information on 14 candidate genes in 4 SNPs regions identified based on GWAS that are suggestively associated with muscle texture traits in M. albus.
TraitsSNP
Position/bp
Chr−log10
(p-Value)
Gene Start/bpGene End/bpGene
Name
Gene Annotation
Hardness43,910,968106.7043,880,92543,884,001pou3f3bPOU class 3 homeobox 3b
43,903,62743,917,873mrps9mitochondrial ribosomal protein S9
43,919,00243,935,845slain2SLAIN motif family, member 2
Chewiness18,163,94787.1918,111,43818,118,734nectin1nectin cell adhesion molecule 1b
18,170,27818,193,967fstl1bfollistatin-like 1b
18,194,87618,202,131lrrc58bleucine rich repeat containing 58b
18,223,11818,258,417gsk3baglycogen synthase kinase 3 beta, genome duplicate a
18,261,09218,271,197maats1MYCBP associated and testis expressed 1
Springiness30,102,18536.6130,041,81530,062,572rxrbaretinoid x receptor, beta a
29,976,93530,026,381col5a3acollagen, type V, alpha 3a
Resilience81,466,56826.6281,515,54181,524,167fbxo33F-box protein 33
81,550,71981,554,933gemin2gem (nuclear organelle) associated protein 2
81,538,29981,550,368pnnpinin, desmosome associated protein
81,555,32581,577,621mia2MIA SH3 domain ER export factor 2
Disclaimer/Publisher’s Note: The statements, opinions and data contained in all publications are solely those of the individual author(s) and contributor(s) and not of MDPI and/or the editor(s). MDPI and/or the editor(s) disclaim responsibility for any injury to people or property resulting from any ideas, methods, instructions or products referred to in the content.