Article

Low-Temperature Modulation of Microbial Communities in the Intestine of Octoploid Allogynogenetic Gibel Carp (Carassius gibelio) and Aquaculture Pond Water


1
Freshwater Fisheries Research Institute of Fujian Province, Fuzhou 350002, China
2
College of Animal Science and Technology, Yunnan Agricultural University, Kunming 650201, China
*
Author to whom correspondence should be addressed.
Fishes 2026, 11(8), 436; https://doi.org/10.3390/fishes11080436
Submission received: 10 June 2026 / Revised: 17 July 2026 / Accepted: 17 July 2026 / Published: 24 July 2026
(This article belongs to the Section Physiology and Biochemistry)

Abstract

Water temperature is a key driver of microbial succession in aquaculture ponds and may indirectly influence fish intestinal homeostasis, nutrient metabolism, and pathogen risk. This study investigated temperature effects (16 °C vs. 30 °C) on microbial communities in both the intestines of octoploid allogynogenetic gibel carp (Carassius gibelio) (Experiment I, with fish) and the rearing water-column (Experiment II, without fish) over a 20-day experimental period under controlled conditions. The results showed that temperature affected water-column microbiota more strongly than fish intestinal microbiota. In the water-column, diversity indices (Shannon, Simpson, Chao1, and Sobs) decreased over time at both 16 °C and 30 °C, while fish intestinal microbiota showed no significant overall change in alpha diversity. Functional prediction suggested that low-temperature (16 °C) was associated with higher relative abundance of pathways related to amino acid metabolism, carbohydrate metabolism, and genetic information processing in the fish intestine. In contrast, the enrichment of predicted potentially pathogenic phenotypes in the water-column occurred earlier at 30 °C than at 16 °C. These findings indicate that, compared with 30 °C, 16 °C was associated with potentially transient changes in microbial community diversity, slower enrichment of predicted potentially pathogenic phenotypes, and higher predicted nutrient-metabolism potential in intestinal microbiota of allogynogenetic gibel carp during the 20-day experimental period.
Key Contribution: We demonstrate that water temperature differentially shaped pond water-column and gibel carp intestinal microbiota, with 16 °C associated with slower enrichment of predicted potentially pathogenic phenotypes and higher predicted nutrient-metabolism potential during the 20-day culture period.

1. Introduction

Gibel carp (Carassius gibelio), including allogynogenetic strains, is an important cultured cyprinid in China [1]. However, the sustained expansion of aquaculture production coupled with the widespread adoption of high-density intensive farming practices has resulted in substantial environmental degradation in pond ecosystems [2]. The ongoing degradation of pond water quality and substrates is principally attributable to the accumulation of three major pollutants: unconsumed feed, fecal matter, and decomposing algal biomass [3]. This environmental degradation results in the accumulation of dense, anoxic black silt layers in benthic zones, with sediment thickness typically measuring over 40 cm [4].
Suspended particulate matter in the water-column, as an important component of aquaculture pond ecosystems, serves as a dynamic interface that mediates material exchange between the benthic and aquatic phases, thereby exerting both direct and indirect influences on aquaculture environmental conditions. During natural water replenishment cycles, water flow erosion facilitates the mobilization and the dissolution of suspended particulate matter and organic compounds from the pond’s peripheral soils into the water-column. The subsequent proliferation of bacteria and protozoa enhances organic matter accumulation in the water-column through various mechanisms [5,6]. Hydrodynamic disturbances induced by water currents and bioturbation from fish and other aquatic organisms facilitate sediment resuspension and subsequent redeposition. The differential settling velocities of sediment particles, governed by gravitational sorting, lead to the preferential retention of larger grains in the benthic layer, thereby contributing to progressive sediment accumulation at an average rate of 0.5–1.0 cm annually [7]. During this process, water quality parameters, including pH, chemical oxygen demand (COD), temperature, salinity, total phosphorus (TP), total nitrogen (TN), and inorganic nitrogen, significantly regulate the compositional characteristics of aquatic sediments [8].
Fish gastrointestinal microbiota contribute to digestion, nutrient assimilation, epithelial barrier function, immune development, and resistance to opportunistic pathogens [9,10]. In aquaculture, gut microbial communities are shaped by host species, diet, water quality, stocking density, antimicrobial exposure, and temperature [8,11,12,13,14,15]. Because intestinal microbiota can respond to both host physiology and surrounding water microbes, understanding the link between pond-water microbiota and fish intestinal microbiota is relevant for microbial management in culture systems [11,14]. Among these factors, water temperature is particularly important because it directly affects both environmental microbial dynamics and fish physiological status. For instance, water temperature can significantly influence microbial community structure and diversity [11,16]; higher temperatures may promote certain microbial taxa while inhibiting others, potentially disrupting the balance of these communities [16,17,18]. Studies have shown that environmental conditions in aquaculture systems significantly influence intestinal microbiota composition, potentially predisposing fish to disease outbreaks [9,10,19]. These temperature-dependent changes may reshape pond microbial communities and shift the balance between beneficial nutrient-cycling taxa and opportunistic pathogens.
In fish farming and pond management, the period from January to March is often considered ideal for stocking crucian carp fingerlings in southern China, as water temperatures typically rise to around 16 °C during this time. Relatively low water temperature can enhance dissolved oxygen (DO) concentrations and reduce acute metabolic demand, whereas warmer culture conditions can accelerate bacterial proliferation and respiration in the water-column, increase oxygen consumption, and impose additional energetic and physiological stress on cultured fish [13,20]. This study utilized high-throughput sequencing approaches to systematically analyze temperature effects on both intestinal microbiota of allogynogenetic gibel carp and water-column microbial communities in aquaculture ponds. We hypothesized that low-temperature culture (16 °C) would better maintain microbial diversity and community stability than high-temperature (30 °C), delay the enrichment of potentially pathogenic bacteria, and alter predicted nutrient-metabolism functions in fish intestinal microbiota. Because the water-column is directly exposed to environmental temperature and nutrient fluctuations, we expected water-column microbiota to show stronger responses to temperature and time than fish intestinal microbiota. These findings may inform microbial community management in low-temperature aquaculture.

2. Materials and Methods

2.1. Ethics Statement

The use of octoploid allogynogenetic gibel carp (Carassius gibelio) in this study complied with the animal welfare laws, guidelines, and policies, as approved by the Scientific Ethics Committee of Freshwater Research Institute of Fujian Province, China on 4 January 2023 (FFRIFJ-DW-2023-1). To minimize the stress response of sampling, crucian carp were anesthetized with 100 μg/mL tricaine methanesulfonate (MS222, Sigma-Aldrich, St. Louis, MO, USA) prior to all sampling.

2.2. Fish Husbandry and Mud Collection

The octoploid allogynogenetic gibel carp (8n) used in this experiment originated from the farm of the Freshwater Fisheries Research Institute of Fujian Province. Fish of a uniform size (body weight: 30.2 ± 5.3 g; body length: 29.50 ± 2.16 cm) were selected, all with no somatic deformities, no clinical disease signs, and active feeding behavior. The allogynogenetic gibel carps were acclimated in circular tanks (3.0 m diameter × 0.5 m depth) equipped with continuous aeration and mechanical filtration, maintained under controlled photoperiod conditions (14L:10D) for a 14-day acclimatization period. Throughout the acclimation period, daily monitoring of water quality parameters was maintained, including water temperature (16.34 ± 0.26 °C), pH (7.58 ± 0.13), dissolved oxygen (above 7.1 mg/L), and ammonia concentration (ranging from trace to 0.5 mg/L). Fish were fed a daily combination of commercial feeds with florfenicol (4%, w/w) for 7 days, followed by a 24 h fasting period before experimental initiation. This pre-treatment was used to reduce the resident intestinal microbiota and partially standardize the initial fish gut microbial background [12,21].
In February 2023, fresh mud from the bottom of the ponds was collected from multiple aquaculture ponds in the farm of the Freshwater Fisheries Research Institute of Fujian Province, using a Peterson grab sampler (Xiamen Dengxun Instrument Equipment Co., Ltd., Xiamen, China). The composite mud samples were mixed in a sterile polyethylene container, followed by removal of macroscopic debris. A uniform layer of prepared mud (5.0 ± 0.2 cm thickness) was distributed across the base of cylindrical experimental tanks (1.0 m diameter × 1.2 m height), followed by gradual water addition to achieve a final water volume of 0.4 m3 (water depth = 0.51 m). Mud samples were collected before experimental incubation to characterize the initial sediment-associated community.

2.3. Experimental Design

2.3.1. Experiment I: Tanks with Fish

Fish were randomly assigned to experimental tanks, with three replicates per treatment and 30 fish in each tank. The water temperatures were maintained at either 16 ± 0.5 °C or 30 ± 0.5 °C using four feedback-controlled 150 W heating rods (Sunsun Group Co., Ltd., Zhoushan, China) per tank, while photoperiod conditions were kept consistent across all groups. The tank was considered the experimental unit for temperature treatment.
Throughout the 20-day experimental period, fish were fed a standardized commercial diet, with a 24 h fasting period implemented prior to each sampling event to minimize gut content interference. Sampling was conducted at days 3, 6, 9, 12, and 20 post-experiment initiation. Day 0 baseline intestinal samples were collected immediately before the temperature treatments were initiated and were used as the starting reference for temporal comparisons. These samples were labeled D0 and were processed using the same sampling, DNA extraction, sequencing, and analysis procedures as subsequent intestinal samples. At each sampling point, fish were anesthetized using MS-222 (100 mg/L), followed by exsanguination via caudal vein puncture and surface disinfection with 75% ethanol. Intestinal tracts were aseptically dissected from three individuals per replicate tank, and pooled to obtain one tank-level composite intestinal sample; thus, the biological replicate used for intestinal microbiota analysis was the tank-level pooled sample (n = 3 per temperature at each sampling day). All obtained intestinal samples were rapidly frozen in liquid nitrogen and kept at −80 °C before DNA isolation.

2.3.2. Experiment II: Tanks Without Fish

To characterize water-column microbial dynamics in the absence of direct fish inputs, parallel fish-free microcosms were established. Two temperature treatments were established, 16 ± 0.5 °C and 30 ± 0.5 °C, with three replicate tanks per treatment. The water temperatures were maintained using four feedback-controlled 150 W heating rods per tank, while photoperiod conditions were kept consistent across all groups. Water-column samples (2 L) were collected from each replicate tank at days 3, 6, 9, 12, and 20 post-experiment initiation. D0 denotes baseline water-column samples collected before the start of the temperature experiment. Samples were vacuum-filtered through sterile 0.22 μm polycarbonate membranes (Millipore, Bedford, MA, USA) using a vacuum pump. Filter membranes from each replicate tank were flash-frozen separately in liquid nitrogen and stored at −80 °C until DNA extraction, maintaining three tank-level biological replicates per treatment at each sampling day.

2.4. Water-Quality Analyses

The total nitrogen (TN), total phosphorus (TP), ammonium nitrogen (NH4-N) and nitrite nitrogen (NO2-N) were measured in the fish-free water-column used for environmental-factor analysis following the National Standard Methods. TN was determined by alkaline potassium persulfate digestion-UV spectrophotometry (UV-2800, Unico, Shanghai, China; HJ 636-2012 [22]). TP was determined by ammonium molybdate spectrophotometric (UV-2800, Unico, Shanghai, China; GB/T 11893-1989 [23]). NH4-N was determined by Nessler’s reagent spectrophotometry (UV-2800, Unico, Shanghai, China; HJ 535-2009 [24]). NO2-N was determined by ion chromatography (ICS-1100, Dionex, Sunnyvale, CA, USA; HJ 84-2016 [25]). Each parameter was measured in triplicate at each sampling point.

2.5. DNA Extraction and 16S rRNA Sequencing

Microbial genomic DNA was extracted from fish whole intestinal tracts, water-column, and mud using the CTAB/SDS method as previously described with minor modifications. After treating the cell suspension with lysozyme (0.3 mg/mL), 100 mg of zirconium-silica beads (0.1 mm diameter) were added to the mixture, followed by vortexing thoroughly for 5 min with intermittent pauses (20 s every 1 min). The DNA was purified with chloroform-isoamyl alcohol, precipitated with isopropanol and dissolved in 30 μL of nuclease-free water. The quality of the DNA was verified by spectrophotometric measurements at 260, 280, and 234 nm. The V3-V4 region of the bacterial 16S ribosomal RNA (16S rRNA) gene was amplified by PCR (95 °C for 3 min, followed by 30 cycles at 95 °C for 30 s, 55 °C for 30 s, and 72 °C for 30 s and a final extension at 72 °C for 5 min) using primers 338F 5′-ACT CCT ACG GGA GGC AGC A-3′ and 806R 5′-GGA CTA CHVGGG TWT CTAAT-3′, where the barcode was an eight-base sequence unique to each sample. A negative control without the DNA template was included in each PCR assay to monitor potential contamination. Amplicons were extracted from 2% agarose gels and purified using the AxyPrep DNA Gel Extraction Kit (Axygen Biosciences, Union City, CA, USA) according to the manufacturer’s instructions. Purified PCR products were quantified by Qubit® 3.0 (Life Technologies, Carlsbad, CA, USA) and every twenty-four amplicons whose barcodes were different were mixed equally. The pooled DNA product was used to construct an Illumina pair-end library following Illumina’s genomic DNA library preparation procedure. After quantification and qualification, the library was 2 × 300 bp paired-end sequenced on an NGS platform (Shanghai BIOZERON Biotech. Co., Ltd., Shanghai, China).

2.6. Processing of Sequencing Data

To obtain high-quality clean tags, the raw data were filtered and assembled according to the following criteria: (i) Removing reads containing more than 10% of unknown nucleotides (N); (ii) Removing reads containing less than 50% of bases with quality (Q-value) > 20; (iii) Paired-end clean reads were assembled as raw tags with a minimum overlap of 10 bp and mismatch error rates of 2%; (iv) Breaking raw tags from the first low-quality base site where the number of bases in the continuous low-quality value (default quality threshold: ≤3) reaches the set length (default length value: 3 bp); (v) filtering tags whose continuous high-quality base length is less than 75% of the tag length.
The clean tags were clustered into operational taxonomic units (OTUs) with similarities greater than 97% using UPARSE [26]. The representative OTU sequences were classified into organisms by a naive Bayesian model using Ribosomal Database Project (RDP) classifier (version 2.2) [27] based on SILVA 16S rRNA database (version 138.1) [28], with the confidence threshold value of 0.8. Data quality control for the 69 samples has been detailed in the Supplementary Materials. The raw 16S rRNA sequencing reads generated in this study have been deposited in the NCBI Sequence Read Archive (SRA) under accession numbers SRR39453508–SRR39453576.

2.7. Statistical Analyses

All statistical analyses were conducted at the tank level. For intestinal microbiota, each replicate consisted of a composite sample from three fish within the same tank. For water-column microbiota, each replicate consisted of one independently processed tank sample. Temperature was treated as a fixed factor when comparing 16 °C and 30 °C at the same sampling day. Pairwise comparisons between temperatures at the same sampling day were performed using Welch’s t-test. Temporal comparisons among sampling days within the same temperature were performed using analysis of variance followed by Tukey’s HSD test where assumptions were met. For water-quality parameters, statistical differences were analyzed using two-way repeated-measures ANOVA with time and temperature as factors, followed by Dunnett’s multiple comparisons test using Day 0 as the baseline. Significant time, temperature, or time × temperature effects were interpreted as temporal changes, differences between temperature groups, or temperature-dependent temporal patterns, respectively. Differences were considered significant at p < 0.05.

2.7.1. α- and β-Diversity Analyses

α-diversity indices (Chao1, Sob, Shannon and Simpson) were calculated in QIIME (version 1.9.1) [29]. Comparisons included high- and low-temperature groups at the same sampling day and temporal comparisons among days within each temperature treatment. Day 0 baseline groups, including intestinal and water-column samples collected before temperature treatment initiation, were included in the temporal comparisons. Statistical analyses were conducted using Welch’s t-test or Tukey’s HSD test in the Vegan package (version 2.5.3) in R (version 4.5.2) [30], respectively. Principal coordinates analysis (PCoA) with the weighted UniFrac distance at the genus level was performed to assess β-diversity, and the non-parametric multivariate analysis of variance (Adonis/PERMANOVA) was used to test differences in microbial community composition [31]. Homogeneity of multivariate dispersion was assessed using the betadisper function in the vegan package, followed by permutation testing with 9999 permutations, to evaluate whether PERMANOVA results were influenced by differences in within-group dispersion [32]. Differences were considered statistically significant at p < 0.05.

2.7.2. Community Composition Analysis

To describe the changing of community composition in fish intestinal tracts, water-column samples, and mud samples over 20 days at different water temperatures, the relative abundance of the species with the top 10 abundances at family and genus levels were calculated and visualized by ggplot2 package. Welch’s t-test was used to determine the differences in community composition between high- and low-temperature groups at the same duration. Differences were considered statistically significant at p < 0.05.

2.7.3. Indicator Species Analysis

Microbial biomarkers in each source, including fish intestinal tracts, water-column, and mud, were screened using linear discriminant analysis effect size (LEfSe) [33] and indicator values analysis with labdsv package in R with default parameters [34]. These analyses were used to identify differentially abundant taxonomic features. The LEfSe bar graph of taxonomical features with a linear discriminant analysis (LDA) score threshold greater than 4.0 was generated. Differences in indicator values were considered statistically significant at p < 0.05.

2.7.4. Function Prediction

The KEGG pathway profiles of OTUs were inferred using PICRUSt2 (version 2.1.4) with default parameters [35]. Representative OTU sequences and the OTU abundance table were used as input, and predicted functional profiles were annotated against the KEGG database. Microbiome phenotypes of bacteria from environment water-column samples were classified using BugBase with default parameters based on the normalized OTU abundance table [36]. Comparisons included high- and low-temperature groups at the same duration and temporal comparisons among days within the same temperature. Welch’s t-test or Tukey’s HSD test were used as described above, respectively. Differences were considered statistically significant at p < 0.05.

2.7.5. Environmental Factor Analysis

Canonical correspondence analysis (CCA), mantel test and envfit test were performed using the Vegan package (version 2.5.3) in R with default parameters [30]. CCA was used to evaluate the relationship between environmental factors and microbial community composition, while Mantel and envfit tests were used to assess the association between environmental variables and community dissimilarity. Pearson correlation coefficient between environmental factors and microbial taxa were calculated using psych package in R (version 1.8.4) [37]. Differences were considered statistically significant at * p < 0.05, ** p < 0.01, or *** p < 0.001.

3. Results

3.1. Microbial Community Composition in Fish Intestine and Water-Column

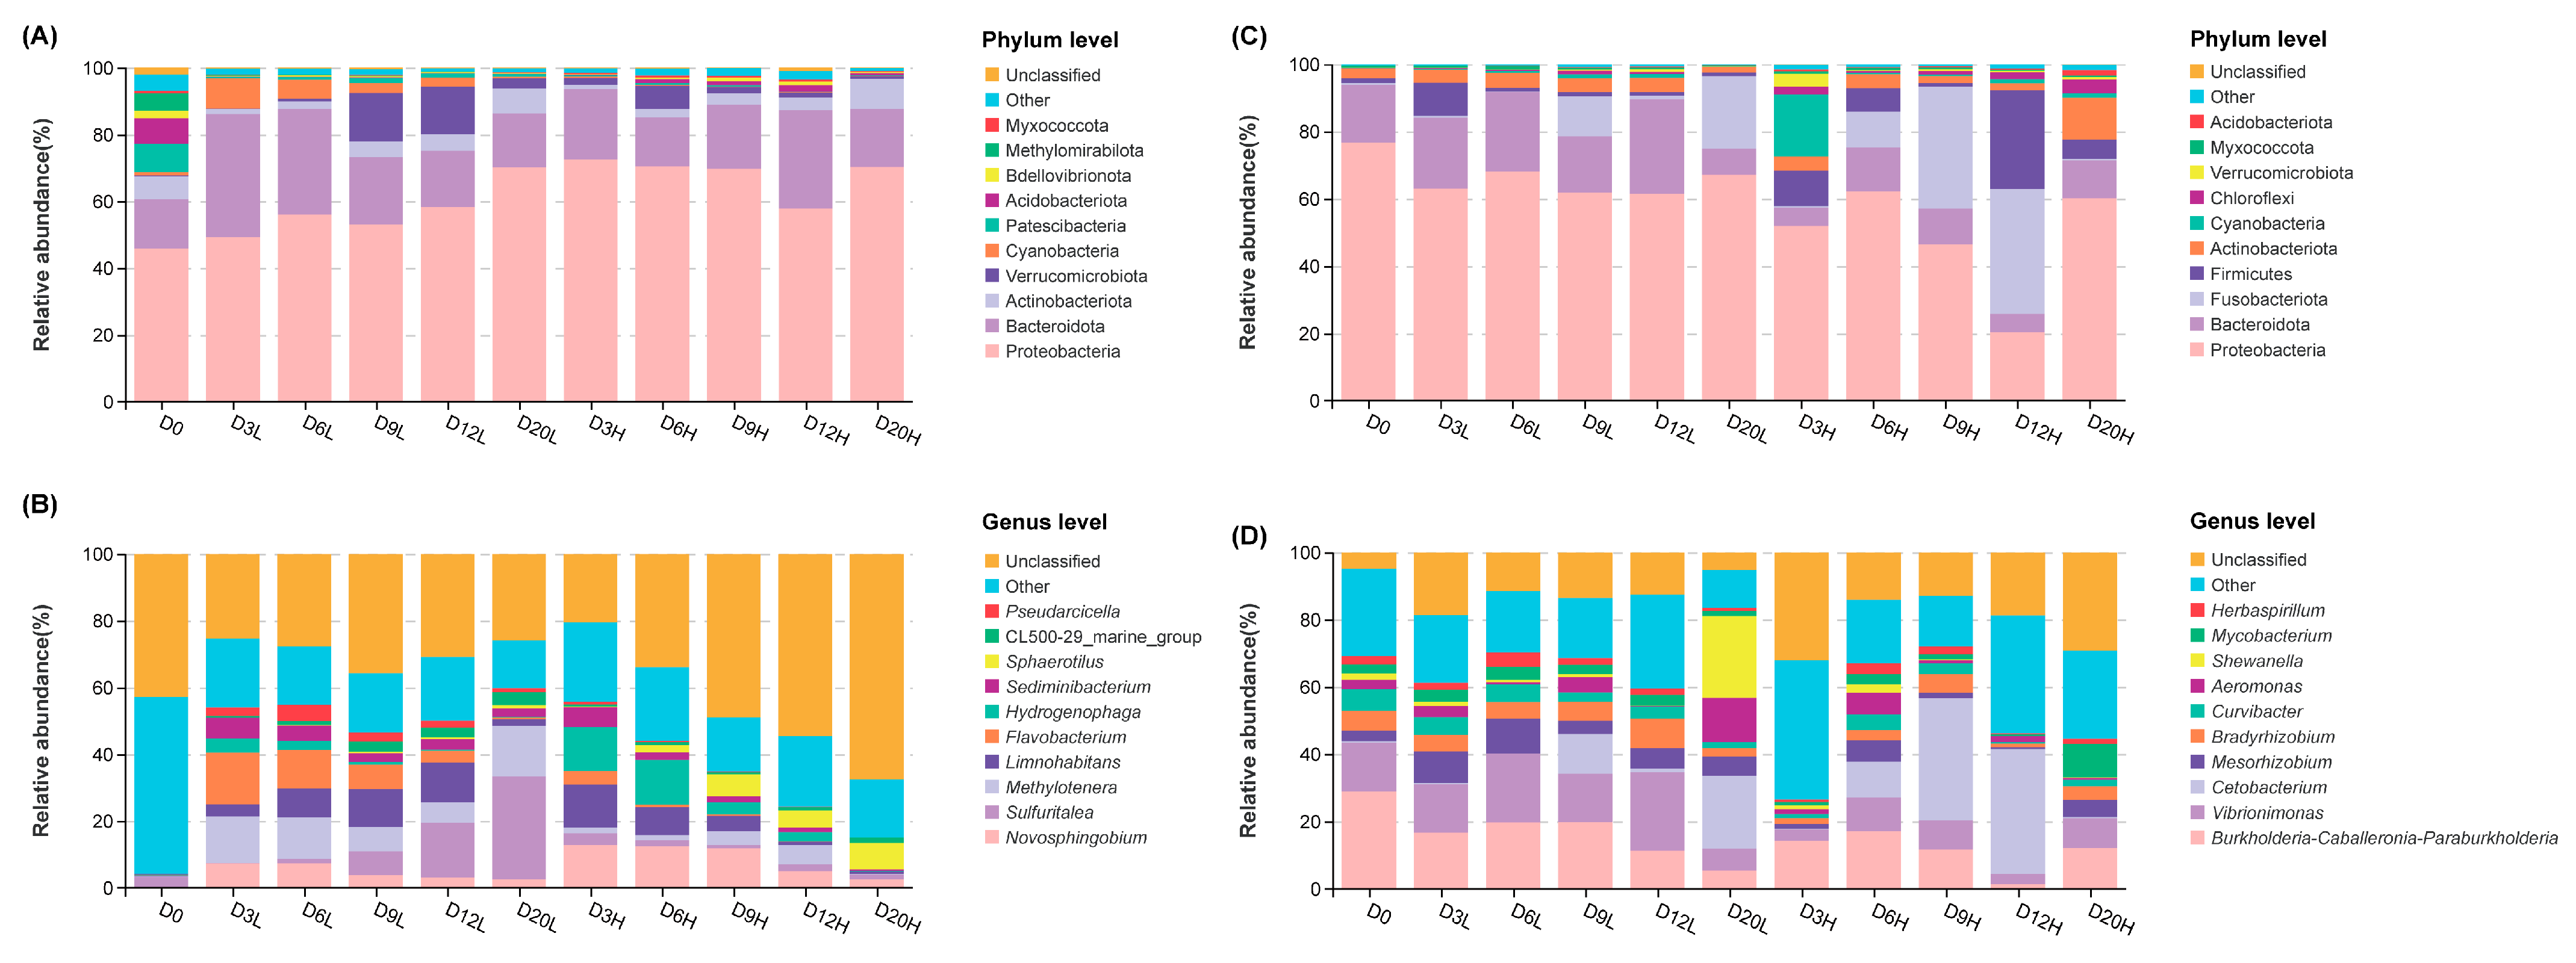
Baseline microbial communities were characterized using Day 0 samples before temperature treatment initiation, including D0 for the water-column and fish intestine, respectively. Based on the species annotation and abundance statistics in all groups, the top 10 relative abundance species at phylum, and genus levels are shown in Figure 1. Water-column taxa at the phylum level was dominated by Proteobacteria, Bacteroidota, Actinobacteriota, Verrucomicrobiota, and Cyanobacteria (Figure 1A). There were 13, 20, 22, 29 and 20 genera significant difference between low- and high-temperature at Day 3, 6, 9, 12 and 20, respectively (p < 0.05). Among the top 10 relative abundance species of water-column at genus levels (Figure 1B), the relative abundance of Flavobacterium significantly increased under low-temperature compared to high-temperature at all selected times (p < 0.05), while Methylotenera showed a significant increase under low-temperature at Days 3, 6, and 20 (p < 0.05, Figure S1A,B,E). Similarly, Sulfuritalea and Pseudarcicella exhibited significant increases under low-temperature at Days 9 and 12 (p < 0.05, Figure S1C,D), with Pseudarcicella also showing an increase at Day 20 (p < 0.05). In contrast, the relative abundance of Hydrogenophaga and Sphaerotilus significantly increased under high-temperature at Day 9 (p < 0.05, Figure S1C).
At the phylum level, the intestinal microbiota were dominated by Proteobacteria, Bacteroidota, Fusobacteriota, Firmicutes, and Actinobacteriota (Figure 1C). Intestinal microbial taxa at the genus level were dominated by Burkholderia-Caballeronia-Paraburkholderia, Vibrionimonas, and Cetobacterium (Figure 1D). The relative abundance of Burkholderia-Caballeronia-Paraburkholderia decreased over time under low-temperature, whereas it increased under high-temperature by Day 20. Additionally, the relative abundance of Candidatus_Competibacter and 11 other genera significantly increased under high-temperature compared to low-temperature at Day 3 (p < 0.05, Figure S2A). At Day 12, however, a total of 14 genera significantly increased under low-temperature compared to those under high-temperature (p < 0.05, Figure S2B), including Vibrionimonas, Bradyrhizobium, Curvibacter, and Mycobacterium, which were among the top 10 relative abundance species at genus levels. Only the relative abundance of Ellin6067 showed significant difference between low- and high-temperature at Day 20 (p < 0.05, Figure S2C).

3.2. α- and β-Diversity Dynamics over Time in the Water-Column and Fish Intestine

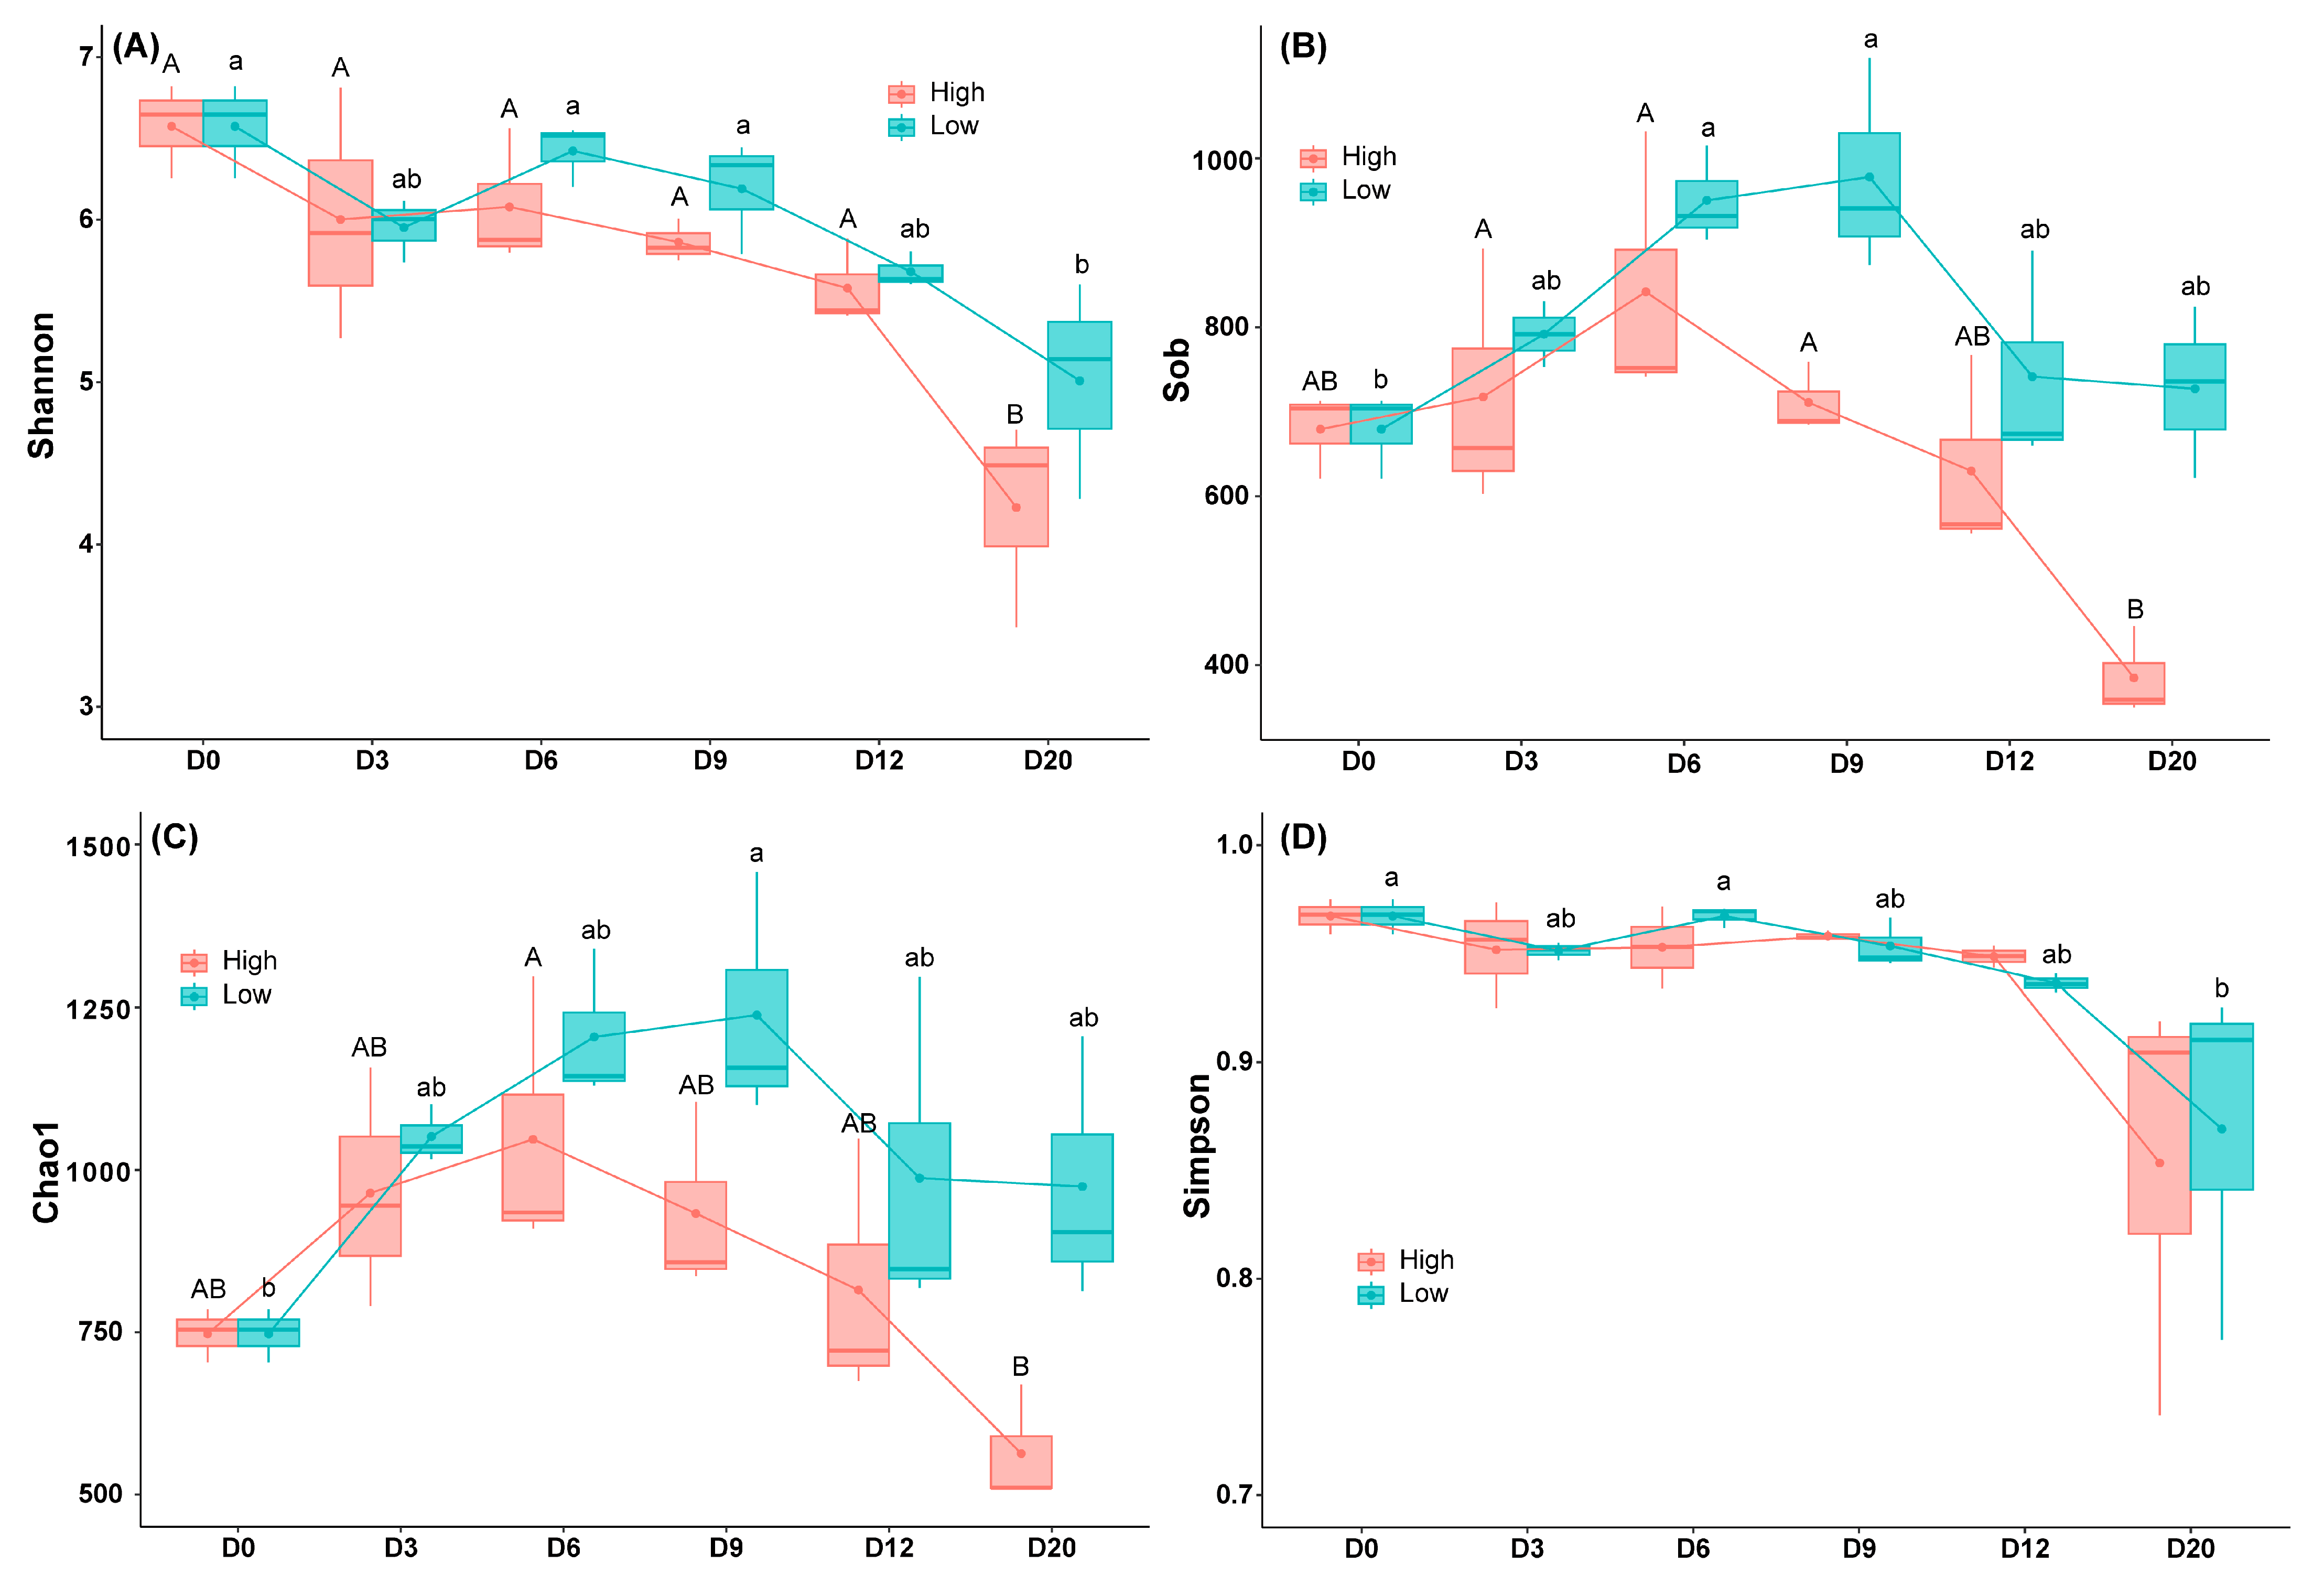
Compared with the Day 0 baseline water-column samples (D0), all selected diversity indices (Shannon, Sob, Chao1 and Simpson) were decreased over time in the water-column. Specifically, the Shannon index significantly decreased on Day 20 compared with D0 (p < 0.05, Figure 2A). Sob and Chao1 indices showed a significant increase by Day 9, followed by a decrease, returning to their initial levels by Day 20 under low-temperature conditions (p < 0.05, Figure 2B,C). Simpson index only showed a significant decrease by Day 20 compared with D0 under low-temperature conditions (p < 0.05, Figure 2D). In contrast, no significant changes in alpha diversity were observed in the fish intestine compared with D0 over the 20-day period.
The diversity indices in both the fish intestine and the water-column were compared between different temperatures at the same time points. Only the Shannon index under high-temperature was significantly higher than under low-temperature in the fish intestine at Day 3 (p < 0.05, Figure S3). The Simpson index of water-column showed a transient increase under high-temperature at Day 12 (p < 0.05, Figure S3), whereas sob index of water-column showed a significant increase under low-temperature at Day 20 (p < 0.05, Figure S3).
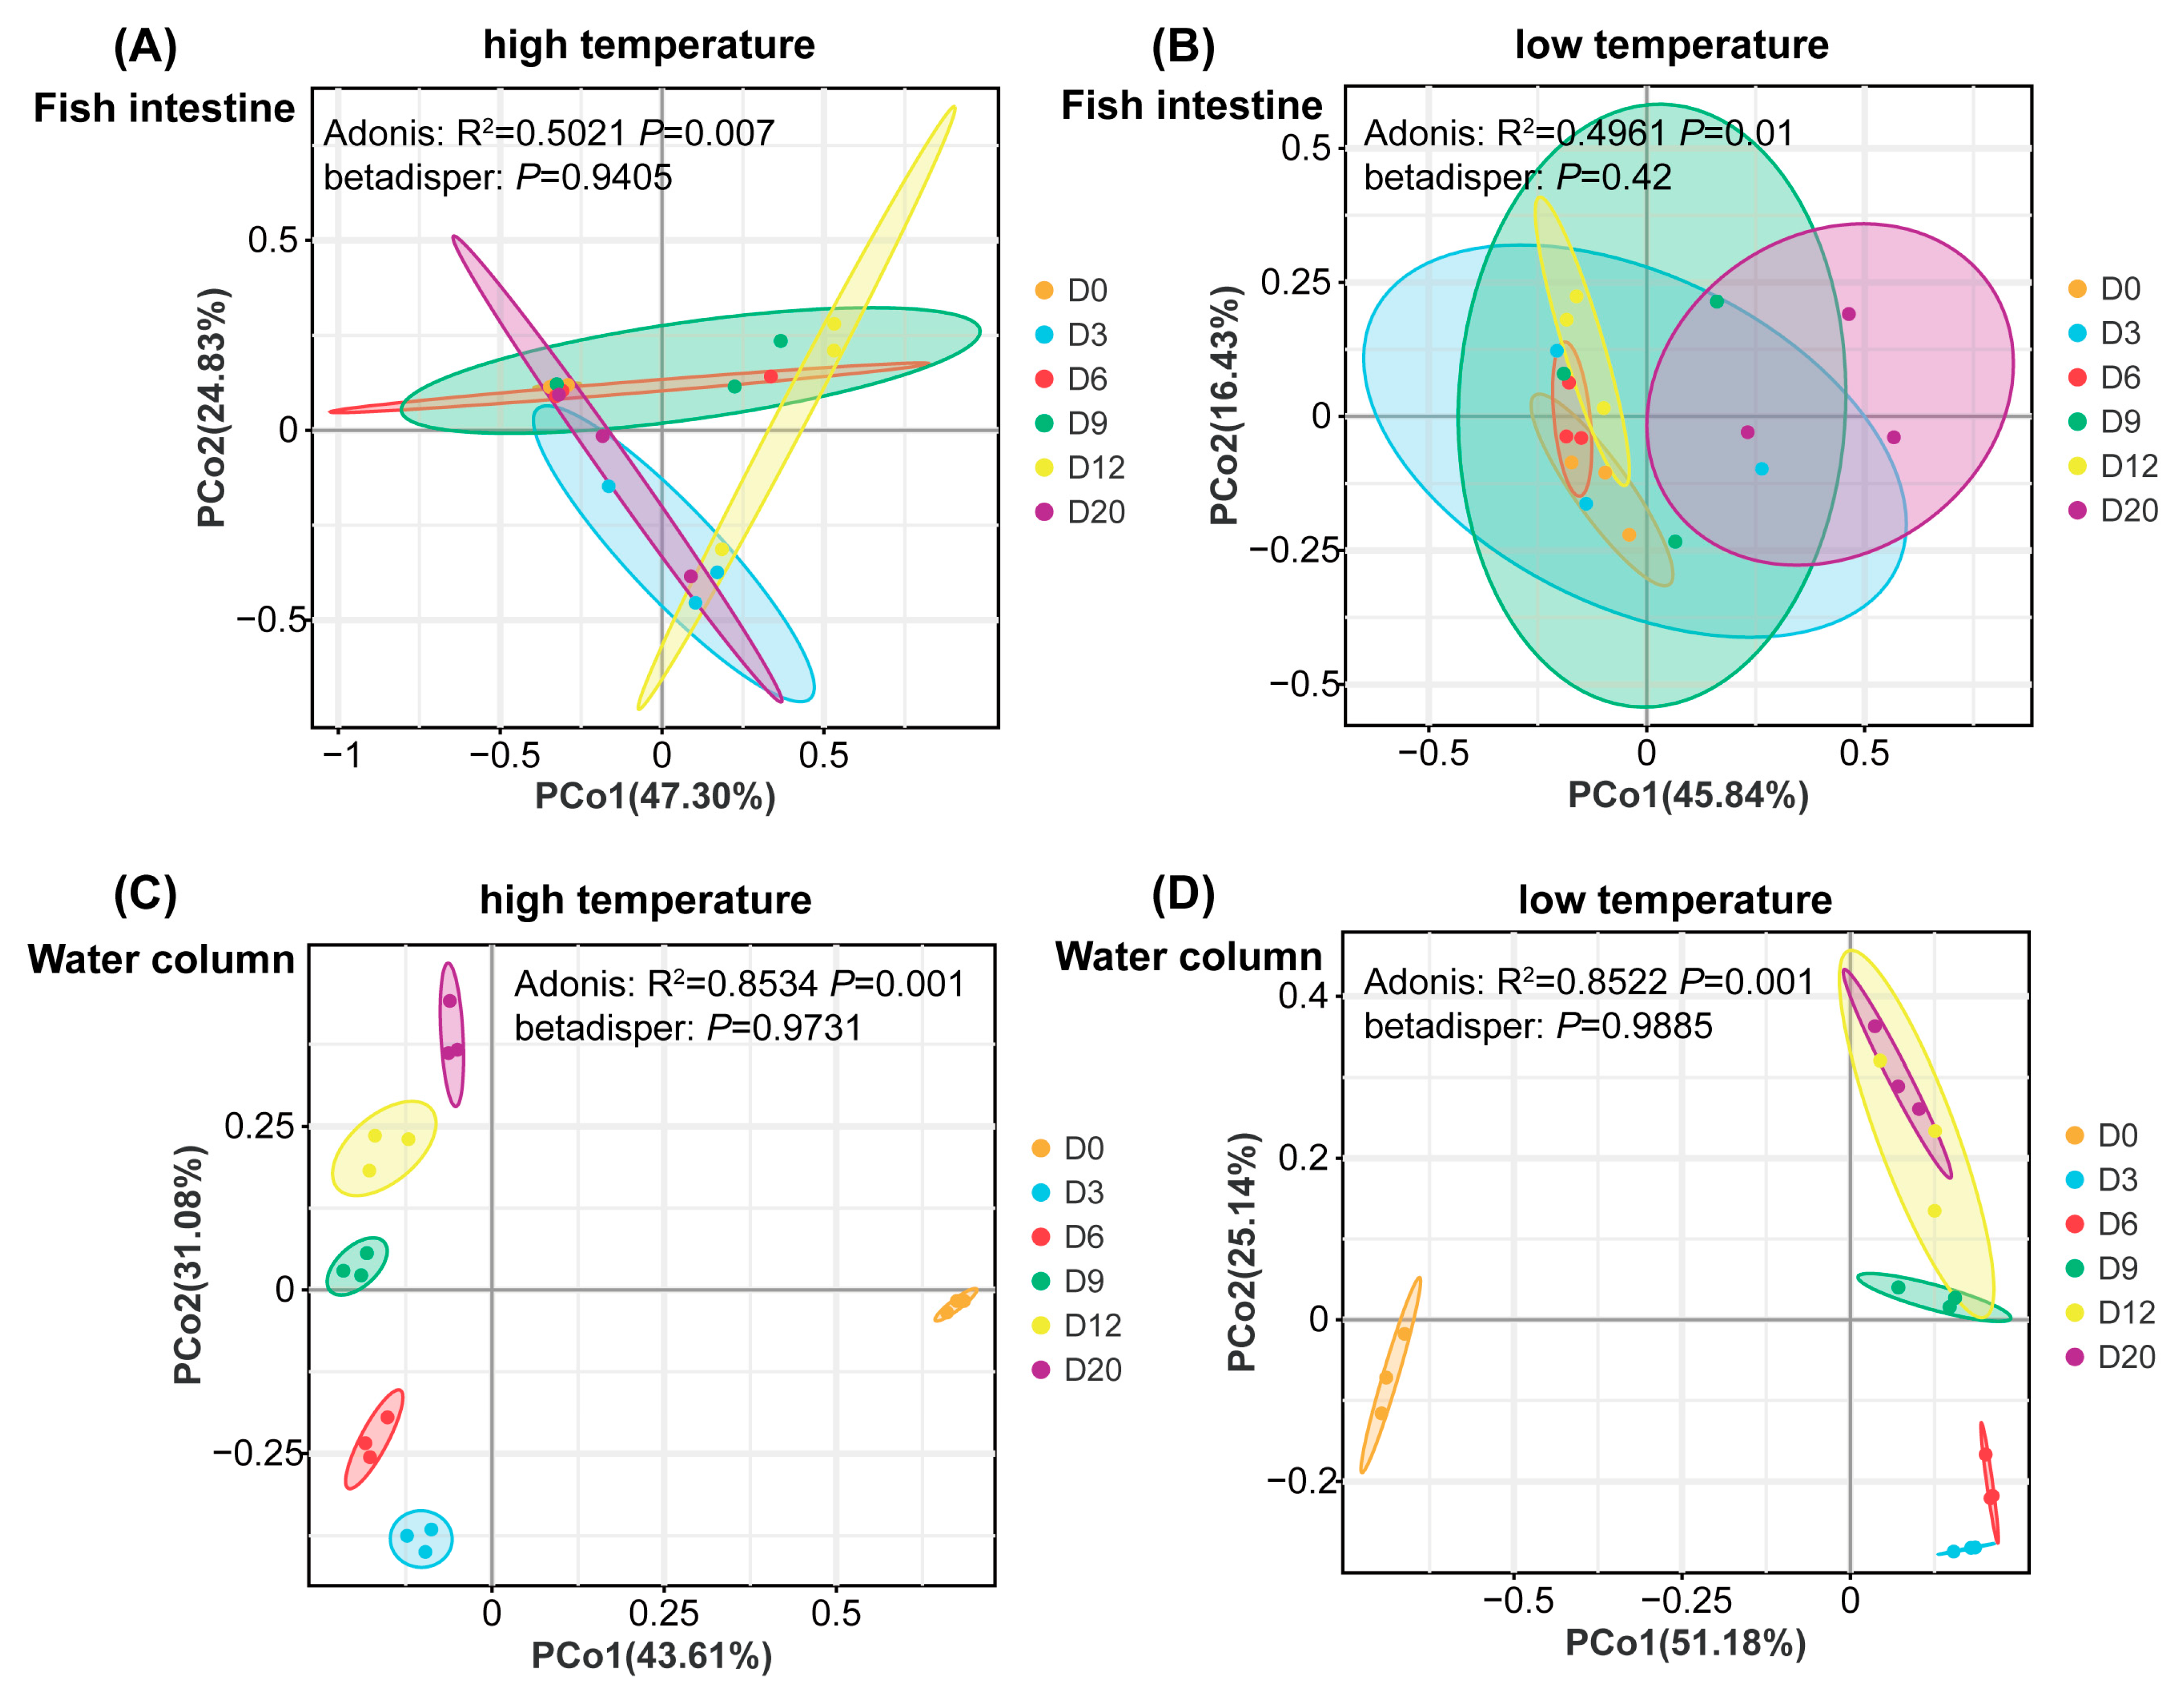
Principal Coordinate Analysis (PCoA) based on the Bray–Curtis dissimilarity index at the genus level revealed that the bacterial communities differed over times at the same temperature in beta-diversity of water-column and fish intestine (Adonis, p < 0.05, Figure 3). Betadisper analysis showed no significant differences in within-group dispersion (p > 0.05), indicating that the observed temporal differences were mainly associated with changes in community composition rather than differences in group dispersion.

3.3. Source-Associated Microbial Community Patterns Among Mud, Water-Column, and Fish Intestine

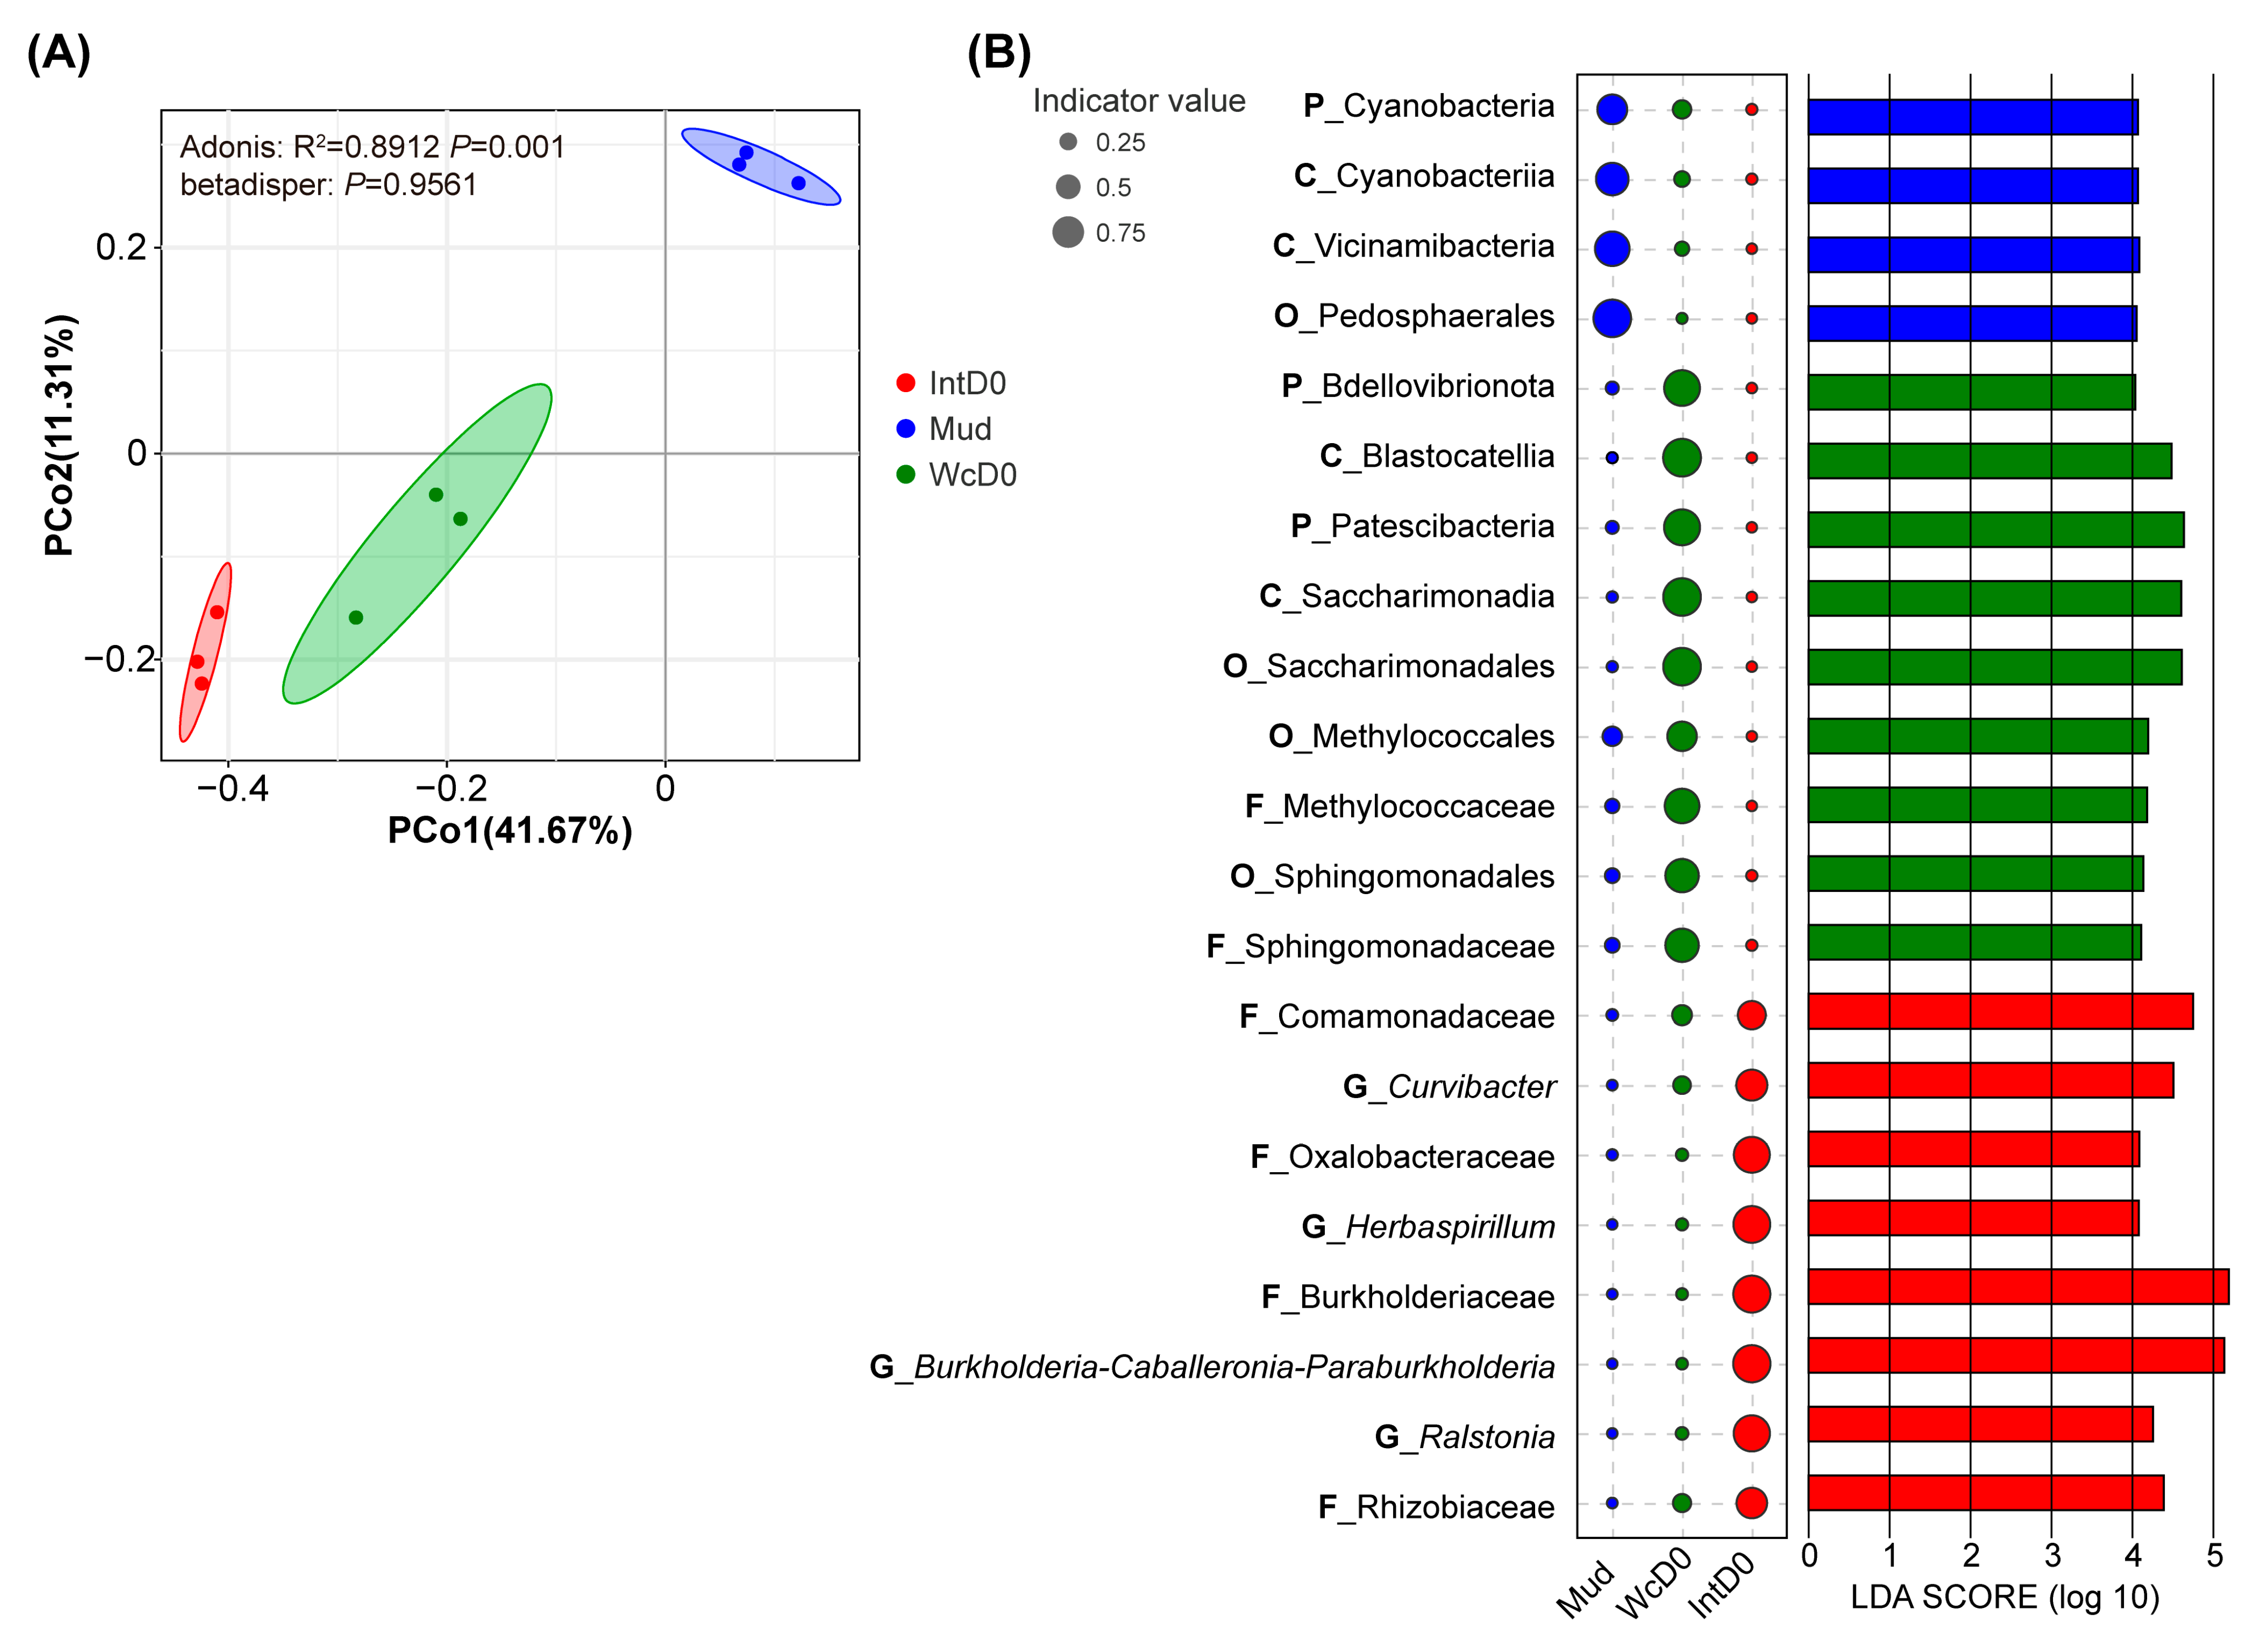
PCoA revealed that the bacterial communities at the genus level differed among sources, including mud, water-column and fish intestine (Adonis, p < 0.05, Figure 4A). There were 99, 65, and 61 specific bacterial communities at the genus level in mud, water-column, and fish intestine, respectively, with only 13, 1, and 0 bacterial communities at the phylum level.
LEfSe and indicator value analyses identified microbial biomarkers, revealing 4, 9, and 8 distinguishing phylotypes in mud, water-column, and fish intestine, respectively (LDA score > 4.0 and p < 0.05; Figure 4B). The Phylum Cyanobacteria; class Cyanobacteriia; class Vicinamibacteria; order Pedosphaerales were identified as microbial biomarkers in mud. Similarly, the phylum Bdellovibrionota and Patescibacteria; class Blastocatellia and Saccharimonadia; order Saccharimonadales, Methylococcales, and Sphingomonadales; family Methylococcaceae and Sphingomonadaceae were identified as microbial biomarkers in water-column. Interestingly, all these taxa were also the top 10 relative abundant microbial at the phylum level in the water-column. The family Comamonadaceae, Oxalobacteraceae, Burkholderiaceae, and Rhizobiaceae; the genus Curvibacter, Herbaspirillum, Burkholderia_Caballeronia_Paraburkholderia, and Ralstonia were identified as microbial biomarkers in the fish intestine. Notably, the genus Curvibacter, Herbaspirillum, and Burkholderia_Caballeronia_Paraburkholderia were also the top 10 relative abundant microbial at the genus level in the fish intestine.

3.4. Correlation Between Environmental Factors and Water-Column Microbial Communities

The high-temperature groups showed a gradual increase in TN, TP, NH4-N and NO2-N concentration over time, however, the increases in low-temperature groups were less pronounced compared to the high-temperature groups (Figure S4).
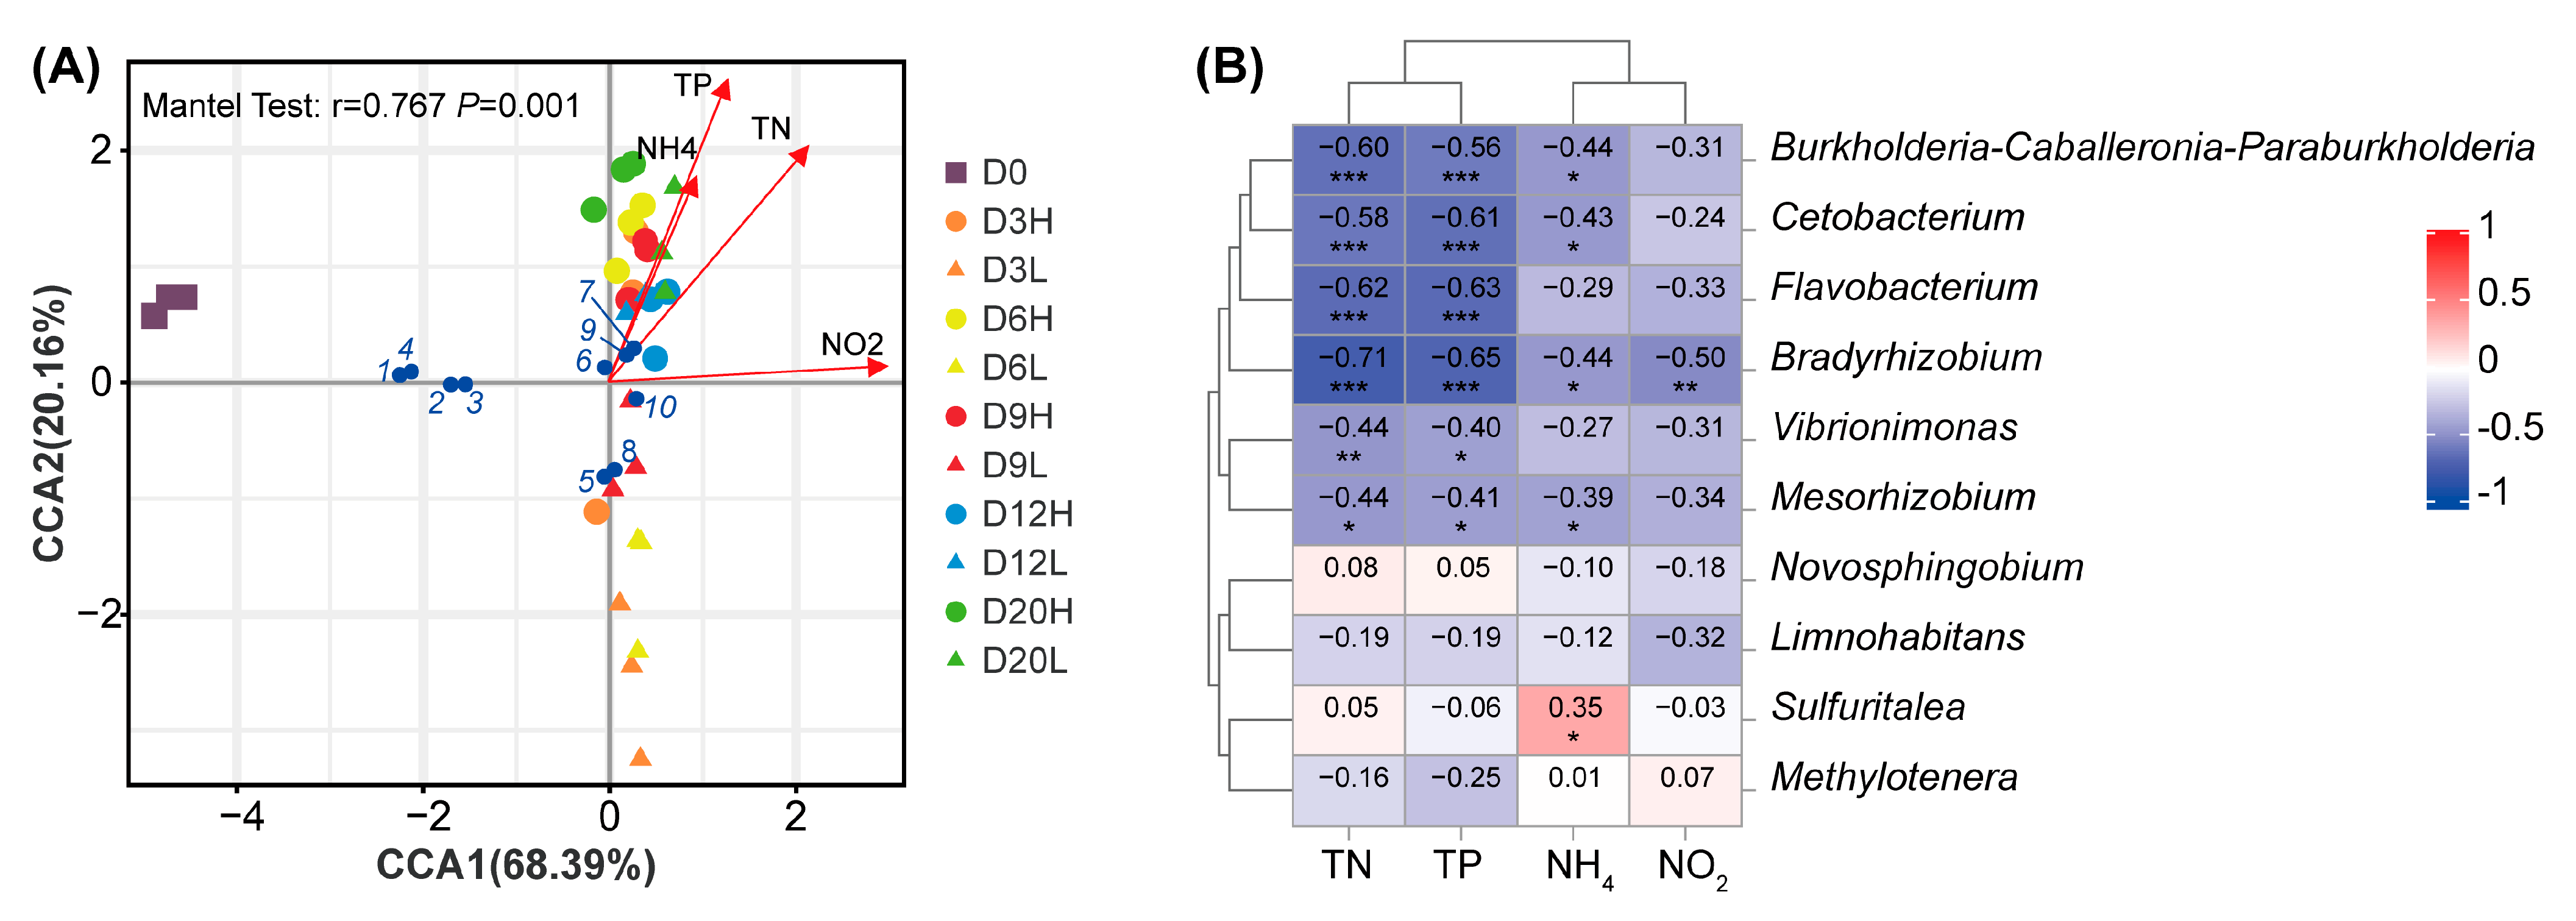
CCA1 and CCA2 explained 68.39% and 20.16% of the community structures, respectively (Figure 5A). The Mantel test showed a clear correlation between the microbial community and water environmental parameters, including TP, TN, NH4-N, and NO2-N (r = 0.767, p = 0.001). CCA further identified a significant correlation between the dominant microbial taxa and the environmental variables in the water-column samples. A positive correlation was observed between environmental factors and microbial communities in the water-column over a 20-day period under high-temperature conditions. Conversely, a negative correlation was detected in the water-column at Days 3, 6, and 9 under low-temperature conditions, whereas a positive correlation re-emerged at Days 12 and 20 under the same low-temperature conditions on the ordination axes (Figure 5A).
Moreover, distinct bacterial genera exhibited varying responses to different environmental factors. However, there was no significant correlation between water environmental parameters and dominant bacterial taxa, like genera Novosphingobium, Methylotenera, and Limnohabitans (p > 0.05). Among the top 10 relative abundant microbial, only genus Sulfuritalea had a significant positive correlation (p < 0.05) with NH4 (Figure 5B). Six genera, including Burkholderia-Caballeronia-Paraburkholderia, Cetobacterium, Bradyrhizobium, Mesorhizobium, and potential pathogens, such as Vibrionimonas, and Flavobacterium, were negatively correlated with TP, TN, NH4, and NO2 levels (p < 0.05, Figure 5B).

3.5. Functional Profiles of Fish Intestinal Microbiota Under Different Temperature Conditions

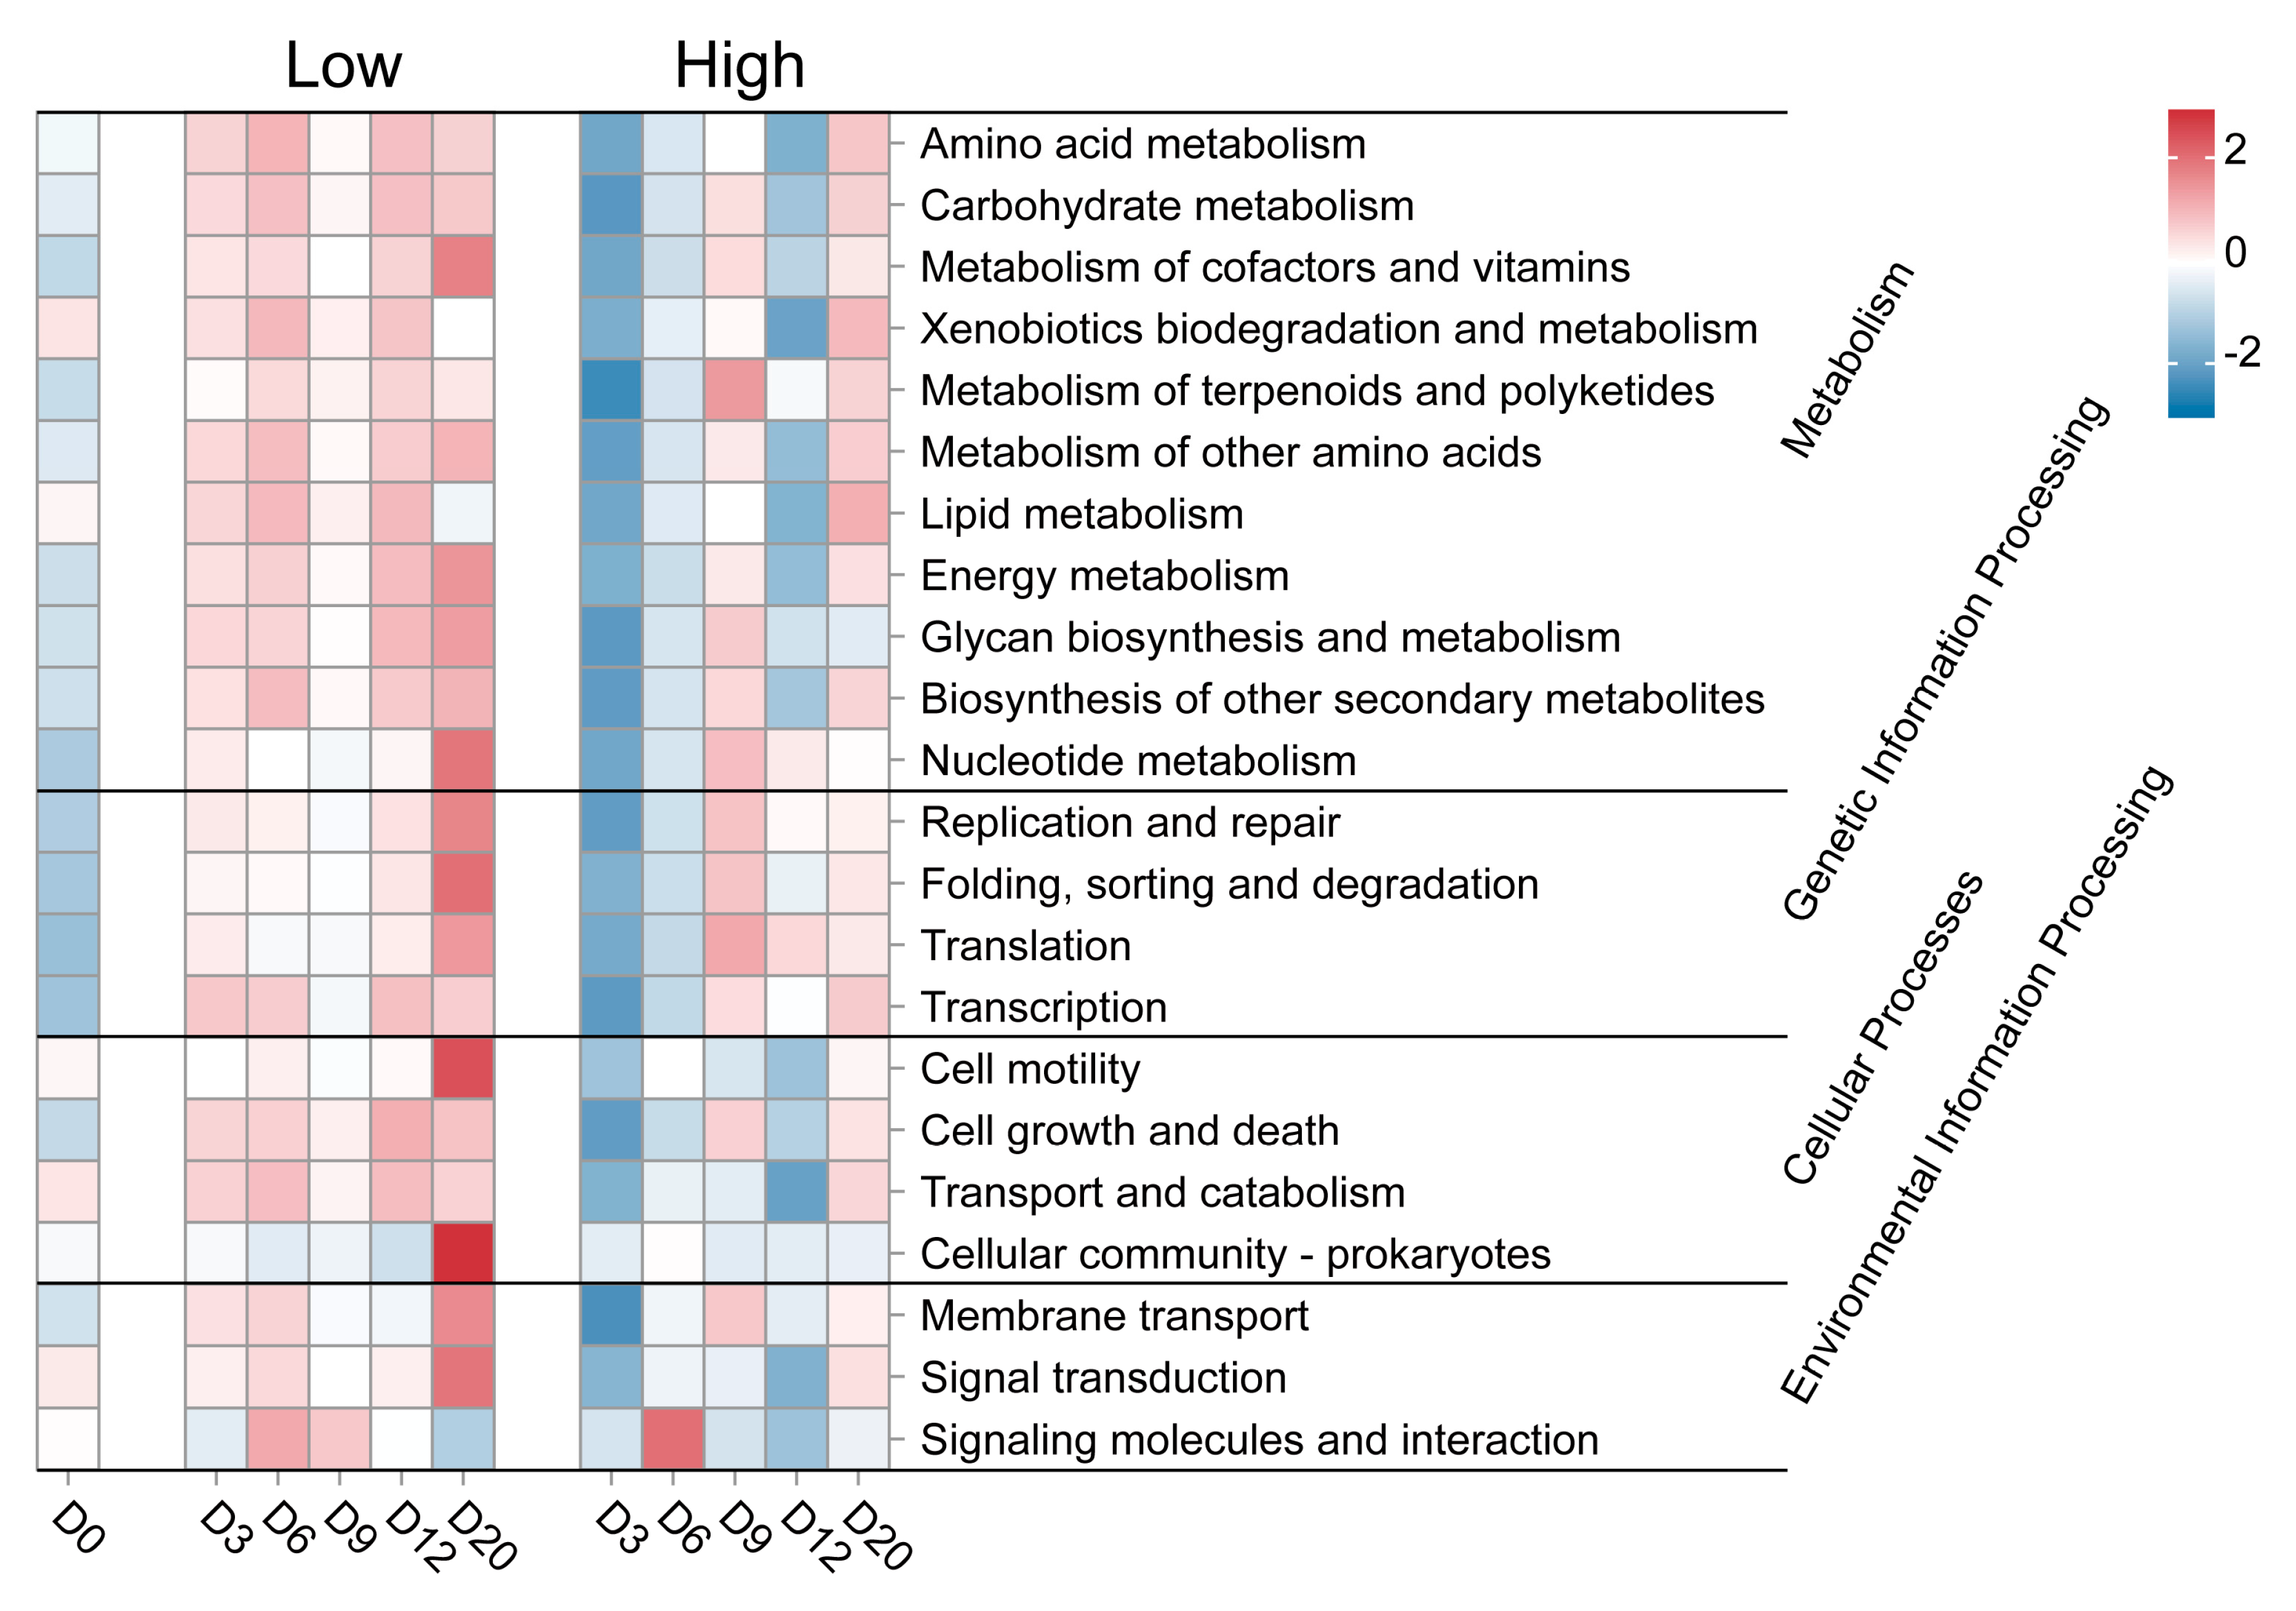
With the 16S rRNA gene amplicon sequencing results, PICRUSt2 was used for KEGG functional profile analysis of the intestinal microbial community. Among 22 KEGG pathways, most predicted functional profiles were significantly more abundant in the fish intestine under low-temperature over the 20-day period, including replication and repair, folding, sorting and degradation, nucleotide metabolism, cellular community—prokaryotes, and environmental adaptation (p < 0.05, Figure 6). Additionally, PICRUSt2 predicted a total of 10, 5, and 1 functional pathways to be higher in the fish intestine under low-temperature compared to high-temperature on Days 3, 12, and 20, respectively (p < 0.05, Figure S5).
BugBase analysis suggested the bacterial phenotypes in each group under low- and high-temperature conditions. On Day 12, the fish intestine in the low-temperature groups was predominantly enriched in Aerobic and Facultatively Anaerobic phenotypes, while the high-temperature groups showed enrichment in Anaerobic phenotypes (p < 0.05, Figure S6). Notably, the low-temperature groups also exhibited a higher enrichment of potentially pathogenic and stress-tolerant bacteria. No significant differences were observed between the low- and high-temperature groups at other time points.

3.6. Temporal Changes in Potentially Pathogenic Bacteria in Water-Column Under Different Temperatures

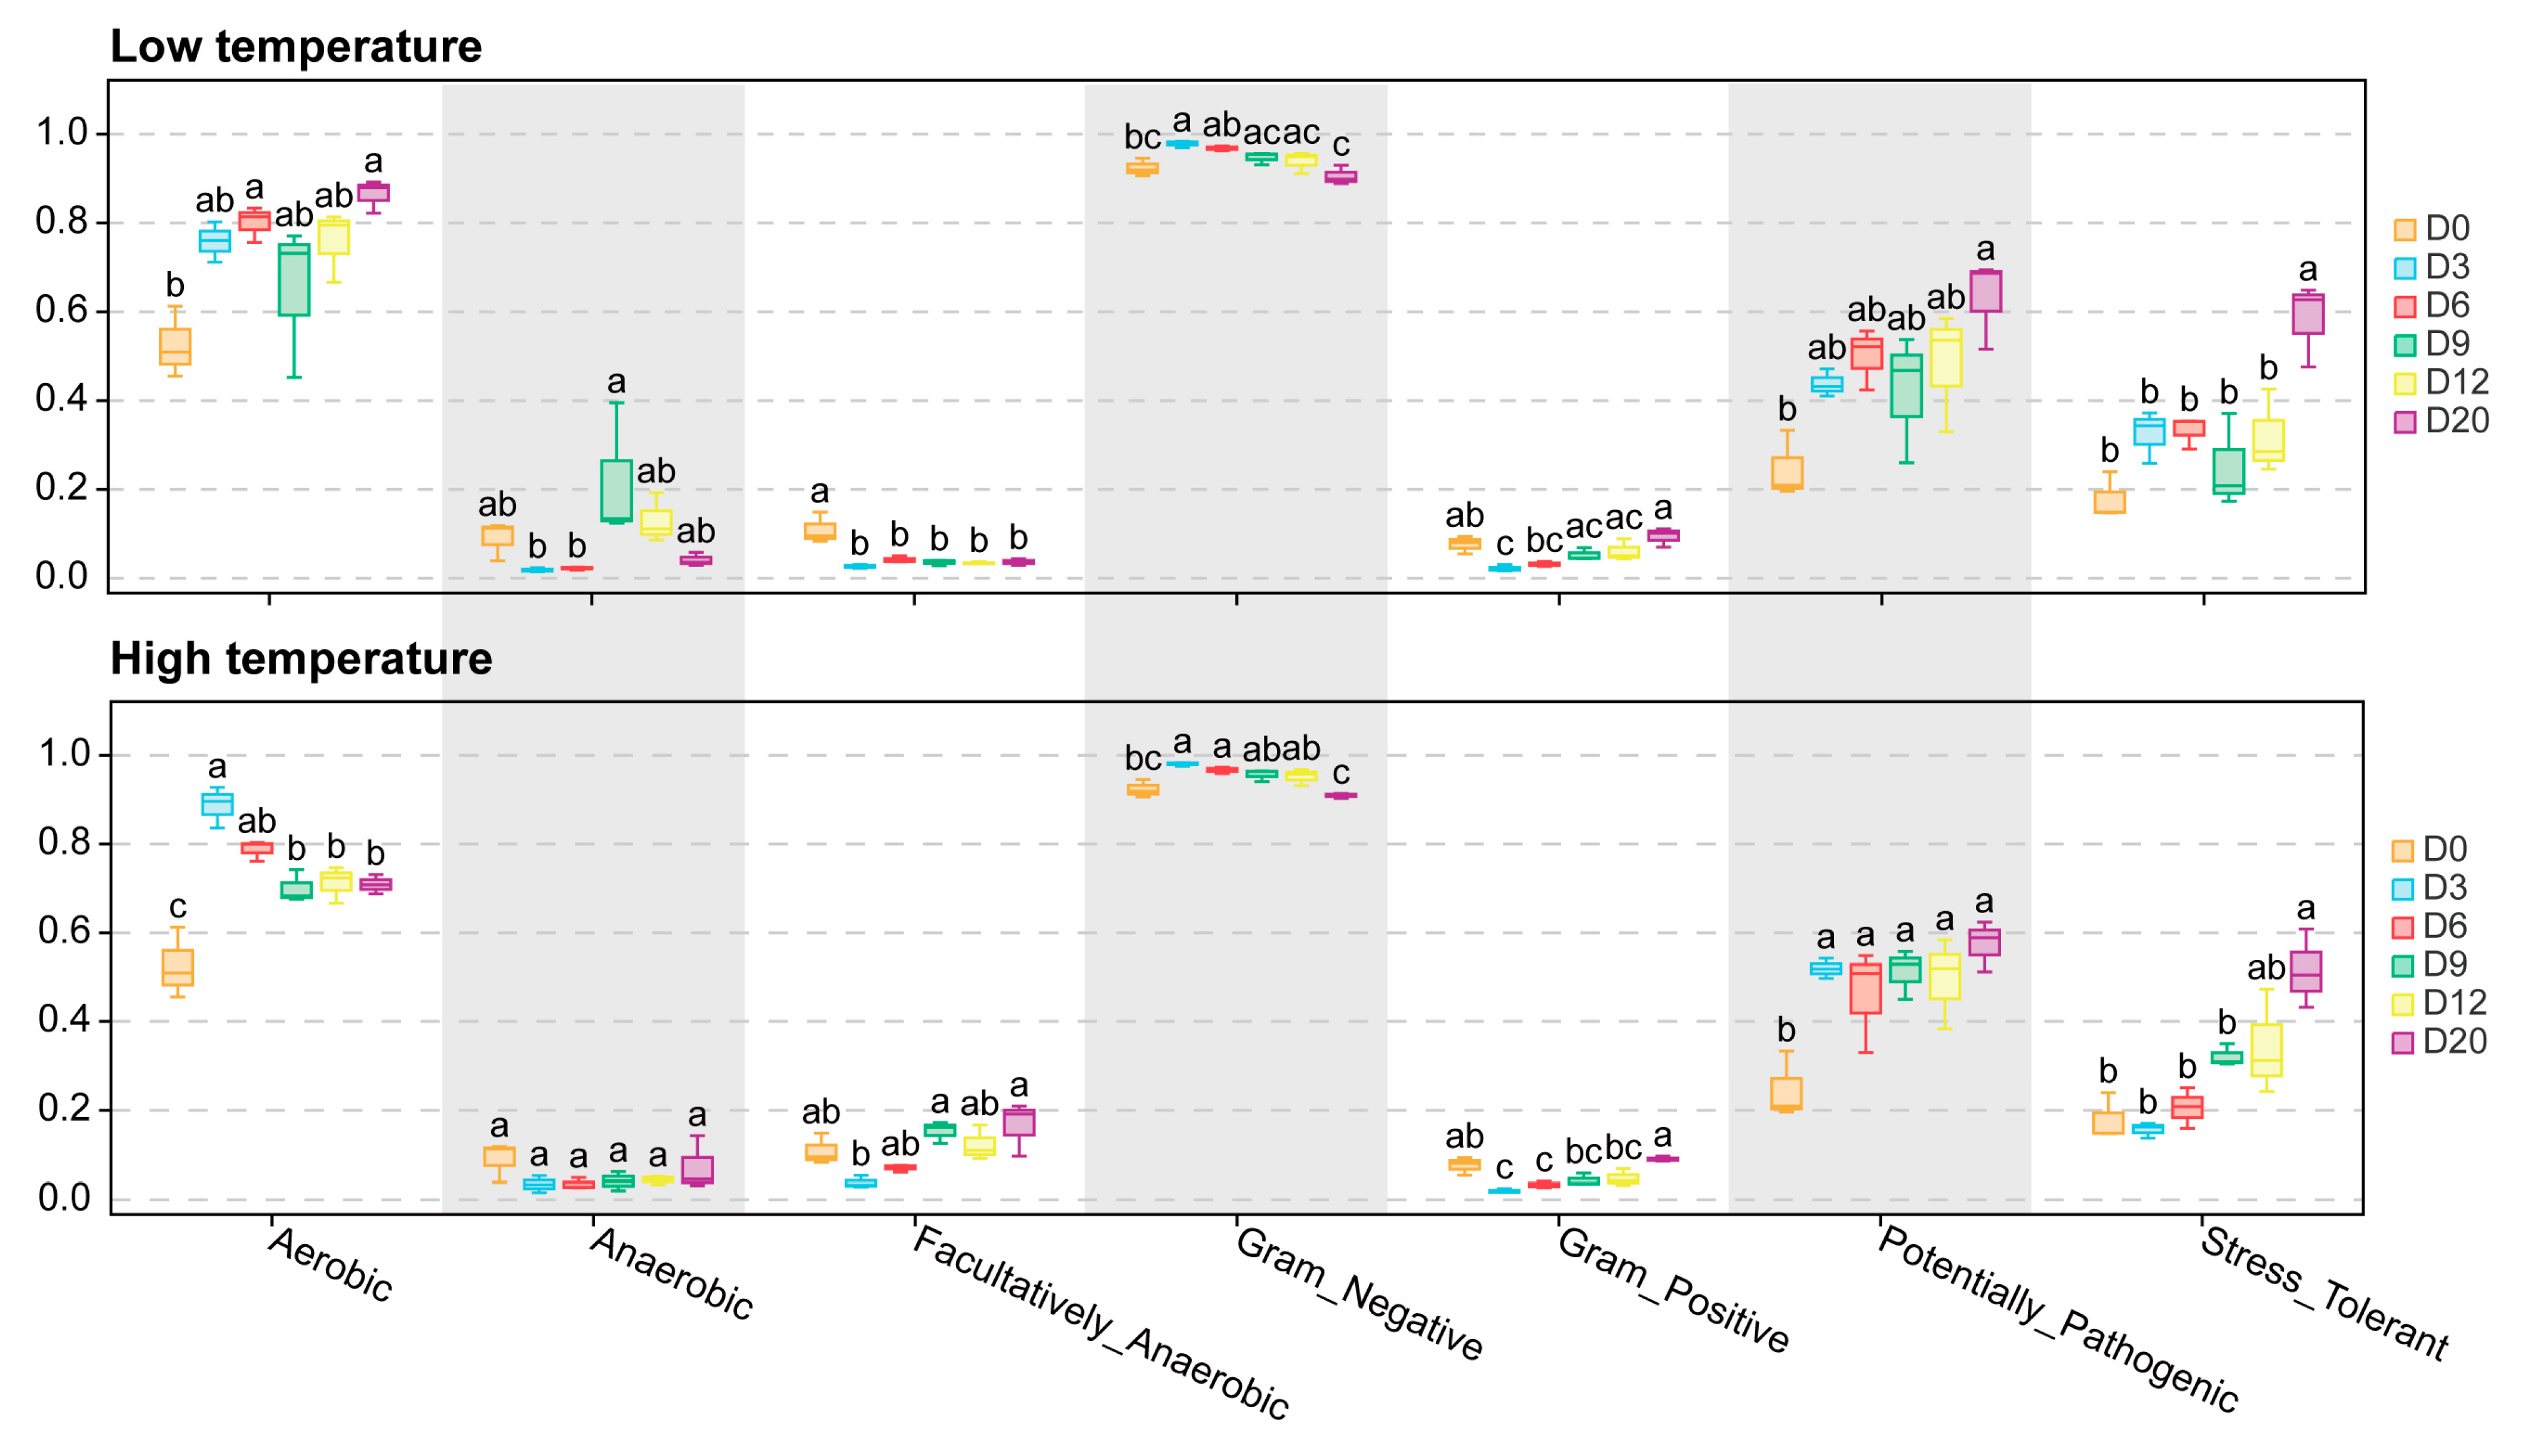
Using BugBase analysis, the abundance of Aerobic bacterium in water-column increased over time under low-temperature over 20 days, whereas it increased under high-temperature by Day 3, followed by a decrease at Day 20 (p < 0.05, Figure 7); a significant difference in abundance of Aerobic bacterium was observed between the low- and high-temperature groups on Day 20 (p < 0.05, Figure S7). Similarly, the abundance of the stress tolerant phenotype increased over time in both the low- and high-temperature groups over 20 days, and it was higher on Day 3 in the low-temperature group (p < 0.05, Figure S7). Notably, the abundance of potentially pathogenic bacteria increased significantly on Day 3 in the high-temperature groups, while it increased on Day 20 in the low-temperature groups (p < 0.05, Figure 7 and Figure S7). There was little or no effect on the abundance of Germ-negative and Germ-positive phenotypes under low- or high-temperature.

4. Discussion

Microorganisms, as an important component of aquaculture ecosystems, play a significant role in maintaining water environmental homeostasis and the health of aquatic animals. Previous studies have shown that water-column microbial communities are crucial factors influencing the gut microbiota of fish [11]. In Carassius gibelio, intestinal microbiota have been shown to be associated with aquatic environmental compartments and to vary across seasons, reflecting changes in water temperature and food resources [38,39]. Sediments can influence fish gut microbiota partly by altering water-column microbial communities, while direct sediment ingestion or contact may also contribute to gastrointestinal microbial composition. In this study, all diversity indices, including Shannon, Sob, Chao1 and Simpson, decreased over time in the water-column. The possible reason for decreasing diversity is that the nutrient composition of sediments can change and influence nutrient exchange between sediments and the overlying water [40]. Consistent with this possibility, TN, TP, NH4-N, and NO2-N generally increased over time, especially under high-temperature conditions (Figure S4). This shift in nutrient conditions may have become less favorable for a diverse range of species and led to a transition from a diverse community to one dominated by a few resilient species, ultimately resulting in decreased overall biodiversity. The Sob index was significantly higher under low-temperature conditions compared to high-temperature conditions by Day 20, suggesting low-temperature can lead to a more homogeneous community with fewer species, especially in environments with limited niches. Water-column taxa at the phylum level were dominated by Proteobacteria, Bacteroidota, Actinobacteriota, Verrucomicrobiota, and Cyanobacteria, which is similar to previous studies in freshwater lakes [41] and river sediments [42]. These bacterial phyla play critical roles in aquatic ecosystems by contributing to nutrient cycling, organic matter decomposition, and the maintenance of ecosystem health [43,44,45].
The dominant bacterial phyla recorded in intestines and the surrounding water environment were Proteobacteria, Cyanobacteria, Bacteroidetes, and Actinobacteria. Cyanobacteria detected in fish intestinal samples were considered likely allochthonous taxa from the surrounding water or ingested particles [46,47]; therefore, analyses were conducted both with and without Cyanobacteria to confirm the robustness of the conclusions. These bacteria constitute the most commonly observed microflora in animal intestines. In this study, the mean abundance of the top 10 genera, including Methylotenera, Flavobacterium, Sediminibacterium and Sulfuritalea, was higher under low-temperature conditions than under high-temperature conditions. In aquatic environments, Methylotenera species, potentially in partnership with Methylobacter in water system, plays a critical role in linking nitrogen and carbon cycles by driving nitrate-stimulated methane oxidation [48]. Sulfur-oxidizing bacteria, such as Sulfuritalea, can contribute to sulfur cycling in conjunction with sulfate-reducing bacteria [49]. Therefore, the genera Methylotenera and Sulfuritalea may impact the trophic transfer of methane-derived carbon and cycling of sulfur within aquatic ecosystems under low-temperature conditions.
The results of this study indicated that nitrogen, phosphorus, ammonium, and nitrite levels were the main environmental factors associated with the bacterial community in water samples. These factors were significantly correlated with microbial abundance and diversity under different temperature conditions. Although nitrite and ammonium have been reported to be associated with shifts in microbial community composition, particularly nitrogen-transforming bacteria involved in ammonia and nitrite oxidation in aquaculture systems [50], they can also be harmful to cultured fish. Phosphorus and nitrogen contribute to water eutrophication, which alters the composition and diversity of microbial communities in freshwater lakes [51]. These environmental factors can directly change microbial community structure by disrupting microbial physiology, or indirectly by creating conditions that affect microorganisms. Genus Burkholderia-Caballeronia-Paraburkholderia that belongs to Proteobacteria, was dominant in the fish intestine, similar to findings in farmed rabbitfish [52]; however, its ecological and functional role in fish intestinal microbiota remains unclear.
Previous studies also indicate that intestinal microbiota respond to temperature-related changes. Water temperature decrease altered intestinal microbiota and immune responses in Carassius auratus [53], while thermal stress led to intestinal inflammation, microbiota dysbiosis, and changes in key taxa, such as Mycobacterium and Cetobacterium in Carassius gibelio [54]. High-temperature initially promoted the growth of some microbes during the first 3 days, thereby enhancing the overall diversity of gut microbes. This finding aligns with reports that certain thermotolerant microorganisms exhibit greater adaptation in high-temperature environments [18]. However, after 6 days, microbial taxa present at low abundance under low-temperature conditions might gain a competitive advantage and thrive when initial biodiversity is impaired, specifically the genera Vibrionimonas, Bradyrhizobium, Curvibacter and Mycobacterium, which are among the top 10 relative abundance species at genus levels, showed high abundance at Day 12 under low-temperature conditions. It has been reported that heat stress increased the abundance of potential pathogens (Vibrionimonas and Mesorhizobium) and decreased probiotics (Bradyrhizobium and Methylovirgula) in sturgeon skin [55]. Bradyrhizobium is commonly recognized as a plant-associated nitrogen-fixing bacterium, but its functional role in fish intestines remains unclear.
In aquaculture systems, warmer conditions may affect fish not only by stimulating bacterial proliferation but also by elevating bacterial and fish respiration rates. Because all groups were prepared under identical initial conditions, these differences likely reflect temperature-dependent rates of microbial succession rather than differences in initial microbial load. Higher temperature may accelerate microbial metabolism and community turnover [13], leading to a faster enrichment of predicted potentially pathogenic phenotypes during the 20-day experiment. In fish, elevated acclimation temperature has been associated with higher basal cortisol production and increased oxygen consumption, indicating greater maintenance energy costs and a higher risk of hypoxia during thermal challenge [20]. Likewise, rohu (Labeo rohita) acclimated to 36 °C for 30 days showed higher oxygen consumption, along with erythrocyte micronucleus formation and gill histopathological lesions, further supporting that prolonged warm exposure can impose substantial physiological stress [56]. However, fish respiration rates were not directly measured in this study. Overall, the earlier enrichment of predicted potentially pathogenic phenotypes observed at 30 °C may reflect faster microbial turnover under warmer conditions, while increased respiration and maintenance energy expenditure may contribute to physiological stress in fish.
The genera Flavobacterium, Mycobacterium and Vibrionimonas were generally considered potential opportunistic pathogens. They are widely found in temperate aquatic environments and include taxa associated with bacterial septicemia in a wide range of fish species [55,57,58,59,60,61]. Flavobacterium psychrophilum, Flavobacterium columnare, and Flavobacterium branchiophilum are important fish pathogens [58,62,63]. In this study, Flavobacterium was among the top 10 genera in water samples and contributed to the predicted potentially pathogenic phenotype. This phenotype increased more slowly under low-temperature conditions but more rapidly under high-temperature conditions over time. Although the mean abundance of Flavobacterium and Vibrionimonas was higher under low-temperature conditions compared to high-temperatures conditions, their lower initial abundance in the high-temperature group may have provided greater niche opportunity, allowing a faster relative increase over time [64,65]. However, in the present study, the difference in Mycobacterium and Vibrionimonas abundance between temperature groups was not maintained by Day 20, suggesting that its enrichment was transient. The earlier enrichment of putative pathogens under high-temperature conditions may indicate faster microbial succession and earlier pathogen-related risk. This may partly explain why disease outbreaks in fish are more frequent under high-temperature conditions compared to low-temperature conditions and are hard to eliminate despite the use of disinfection protocols.
The presumptive functional profile of microbial communities, predicted using PICRUSt analysis based on 16S rDNA, provides valuable insights into potential functionalities. Previous studies have indicated that the functional composition of microbial communities is closely associated with environmental factors, with varying environments influencing differences in microbial community functions. For example, low temperatures transform intestinal communities into a simpler coexistence relationship, leading to decreased network complexity [66]. In this study, the highest levels of enrichment were found in carbohydrate metabolism and amino acid metabolism, consistent with previous findings [66,67,68]. The predicted enrichment of carbohydrate and amino acid metabolism in intestinal microbiota may partly reflect compensatory microbial functions associated with nutrient turnover under different thermal conditions, although this interpretation should be verified by direct metabolomic analyses and assessments of fish growth performance. Interestingly, the abundance of functional profiles was higher in fish intestines under low-temperature conditions during the first 6 days, including amino acids metabolism, genetic information processing and cellular processes. A study demonstrated that many amino acids, including alanine, lysine, and tyrosine, decreased significantly in Gymnocypris chilianensis when water temperature increased from 10 °C to 20 °C [69]. Moreover, natural fluctuations in environmental factors (e.g., increasing TN and TP over time) may interact with temperature effects. However, observed microbial community shifts should be interpreted as system-level responses under temperature gradients, rather than pure temperature effects in a fully controlled environment.
One methodological caveat is that 16S rRNA V3–V4 amplicon sequencing mainly provides relative taxonomic profiles with limited species- or strain-level resolution [70,71], and PICRUSt-based functional predictions should be interpreted cautiously because they depend on closely related, fully sequenced, and well-annotated reference genomes that may be limited for aquaculture and pond microbes [35]. Therefore, the predicted functional and phenotypic results related to microbial activity or pathogenicity should be validated using metagenomic, transcriptomic, or metabolomic approaches. In addition, because intestinal microbiota were analyzed using composite samples from three fish within each tank, these data represent tank-level community patterns rather than individual fish microbiomes, limiting assessment of inter-individual variability. The with-fish and without-fish systems were complementary but not directly equivalent, because feeding, fecal output, mucus release, host-associated microbial shedding, oxygen consumption, and host metabolism occurred only in tanks with fish. Therefore, comparisons between intestinal and water-column microbiota should not be interpreted as a complete separation of host and environmental effects. Florfenicol pretreatment was used to partially standardize the initial gut microbial background, but its potential carryover effects on intestinal microbiota recovery and temperature-dependent responses cannot be excluded. Another limitation is that this study compared only two temperature conditions. Therefore, the results cannot determine whether the observed microbial changes represent a linear temperature-dependent response or a threshold effect. Future studies, including antibiotic-free controls, intermediate temperature gradients, individual-level intestinal sampling, and direct functional validation, are needed to better define temperature-dependent microbial responses and their relevance for aquaculture management.

5. Conclusions

In octoploid allogynogenetic gibel carp, water temperature was associated with changes in pond water-column microbiota and tank-level composite intestinal microbial communities during the 20-day experimental period. Compared with 30 °C, the 16 °C treatment showed slower enrichment of predicted potentially pathogenic phenotypes in water-column microbiota and higher predicted nutrient-metabolism potential in composite intestinal microbiota. However, these effects should be interpreted as potentially transient tank-level microbial responses rather than direct evidence that low temperature improves host health. Future studies should include intermediate temperature gradients, antibiotic-free controls, individual-level intestinal microbiota profiling, direct functional validation, and host physiological assessments to determine whether temperature management alone can improve aquaculture performance.

Supplementary Materials

The following supporting information can be downloaded at: https://www.mdpi.com/article/10.3390/fishes11080436/s1. Figure S1. Differential genera in water-column microbial communities between low- and high-temperature groups. Figure S2 Differential genera in fish intestines microbial communities between low- and high-temperature groups. Figure S3 Differences in alpha-diversity indices between low- and high-temperature groups at each sampling time. Figure S4 Temporal changes in water-quality parameters in the water column under low- and high-temperature conditions. Figure S5 PICRUSt2-predicted functional pathways of fish intestinal microbial communities between the low- and high-temperature groups. Figure S6 BugBase-predicted bacterial phenotypes of fish intestinal microbial communities between the low- and high-temperature groups. Figure S7 BugBase-predicted bacterial phenotypes of water-column microbial communities between the low- and high-temperature groups. Table S1 Data pre-processing, statistics and quality control. Table S2 Statistics of the effective tags. Table S3 Statistics of the operational taxonomic units (OTUs).

Author Contributions

Conceptualization: L.X. and Y.G.; Funding acquisition: L.X. and Y.G.; Investigation and Data curation: Y.C., G.Z., J.C. and M.L.; Data analysis and Interpretation: Y.C., G.Z. and Y.G.; Resources: L.X.; Supervision: L.X. and Y.G.; Visualization: Y.G.; Writing—original draft: L.X. and Y.G.; Writing—review and editing: Y.G.; All authors have read and agreed to the published version of the manuscript.

Funding

This work was jointly supported by funding from the Earmarked Fund for China Agriculture Research System (CARS-45-40); the Young Talent Project of the “Xing Dian Talent Support Program” of Yunnan Province in 2022; the Fujian Provincial Bureau of Ocean and Fisheries (FJHY-YYKJ-2025-2-1; FJHYF-L-2025-1); the Fujian Provincial Department of Science and Technology (2024R1014003); the Yunnan Provincial Department of Science and Technology (202202AE090018). Y. Gao was also financially supported by the China Scholarship Council (202208530097).

Institutional Review Board Statement

The use of Allogynogenetic gibel carp (Carassius gibelio) in this study complied with the animal welfare laws, guidelines, and policies, as approved by the Scientific Ethics Committee of Freshwater Research Institute of Fujian Province, China (code: FFRIFJ-DW-2023-1, date 4 January 2023).

Data Availability Statement

Data of the present article are available under request.

Conflicts of Interest

The authors declare no conflicts of interest.

References

  1. Jiang, Y.; Yu, H.; Chen, B.; Liang, S.; Shan, S.; Yang, D.; Lin, S.; Shen, G. Biological effect of heterologous sperm on gynogenetic offspring in Carassius auratus gibelio. Acta Hydrobiol. Sin. 1983, 8, 1–13. [Google Scholar] [CrossRef]
  2. Tornero, V.; Hanke, G. Chemical contaminants entering the marine environment from sea-based sources: A review with a focus on European seas. Mar. Pollut. Bull. 2016, 112, 17–38. [Google Scholar] [CrossRef] [PubMed]
  3. Yusoff, F.M.; Umi, W.A.D.; Ramli, N.M.; Harun, R. Water quality management in aquaculture. Camb. Prism. Water 2024, 2, e8. [Google Scholar] [CrossRef]
  4. Han, D.; Hu, Z.; Li, D.; Tang, R. Nitrogen Removal of Water and Sediment in Grass Carp Aquaculture Ponds by Mixed Nitrifying and Denitrifying Bacteria and Its Effects on Bacterial Community. Water 2022, 14, 1855. [Google Scholar] [CrossRef]
  5. El-Tohamy, W.S.; Taher, M.E.; Ghoneim, A.M.; Hopcroft, R.R. Protozoan communities serve as a strong indicator of water quality in the Nile River. Sci. Rep. 2024, 14, 16382. [Google Scholar] [CrossRef] [PubMed]
  6. Zhao, P.; Huang, J.; Wang, X.-H.; Song, X.-L.; Yang, C.-H.; Zhang, X.-G.; Wang, G.-C. The application of bioflocs technology in high-intensive, zero exchange farming systems of Marsupenaeus japonicus. Aquaculture 2012, 354–355, 97–106. [Google Scholar] [CrossRef]
  7. Boyd, C.E.; Wood, C.W.; Thunjai, T. Aquaculture Pond Bottom Soil Quality Management. Available online: http://crsps.net/wp-content/downloads/AquaFish/Inventoried%204.16/8-2002-8-609.pdf (accessed on 16 July 2002).
  8. Zhang, K.; Ye, Z.; Qi, M.; Cai, W.; Saraiva, J.L.; Wen, Y.; Liu, G.; Zhu, Z.; Zhu, S.; Zhao, J. Water Quality Impact on Fish Behavior: A Review From an Aquaculture Perspective. Rev. Aquac. 2025, 17, e12985. [Google Scholar] [CrossRef]
  9. Kanika, N.H.; Liaqat, N.; Chen, H.; Ke, J.; Lu, G.; Wang, J.; Wang, C. Fish gut microbiome and its application in aquaculture and biological conservation. Front. Microbiol. 2025, 15, 1521048. [Google Scholar] [CrossRef] [PubMed]
  10. Bozzi, D.; Rasmussen, J.A.; Carøe, C.; Sveier, H.; Nordøy, K.; Gilbert, M.T.P.; Limborg, M.T. Salmon gut microbiota correlates with disease infection status: Potential for monitoring health in farmed animals. Anim. Microbiome 2021, 3, 30. [Google Scholar] [CrossRef] [PubMed]
  11. Sun, F.; Wang, Y.; Wang, C.; Zhang, L.; Tu, K.; Zheng, Z. Insights into the intestinal microbiota of several aquatic organisms and association with the surrounding environment. Aquaculture 2019, 507, 196–202. [Google Scholar] [CrossRef]
  12. Ruiz, A.; Gisbert, E.; Andree, K.B. Impact of the diet in the gut microbiota after an inter-species microbial transplantation in fish. Sci. Rep. 2024, 14, 4007. [Google Scholar] [CrossRef] [PubMed]
  13. Hall, E.K.; Neuhauser, C.; Cotner, J.B. Toward a mechanistic understanding of how natural bacterial communities respond to changes in temperature in aquatic ecosystems. ISME J. 2008, 2, 471–481. [Google Scholar] [CrossRef] [PubMed]
  14. Dehler, C.E.; Secombes, C.J.; Martin, S.A.M. Environmental and physiological factors shape the gut microbiota of Atlantic salmon parr (Salmo salar L.). Aquaculture 2017, 467, 149–157. [Google Scholar] [CrossRef] [PubMed]
  15. Liu, Z.; Wang, P.; Wei, J.; Li, J.; Luo, X.; Huang, X.; Zhang, X.; Li, W.; Qin, Q. Effect of intestinal microbiota on adaptation to overcrowding stress in grouper (Epinephelus fuscoguttatus♀×E. lanceolatus♂). Fish Shellfish Immunol. 2025, 159, 110165. [Google Scholar] [CrossRef] [PubMed]
  16. Ji, L.; Zhang, H.; Wang, Z.; Tian, Y.; Tian, W.; Liu, Z. Temperature alters bacterial community structure in sediment of mountain stream. Sci. Rep. 2024, 14, 31159. [Google Scholar] [CrossRef] [PubMed]
  17. Lokmer, A.; Mathias Wegner, K. Hemolymph microbiome of Pacific oysters in response to temperature, temperature stress and infection. ISME J. 2015, 9, 670–682. [Google Scholar] [CrossRef] [PubMed]
  18. He, Q.; Wang, H.; Chen, L.; Gao, S.; Zhang, W.; Song, J.; Yu, J. Robustness of an aerobic granular sludge sequencing batch reactor for low strength and salinity wastewater treatment at ambient to winter temperatures. J. Hazard. Mater. 2020, 384, 121454. [Google Scholar] [CrossRef] [PubMed]
  19. Cai, W.; Arias, C.R. Biofilm Formation on Aquaculture Substrates by Selected Bacterial Fish Pathogens. J. Aquat. Anim. Health 2017, 29, 95–104. [Google Scholar] [CrossRef] [PubMed]
  20. Madaro, A.; Folkedal, O.; Maiolo, S.; Alvanopoulou, M.; Olsen, R.E. Effects of acclimation temperature on cortisol and oxygen consumption in Atlantic salmon (Salmo salar) post-smolt exposed to acute stress. Aquaculture 2018, 497, 331–335. [Google Scholar] [CrossRef]
  21. Smith, P.; Willemsen, D.; Popkes, M.; Metge, F.; Gandiwa, E.; Reichard, M.; Valenzano, D.R. Regulation of life span by the gut microbiota in the short-lived African turquoise killifish. eLife 2017, 6, e27014. [Google Scholar] [CrossRef] [PubMed]
  22. HJ 636-2012; Water quality—Determination of total nitrogen—Alkaline potassium persulfate digestion UV spectrophotometric method. Ministry of Environmental Protection: Beijing, China, 2012.
  23. GB/T 11893-1989; Water Quality. Determination of Total Phosphorus. Ammonium Molybdate Spectrophotometric Method. Ministry of Ecology and Environment: Beijing, China, 1989.
  24. HJ 535-2009; Water Quality—Determination of Ammonia Nitrogen—Nessler Reagent Spectrophotometry. Ministry of Environmental Protection: Beijing, China, 2009.
  25. HJ 84-2016; Determination of Water Inorganic Anions (F, Cl, NO2, Br, NO3, PO43−, SO32−, SO42−)—Ion Chromatography Method. Ministry of Ecology and Environment: Beijing, China, 2016.
  26. Edgar, R.C. UPARSE: Highly accurate OTU sequences from microbial amplicon reads. Nat. Methods 2013, 10, 996–998. [Google Scholar] [CrossRef] [PubMed]
  27. Wang, Q.; Garrity George, M.; Tiedje James, M.; Cole James, R. Naïve Bayesian Classifier for Rapid Assignment of rRNA Sequences into the New Bacterial Taxonomy. Appl. Environ. Microbiol. 2007, 73, 5261–5267. [Google Scholar] [CrossRef] [PubMed]
  28. Pruesse, E.; Quast, C.; Knittel, K.; Fuchs, B.M.; Ludwig, W.; Peplies, J.; Glöckner, F.O. SILVA: A comprehensive online resource for quality checked and aligned ribosomal RNA sequence data compatible with ARB. Nucleic Acids. Res. 2007, 35, 7188–7196. [Google Scholar] [CrossRef] [PubMed]
  29. Caporaso, J.G.; Kuczynski, J.; Stombaugh, J.; Bittinger, K.; Bushman, F.D.; Costello, E.K.; Fierer, N.; Peña, A.G.; Goodrich, J.K.; Gordon, J.I.; et al. QIIME allows analysis of high-throughput community sequencing data. Nat. Methods 2010, 7, 335–336. [Google Scholar] [CrossRef] [PubMed]
  30. Dixon, P. VEGAN, a package of R functions for community ecology. J. Veg. Sci. 2003, 14, 927–930. [Google Scholar] [CrossRef]
  31. Anderson, M.J. A new method for non-parametric multivariate analysis of variance. Austral Ecol. 2001, 26, 32–46. [Google Scholar] [CrossRef]
  32. Anderson, M.J. Distance-Based Tests for Homogeneity of Multivariate Dispersions. Biometrics 2006, 62, 245–253. [Google Scholar] [CrossRef] [PubMed]
  33. Segata, N.; Izard, J.; Waldron, L.; Gevers, D.; Miropolsky, L.; Garrett, W.S.; Huttenhower, C. Metagenomic biomarker discovery and explanation. Genome Biol. 2011, 12, R60. [Google Scholar] [CrossRef] [PubMed]
  34. Oksanen, J. Multivariate analysis of ecological communities in R: Vegan tutorial. R Package Version 2011, 1, 1–43. [Google Scholar] [CrossRef]
  35. Langille, M.G.I.; Zaneveld, J.; Caporaso, J.G.; McDonald, D.; Knights, D.; Reyes, J.A.; Clemente, J.C.; Burkepile, D.E.; Vega Thurber, R.L.; Knight, R.; et al. Predictive functional profiling of microbial communities using 16S rRNA marker gene sequences. Nat. Biotechnol. 2013, 31, 814–821. [Google Scholar] [CrossRef] [PubMed]
  36. Ward, T.; Larson, J.; Meulemans, J.; Hillmann, B.; Lynch, J.; Sidiropoulos, D.; Spear, J.R.; Caporaso, G.; Blekhman, R.; Knight, R.; et al. BugBase predicts organism-level microbiome phenotypes. bioRxiv 2017, 133462. [Google Scholar] [CrossRef]
  37. Revelle, W. psych: Procedures for Psychological, Psychometric, and Personality Research. 2026. Available online: https://personality-project.org/r/psych-manual.pdf (accessed on 16 July 2026).
  38. Kashinskaya, E.N.; Simonov, E.P.; Izvekova, G.I.; Baturina, O.A.; Solovyev, M.M. Variability of Composition of Microbiota of Gastrointestinal Tract of Perch Perca fluviatilis and Prussian Carp Carassius gibelio During the Vegetative Season. J. Ichthyol. 2021, 61, 955–971. [Google Scholar] [CrossRef]
  39. Kashinskaya, E.N.; Belkova, N.L.; Izvekova, G.I.; Simonov, E.P.; Andree, K.B.; Glupov, V.V.; Baturina, O.A.; Kabilov, M.R.; Solovyev, M.M. A comparative study on microbiota from the intestine of Prussian carp (Carassius gibelio) and their aquatic environmental compartments, using different molecular methods. J. Appl. Microbiol. 2015, 119, 948–961. [Google Scholar] [CrossRef] [PubMed]
  40. Søndergaard, M.; Jensen, J.P.; Jeppesen, E. Role of sediment and internal loading of phosphorus in shallow lakes. Hydrobiologia 2003, 506, 135–145. [Google Scholar] [CrossRef]
  41. Liu, L.; Yang, J.; Yu, Z.; Wilkinson, D.M. The biogeography of abundant and rare bacterioplankton in the lakes and reservoirs of China. ISME J. 2015, 9, 2068–2077. [Google Scholar] [CrossRef] [PubMed]
  42. Wang, Y.; Sheng, H.-F.; He, Y.; Wu, J.-Y.; Jiang, Y.-X.; Tam Nora, F.-Y.; Zhou, H.-W. Comparison of the Levels of Bacterial Diversity in Freshwater, Intertidal Wetland, and Marine Sediments by Using Millions of Illumina Tags. Appl. Environ. Microbiol. 2012, 78, 8264–8271. [Google Scholar] [CrossRef] [PubMed]
  43. Kirchman, D.L. The ecology of Cytophaga–Flavobacteria in aquatic environments. FEMS Microbiol. Ecol. 2002, 39, 91–100. [Google Scholar] [CrossRef] [PubMed]
  44. Cardman, Z.; Arnosti, C.; Durbin, A.; Ziervogel, K.; Cox, C.; Steen, A.D.; Teske, A. Verrucomicrobia Are Candidates for Polysaccharide-Degrading Bacterioplankton in an Arctic Fjord of Svalbard. Appl. Environ. Microbiol. 2014, 80, 3749–3756. [Google Scholar] [CrossRef] [PubMed]
  45. Lobus, N.V.; Kulikovskiy, M.S. The Co-Evolution Aspects of the Biogeochemical Role of Phytoplankton in Aquatic Ecosystems: A Review. Biology 2023, 12, 92. [Google Scholar] [CrossRef] [PubMed]
  46. Sullam, K.E.; Essinger, S.D.; Lozupone, C.A.; O’Connor, M.P.; Rosen, G.L.; Knight, R.O.B.; Kilham, S.S.; Russell, J.A. Environmental and ecological factors that shape the gut bacterial communities of fish: A meta-analysis. Mol. Ecol. 2012, 21, 3363–3378. [Google Scholar] [CrossRef] [PubMed]
  47. Ghanbari, M.; Kneifel, W.; Domig, K.J. A new view of the fish gut microbiome: Advances from next-generation sequencing. Aquaculture 2015, 448, 464–475. [Google Scholar] [CrossRef]
  48. van Grinsven, S.; Sinninghe Damsté, J.S.; Harrison, J.; Polerecky, L.; Villanueva, L. Nitrate promotes the transfer of methane-derived carbon from the methanotroph Methylobacter sp. to the methylotroph Methylotenera sp. in eutrophic lake water. Limnol. Oceanogr. 2021, 66, 878–891. [Google Scholar] [CrossRef]
  49. Guo, W.; Wen, Y.; Chen, Y.; Zhou, Q. Sulfur cycle as an electron mediator between carbon and nitrate in a constructed wetland microcosm. Front. Environ. Sci. Eng. 2020, 14, 57. [Google Scholar] [CrossRef]
  50. John, E.M.; Krishnapriya, K.; Sankar, T.V. Treatment of ammonia and nitrite in aquaculture wastewater by an assembled bacterial consortium. Aquaculture 2020, 526, 735390. [Google Scholar] [CrossRef]
  51. Chrost, R.J.; Adamczewski, T.; Kalinowska, K.; Skowronska, A. Inorganic phosphorus and nitrogen modify composition and diversity of microbial communities in water of mesotrophic lake. Pol. J. Microbiol. 2009, 58, 77–90. [Google Scholar] [PubMed]
  52. Huang, X.; Li, Q.; Li, W.; Han, C.; Yang, Y.; Huang, Z.; Lin, H. Rabbitfish (Siganus oramin) gut microbiota description of farmed and wild specimens. Aquac. Rep. 2024, 35, 101928. [Google Scholar] [CrossRef]
  53. Liu, Y.; Lv, H.; Xu, L.; Zhang, K.; Mei, Y.; Chen, J.; Wang, M.; Guan, Y.; Pang, H.; Wang, Y.; et al. The Effect of Dietary Lactic Acid Bacteria on Intestinal Microbiota and Immune Responses of Crucian Carp (Carassius auratus) Under Water Temperature Decrease. Front. Microbiol. 2022, 13, 847167. [Google Scholar] [CrossRef] [PubMed]
  54. Yu, Y.; Lou, Z.; Han, D.; Zhu, X.; Liu, H.; Zhang, Z.; Yang, Y.; Xie, S.; Jin, J. Influences of fishmeal substitution with protein blends on growth performance, protein digestibility, intestinal health, and gut microbiota of gibel carp (Carassius gibelio var. CAS V) under thermal stress. Aquac. Rep. 2026, 47, 103426. [Google Scholar] [CrossRef]
  55. Yang, S.; Xu, W.; Tan, C.; Li, M.; Li, D.; Zhang, C.; Feng, L.; Chen, Q.; Jiang, J.; Li, Y.; et al. Heat Stress Weakens the Skin Barrier Function in Sturgeon by Decreasing Mucus Secretion and Disrupting the Mucosal Microbiota. Front. Microbiol. 2022, 13, 860079. [Google Scholar] [CrossRef] [PubMed]
  56. Islam, S.M.M.; Zahangir, M.M.; Ashaf-Ud-Doulah, M.; Khatun, M.M.; Shahjahan, M. Extreme warm acclimation temperature alters oxygen consumption, micronucleus formation in erythrocytes, and gill morphology of rohu (Labeo rohita) fingerlings. Fish Physiol. Biochem. 2020, 46, 2323–2330. [Google Scholar] [CrossRef] [PubMed]
  57. Hadfield, C.A. Bacterial Diseases. In Clinical Guide to Fish Medicine; Wiley Blackwell: Hoboken, NJ, USA, 2021; pp. 431–467. [Google Scholar]
  58. Starliper, C.E. Bacterial coldwater disease of fishes caused by Flavobacterium psychrophilum. J. Adv. Res. 2011, 2, 97–108. [Google Scholar] [CrossRef]
  59. Yu, X.; Yu, K.; Liao, Z.; Liang, J.; Deng, C.; Huang, W.; Huang, Y. Potential molecular traits underlying environmental tolerance of Pavona decussata and Acropora pruinosa in Weizhou Island, northern South China Sea. Mar. Pollut. Bull. 2020, 156, 111199. [Google Scholar] [CrossRef] [PubMed]
  60. Delghandi, M.R.; El-Matbouli, M.; Menanteau-Ledouble, S. Mycobacteriosis and Infections with Non-tuberculous Mycobacteria in Aquatic Organisms: A Review. Microorganisms 2020, 8, 1368. [Google Scholar] [CrossRef] [PubMed]
  61. Ina-Salwany, M.Y.; Al-saari, N.; Mohamad, A.; Mursidi, F.-A.; Mohd-Aris, A.; Amal, M.N.A.; Kasai, H.; Mino, S.; Sawabe, T.; Zamri-Saad, M. Vibriosis in Fish: A Review on Disease Development and Prevention. J. Aquat. Anim. Health 2019, 31, 3–22. [Google Scholar] [CrossRef] [PubMed]
  62. LaFrentz, B.R.; García, J.C.; Waldbieser, G.C.; Evenhuis, J.P.; Loch, T.P.; Liles, M.R.; Wong, F.S.; Chang, S.F. Identification of Four Distinct Phylogenetic Groups in Flavobacterium columnare with Fish Host Associations. Front. Microbiol. 2018, 9, 452. [Google Scholar] [CrossRef] [PubMed]
  63. Good, C.; Davidson, J.; Wiens, G.D.; Welch, T.J.; Summerfelt, S. Flavobacterium branchiophilum and F. succinicans associated with bacterial gill disease in rainbow trout Oncorhynchus mykiss (Walbaum) in water recirculation aquaculture systems. J. Fish Dis. 2015, 38, 409–413. [Google Scholar] [CrossRef] [PubMed]
  64. Sprockett, D.; Fukami, T.; Relman, D.A. Role of priority effects in the early-life assembly of the gut microbiota. Nat. Rev. Gastroenterol. Hepatol. 2018, 15, 197–205. [Google Scholar] [CrossRef] [PubMed]
  65. Debray, R.; Herbert, R.A.; Jaffe, A.L.; Crits-Christoph, A.; Power, M.E.; Koskella, B. Priority effects in microbiome assembly. Nat. Rev. Microbiol. 2022, 20, 109–121. [Google Scholar] [CrossRef] [PubMed]
  66. Mu, X.; Shi, S.; Hu, X.; Gan, X.; Han, Q.; Yu, Q.; Qu, J.; Li, H. Gut microbiome and antibiotic resistance genes in plateau model animal (Ochotona curzoniae) exhibit a relative stability under cold stress. J. Hazard. Mater. 2024, 478, 135472. [Google Scholar] [CrossRef] [PubMed]
  67. Zhao, Z.; Zhao, H.; Wang, X.; Zhang, L.; Mou, C.; Huang, Z.; Ke, H.; Duan, Y.; Zhou, J.; Li, Q. Effects of different temperatures on Leiocassis longirostris gill structure and intestinal microbial composition. Sci. Rep. 2024, 14, 7150. [Google Scholar] [CrossRef] [PubMed]
  68. Tian, Y.; Li, G.; Chen, L.; Bu, X.; Shen, J.; Tao, Z.; Zeng, T.; Du, X.; Lu, L. High-temperature exposure alters the community structure and functional features of the intestinal microbiota in Shaoxing ducks (Anas platyrhynchos). Poult. Sci. 2020, 99, 2662–2674. [Google Scholar] [CrossRef] [PubMed]
  69. Zhao, H.; Ke, H.; Zhang, L.; Zhao, Z.; Lai, J.; Zhou, J.; Huang, Z.; Li, H.; Du, J.; Li, Q. Integrated analysis about the effects of heat stress on physiological responses and energy metabolism in Gymnocypris chilianensis. Sci. Total Environ. 2022, 806, 151252. [Google Scholar] [CrossRef] [PubMed]
  70. Janda, J.M.; Abbott Sharon, L. 16S rRNA Gene Sequencing for Bacterial Identification in the Diagnostic Laboratory: Pluses, Perils, and Pitfalls. J. Clin. Microbiol. 2007, 45, 2761–2764. [Google Scholar] [CrossRef] [PubMed]
  71. Johnson, J.S.; Spakowicz, D.J.; Hong, B.-Y.; Petersen, L.M.; Demkowicz, P.; Chen, L.; Leopold, S.R.; Hanson, B.M.; Agresta, H.O.; Gerstein, M.; et al. Evaluation of 16S rRNA gene sequencing for species and strain-level microbiome analysis. Nat. Commun. 2019, 10, 5029. [Google Scholar] [CrossRef] [PubMed]
Figure 1. Based on the species annotation and abundance statistics across all groups, the top 10 taxa by relative abundance are plotted at the phylum and genus levels for water-column (A,B) and fish intestines (C,D). D: the day post the start of the experiment; L: low-temperature (16 °C); H: high-temperature (30 °C).
Fishes 11 00436 g001
Figure 2. The changes of Shannon (A), Sob (B), Chao1 (C) and Simpson (D) indices over 20 days in the water-column. The values are expressed as boxplot by ggplot2 (n = 3). Significant differences were examined by Tukey-HSD test in R project Vegan package. Data marked with uppercase letters indicate multiple-comparison results among sampling days within the high-temperature group, whereas lowercase letters indicate multiple-comparison results among sampling days within the low-temperature group. Different letters indicate significant differences at p < 0.05.
Fishes 11 00436 g002
Figure 3. Principal co-ordinate analysis (PCoA) at the genus level showing bacterial community differences in the fish intestine (A,B) and water-column (C,D) under low-temperature (16 °C) and high-temperature (30 °C) conditions. Non-parametric multivariate analysis of variance (Adonis/PERMANOVA) was used to test the differences of microbial community composition. Homogeneity of multivariate dispersion was assessed using the betadisper function in the vegan package, followed by permutation testing with 9999 permutations, to evaluate whether PERMANOVA results were influenced by differences in within-group dispersion. Differences were considered statistically significant at p < 0.05.
Fishes 11 00436 g003
Figure 4. Source-associated microbial community patterns among mud, water-column, and fish intestine at Day 0. (A) The principal co-ordinate analysis (PCoA) with the weighted UniFrac distance at the genus level using Day 0 baseline samples from mud, water-column and fish intestine. Non-parametric multivariate analysis of variance (Adonis/PERMANOVA) was used to test the differences of microbial community composition. Homogeneity of multivariate dispersion was assessed using the betadisper function in the vegan package, followed by permutation testing with 9999 permutations, to evaluate whether PERMANOVA results were influenced by differences in within-group dispersion. Differences were considered statistically significant at p < 0.05. (B) LEfSe and indicator value analyses identified microbial biomarkers in Day 0 mud (Mud), water-column (WcD0), and fish intestine (IntD0), respectively (LDA score > 4.0 and p < 0.05).
Fishes 11 00436 g004
Figure 5. (A) A plot of canonical correspondence analysis (CCA) of microbiota from water-column related environmental factors (TP, TN, NH4-N, and NO2-N) to taxonomic composition of the samples (Mantel test r  =  0.767 and p  =  0.001). Circles represent water-column samples under high-temperature (30 °C) over 20 days; triangles represent water-column samples under low-temperature (16 °C) over 20 days; squares indicate the water-column before the start of the experiment (D0). Each arrow line represents the environmental factors. The length of each arrow line represents the degree of correlation between each factor and the microbiota. An acute angle between the two arrow lines indicates a positive correlation. Conversely, an obtuse angle indicates a negative correlation. Axes 1 and 2 contributed 88.55% of the total variation, with 68.39% for CCA1 and 20.16% for CCA2. (B) Spearman correlation analysis between environmental factors and water-column microorganisms at genus level. The color gradient represents the correlation coefficient. 1: Vibrionimonas; 2: Mesorhizobium; 3: Burkholderia-Caballeronia-Paraburkholderia; 4: Bradyrhizobium; 5: Cetobacterium; 6: Limnohabitans; 7: Sulfuritalea; 8: Flavobacterium; 9: Novosphingobium; 10: Methylotenera. D: the day post the start of the experiment; L: low-temperature (16 °C); H: high-temperature (30 °C). Differences were considered statistically significant at * p < 0.05, ** p < 0.01, or *** p < 0.001.
Fishes 11 00436 g005
Figure 6. The differences in metabolic pathways by PICRUSt functional analysis. Related KEGG pathways are plotted at KEGG level 2 of microbial communities in fish intestinal tract between low-temperature (16 °C) and high-temperature (30 °C). Abundances of KEGG pathways in different groups are normalized to those before the start of the experiment (D0). The color gradient represents the abundances of KEGG pathways.
Fishes 11 00436 g006
Figure 7. Prediction of microbiota BugBase phenotype in water-column between low-temperature (16 °C) and high-temperature (30 °C). The values are expressed as boxplot by ggplot2 (n = 3). Significant differences were examined by Tukey-HSD test in R project Vegan package. The grey shading serves only as a visual divider and carries no substantive meaning. Data marked with different letters indicate significant differences among groups at p < 0.05.
Fishes 11 00436 g007
Disclaimer/Publisher’s Note: The statements, opinions and data contained in all publications are solely those of the individual author(s) and contributor(s) and not of MDPI and/or the editor(s). MDPI and/or the editor(s) disclaim responsibility for any injury to people or property resulting from any ideas, methods, instructions or products referred to in the content.