Article

Non-Equilibrium Recovery of Plankton Communities in the Yangtze River Estuary: Three Years After the Fishing Ban


1
East China Sea Ecology Center, Key Laboratory of Marine Ecological Monitoring and Restoration Technologies, Ministry of Natural Resources, Shanghai 201206, China
2
Lingang Campus, Shanghai Ocean University, Shanghai 201306, China
3
Ningde Marine Center, Ministry of Natural Resources, Ningde 352000, China
4
China Three Gorges Investment Management Co., Ltd., Shanghai 200125, China
*
Authors to whom correspondence should be addressed.
These authors contributed equally to this work.
Fishes 2026, 11(7), 417; https://doi.org/10.3390/fishes11070417
Submission received: 30 May 2026 / Revised: 8 July 2026 / Accepted: 12 July 2026 / Published: 16 July 2026
(This article belongs to the Special Issue Sustainable Fisheries Dynamics)

Abstract

Large-scale fishing bans are increasingly implemented to restore aquatic ecosystems, yet their effects on lower trophic levels remain poorly understood. As one of the world’s largest estuarine systems, the Yangtze River Estuary has been subjected to a ten-year fishing ban since 2021, providing a unique opportunity to potentially examine the response of plankton community to reduced fishing pressure along a steep salinity–nutrient gradient. This study relies on one-off environmental and plankton field surveys conducted in autumn 2024 (a sampling instead of multi-year time-series monitoring), we applied redundancy analysis, Mantel tests, and threshold indicator taxa analysis to tentatively clarify the roles of nutrients and salinity in structuring post-ban plankton communities. Species richness may have increased substantially compared with pre-ban levels, but community evenness declined and the dominance of Skeletonema costatum could have intensified, revealing a possible non-equilibrium recovery pattern. Zooplankton density increased substantially, which may not be fully consistent with the expectation under a simple top-down release scenario. Threshold analysis showed that S. costatum exhibited bidirectional responses to dissolved inorganic nitrogen and phosphate, with its positive response thresholds matching ambient nutrient concentrations in the inner estuary; this discrepancy is only a plausible inference since we lack direct measurements of fish predation and zooplankton grazing rates to verify causal trophic interactions. Our findings suggest that bottom-up forces driven by persistent eutrophication remain the dominant control on plankton community structure three years after the ban. From a watershed management perspective, our observational results provide a tentative implication that substantial reductions in nutrient loading might be required to mitigate unbalanced plankton community recovery; otherwise, the structural integrity of plankton assemblages could lag far behind the recovery of species richness under the current eutrophic background.
Key Contribution: This study suggests a non-equilibrium recovery pattern in the Yangtze River Estuary three years after the fishing ban, characterized by rapid species richness recovery but persistent structural imbalance likely driven by sustained nutrient loading. These observations are not fully consistent with expectations under top-down release, and instead point to bottom-up forces as the dominant driver of plankton community dynamics at this early stage of recovery.

1. Introduction

The Yangtze River Estuary lies at the confluence of the Yellow Sea and the East China Sea, influenced by the northward flow of the Taiwan Warm Current, the southward movement of the Yellow Sea Coastal Current, and the mixed waters of the two seas to the east. This convergence creates a complex physical oceanographic environment [1] characterized by a steep salinity front east of 122°10′ E that spans only 1–5 km in width [2] and a turbidity maximum zone where suspended particulates accumulate and filter nutrients [3]. The resulting environmental gradient—sharp changes in salinity, nutrients, and transparency across a narrow spatial range—directly shapes plankton community structure [4,5]. Decades of rapid economic development, however, have imposed intense anthropogenic pressure on this system, driving biodiversity decline. To reverse this trend, in 2021, the Chinese government implemented a ten-year fishing ban across the entire Yangtze River basin, including the estuary [6].
The ecological effects of the fishing ban extend beyond the direct recovery of fish stocks, propagating through trophic levels to influence lower-trophic-level organisms. Under normal conditions, pre-ban anthropogenic fishing suppressed large predator populations, thereby weakening their predation control over intermediate trophic levels such as zooplankton. Following the ban, the removal of fishing pressure allows predator populations to gradually recover, leading to the re-establishment of food-web regulatory mechanisms. Previous studies have shown that the aquatic food web of the Yangtze River Estuary is structurally complex, consisting primarily of grazing and detrital food chains [7], and that trophic relationships among dominant shrimp species have already exhibited spatial differentiation during the early post-ban period, indicating ongoing adjustments in food-web structure [8]. The recovery of predator populations will therefore directly affect plankton communities. As major primary producers, plankton are inevitably influenced in their species composition and community structure by climate-driven physical and chemical environmental changes [9,10]. However, the Yangtze River Estuary presents a complicating factor: the same environmental gradient that structures plankton communities also creates a strong nutrient regime, with phosphorus as a potentially limiting factor [1], that may override food-web effects. This tension between bottom-up forces and top-down forces forms a core unresolved ecological question in the early phase of estuarine ecosystem recovery, and it remains unclear which force may dominate the assembly of plankton communities. Beyond the relative strength of top-down and bottom-up regulation, another critical knowledge gap exists: it is still unknown whether the planktonic system will return to its pre-disturbance equilibrium state or shift toward an alternative stable state after fishing cessation. Based on this conflicting ecological context, we put forward two mutually exclusive testable a priori hypotheses and corresponding predicted ecological responses for this study. Hypothesis 1 (bottom-up control dominance): Spatial variation in phosphorus-limited nutrients along the salinity gradient acts as the primary driver of plankton biomass and community composition, while the cascading effects induced by predator recovery exert minor influences, leading to weak correlations between plankton assemblages and the spatial distribution of predatory fish. Hypothesis 2 (top-down control dominance): Population recovery of large predatory fish generates stronger regulatory impacts than nutrient gradients; elevated grazing pressure on zooplankton will trigger cascading shifts in phytoplankton, and the spatial variation in plankton communities will be tightly coupled with the recovery pattern of top predators rather than nutrient conditions. Two distinct recovery trajectories are hypothesized under the above hypotheses: an equilibrium recovery trajectory, where plankton community composition converges to historical pre-ban baseline configurations with consistent nutrient-plankton and predator-plankton correlations; and an alternative non-equilibrium trajectory, where plankton assemblages deviate from historical states under the combined constraints of persistent nutrient gradients and post-ban predator restoration.
Autumn represents a strategic window for such an assessment. This season is a critical nursery period for many commercial fish, during which plankton abundance and composition directly determine juvenile survival [11]. River discharge declines, hydrodynamic disturbance moderates, and the environmental gradient becomes particularly pronounced. Plankton communities during this season are less affected by extreme hydrological events and seasonal climatic fluctuations than in summer [11], allowing a clearer signal of post-ban change to potentially emerge. Moreover, three years after the ban, fish stocks have already shown significant signs of recovery [6]; however, the responses of plankton, the foundation of the estuarine food web, remain poorly quantified.
In this study, environmental and plankton survey data in autumn 2024 are integrated to characterize post-ban community structure along the salinity gradient. Two questions are addressed: whether the observed changes are governed primarily by bottom-up effects (nutrient regime) or top-down effects (predator release), and whether the observed community patterns in this autumn are more consistent with an equilibrium-oriented restoration pathway or with a non-equilibrium, alternative-state trajectory.

2. Materials and Methods

2.1. Study Area

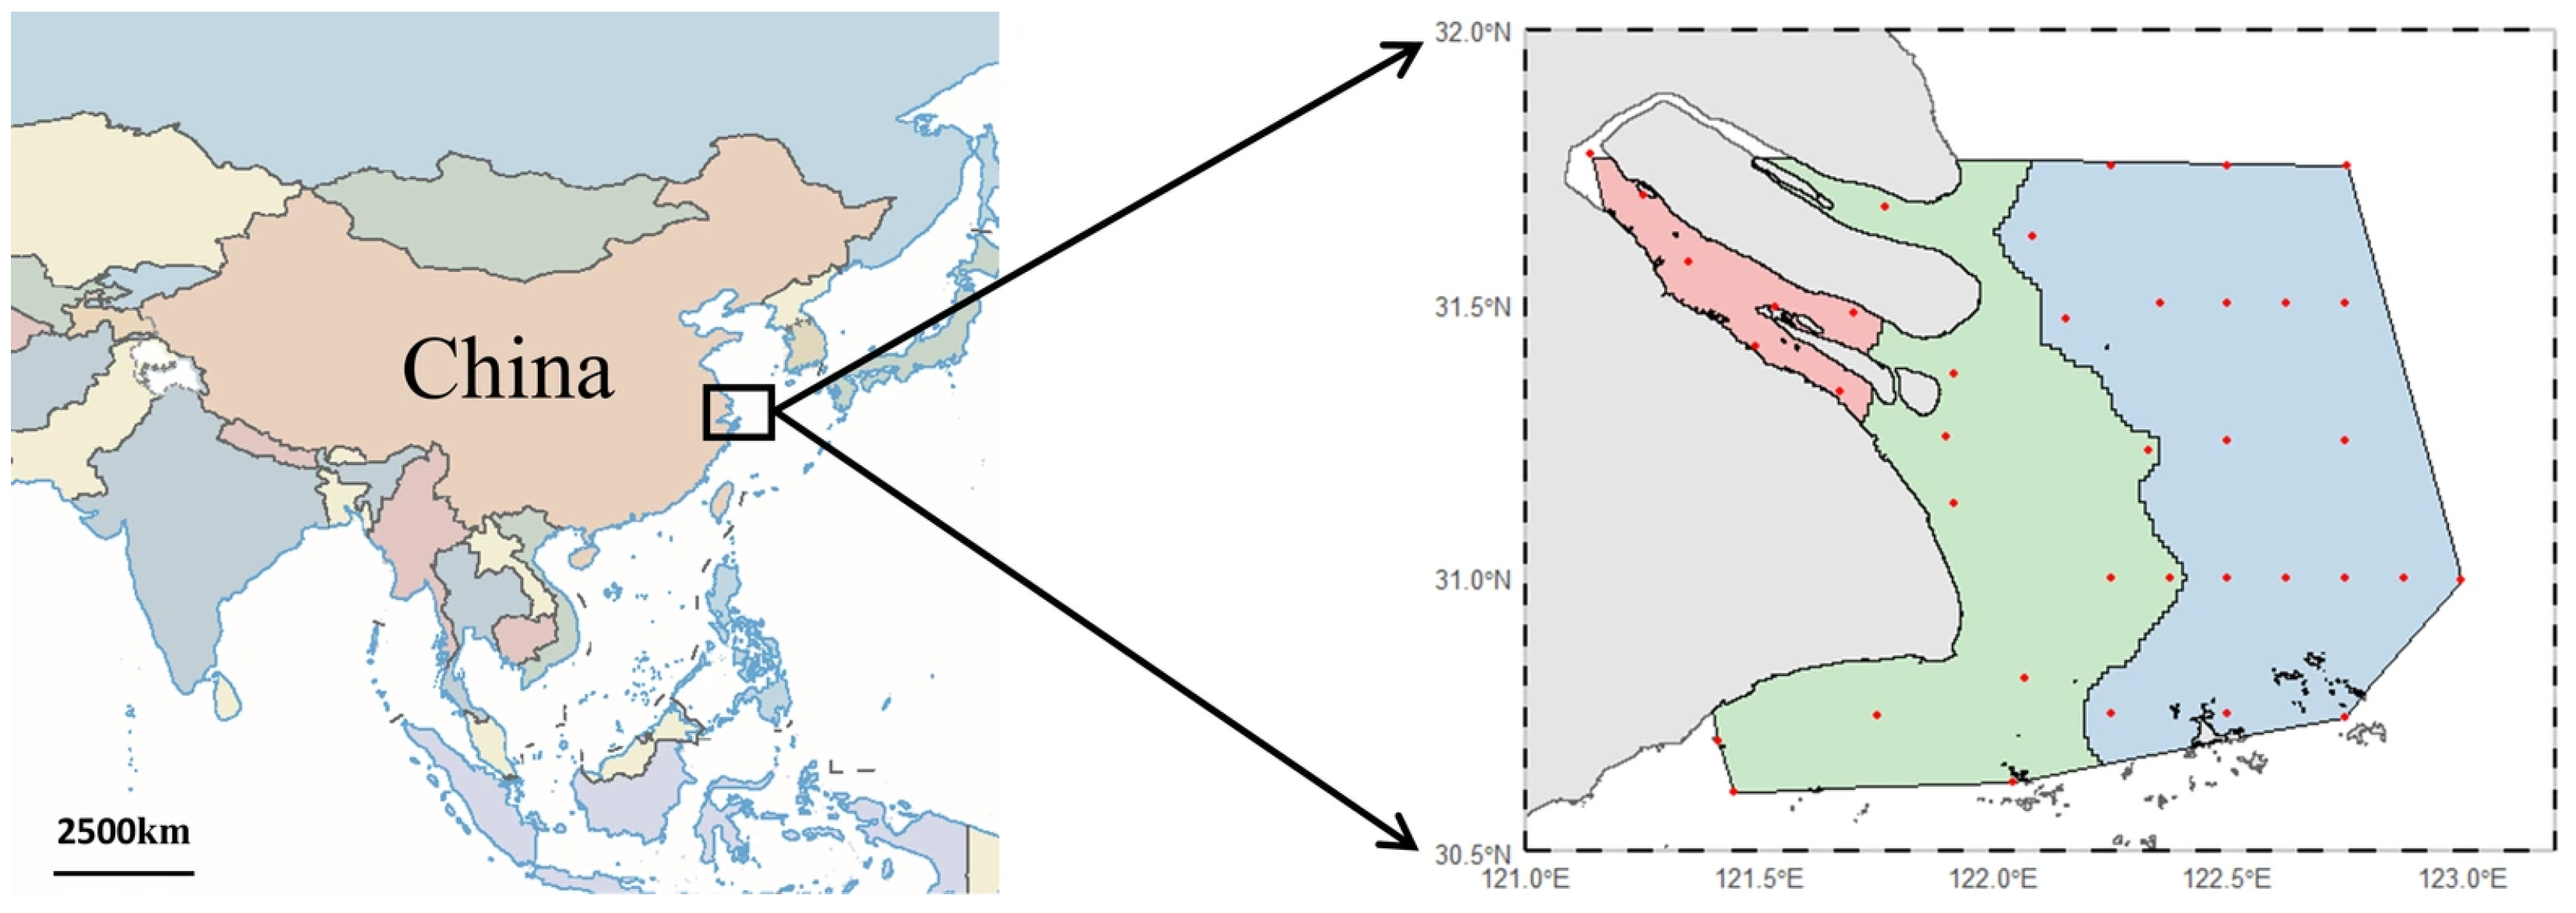
The study area covers the Yangtze River Estuary (30°50′–31°80′ N, 121°05′–123°08′ E). Sampling stations (Figure 1) were classified into three zones based on historical salinity criteria [12,13,14,15]: inner estuary (≤5%), estuarine zone (5–25%), and offshore zone (≥25%).

2.2. Data Collection

2.2.1. Environmental Data

Environmental and plankton data were collected in autumn (September–October) 2024 following national standards [16]. Environmental parameters included water temperature, dissolved oxygen (DO), chemical oxygen demand (COD), chlorophyll a (Chla), salinity, pH, suspended solids (SS), phosphate (PO4-P), silicate (SiO3-Si), and dissolved inorganic nitrogen (DIN). The sampling stations were approximately uniformly distributed across water depths ranging from 5 m to 48 m. At each station, water samples were collected using Niskin bottles mounted on the CTD rosette frame, at the surface (0.5 m depth) and near the bottom (approximately 1–2 m above the seabed). All samples were stored at 4 °C until analysis. Temperature, salinity, pH, and dissolved oxygen (DO) were measured in situ using a Sea-Bird SBE 25 CTD profiler (Sea-Bird Electronics, Inc., Bellevue, WA, USA); all other variables were determined following standard analytical methods. Quality assurance/quality control (QA/QC) procedures included field blanks, transport blanks, and replicate analyses at a frequency of approximately 10%.

2.2.2. Plankton Data

For phytoplankton samples, vertical tows from bottom to surface were performed using a 77 μm mesh plankton net. Meanwhile, 500 mL water samples were collected separately from the surface and bottom layers at each sampling station. All phytoplankton samples were fixed in situ with 1% Lugol’s solution and stored at room temperature after fixation. Species identification was conducted via the Utermöhl method [17] to the lowest possible taxonomic level. Notably, the surface and bottom water samples were only used to supplement phytoplankton species richness records, while all quantitative analyses of phytoplankton community composition and abundance were exclusively based on the net tow samples to ensure data consistency and accuracy. For zooplankton sampling, a plankton net with a mouth area of 0.5 m2 and a mesh size of 505 μm was applied for sample collection. Zooplankton specimens were preserved with 5% buffered formalin and enumerated and identified under a stereomicroscope in the laboratory. For macrobenthos, two parallel grab samples were collected at each station. The samples were sieved through a 0.5 mm mesh screen and fixed with 7% buffered formalin. All macrobenthos specimens were identified to the species level as far as possible. All fixed biological samples were preserved at room temperature until laboratory analysis. At stations with depth < 10 m, only surface samples were collected; at stations ≥ 10 m, both surface and bottom samples were taken.

2.3. Statistical Analyses

Principal component analysis (PCA) was performed on environmental variables to identify the major gradients [18]. Four biodiversity indices were calculated: Margalef richness (D) [19], Shannon–Wiener diversity (H′) [20], Pielou evenness (J) [21], and dominance (Y) [22]. In this study, species with Y > 0.02 were classified as dominant. Redundancy analysis (RDA) was selected for subsequent ordination after detrended correspondence analysis (DCA) yielded a maximum gradient length of <3. Prior to analysis, response and explanatory variables, except pH, were log(X + 1)-transformed. Mantel tests [23,24,25] were used to assess correlations between plankton community dissimilarity (Bray–Curtis) and environmental distance matrices (Euclidean), with significance evaluated via 999 permutations. The Mantel test was adopted for the following two core reasons: (1) Our diversity indices and environmental variables were both multivariate datasets derived from multi-station estuarine surveys. Mantel test compares the overall similarity matrix of community diversity metrics with the distance matrix of environmental variables, which can reflect the overall matching degree between spatial diversity patterns and environmental gradients, rather than merely one-to-one linear correlation between single indicators as Spearman correlation does. (2) Estuarine environmental factors feature strong collinearity, and ordinary regression models are susceptible to multicollinearity interference. Mantel test avoids the bias caused by independent variable collinearity when evaluating the integral correlation between two matrix groups, which is more suitable for our dataset structure. For multiple testing correction, we adopted the standard Bonferroni correction method.
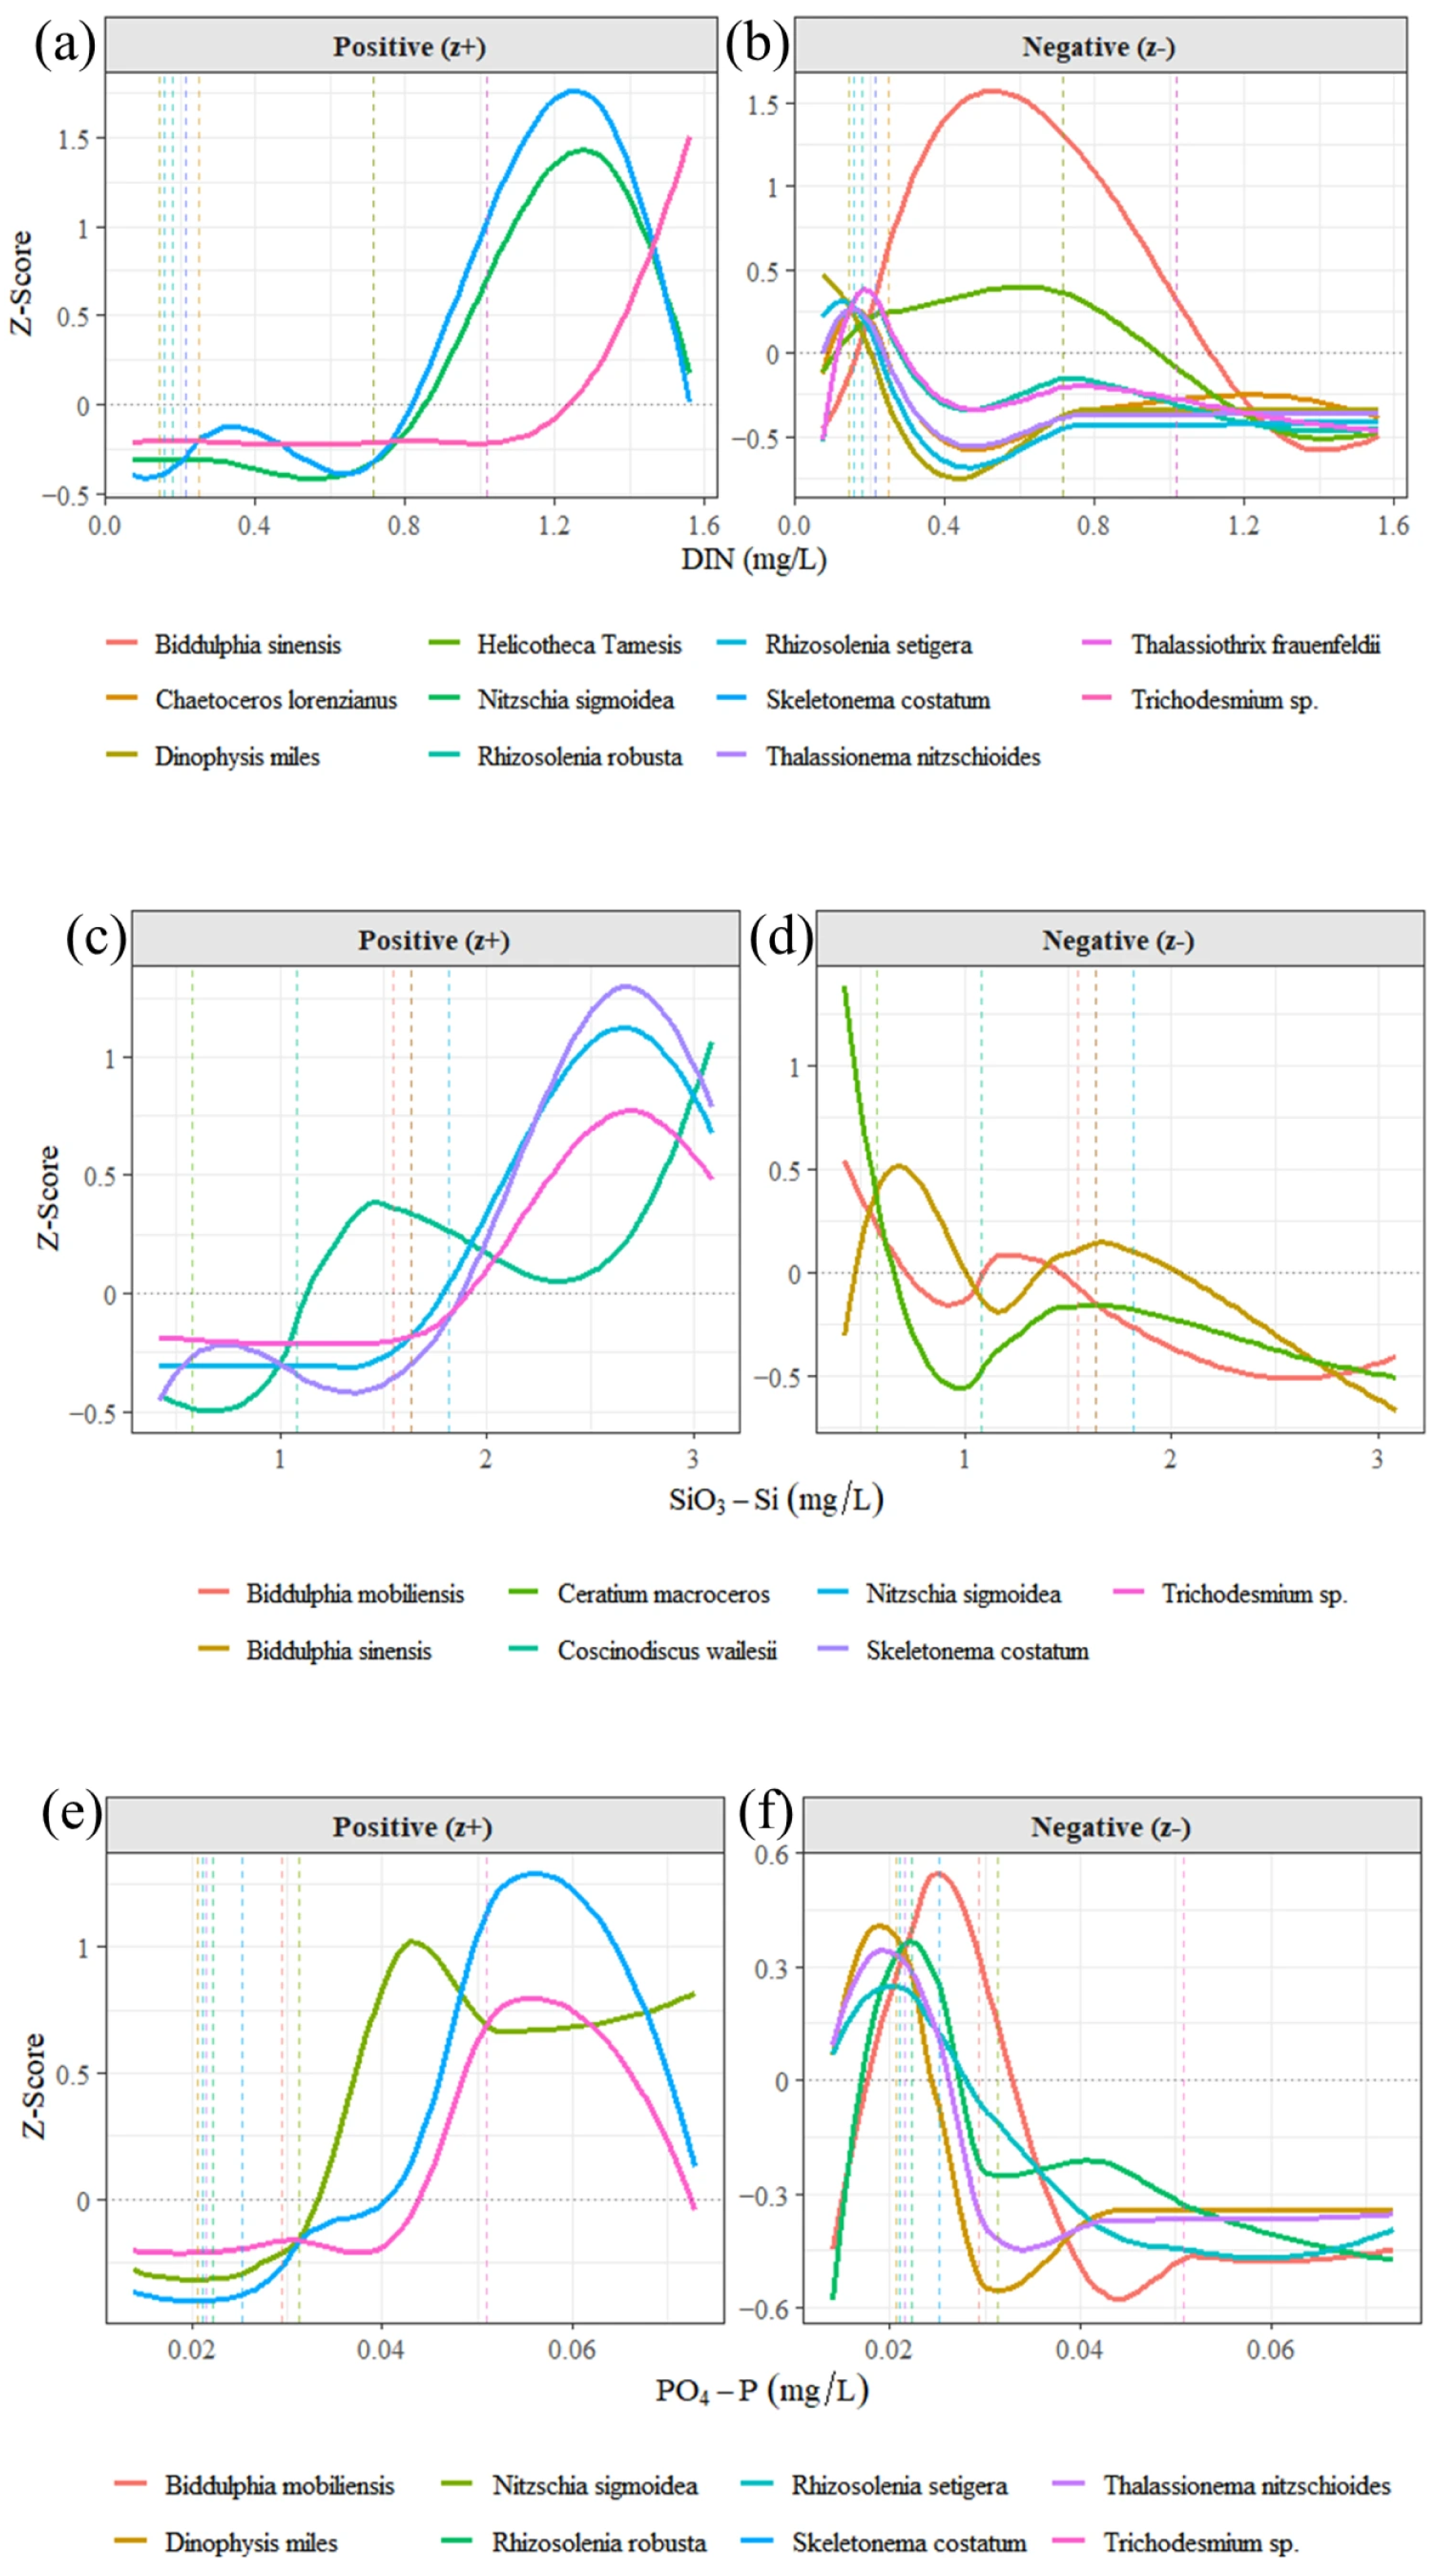
Threshold indicator taxa analysis (TITAN) [26] was applied to identify community-level thresholds for DIN, PO4-P, and SiO3-Si. To reduce the influence of rare species, only taxa with an occurrence frequency of ≥5 were retained. The threshold of ≥5 occurrences was chosen for three reasons: (1) to reduce interference from low-frequency accidental species with fewer than 5 occurrence sites and eliminate bias induced by unstable species response patterns; (2) to guarantee the ecological representativeness of indicator taxa and capture community-wide responses to environmental gradients; and (3) to comply with widely accepted analytical standards for TITAN [27]. The total number of sampling stations in this study meets the sample size requirements for reliable TITAN threshold estimation. Previous methodological benchmarks suggest that datasets with more than 30 independent sampling sites can yield stable, reproducible nutrient breakpoints with low uncertainty during permutation testing [26,27]. Prior to all multivariate analyses (PCA, RDA and Mantel tests), multicollinearity among environmental variables was quantified via the variance inflation factor (VIF). Variables with VIF > 10 were sequentially removed to eliminate severe collinearity.

2.4. Source of Historical Data

To quantitatively compare the differences in the autumn plankton community in the Yangtze River estuary before and after the fishing ban, this study integrated published historical literature as pre-ban baseline data, combined with field survey data collected in the autumn of 2024 as post-ban observations for cross-period comparisons. The historical datasets comprised, for phytoplankton, independent transect surveys during 2004–2006 [28,29,30] and a long-term time-series from 2009 to 2021 [31]; for zooplankton, corresponding data included independent surveys during 2005–2007 [30,32,33] and the identical 2009–2021 time-series [31]. All historical and contemporary data were collected under consistent autumn sampling schedules and similar station layouts and were analyzed using a common set of community indicators: species richness, average density, Margalef richness index (D), Shannon–Wiener diversity index (H′), Pielou evenness index (J), and dominant species identification. Missing values in the original literature were denoted by “/”. By applying uniform calculation protocols for all indices, we minimized methodological biases and enabled a robust horizontal comparison of community structures across the pre-ban, early-ban, and post-ban periods. Although all historical literature surveys and field measurements conducted after the 2024 fishing moratorium were uniformly carried out in autumn and covered the core stations across the full salinity gradient of the Yangtze River Estuary, there remains an inherent heterogeneity in sampling protocols among multiple sets of historical data. For this reason, this study primarily draws on its own sampling results and conducts appropriate inferences with reference to trends observed in historical data.

2.5. Data Processing

All analyses were performed in R 4.5.2 using the packages vegan, factoextra, dplyr, TITAN2, linkET, and ggplot2 [34,35,36,37,38,39]. Spatial maps were generated with Ocean Data View [40].

3. Results

3.1. Spatial Distribution of Environmental Factors

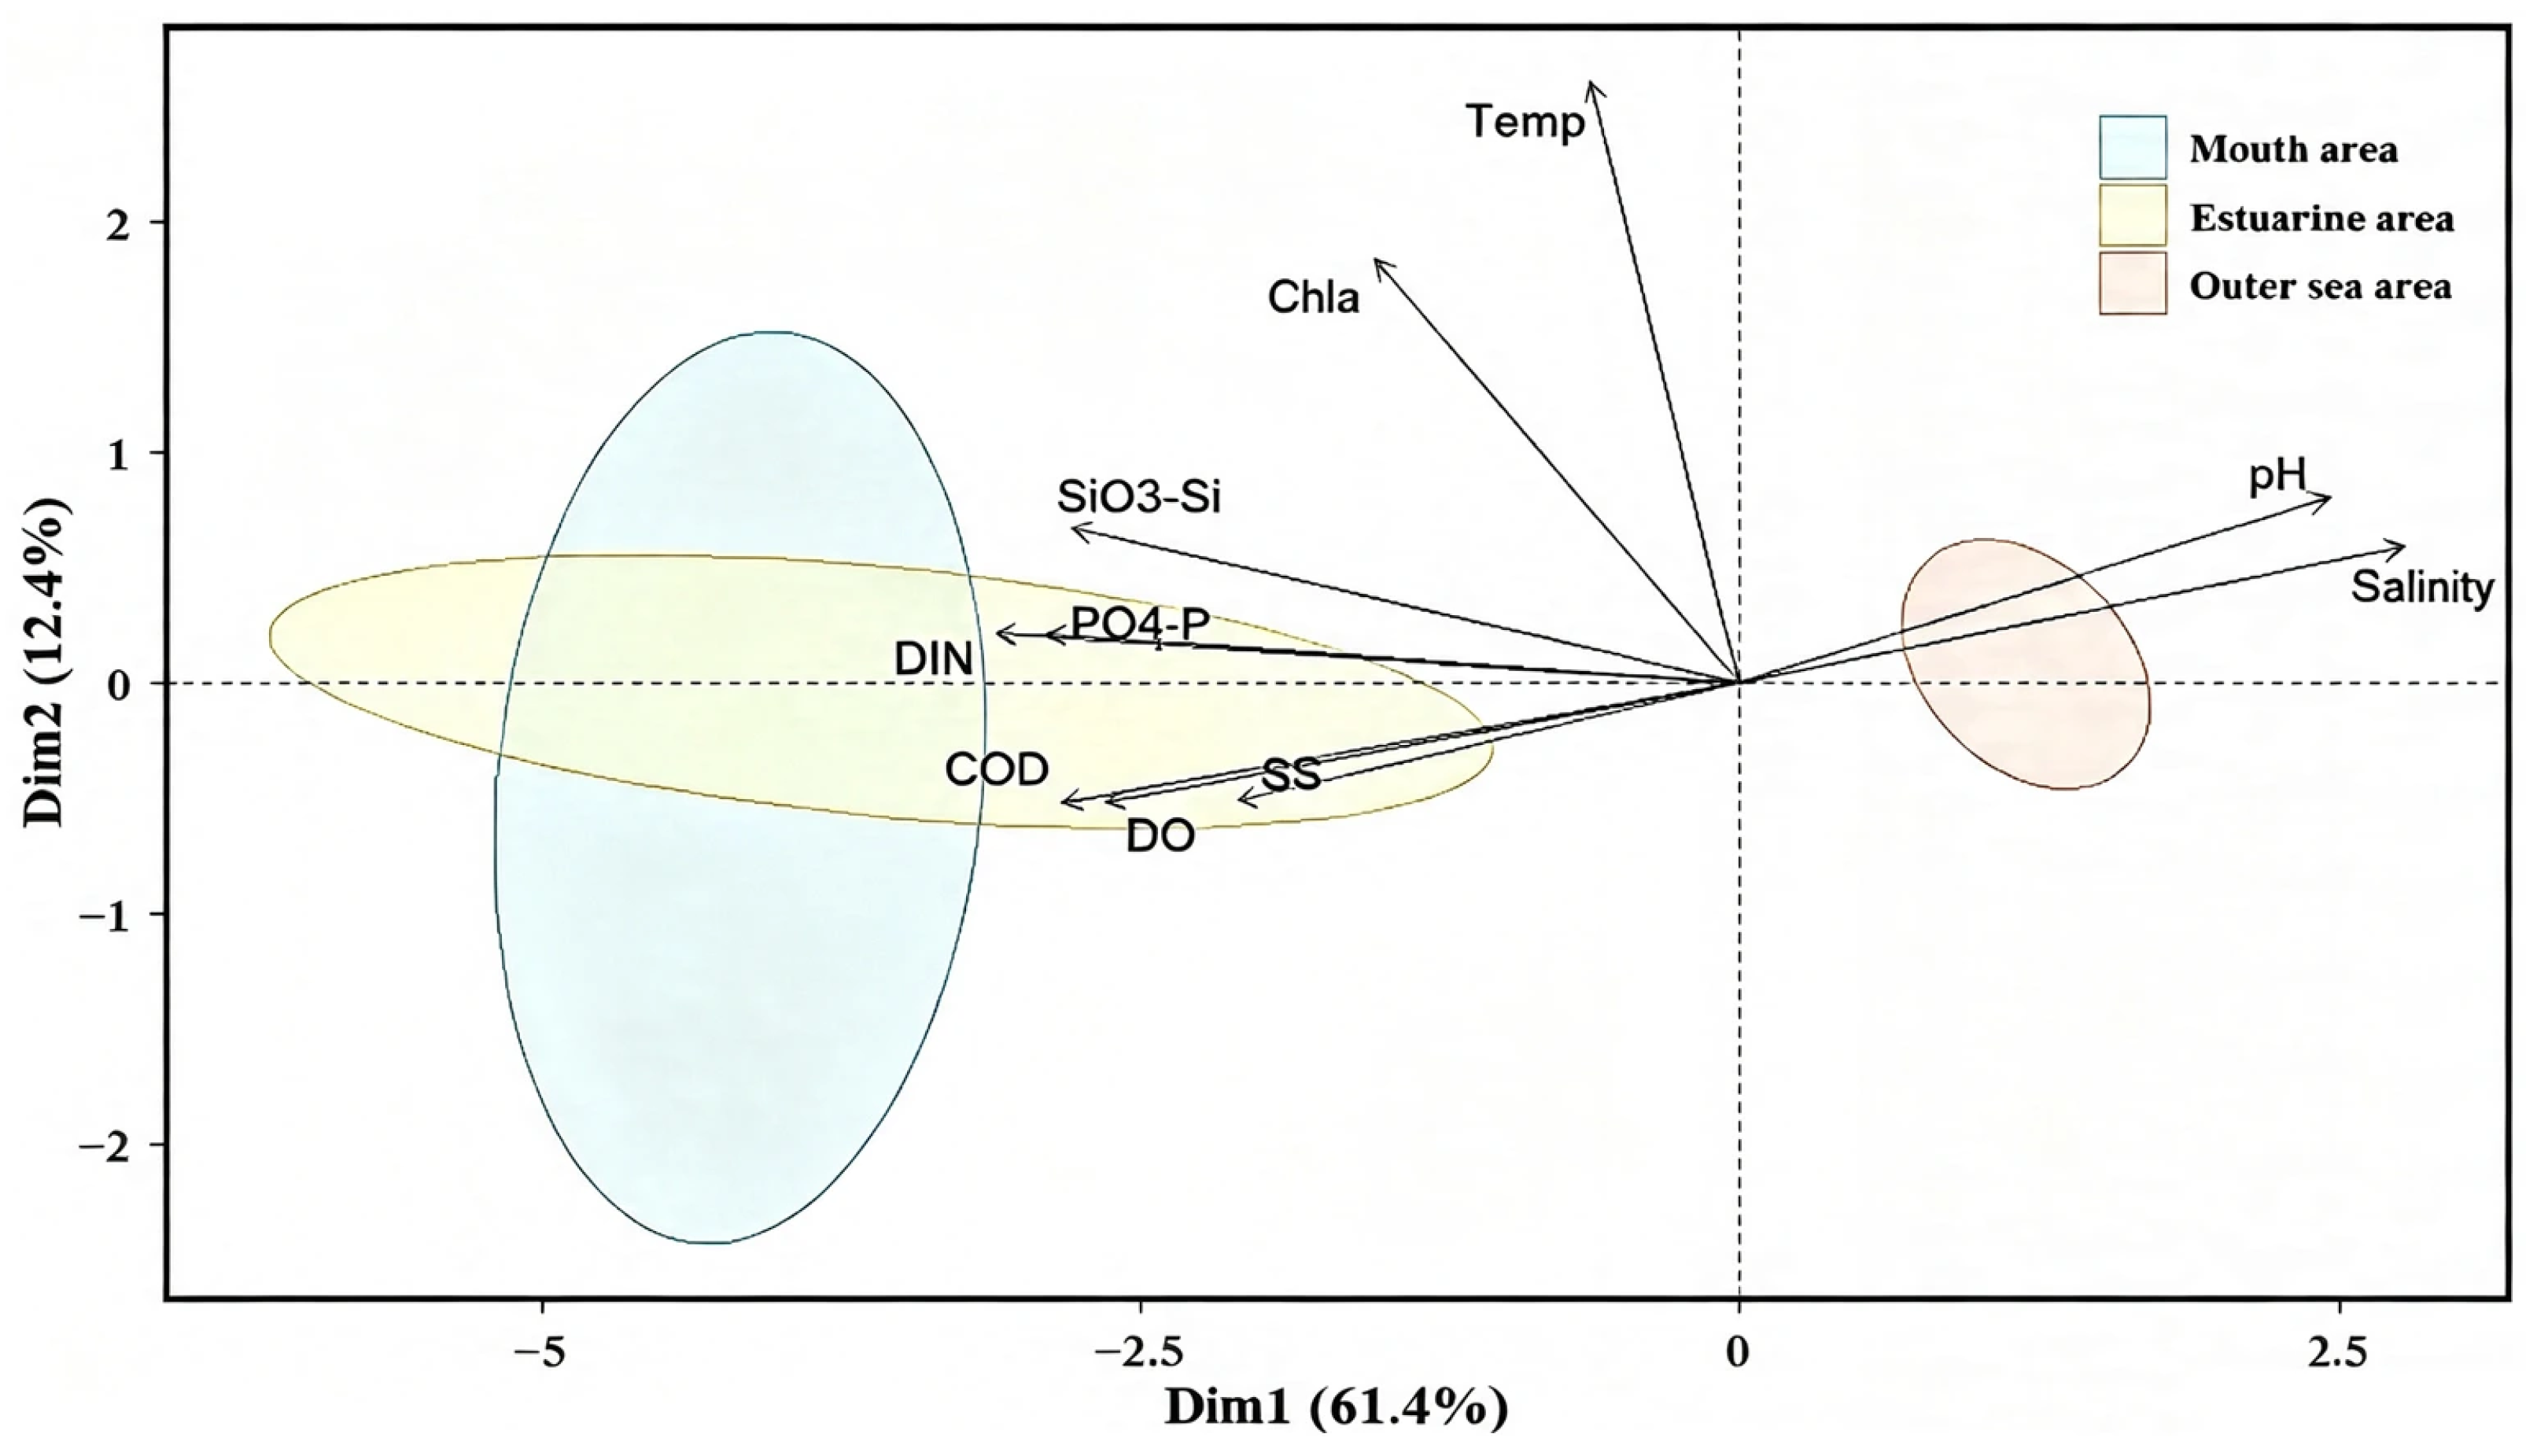
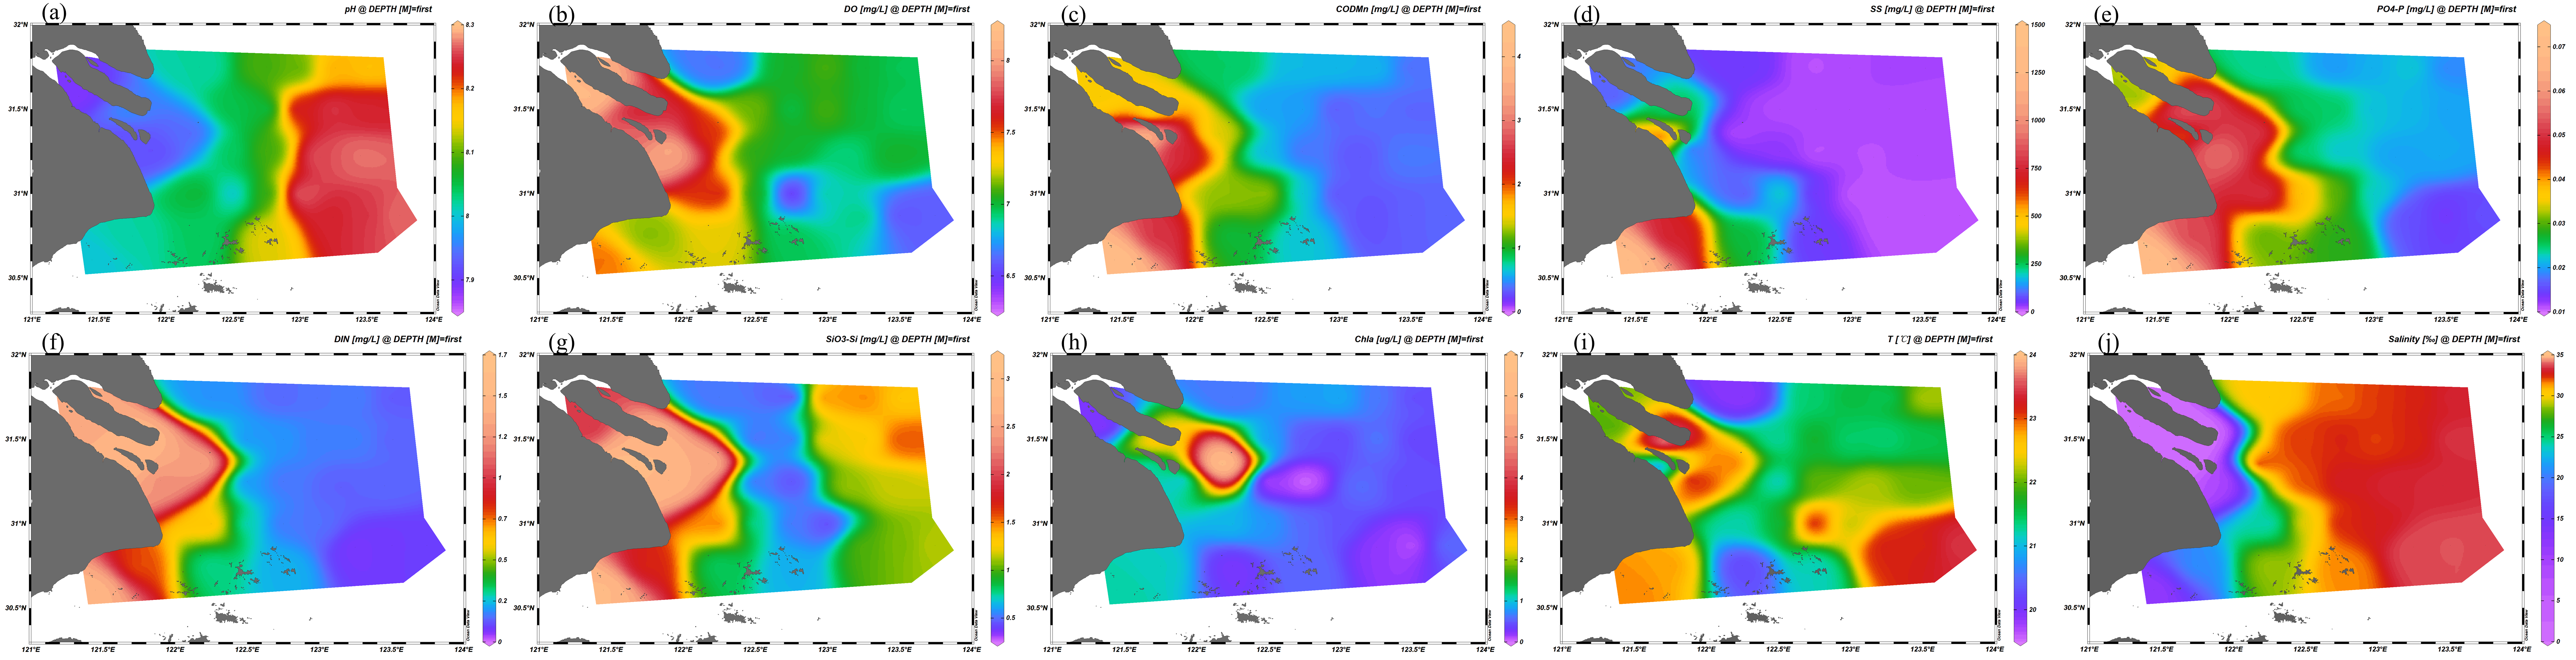
As illustrated in Figure 2, PCA revealed a dominant environmental gradient (Dim1, 61.4% of variance) separating the inner estuary (low salinity, high nutrients and suspended solids) from the offshore zone (high salinity, low nutrients). The estuarine zone occupied an intermediate position, with Dim2 explaining an additional 12.4% of the variance. Individual parameter distributions reflected this pattern: pH and salinity increased seaward, while DO, SS, COD, PO4-P, SiO3-Si, and DIN decreased. Chla and water temperature peaked in the estuarine zone (Figure 3).

3.2. Spatial Distribution of Plankton Community Composition

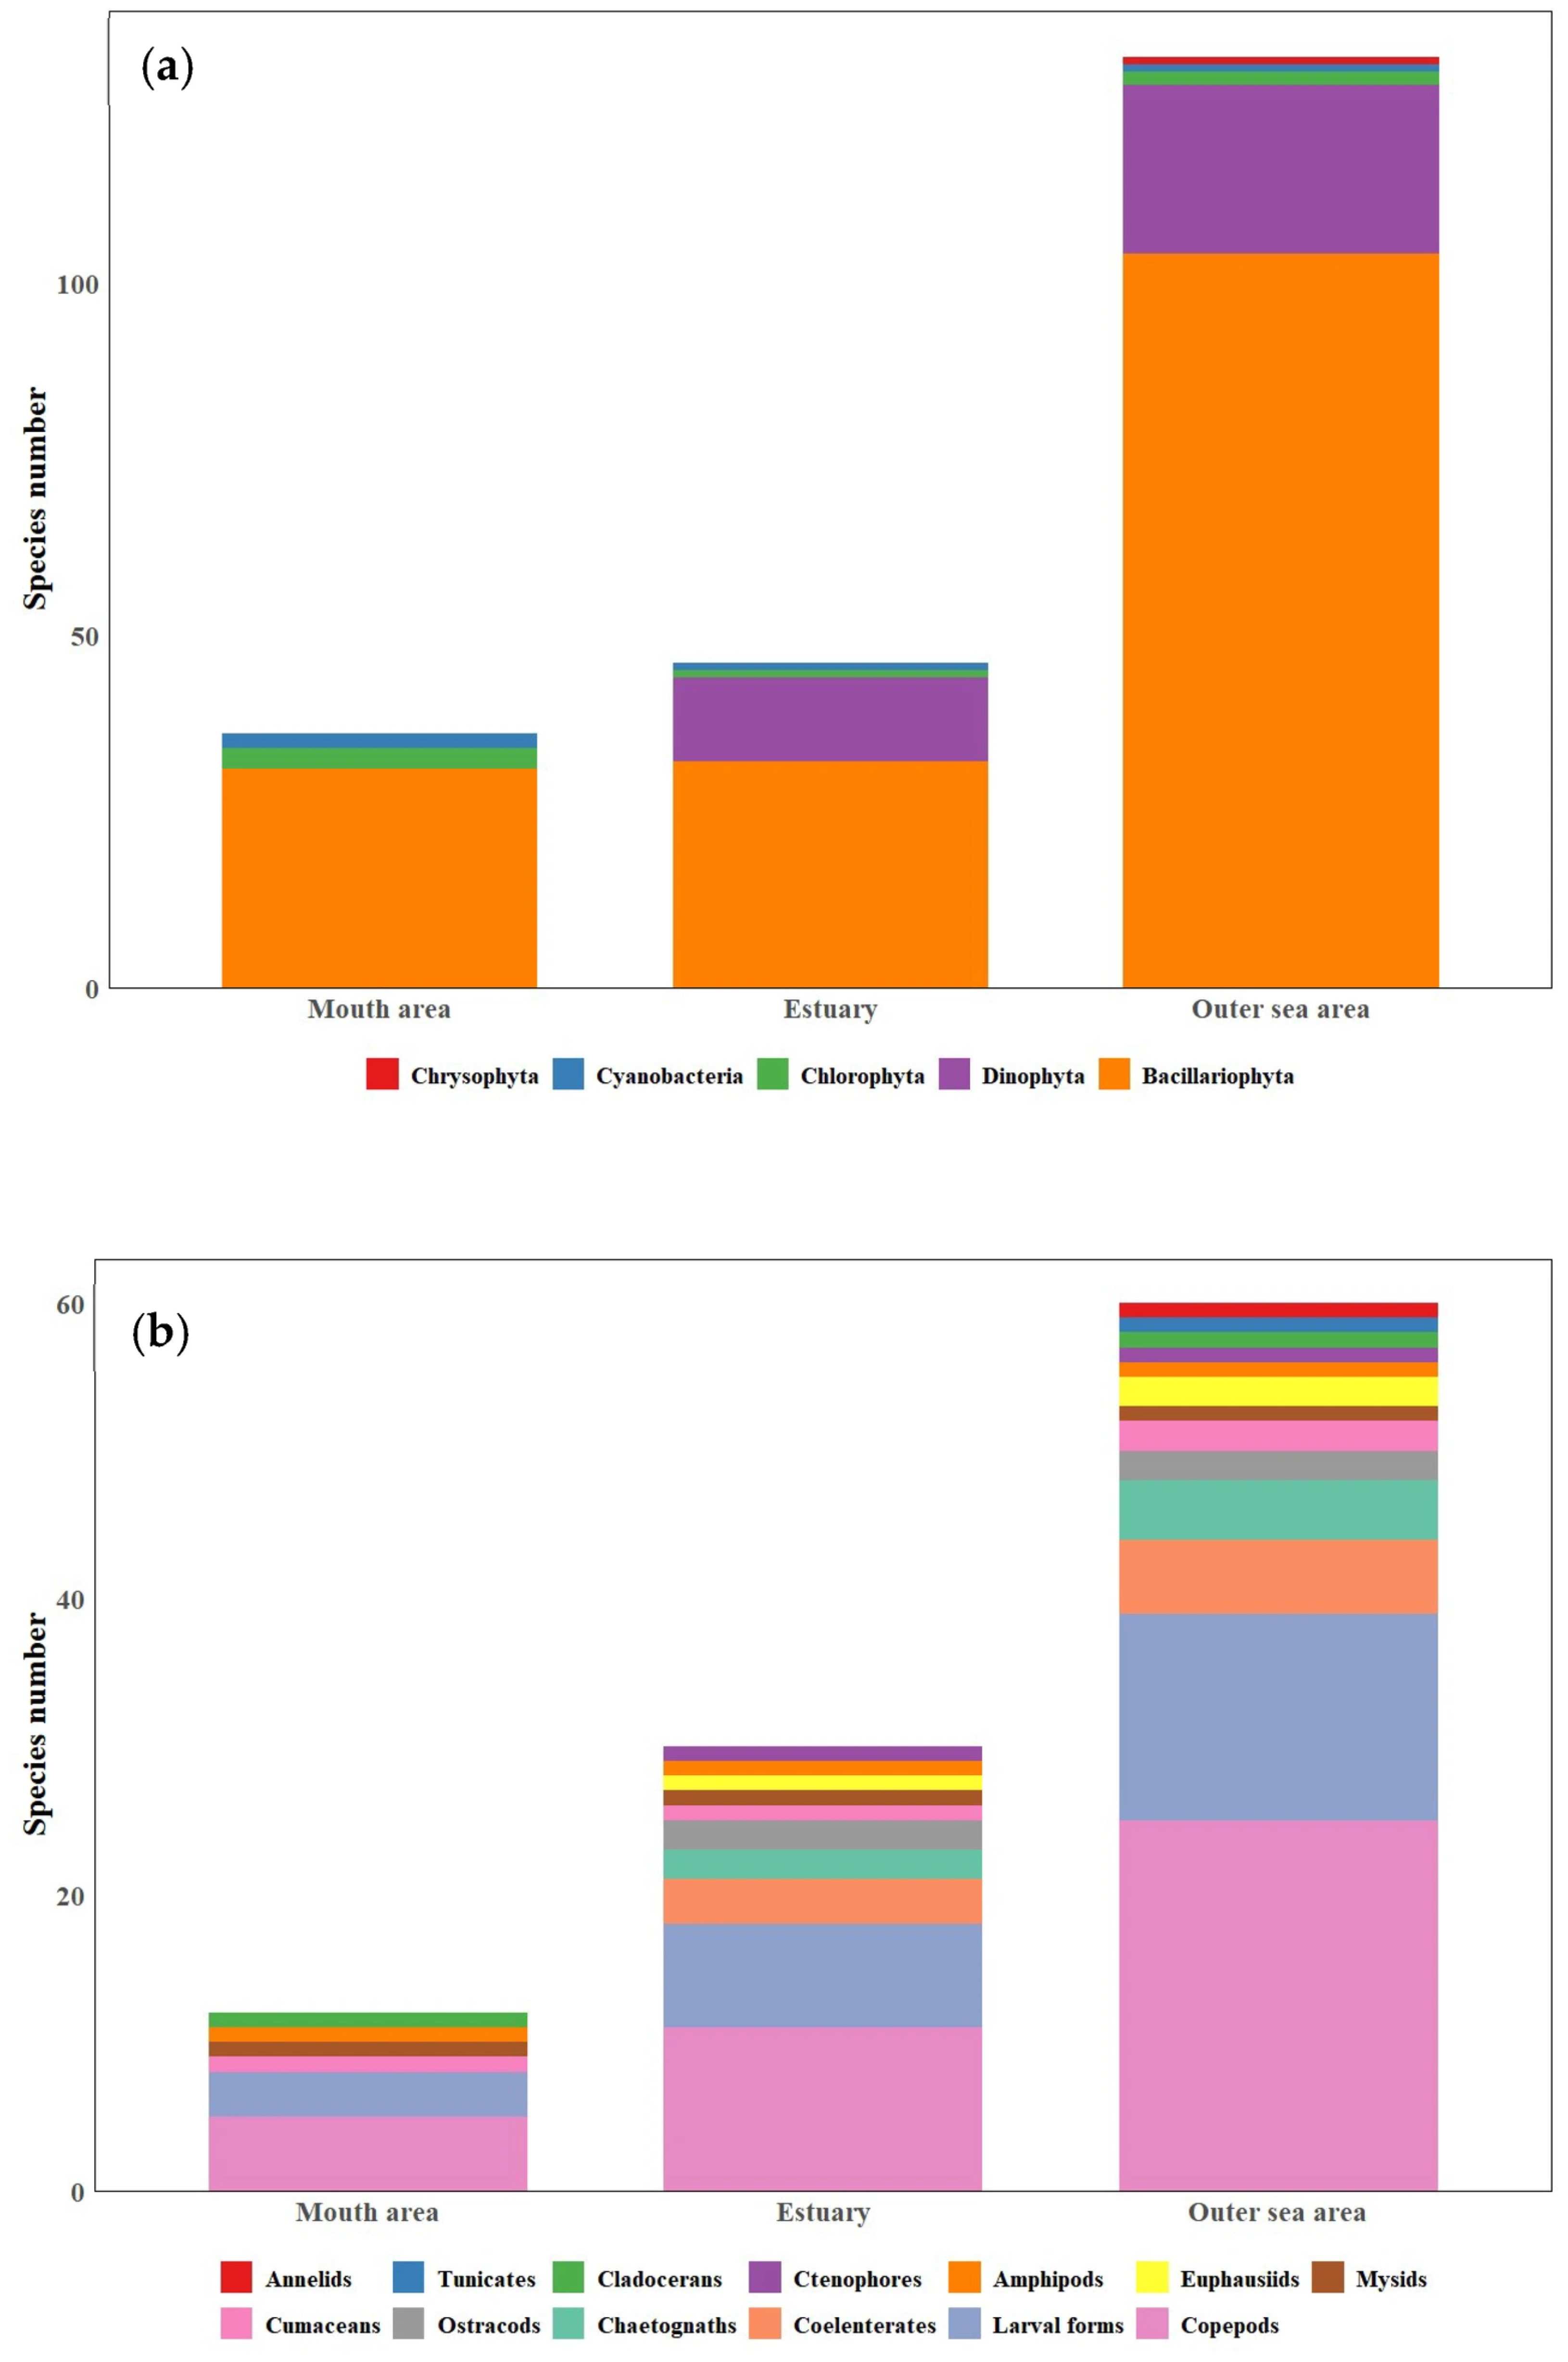
Species richness increased progressively from the inner estuary to the offshore zone for both phytoplankton and zooplankton (Figure 4). Diatoms (Bacillariophyta) dominated all zones, rising from 31 species (inner estuary) to 104 (offshore). Dinoflagellates appeared in the estuarine (12 species) and offshore zones (24 species). The number of species of chlorophytes and cyanobacteria declined seaward. Among zooplankton, copepods were the most species-rich group (5 to 25 species across zones). Larval forms peaked in the estuarine zone, while chaetognaths, euphausiids, ostracods, and other taxa were restricted to offshore waters.

3.3. Plankton Community Responses to Environmental Factors

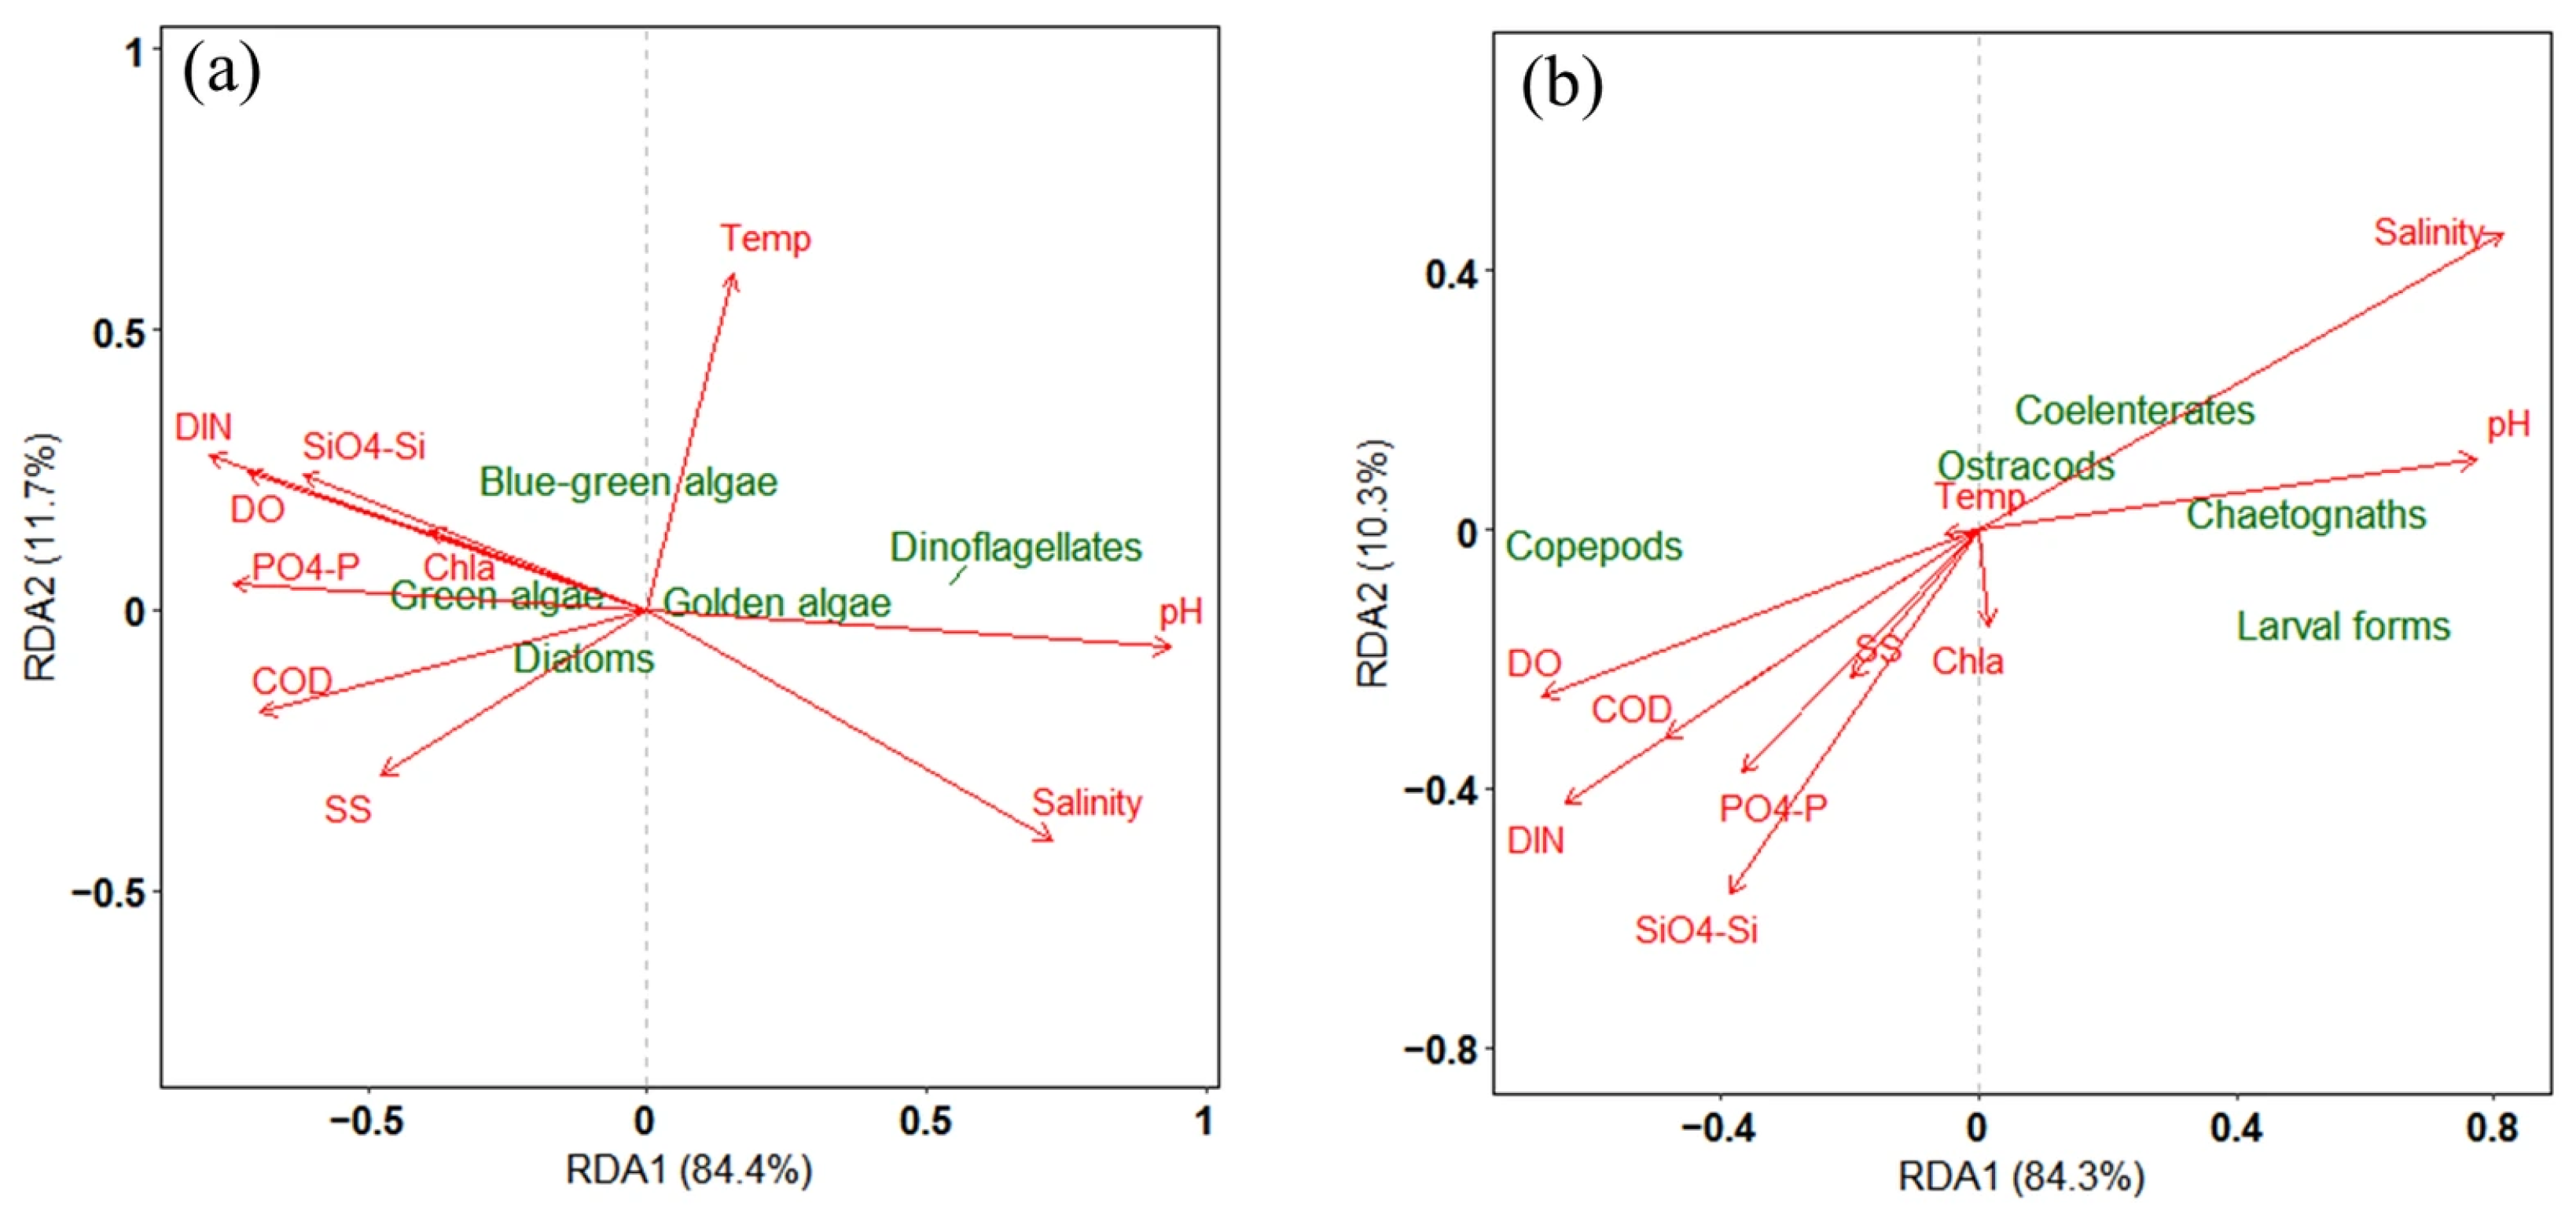
RDA showed that the salinity–nutrient gradient explained 84.4% (Axis 1) of phytoplankton community variance and 84.3% (Axis 1) of zooplankton variance (Figure 5). Specifically, in the phytoplankton RDA (Figure 5a), RDA1 explained 84.4% of the variance constrained by the full set of environmental predictors, and RDA2 explained an additional 11.7% of the constrained variance; together, the two axes accounted for 96.1% of the total environmentally driven phytoplankton community variance. In the zooplankton RDA (Figure 5b), RDA1 explained 84.3% of the constrained variance, while RDA2 explained 10.3%; the cumulative constrained variance explained by the two axes reached 94.6%. Copepods were distributed along the gradient opposite to nutrient concentrations, while hydrozoans and chaetognaths were positioned towards high-salinity regions. Both communities differed systematically between the low-salinity, nutrient-rich inner estuary and the high-salinity, nutrient-poor offshore waters.

3.4. Spatial Distribution of Dominant Species and Diversity in Relation to Environmental Factors

As shown in Table 1, Skeletonema costatum was the sole phytoplankton dominant across all zones, with its dominance declining from 0.122 in both the inner estuary and the estuarine zone to 0.021 offshore. For zooplankton, two co-dominant species (Schmackeria poplesia and Sinocalanus sinensis) occurred in the inner estuary, and a single dominant (Eucalanus subcrassus) appeared offshore, and no dominant species was found in the estuarine zone (dominance < 0.02).
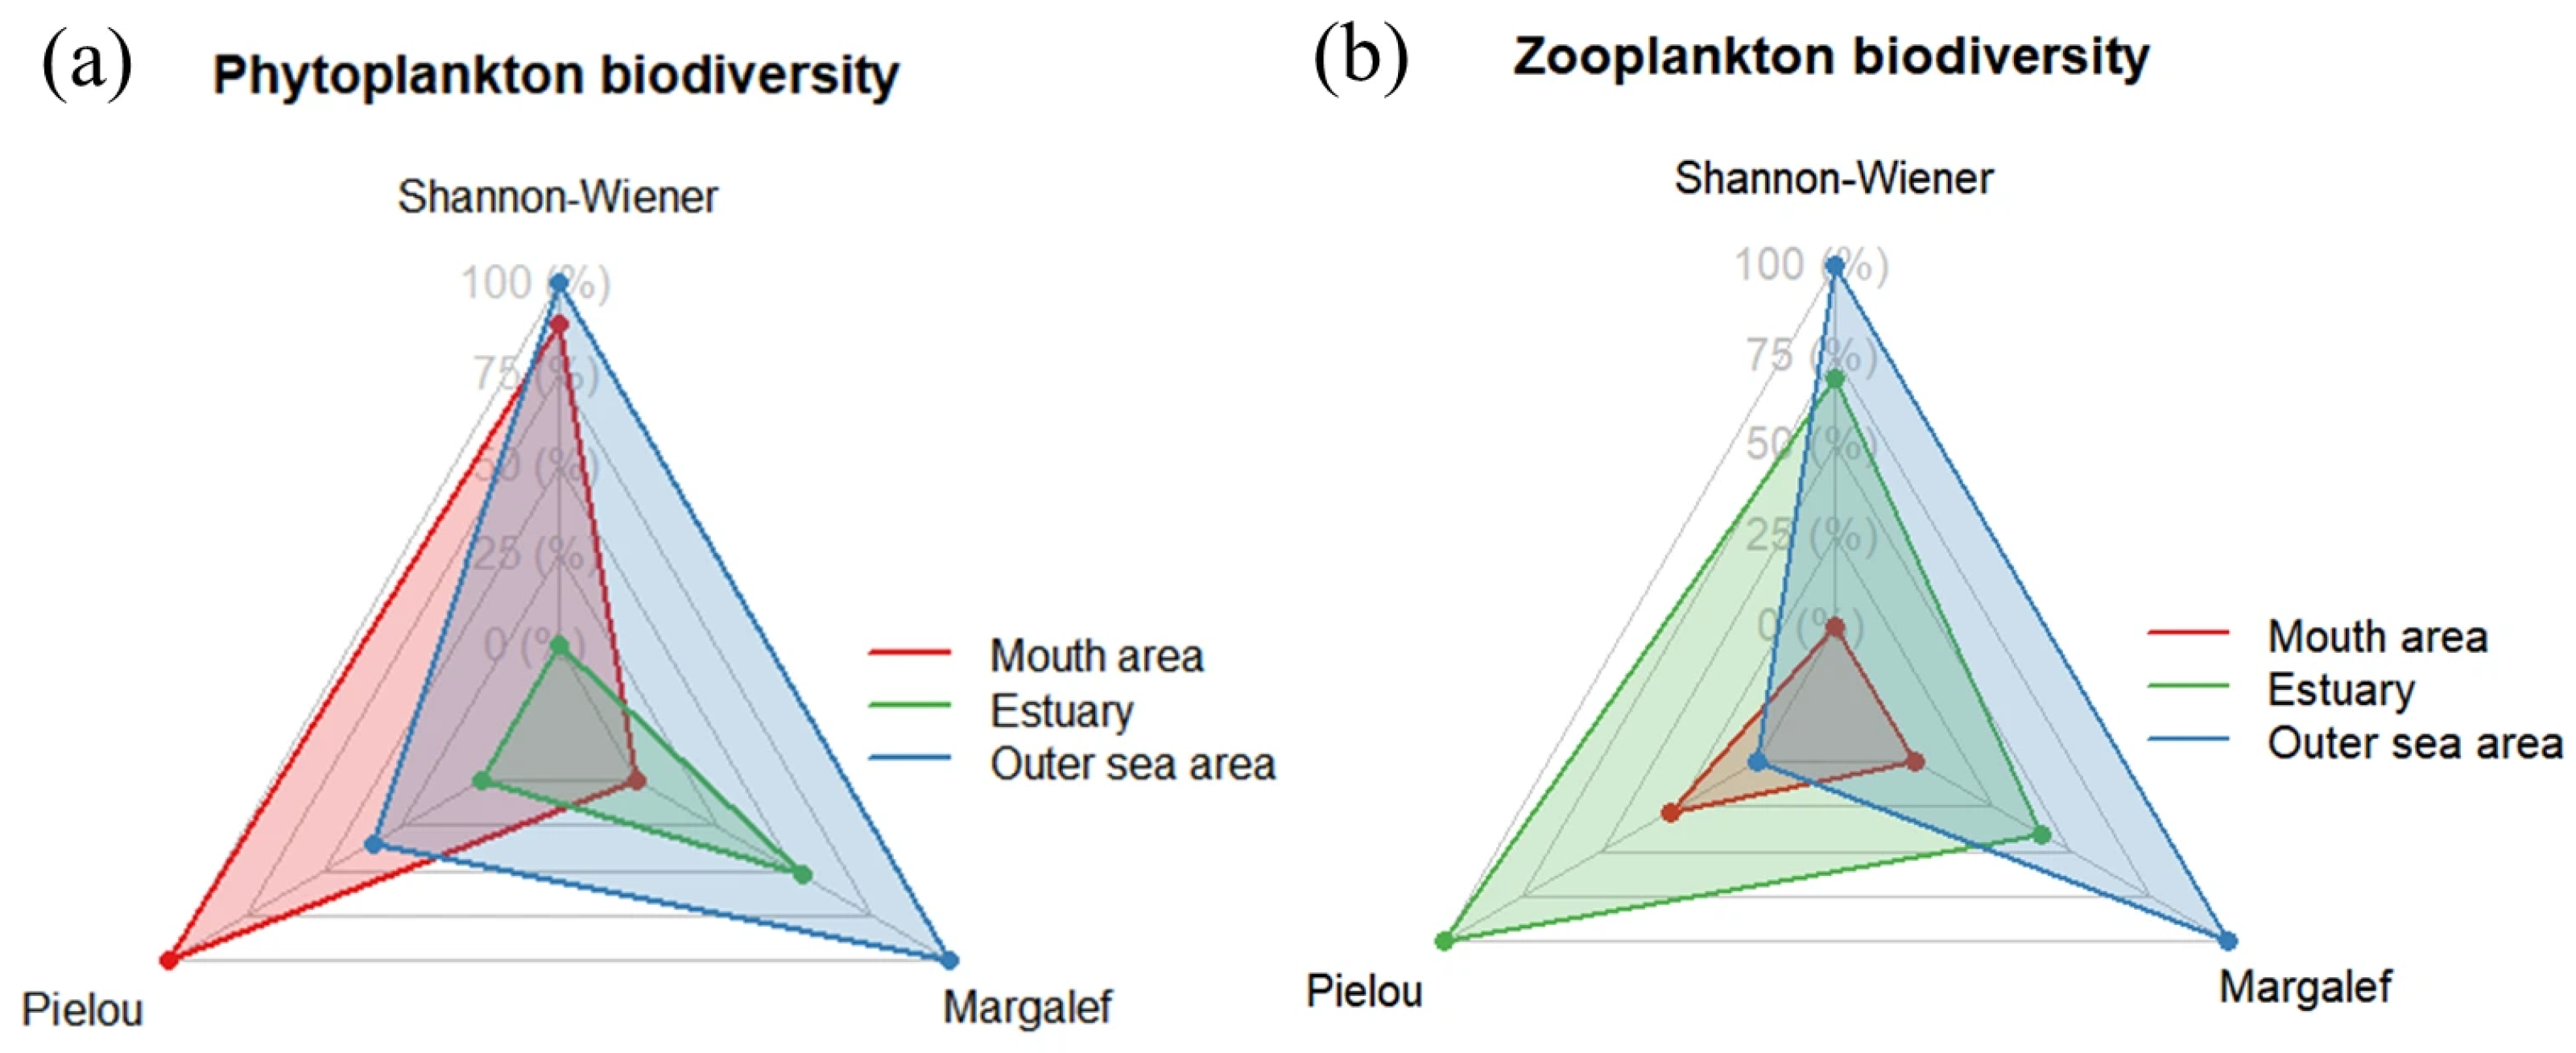
All three diversity indices (Shannon–Wiener, Pielou, Margalef) were higher for zooplankton than for phytoplankton, and for both communities they increased seaward, tracking the salinity gradient (Figure 6).
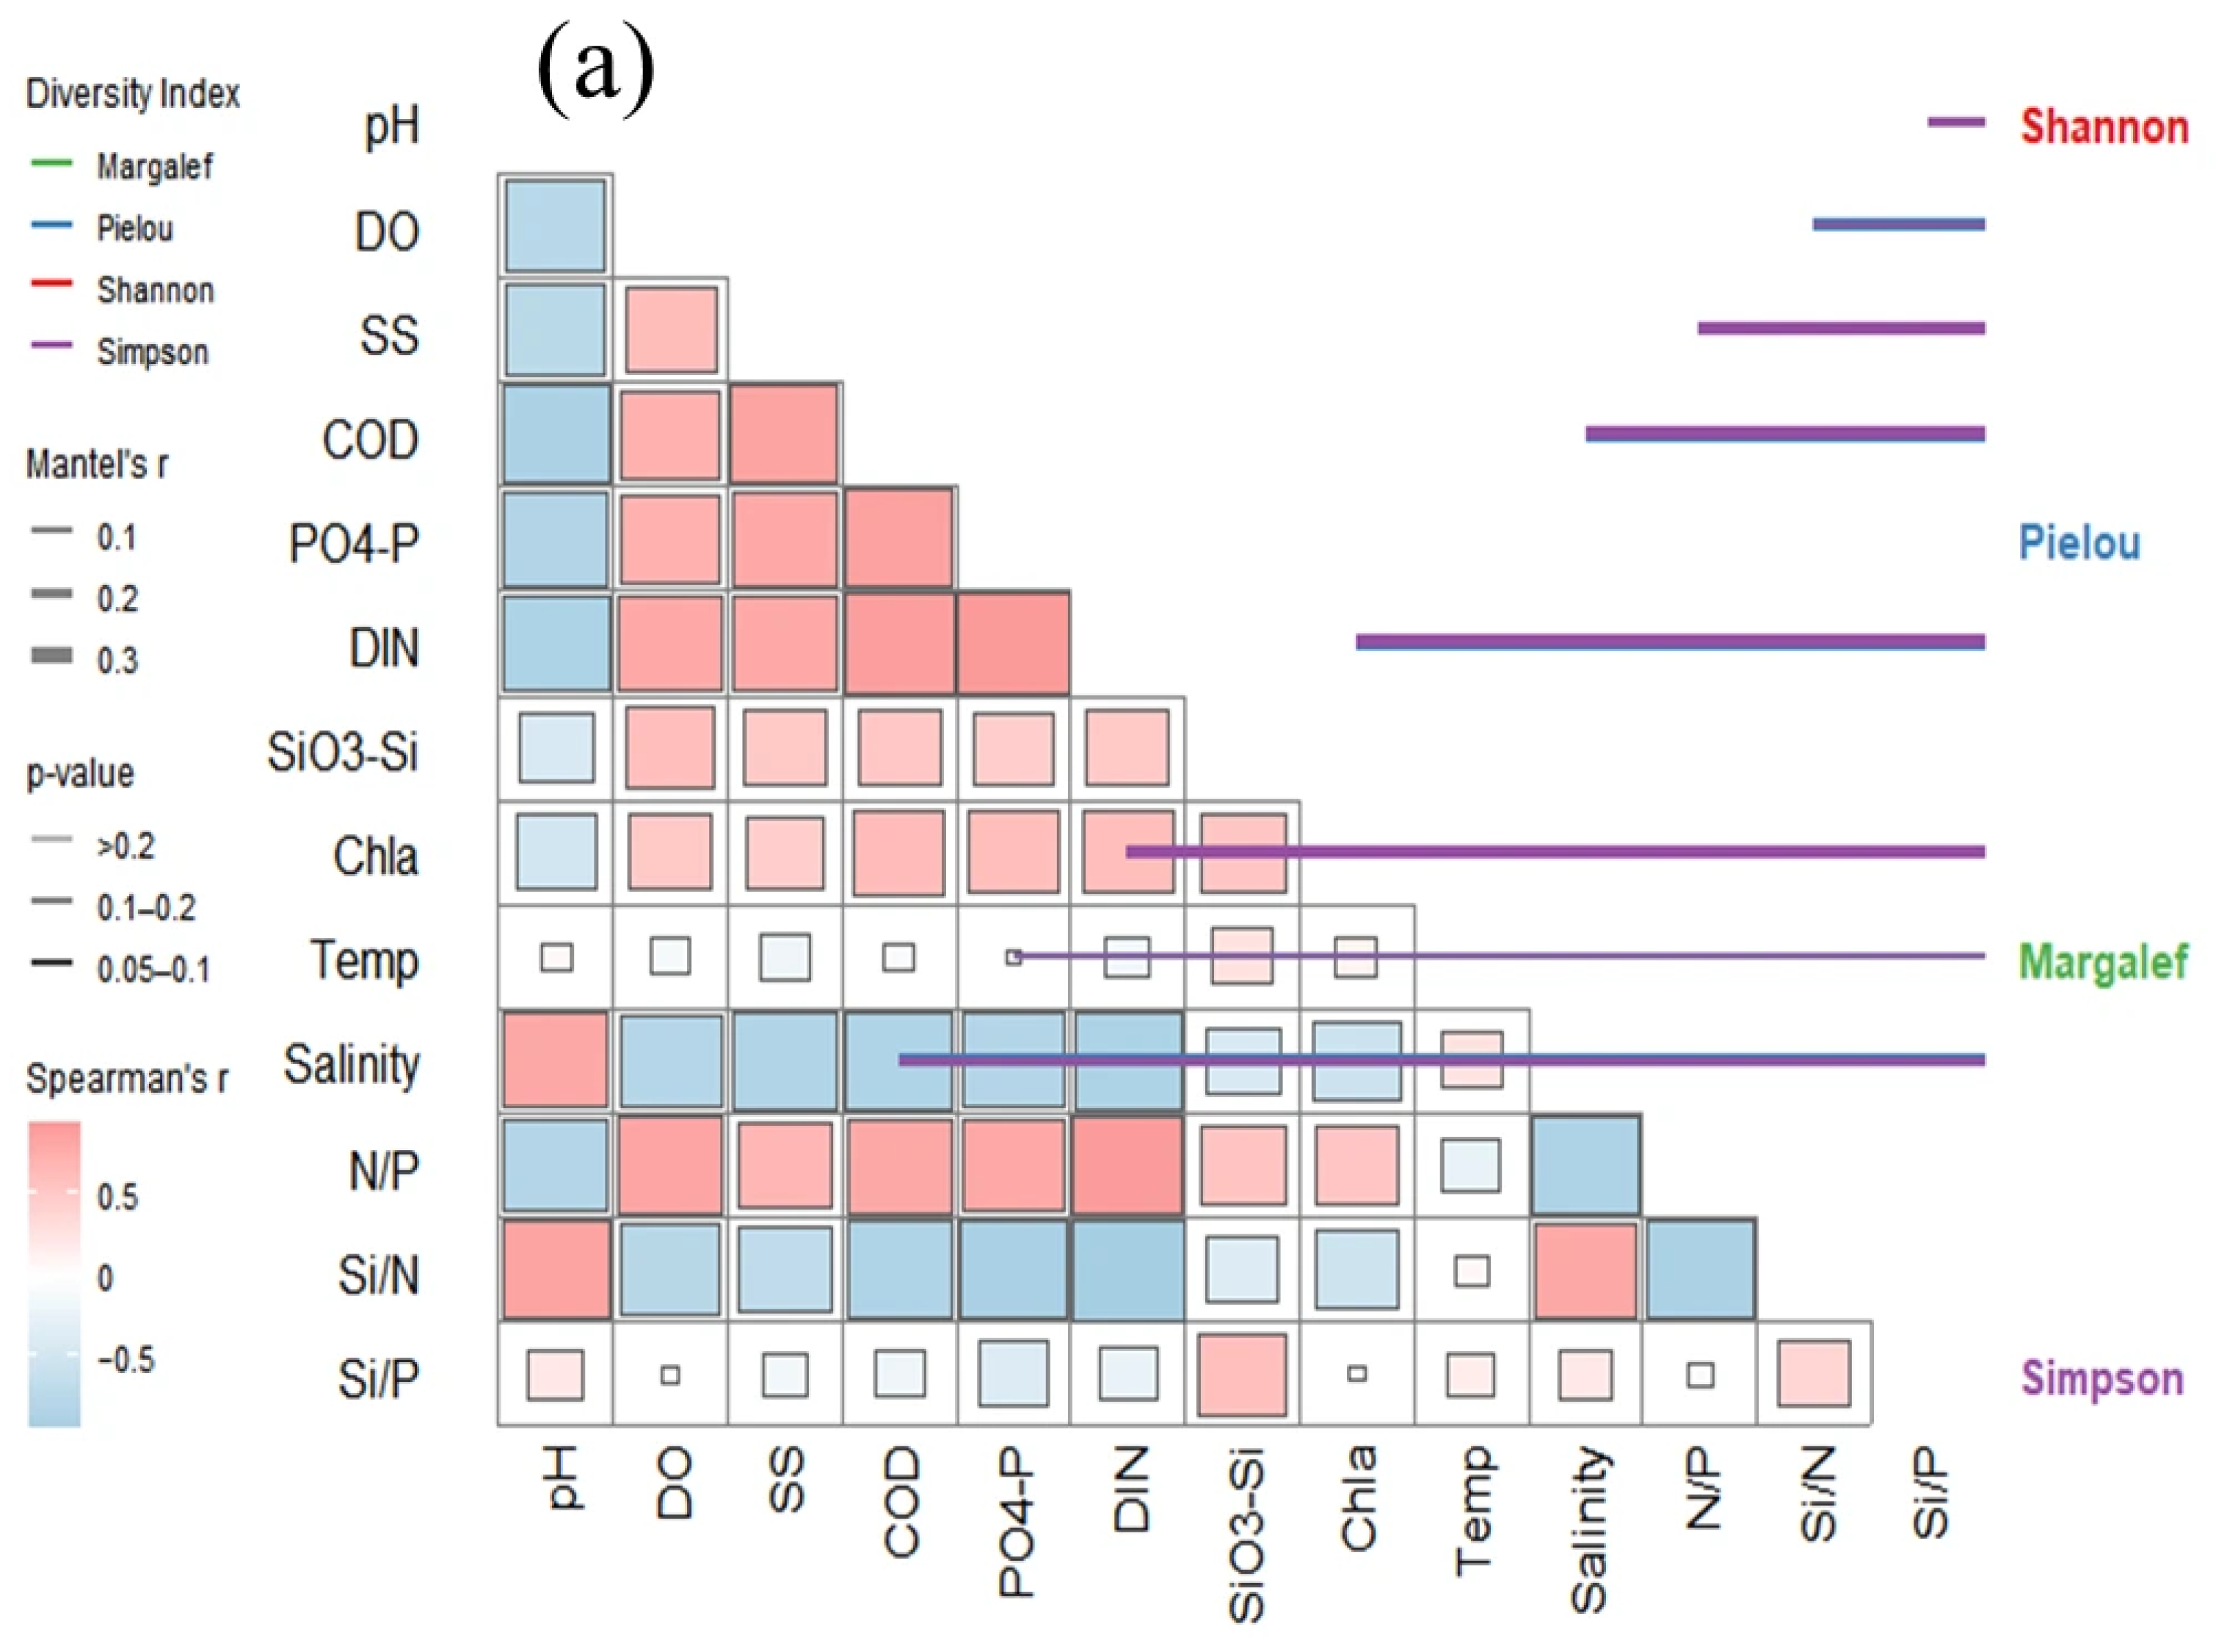
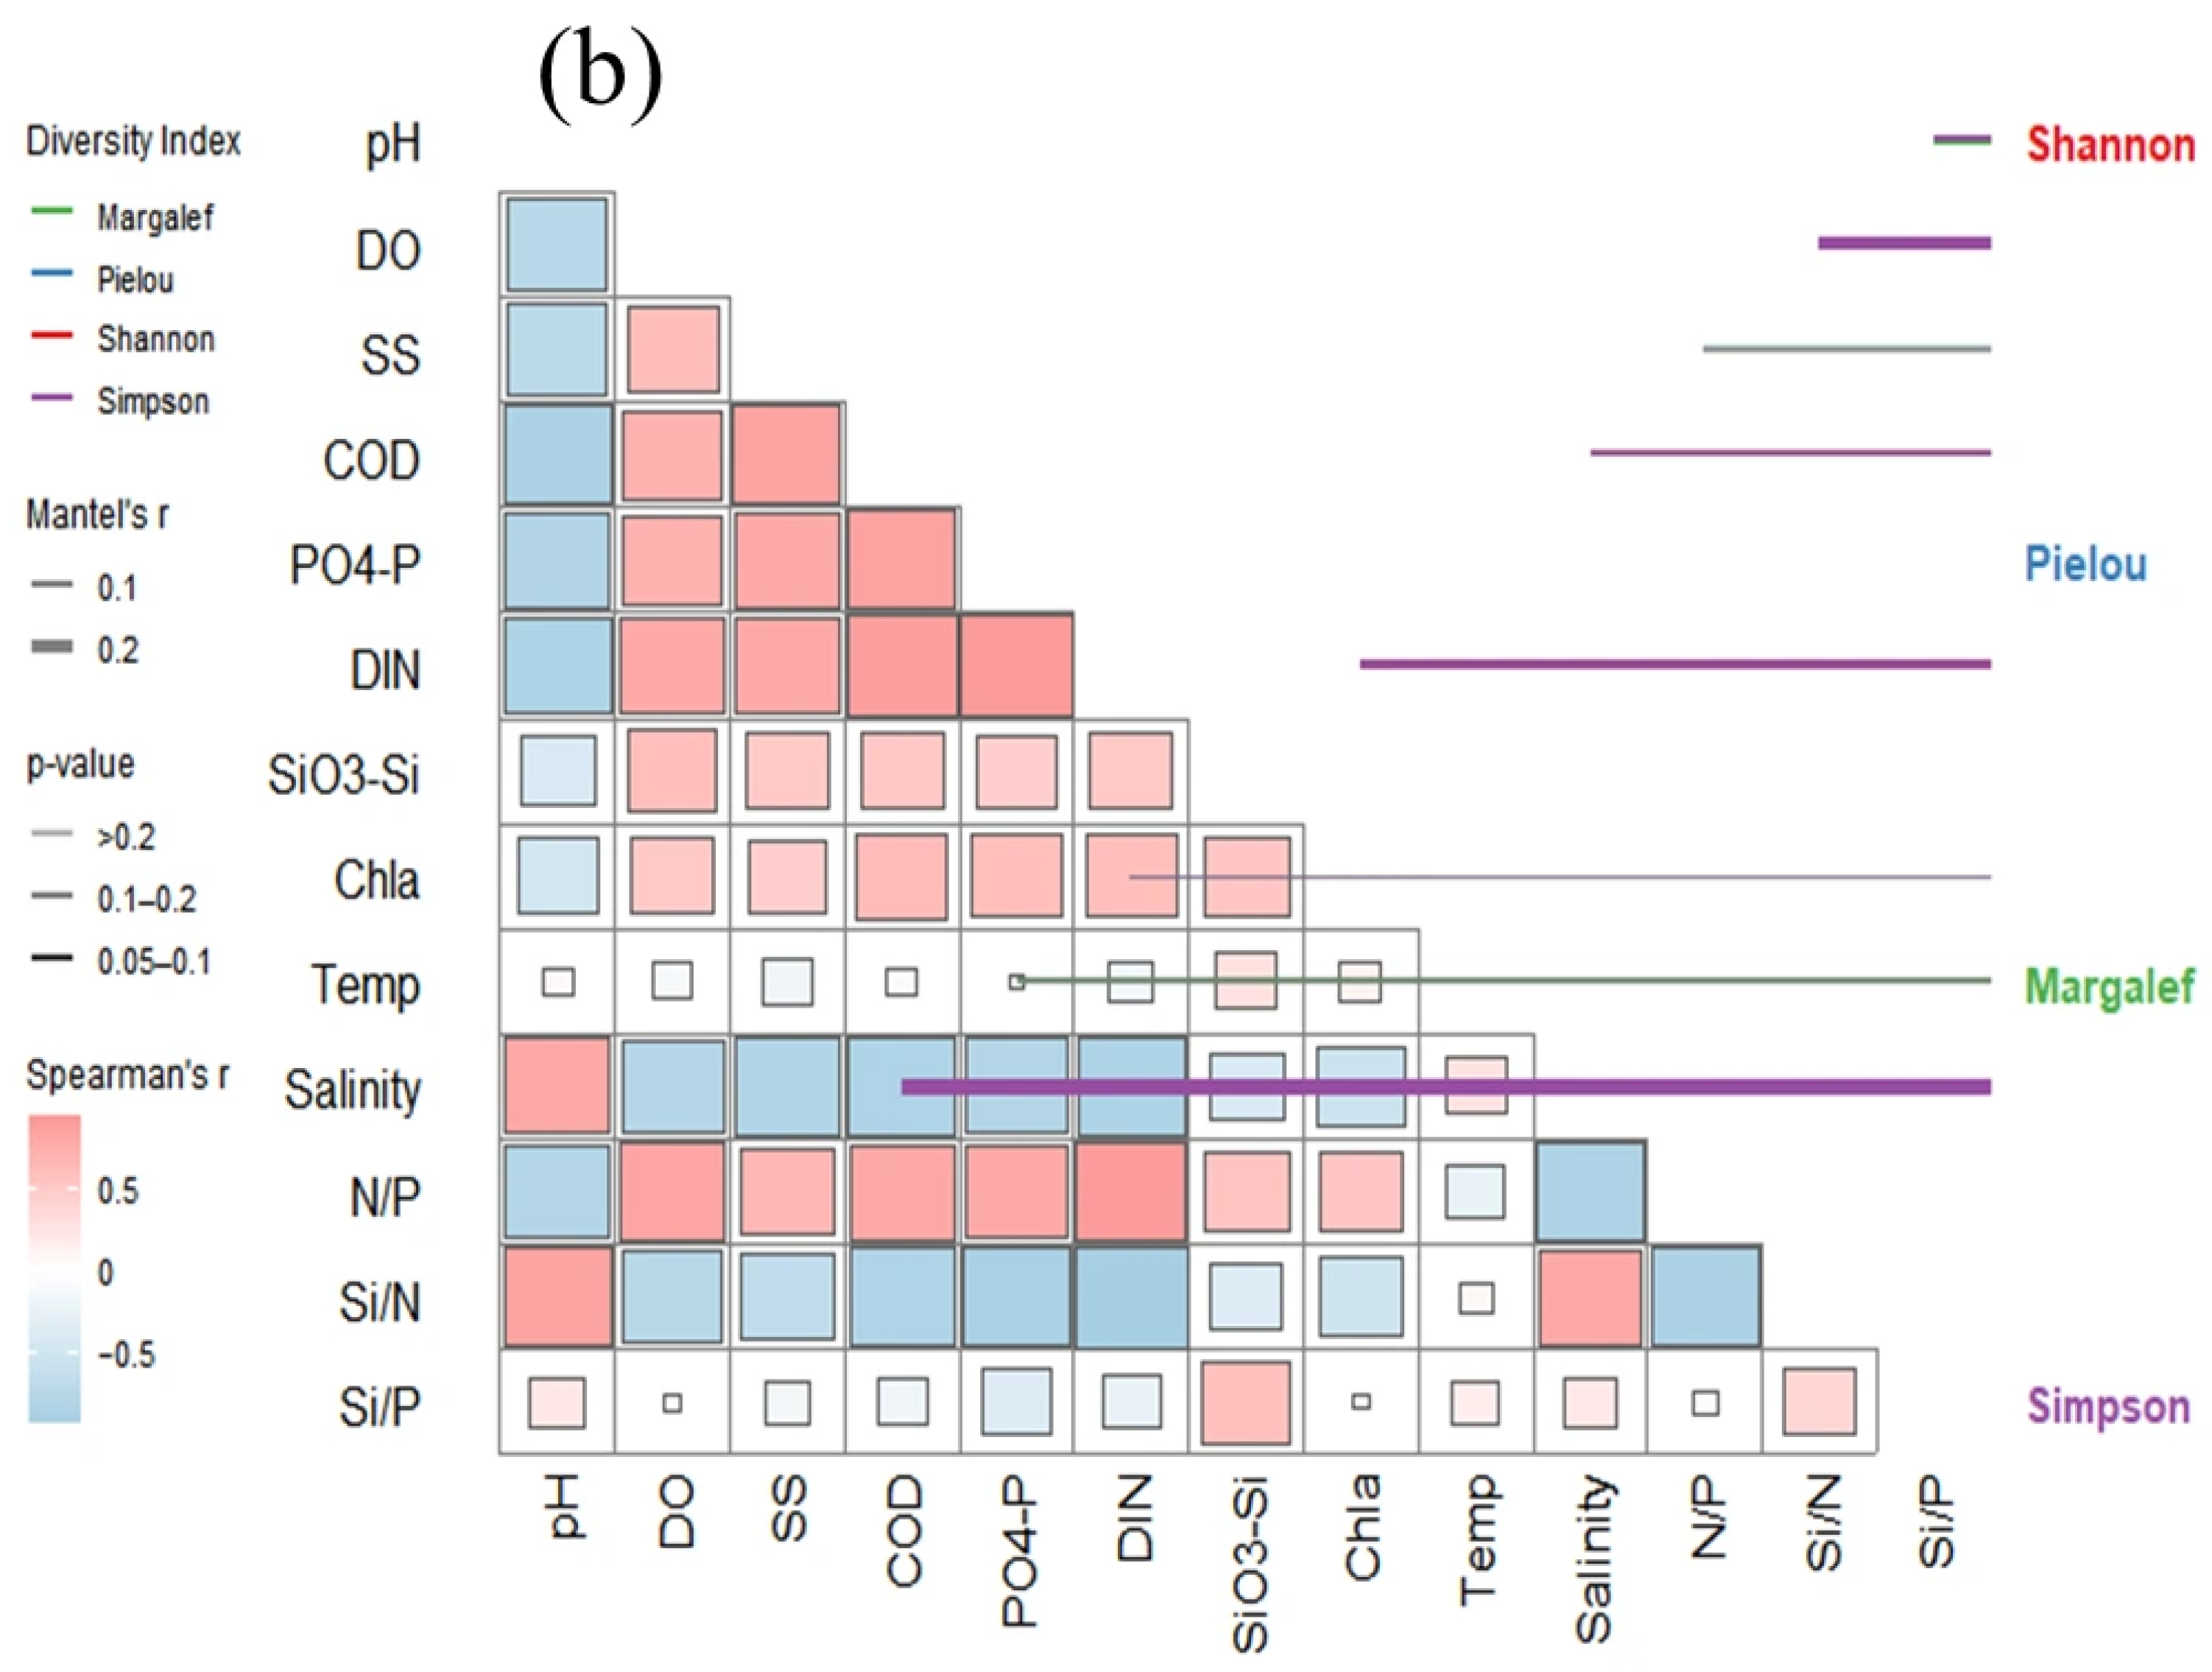
Mantel tests (Figure 7) showed that for phytoplankton, Pielou evenness was most strongly correlated with COD, DIN, SiO3-Si, and N:P (p-value < 0.01); Simpson index was correlated with COD, DIN, Chla, and SS (p < 0.05); and Shannon index was correlated with pH and Chla (p < 0.05); and Margalef richness was largely independent of all measured environmental variables. For zooplankton, Shannon and Simpson indices were primarily correlated with DO, salinity, and N:P (p < 0.05); Margalef richness was correlated with Si:N (p < 0.05); and Pielou evenness showed no significant correlation with any measured variable.
Integrated analysis of the two plankton groups reveals distinct divergent responses of biodiversity metrics to environmental gradients. For phytoplankton, Pielou evenness and dominance indices exhibit the strongest sensitivity to organic pollution proxies and nutrient concentrations, whereas for zooplankton, Shannon-Wiener diversity and dominance are primarily regulated by salinity and dissolved oxygen regimes. Species richness indices of both taxonomic groups show weak overall environmental coupling and relatively high independence from ambient conditions, with the notable exception that zooplankton richness displays a unique significant correlation with the silicate-to-nitrogen ratio (SiO4-Si/DIN).

3.5. Threshold Responses of Plankton Communities to Nutrients

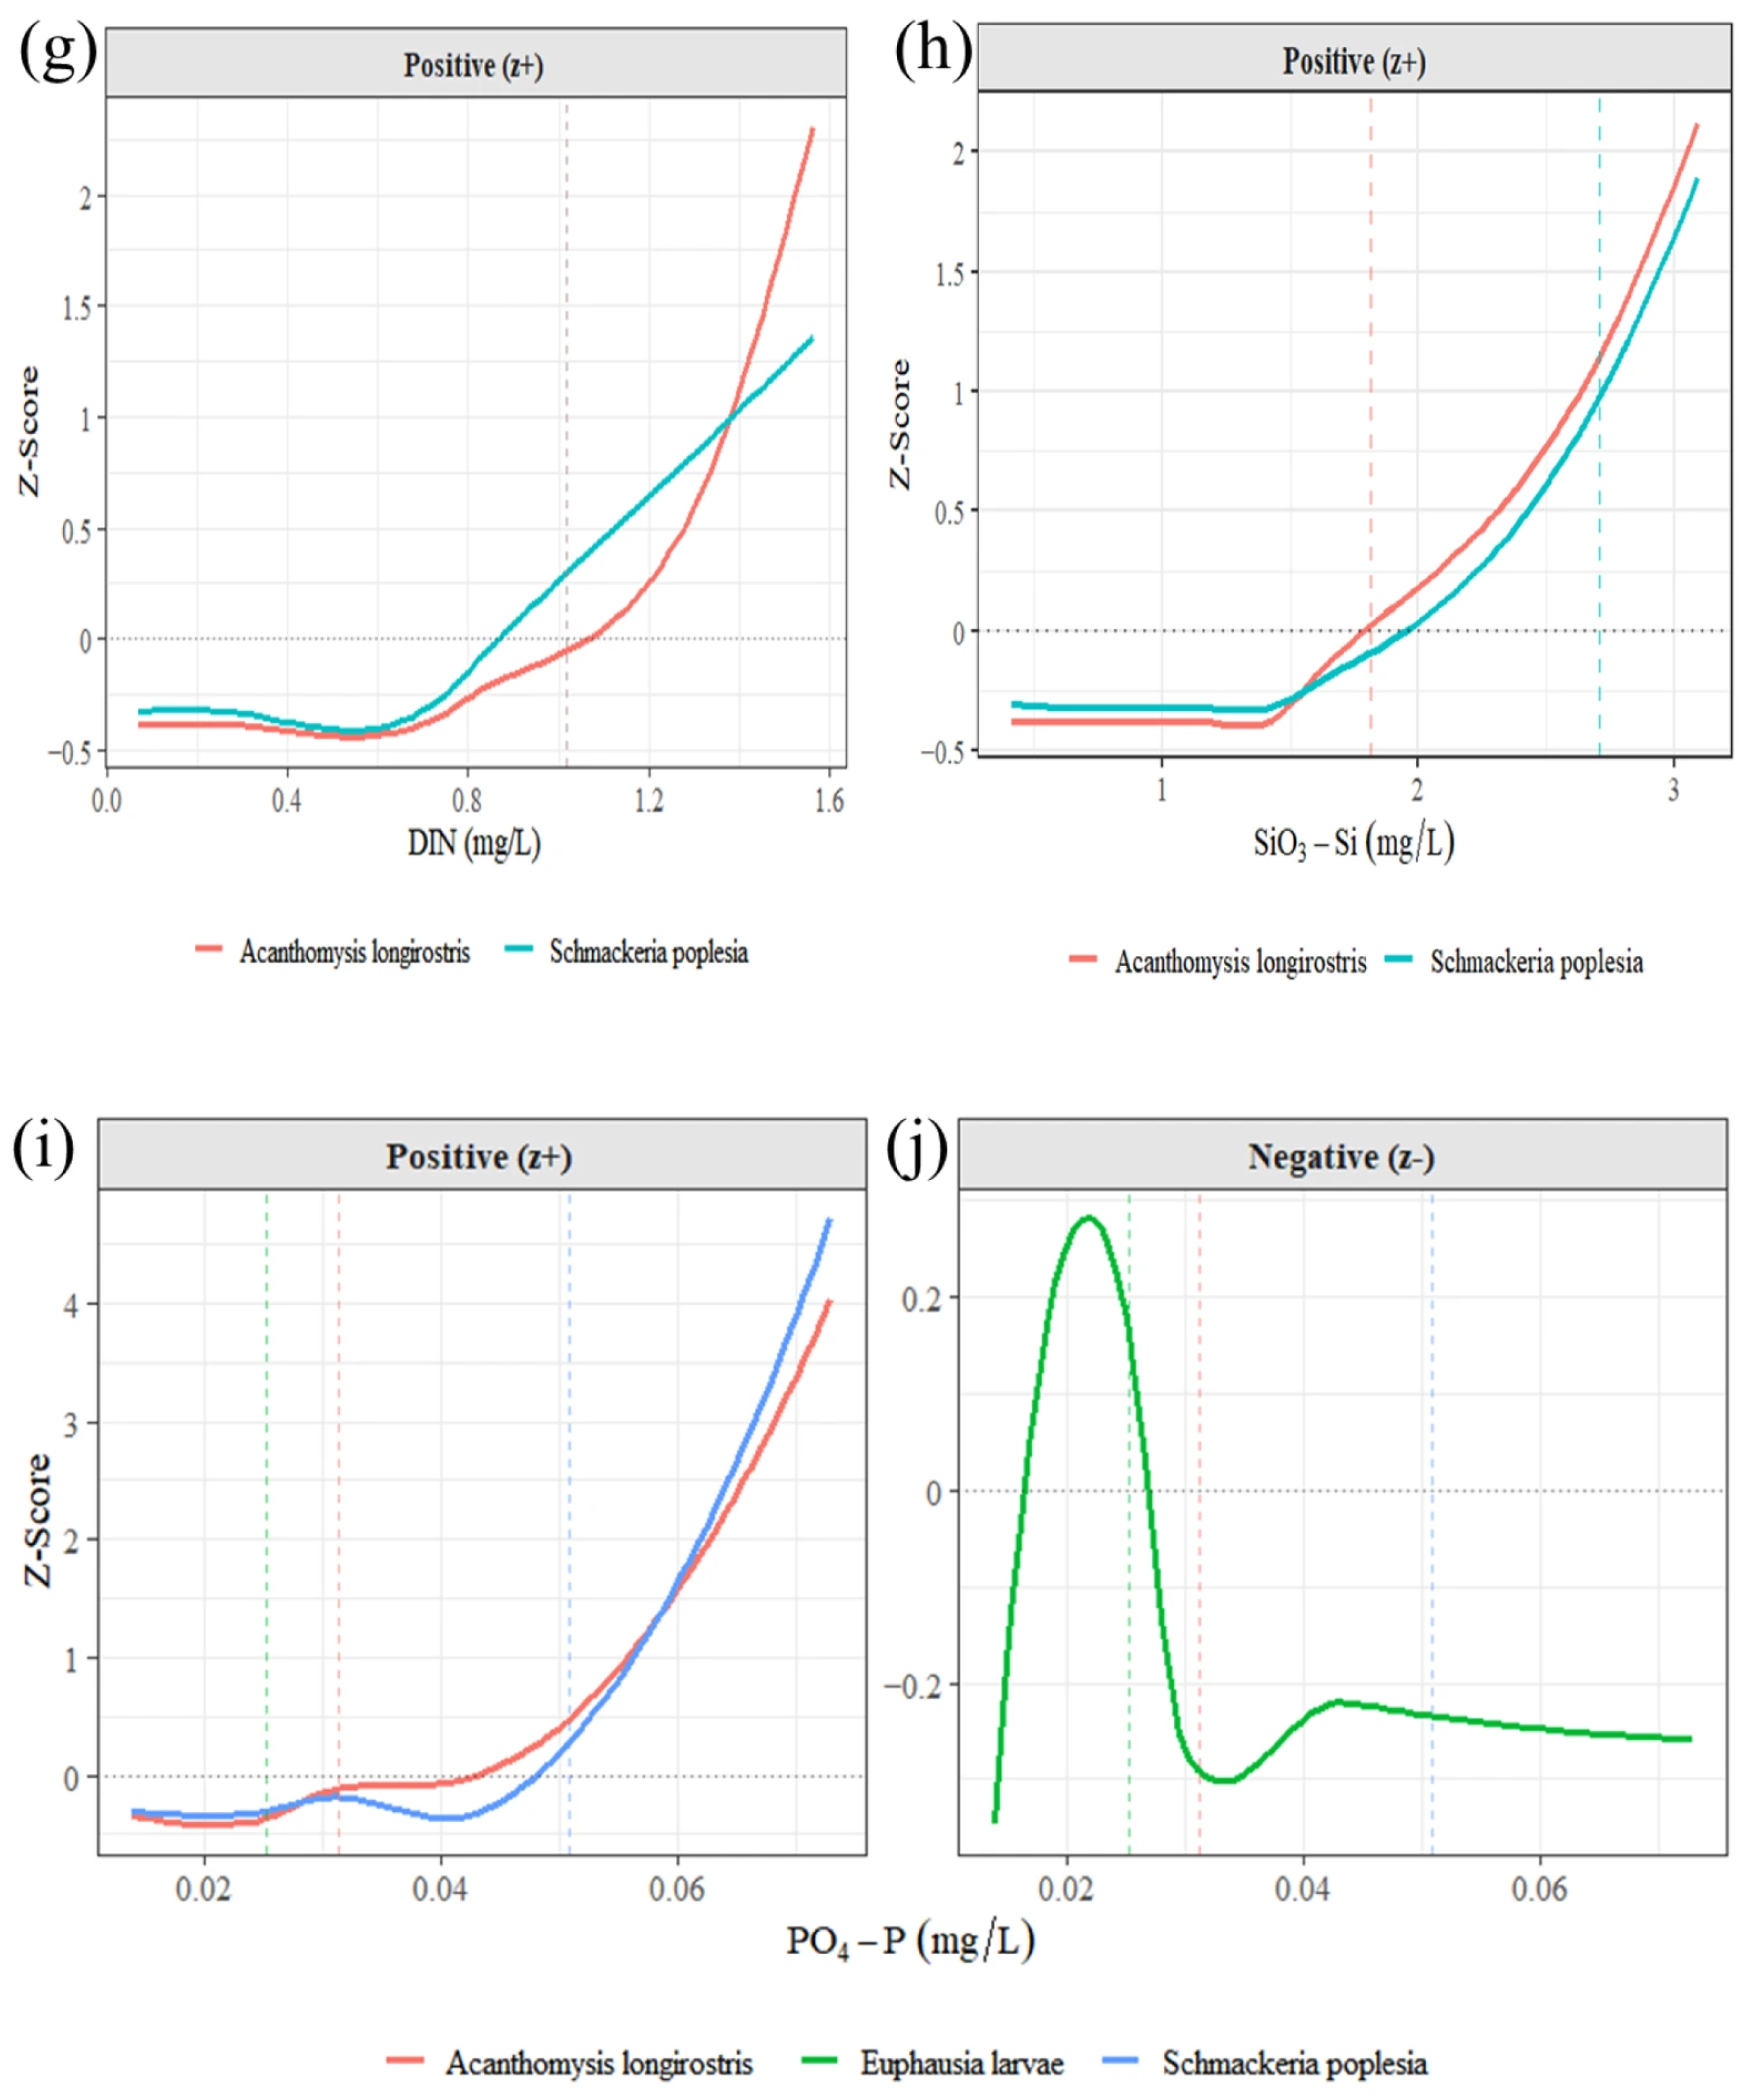
TITAN analysis (Figure 8) revealed multiple indicator taxa. For phytoplankton, S. costatum showed bidirectional thresholds for DIN (negative: 0.18–0.27 mg L−1; positive: 0.95–1.02 mg L−1) and PO4-P (negative: 0.021–0.029 mg L−1; positive: 0.027–0.051 mg L−1). Its positive response thresholds matched ambient nutrient concentrations in the inner estuary and estuarine zone. Additional species responded to SiO3-Si, e.g., Biddulphia sinensis (negative, 0.58–1.64 mg L−1) and Coscinodiscus wailesii (positive, 1.08–1.82 mg L−1). For zooplankton, Schmackeria poplesia and Acanthomysis longirostris responded positively to all three nutrients (DIN: 1.02–1.36 mg L−1; PO4-P: 0.031–0.051 mg L−1; SiO3-Si: 1.82–2.71 mg L−1). Euphausiid larvae were the sole negative responders to PO4-P (threshold: 0.025 mg L−1).
In this study, all nutrient change-point thresholds identified by TITAN are statistical response breakpoints at the community level, rather than the intrinsic growth-favorable ranges or physiological tolerance limits of individual species. The statistical thresholds for negative responses at low nutrient concentrations represent the critical concentration ranges across all surveyed community samples below which the relative abundance of species exhibits a sharp decline; this decline results from community structural changes driven by interspecific competition and overall resource scarcity under low-nutrient conditions, and should not be equated with the physiological lower tolerance limit of nutrient starvation for the species. The statistical thresholds for positive responses at high concentrations correspond to the nutrient concentration ranges under which the species becomes dominant in the nearshore estuarine high-nutrient environment; this change-point signifies the critical concentration at which the entire community shifts toward a Skeletonema costatum-dominated structure, and is not equivalent to the physiologically optimal nutrient saturation range measured under laboratory conditions.

3.6. Comparison of Historical Data

To further test the dominance of bottom-up effects, we compared post-ban community structure with historical records spanning the pre-ban period. Three years after the fishing ban, phytoplankton species richness had increased substantially, yet community evenness had declined and the dominance of key species had strengthened (Table 2). Compared with the mean values before and during the first year of the ban, species richness increased from 56 to 113, and the Margalef index increased nearly sixfold. However, the Shannon–Wiener index rose only from 0.73 to 1.24, remaining below the value of 1.90 recorded in autumn 2004, and the Pielou evenness index declined from 0.30 to 0.26. S. costatum remained the primary dominant species throughout the study period, but its dominance increased markedly after the ban.
Zooplankton communities underwent similarly pronounced changes (Table 3). Species richness increased from 38 to 60, and mean density more than tripled, increasing from 9.45 to 40.51 ind. m−3. The Margalef index increased from 2.48 to 8.27, the Shannon–Wiener index from 1.53 to 2.47, while Pielou evenness declined from 0.65 to 0.60. The primary dominant species shifted from Tortanus vermiculus before the ban to E. subcrassus after the ban.

4. Discussion

4.1. Environmental Control of Spatial Structure

The plankton communities of the Yangtze River Estuary are structured primarily by the coupled salinity–nutrient gradient, consistent with patterns observed in other large estuarine systems [41,42]. Species richness and diversity increased seaward for both phytoplankton and zooplankton, and community composition shifted from assemblages dominated by green algae and cyanobacteria to those dominated by diatoms and dinoflagellates. Salinity acts as the primary spatial template, filtering species along the gradient, while nutrient availability, particularly nitrogen and phosphorus, fine-tunes internal community properties such as evenness and dominance [43,44].

4.2. Bottom-Up Dominance in Post-Ban Community Dynamics

A central question in assessing the ecological effects of the fishing ban is whether the removal of fishing pressure allows top-down control to reassert itself. If predator recovery were the dominant driver, we would expect increased grazing pressure on zooplankton and a consequent decline in their density, along with shifts in phytoplankton composition reflecting reduced herbivory. Zooplankton density more than tripled after the ban, and S. costatum dominance intensified rather than weakened. These patterns are consistent with a system in which bottom-up forces, sustained nutrient loading, remain the primary control on community structure, with top-down signals being comparatively weak at this early stage of recovery [32,45,46].
The bidirectional threshold responses of S. costatum provide ecological evidence consistent with shifts in phytoplankton assemblages along estuarine nutrient gradients. Its positive response thresholds for DIN and PO4-P coincide with the ambient concentrations of these nutrients in the inner estuary and estuarine zone, indicating that the current nutrient regime lies within this species’ optimal niche. Under continued nutrient supply, the removal of fishing-related physical disturbance (bottom trawling disturbance, gear entanglement and scraping, and vessel navigation disturbance) may have simply allowed r-selected dominants to more fully exploit resource-replete conditions [47,48].

4.3. Non-Equilibrium Recovery and Implications for Management

The above observations tentatively point to a plausible non-equilibrium pattern: species richness recovered rapidly, but structural evenness lagged behind. The increase in richness resulted largely from the shoreward penetration of high-salinity offshore species along the salinity gradient [43,49]. In the low-salinity, high-nutrient inner estuary and estuarine zone, however, sustained nutrient supply provided nutrient-replete conditions for a small number of r-selected dominant species [50]. The eutrophic conditions remained largely unchanged between the pre- and post-ban periods, and the removal of fishing disturbance has allowed this bottom-up signal to emerge more clearly [6,51].
The further strengthening of S. costatum dominance may illustrate this mechanism. Nutrient concentrations in the inner estuary and estuarine zone fall within this species’ positive response range [45], and its dominance is fundamentally rooted in the high-nitrogen, high-phosphorus, low-salinity environment of the Yangtze River Estuary [50]. Meanwhile, S. costatum features a fast growth rate and strong environmental adaptability, enabling it to rapidly become the dominant species upon pulsed input of nutrients [51]. The role of the ban may lie more in reducing physical disturbance [6,51], thereby providing more stable hydrodynamic conditions for the sustained aggregation of this dominant species.
The sharp rise in zooplankton density offers tentative circumstantial evidence that bottom-up forces may predominate over top-down control in structuring plankton communities, though top-down trophic effects cannot be fully excluded. If top-down release were the dominant driver, zooplankton density would be expected to decline or at least remain constrained [52,53]. The marked increase in density we observed is not fully consistent with this expectation, suggesting that, three years after the ban, the grazing pressure exerted by recovering top predators on zooplankton may remain insufficient to offset the productivity surge driven by eutrophication. The tripling of zooplankton density likely reflects enhanced primary productivity fueled by sustained nutrient loading, which cascaded upward to support greater secondary production. Bottom-up effects thus remain the primary driver shaping plankton communities at this stage.
The post-ban community, therefore, may exhibit a non-equilibrium recovery pattern: species richness has recovered rapidly, but structural evenness lags behind. New species have colonized from offshore waters along the salinity gradient, increasing richness. Yet the nutrient-rich inner estuary remains dominated by a single species, suppressing evenness. This decoupling of richness from evenness could challenge the assumption that species recovery inevitably leads to community restoration.
These conclusions should be interpreted in light of several limitations. First, our assessment rests on a single autumn survey three years after the ban; continued monitoring across multiple seasons and years is needed to determine whether the non-equilibrium pattern represents a transient state or may become a persistent regime. Second, the absence of direct data on fish diet composition and grazing rates precludes a definitive quantification of top-down pressure. Direct measurements of predator-prey interactions would likely strengthen this tentative conclusion. Third, the pre-ban baseline relies on a multi-year mean that may smooth interannual variability; year-specific comparisons could reveal more nuanced recovery trajectories, which introduces inherent uncertainty to our cross-period comparison results. Finally, our study focused on the planktonic component of the food web; extending the analysis to benthic communities and fish populations may provide a more integrated assessment of ecosystem recovery, and our deductions regarding trophic cascades are therefore limited to plankton assemblages only. Addressing these gaps will require long-term, multi-trophic monitoring programs that couple biodiversity surveys with direct measurements of trophic fluxes and nutrient dynamics.
Despite these caveats, our findings offer several insights for the management of large estuarine systems. The ten-year fishing ban in the Yangtze River represents one of the most ambitious conservation interventions ever implemented in a large river system [6]. Its effects on fish stocks are beginning to be documented [54,55], but our results caution that recovery at higher trophic levels does not automatically cascade downward to restructure plankton communities. Without concurrent reductions in nutrient loading, the structural recovery of the planktonic base of the food web may remain incomplete, even as species richness increases. Future monitoring should integrate lower-trophic-level indicators, particularly evenness and dominance metrics, into assessments of the ban’s ecological effectiveness. Sustaining this recovery will require integrating nutrient management into the regulatory framework of the fishing ban, a lesson relevant to large river systems globally. As the world’s largest riverine fishing ban, the Yangtze experiment offers a critical test of whether transformative conservation interventions can restore not only the targeted fish stocks but also the broader food-web structure upon which long-term ecosystem resilience depends.

5. Conclusions

Three years after the Yangtze River fishing ban, the estuarine plankton community may show a non-equilibrium recovery pattern. Species richness may have increased, but evenness declined and S. costatum dominance intensified. Zooplankton density increased substantially, which may not be fully consistent with the expectation under a simple top-down release scenario.
Bottom-up forces appear to potentially act as the primary driver of community structure, with top-down signals seemingly being comparatively weak at this early recovery stage. The positive response thresholds of S. costatum to DIN and PO4-P match ambient nutrient levels in the inner estuary.
Without substantial long-term nutrient reduction, structural recovery will likely lag behind species richness gains, although this inference is constrained by our single-season survey and lack of multi-trophic data. Integrating nutrient management into fisheries policy may therefore be essential for achieving balanced estuarine food webs restoration.

Author Contributions

Conceptualization, C.Y. and Q.S.; formal analysis, W.L. and B.D.; methodology, Q.S., C.Y., Y.G. and L.Z.; investigation, Y.G., L.Z., J.L., L.L., X.Y. and Y.Y.; data curation, B.D. and Q.S.; resources, C.Y.; software, J.L., L.L. and Y.Y.; writing—original draft, B.D., W.L. and Q.S.; writing—review and editing, Q.S. and C.Y.; supervision, C.Y. All authors have read and agreed to the published version of the manuscript.

Funding

This study was supported by “The program of opening ceremony to select the best candidates of the Key Laboratory of Marine Ecological Monitoring and Restoration Technology, MNR, China (MEMRT2024JBGS01)”, China Three Gorges Corporation, Huaneng (Shanghai) Clean Energy Development Co., Ltd., Shanghai Electric Power Co., Ltd., Shanghai Electric Wind Power Group Co., Ltd., and China Railway Construction Corporation Harbour and Channel Engineering Bureau Group Co., Ltd. (contract number: CTGIM-2025-ZC001).

Institutional Review Board Statement

Not applicable.

Data Availability Statement

Data generated or analyzed during this study are available from the corresponding author upon reasonable request.

Acknowledgments

We would like to express our gratitude to Xia Lihua, Ke Yu, and Liu Bingqing of the East China Sea Ecology Center, Ministry of Natural Resources, for their assistance with field sampling, laboratory analysis, and data processing.

Conflicts of Interest

The authors declare that this study received funding from China Three Gorges Corporation, Huaneng (Shanghai) Clean Energy Development Co., Ltd., Shanghai Electric Power Co., Ltd., Shanghai Electric Wind Power Group Co., Ltd., and China Railway Construction Corporation Harbour and Channel Engineering Bureau Group Co., Ltd. (contract number: CTGIM-2025-ZC001). The funder was involved in this study: they participated in the investigation, including field sampling and raw data collection, but had no role in data interpretation, manuscript drafting, or the decision to publish.

References

  1. He, B.Z.; Wang, Y.; Wang, B.; Lu, S.Q.; Lei, K.; Li, L.Q.; Cheng, Q.G. Spatiotemporal characteristics of nutrients in the Yangtze River estuary from 2016 to 2021 and their influencing factors. Res. Environ. Sci. 2024, 37, 221–232. [Google Scholar]
  2. Zhao, B.R. Changjiang diluted water fronts and their relation to the discharge of the Changjiang River. Stud. Mar. Sin. 1992, 33, 27–36. [Google Scholar] [CrossRef] [Scilit]
  3. Gebhardt, A.C.; Schoster, F.; Gaye-Haake, B.; Beeskow, B.; Rachold, V.; Unger, D.; Ittekkot, V. The turbidity maximum zone of the Yenisei River (Siberia) and its impact on organic and inorganic proxies. Estuar. Coast. Shelf Sci. 2005, 65, 61–73. [Google Scholar] [CrossRef] [Scilit]
  4. Li, L.Q.; Wang, Y.; Wang, B.; Lu, S.Q.; Lei, K.; He, B.Z.; Cheng, Q.G. Spatiotemporal distribution of plankton community structure in the Yangtze River Estuary in the summer of 2009–2021 and its influencing factors. Res. Environ. Sci. 2024, 37, 233–245. [Google Scholar]
  5. Xu, Z.L.; Wang, Y.L.; Chen, Y.Q.; Shen, H.T. An ecological study on zooplankton in maximum turbid zone of estuarine area of Changjiang (Yangtze) River. J. Fish. Sci. China 1995, 2, 39–48. [Google Scholar]
  6. Xiong, F.Y.; Li, Z.Y.; Brosse, S.; Olden, J.D.; Cooke, S.J.; Yang, B.; Lu, Y.; Gao, W.; Xin, W.; Chen, Y.S. Fishing ban halts seven decades of biodiversity decline in the Yangtze River. Science 2026, 391, 719–723. [Google Scholar] [CrossRef] [Scilit] [PubMed]
  7. Han, R.; Chen, Q.W.; Wang, L.; Tang, X.W.; Shen, X.Q. Analysis of the ecosystem structure and energy flow of the Yangtze River estuary and adjacent seas based on the Ecopath model. Acta Ecol. Sin. 2016, 36, 4907–4918. [Google Scholar] [CrossRef] [Scilit]
  8. Wang, S.Y.; Gao, C.X.; Wu, J.H. Trophic niche and spatial variation of three dominant shrimp species during the early period of fishing ban in the Yangtze River Estuary. Acta Hydrobiol. Sin. 2025, 49, 3–12. [Google Scholar]
  9. Cloern, J.E.; Abreu, P.C.; Carstensen, J.; Chauvaud, L.; Elmgren, R.; Grall, J.; Greening, H.; Johansson, J.O.R.; Kahru, M.; Sherwood, E.T. Human activities and climate variability drive fast-paced change across the world’s estuarine-coastal ecosystems. Glob. Change Biol. 2016, 22, 513–529. [Google Scholar]
  10. Ding, L.; Li, J.; Zhang, Q.; Fu, M.; Yang, S. Environmental factors impacting phytoplankton response to the cold water mass in the Yellow Sea. J. Clean. Prod. 2025, 508, 145556. [Google Scholar] [CrossRef] [Scilit]
  11. Li, S.J.; Shi, L.Y.; Zhong, J.S.; Zhao, L.L. Comparative study on fish community structure in spring and autumn in the southern waters of the Yangtze River Estuary. J. Shanghai Ocean Univ. 2024, 33, 135–149. [Google Scholar]
  12. Wang, Y.; Wang, W.B.; Huang, Y.Q.; Chang, L.; Tang, X.M.; He, X.B.; Lin, H. Scenarios of temporal environmental alterations and phytoplankton diversity in a changing bay in the East China Sea. Front. Mar. Sci. 2023, 10, 1303497. [Google Scholar] [CrossRef] [Scilit]
  13. Wang, Y.; Zhang, B.Q.; Dai, A.Q.; Zhong, S.M.; Xu, X.Q.; Lü, X.B.; Lei, K. Countermeasures of integrated land-sea environmental management for estuarine region. Res. Environ. Sci. 2023, 36, 768–772. [Google Scholar]
  14. Little, S.; Wood, P.J.; Elliott, M. Quantifying salinity-induced changes on estuarine benthic fauna: The potential implications of climate change. Estuar. Coast. Shelf Sci. 2017, 198, 610–625. [Google Scholar] [CrossRef] [Scilit]
  15. Qiu, Z.G. Study on the Method for Delimiting Sea-Land Demarcation Line in Estuary Areas. Master’s thesis, Ocean University of China, Qingdao, China, 2005. (accessed on 11 July 2026). [Google Scholar]
  16. GB 17378-2007; Marine Monitoring Specification. General Administration of Quality Supervision; Inspection and Quarantine of the People’s Republic of China; Standardization Administration of China; China Standards Press: Beijing, China, 2008.
  17. Utermöhl, H. Zur Vervollkommnung der quantitativen Phytoplankton-Methodik. Mitt. Int. Ver. Theor. Angew. Limnol. 1958, 9, 1–38. [Google Scholar] [CrossRef] [Scilit]
  18. Jolliffe, I.T.; Cadima, J. Principal component analysis: A review and recent developments. Philos. Trans. R. Soc. A. 2016, 374, 20150202. [Google Scholar] [CrossRef] [Scilit]
  19. Margalef, R. Information theory in ecology. Gen. Syst. 1957, 3, 36–71. [Google Scholar]
  20. Shannon, C.E. A mathematical theory of communication. Bell Syst. Tech. J. 1948, 27, 379–423. [Google Scholar] [CrossRef] [Scilit]
  21. Pielou, E.C. The measurement of diversity in different types of biological collections. J. Theor. Biol. 1966, 13, 131–144. [Google Scholar] [CrossRef] [Scilit]
  22. Li, L.P.; Xu, Y.J.; Zhou, C.; Zhang, Z.S.; Liu, W.J.; Zhang, Y.Y.; He, F.F.; Yu, J. Changes in zooplankton community structure in the adjacent waters of Changjiang Estuary in spring of 2023. Fish. Sci. 2025, 44, 962–970. [Google Scholar]
  23. Mantel, N. The detection of disease clustering and a generalized regression approach. Cancer Res. 1967, 27, 209–220. [Google Scholar] [PubMed]
  24. Legendre, P. Comparison of permutation methods for the partial correlation and partial Mantel tests. J. Stat. Comput. Simul. 2000, 67, 37–73. [Google Scholar] [CrossRef] [Scilit]
  25. Quilodrán, C.S.; Currat, M.; Montoya-Burgos, J.I. Benchmarking the Mantel test and derived methods for testing association between distance matrices. Mol. Ecol. Resour. 2025, 25, e13898. [Google Scholar] [PubMed]
  26. Baker, M.E.; King, R.S. A new method for detecting and interpreting biodiversity and ecological community thresholds. Methods Ecol. Evol. 2010, 1, 25–37. [Google Scholar] [CrossRef] [Scilit]
  27. King, R.S.; Baker, M.E. Considerations for identifying and interpreting ecological community thresholds. J. N. Am. Benthol. Soc. 2010, 29, 998–1008. [Google Scholar] [CrossRef] [Scilit]
  28. Liu, L.H.; Zuo, T.; Chen, R.S.; Wang, J. Community structure and diversity of phytoplankton in the estuary of Yangtze River in autumn. Mar. Fish. Res. 2007, 3, 112–119. [Google Scholar]
  29. Yang, Y.; Liu, P.X.; Zhou, H.H.; Xia, L.H. Evaluation of the biodiversity variation and ecosystem health assessment in Changjiang estuary during the past 15 years. Acta Ecol. Sin. 2020, 40, 8892–8904. [Google Scholar]
  30. Editorial Committee of Chinese Offshore Oceanography Series. Basic Status of Shanghai Marine Environmental Resources; Editorial Committee of Chinese Offshore Oceanography Series: Shanghai, China, 2012. [Google Scholar]
  31. Li, L.Q. Study on Characteristics of Plankton Community Structure and Its Influencing Factors in the Yangtze River Estuary. Master’s thesis, Shenyang University, Shenyang, China, 2024. (accessed on 11 July 2026). [Google Scholar]
  32. Shao, Q.W.; Liu, Z.S.; Zhang, J.; Sun, D.; Lin, S.Q. Seasonal variation in zooplankton community structure in the Changjiang Estuary and its adjacent waters. Acta Ecol. Sin. 2017, 37, 683–691. [Google Scholar] [CrossRef] [Scilit]
  33. Zhang, F.Y.; Tang, J.L.; Li, D.J.; Fang, T.; Wang, B. Zooplankton distribution and variation in the Yangtze Estuary and its adjacent waters in summer and autumn. Acta Hydrobiol. Sin. 2009, 33, 1219–1225. [Google Scholar] [CrossRef] [Scilit]
  34. Oksanen, J.; Simpson, G.L.; Blanchet, F.G.; Kindt, R.; Legendre, P.; Minchin, P.R.; O’Hara, R.B.; Solymos, P.; Stevens, M.H.H.; Szoecs, E.; et al. vegan: Community Ecology Package, R package version 2.6-4. 2022. Available online: https://cran.r-project.org/package=vegan (accessed on 11 July 2026).
  35. Kassambara, A.; Mundt, F. factoextra: Extract and Visualize the Results of Multivariate Data Analyses, R package version 1.0.7. 2020. Available online: https://cran.r-project.org/package=factoextra (accessed on 11 July 2026).
  36. Wickham, H.; François, R.; Henry, L.; Müller, K.; Vaughan, D. dplyr: A Grammar of Data Manipulation, R Package Version 1.1.0. 2023; Available online: https://cran.r-project.org/package=dplyr (accessed on 11 July 2026).
  37. Baker, M.E.; King, R.S.; Kahle, D. TITAN2: Threshold Indicator Taxa Analysis, R Package Version 2.1. 2015. Available online: https://cran.r-project.org/package=TITAN2 (accessed on 11 July 2026).
  38. Huang, H. linkET: Everything is Linkable, R Package Version 0.0.7.1. 2021. Available online: https://cran.r-project.org/package=linkET (accessed on 11 July 2026).
  39. Wickham, H.; Chang, W.; Henry, L.; Pedersen, T.L.; Takahashi, K.; Wilke, C.; Woo, K.; Yutani, H.; Dunnington, D. ggplot2: Create Elegant Data Visualisations Using the Grammar of Graphics, R Package Version 3.4.4. 2023. Available online: https://cran.r-project.org/package=ggplot2 (accessed on 11 July 2026).
  40. Standard’s ORCID: 0000-0002-3740-6499; Ocean Data View. 2022. Available online: https://odv.awi.de/ (accessed on 11 July 2026).
  41. Meire, P.; Ysebaert, T.; Van Damme, S.; Van den Bergh, E.; Maris, T.; Struyf, E. The Scheldt estuary: A description of a changing ecosystem. Hydrobiologia 2005, 540, 1–11. [Google Scholar] [CrossRef] [Scilit]
  42. Guo, Z.; Wang, C.F.; Li, H.B.; Zhao, L.; Zhao, Y.; Dong, Y.; Li, K.Z.; Zhang, W.C. Zooplankton ecocline along salinity gradient in the Pearl River estuary (South China Sea). Estuar. Coast. Shelf Sci. 2025, 322, 109376. [Google Scholar] [CrossRef] [Scilit]
  43. Bharathi, M.D.; Venkataramana, V.; Sarma, V.V.S.S. Phytoplankton community structure is governed by salinity gradient and nutrient composition in the tropical estuarine system. Cont. Shelf Res. 2022, 234, 104643. [Google Scholar] [CrossRef] [Scilit]
  44. Xu, Y.P.; Cheng, F.P.; Ma, X.; Mao, M.; Zhu, Y.L.; Jiang, Z.B.; Zheng, Z.T.; Zeng, J.N.; Lu, S.; Zhou, F.; et al. The impact of summer Yangtze River runoff fluctuations on estuarine fronts dynamics and zooplankton communities from 2016 to 2023. Front. Mar. Sci. 2025, 12, 1556561. [Google Scholar] [CrossRef] [Scilit]
  45. Luan, Q.S.; Sun, J.; Song, S.Q.; Shen, Z.L.; Yu, Z.M. Canonical correspondence analysis of summer phytoplankton community and its environment in the Yangtze River Estuary, China. J. Plant Ecol. 2007, 3, 445–450. [Google Scholar] [CrossRef] [Scilit]
  46. Yang, W.D.; Zheng, L.M.; Li, W.W.; He, H.Y.; Lin, H.; Zhang, G. Species composition and interannual variation of macro-meso zooplankton and the influential factors in the adjacent waters of the Yangtze River Estuary in summer. J. Xiamen Univ. (Nat. Sci.) 2018, 57, 517–525. [Google Scholar]
  47. Cai, S.J.; Liu, W.R.; Tong, Z.Y.; Lin, L.Z.; Ou, L.J.; Xiao, W.P.; Huang, B.Q. Salinity threshold for phosphorus limitation in an estuary-coast continuum. Front. Mar. Sci. 2024, 11, 1437405. [Google Scholar] [CrossRef] [Scilit]
  48. Liu, Y.H.; Zhou, X.Y.; Niu, R.Y.; Yan, R.M.; Xu, S.S.; Guo, K.L.; Guo, J.; Tao, J.C.; Wu, S.; Hou, S.W. Serial nitrogen-phosphate co-limitation controls the primary productivity in the transitional waters of northern South China Sea and the Pearl River Estuary. Front. Microbiomes 2025, 4, 1655960. [Google Scholar] [CrossRef] [Scilit] [PubMed]
  49. Wang, X.D.; Li, C.L. Classification of zooplankton communities in the adjacent waters of the Changjiang River estuary based on data from 1998 to 2011. Mar. Sci. 2018, 42, 38–47. [Google Scholar] [CrossRef] [Scilit]
  50. Jiang, Z.B.; Chen, J.F.; Zhou, F.; Shou, L.; Chen, Q.Z.; Tao, B.Y.; Yan, X.J.; Wang, K. Controlling factors of summer phytoplankton community in the Changjiang (Yangtze River) Estuary and adjacent East China Sea shelf. Cont. Shelf Res. 2015, 101, 71–84. [Google Scholar] [CrossRef] [Scilit]
  51. Zhang, C.G.; Ma, J.; Han, D.Y.; Zhao, J. Ecological resilience enhanced by the Ten-Year Fishing Ban: Evidence from network-based analysis of fish community recovery in the Yangtze River Estuary. Reg. Stud. Mar. Sci. 2025, 91, 104534. [Google Scholar] [CrossRef] [Scilit]
  52. Chen, T.P.; Feng, S.; Xie, Y.C.; Wang, K.N.; Wang, X.H.; Zhao, J.Y.; Zhang, J. Ecological trade-offs in shallow lake restoration: Assessing ecosystem responses to aquatic vegetation restoration and biomanipulation strategies against the background of fishing ban. Ecol. Indic. 2025, 178, 113932. [Google Scholar] [CrossRef] [Scilit]
  53. Qin, B.; Dakos, V.; Cai, Y.J.; Zhao, Y.; Yang, X.D.; Zhang, E.L.; Wang, R. The past and potential antagonistic effects of fishing ban against nutrient loading control on eutrophication restoration in Lake Hongze. bioRxiv 2025. Available online: https://www.biorxiv.org/content/10.1101/2025.10.05.680530v1 (accessed on 11 July 2026).
  54. Zhang, C.G.; Wang, T.; Han, D.Y.; Zhao, J. Changes in fishery resources communities in the Yangtze River Estuary during the initial period of “10-Year Fishing Ban” on the Yangtze River. Acta Hydrobiol. Sin. 2025, 49, 133–143. [Google Scholar]
  55. Wang, S.Y.; Xiong, Y.; Zhang, H.S.; Song, D.D.; Wang, Y.P.; Ge, H.; Zhang, C.B.; Liang, L.; Zhong, X.M. Recovery of Coilia nasus resources after implementation of the 10-year fishing ban in the Yangtze River: Implied from the Yangtze River Estuary and its adjacent sea areas. Front. Mar. Sci. 2024, 11, 1474996. [Google Scholar] [CrossRef] [Scilit] [PubMed]
Figure 1. Distribution of sampling stations in the Yangtze River Estuary.Red dots are the locations of the survey station.
Fishes 11 00417 g001
Figure 2. PCA of environmental parameters in the Yangtze River Estuary in autumn.
Fishes 11 00417 g002
Figure 3. Spatial distribution of environmental parameters in the Yangtze River Estuary in autumn: (a) pH, (b) DO, (c) COD, (d) SS, (e) PO4-P, (f) DIN, (g) SiO3-Si, (h) Chla, (i) Temperature, (j) Salinity.
Fishes 11 00417 g003
Figure 4. Spatial distribution of plankton community composition in the Yangtze River Estuary in autumn: (a) phytoplankton; (b) zooplankton.
Fishes 11 00417 g004
Figure 5. RDA of plankton communities and environmental factors in the Yangtze River Estuary in autumn, (a) phytoplankton; (b) zooplankton.
Fishes 11 00417 g005
Figure 6. Spatial distribution of plankton diversity indices in the Yangtze River Estuary in autumn, (a) phytoplankton; (b) zooplankton.
Fishes 11 00417 g006
Figure 7. Correlations between plankton diversity indices and environmental factors in the Yangtze River Estuary in autumn: (a) phytoplankton; (b) zooplankton. (For the horizontal Mantel lines on the right, line length corresponds to the value of Mantel’s r, while line thickness indicates the correlation strength.)
Fishes 11 00417 g007aFishes 11 00417 g007b
Figure 8. TITAN of plankton community responses to nutrients in the Yangtze River Estuary in autumn: (af) Phytoplankton responses to DIN, PO4-P, and SiO3-Si; (gj) zooplankton responses to DIN, PO4-P, and SiO3-Si.
Fishes 11 00417 g008aFishes 11 00417 g008b
Table 1. Dominant plankton species in the Yangtze River Estuary in autumn.
GroupZoneSpeciesDominanceMean Density (Ind. m−3)
PhytoplanktonInner estuaryS. costatum0.122391,255.0
Estuarine zone0.122511,327.5
Offshore zone0.02164,621.3
ZooplanktonInner estuaryS. poplesia0.0251.2
S. sinensis0.0251.2
Estuarine zone///
Offshore zoneE. subcrassus0.0304.1
Note: “/” indicates no species with dominance > 0.02.
Table 2. Comparison of phytoplankton community structure in the Yangtze River Estuary in autumn before and after the fishing ban.
MetricPre-Ban 2004 [28]Pre-Ban 2005 [29]Pre-Ban 2006 [30]Pre-Ban & First-Year Ban (2009–2021) [31]Post-Ban (2024) (This Study)
Species richness68/11156113
Mean density (cells·m−3)1.40 × 1075.00 × 1057.34 × 1061.86 × 1052.20 × 105
Margalef index (D)1.18//1.077.12
Shannon–Wiener index (H′)1.900.73/0.731.24
Pielou evenness (J)0.680.29/0.300.26
Primary dominantS. costatumS. costatumS. costatumS. costatumS. costatum
Note: “/” indicates data not available.
Table 3. Comparison of zooplankton community structure in the Yangtze River Estuary in autumn before and after the fishing ban.
MetricPre-Ban 2005 [33]Pre-Ban 2006 [30]Pre-Ban 2007 [32]Pre-Ban & First-year Ban (2009–2021) [31]Post-Ban (2024) (This Study)
Species richness8760/3860
Mean density (ind.·m−3)55.20101.44158.709.4540.51
Margalef index (D)//7.882.488.27
Shannon–Wiener index (H′)2.70/2.521.532.47
Pielou evenness (J)//0.770.650.60
Primary dominantT. vermiculusT. vermiculusE. subcrassusT. vermiculusE. subcrassus
Note: “/” indicates data not available.
Disclaimer/Publisher’s Note: The statements, opinions and data contained in all publications are solely those of the individual author(s) and contributor(s) and not of MDPI and/or the editor(s). MDPI and/or the editor(s) disclaim responsibility for any injury to people or property resulting from any ideas, methods, instructions or products referred to in the content.