1. Introduction
Zebrafish (
Danio rerio) is a common biomedical model used in developmental biology, genetics, regeneration, and many other fields. It has also been officially adopted by the OECD (Organization for Economic Co-operation and Development) as a toxicological model (fish embryo acute toxicity test: FET) [
1,
2,
3]. One practical advantage is that, in Europe, zebrafish developmental stages are not legally covered by animal experimentation laws until independent feeding, which facilitates research on early development—even though a standardised framework has long been missing [
4].
Zebrafish develop extremely fast: within five days, they go from a gamete to a larva capable of finding and eating food, with most systems (including circulatory and digestive) already formed [
5]. Genes tightly regulate this process—metabolism rates, cell division, differentiation, death, and protective mechanisms are all under transcriptional control. Importantly, some genes can respond almost instantly to environmental or chemical signals. These are known as immediate-early genes (IEG, e.g.,
c-fos,
jun), which are activated within minutes without requiring new protein synthesis [
6]. Their rapid transcriptional action makes them highly sensitive indicators of cellular stress or disturbance, including that caused by anaesthetics or euthanasia agents.
Developmental stages are highly responsive to environmental and parental conditions, which drive adaptive plasticity. Husbandry and experimental protocols are therefore key determinants of developmental integrity, yet they are rarely well standardised, and their biological effects remain largely unknown [
7]. The assumption that a given protocol has the same effect across all stages is not plausible. Epithelial permeability, respiration (cutaneous vs. branchial), ion regulation, metabolic rate, and nervous or neuroendocrine systems undergo profound changes in just a few days [
5,
8,
9]. Consequently, cell sensitivity, transcriptional responses, and even the efficacy of chemical euthanasia differ with developmental stage [
10,
11,
12,
13].
Chemical euthanasia is commonly performed on the developmental stage of zebrafish for husbandry routines and also for experimental endpoints [
10,
11,
14]. The most common anaesthetic used in zebrafish is tricaine-MS-222, but it has been shown to be not totally effective for all developmental stages. Two other standard anaesthetics used to perform chemical euthanasia are clove oil and lidocaine, but their efficacy also varies [
10].
As chemical anaesthetic efficiency can differ depending on pH, solvent, drug concentration, buffering conditions, and other formulation or water chemistry factors, the biological effects of each operational protocol need to be characterised rather than assumed to be universal. Such formulation-aware interpretation is particularly relevant in fish, where anaesthetic performance is sensitive to water chemistry, and where pH-dependent physiological responses have been reported during essential-oil anaesthesia [
15,
16]. Because anaesthetic effects are dose- and context-dependent, the same compound may produce sedation, anaesthesia, or lethal effects depending on concentration, exposure duration, and developmental stage [
11].
This is particularly relevant when molecular samples are collected during or immediately after exposure, because the procedure itself may alter transcriptional readouts. Small differences in formulation or exposure conditions may therefore change both the biological effect of the anaesthetic and the molecular state captured at sampling. We therefore need to explore the effects of specific euthanasia protocols—such as those proposed by Mocho et al. [
10]—on embryos and larvae up to 4 days, using a stage-specific approach, especially considering that immediate-early genes could be triggered by the procedure itself [
6]. Because early stages are not legally protected, they are often used without a deep assessment of how euthanasia itself may alter transcriptional or physiological readouts [
12,
13]. Therefore, a stage-specific approach is necessary to explore the effects of euthanasia protocols and their possible implications for experimental results [
10].
We selected ten genes covering immediate-early activation (
c-fos [
17]), cellular stress (
hsp70 [
18]), energy metabolism (
ampk [
19],
sirtuin [
20]), neuroendocrine signalling (
crh,
gr [
8,
21]), apoptosis (
caspase3 [
22]), inflammation (
il1β [
23]), stress kinase signalling (
jnk [
24]) and morphogenesis (
shh [
25]). These markers were used to explore acute transcriptional changes associated with exposure to operational euthanasia formulations across developmental stages and exposure times. Most prior studies examined these markers in isolation, at a single stage.
Here, we tested the hypothesis that developmental stage modulates not only expression but also the magnitude and selectivity of acute transcriptional responses to operational euthanasia formulations. The objective of this study was to determine whether acute transcriptional profiles induced by commonly used operational chemical euthanasia formulations (tricaine, lidocaine, and clove oil) differ across zebrafish developmental stages and exposure times. We explicitly evaluated complete formulations as used in practice, including ethanol vehicles where required, rather than isolated active compounds. We used a unified three-way factorial model with HC3-robust inference and global FDR (false discovery rate) correction.
2. Materials and Methods
2.1. Zebrafish Husbandry and Embryo Production
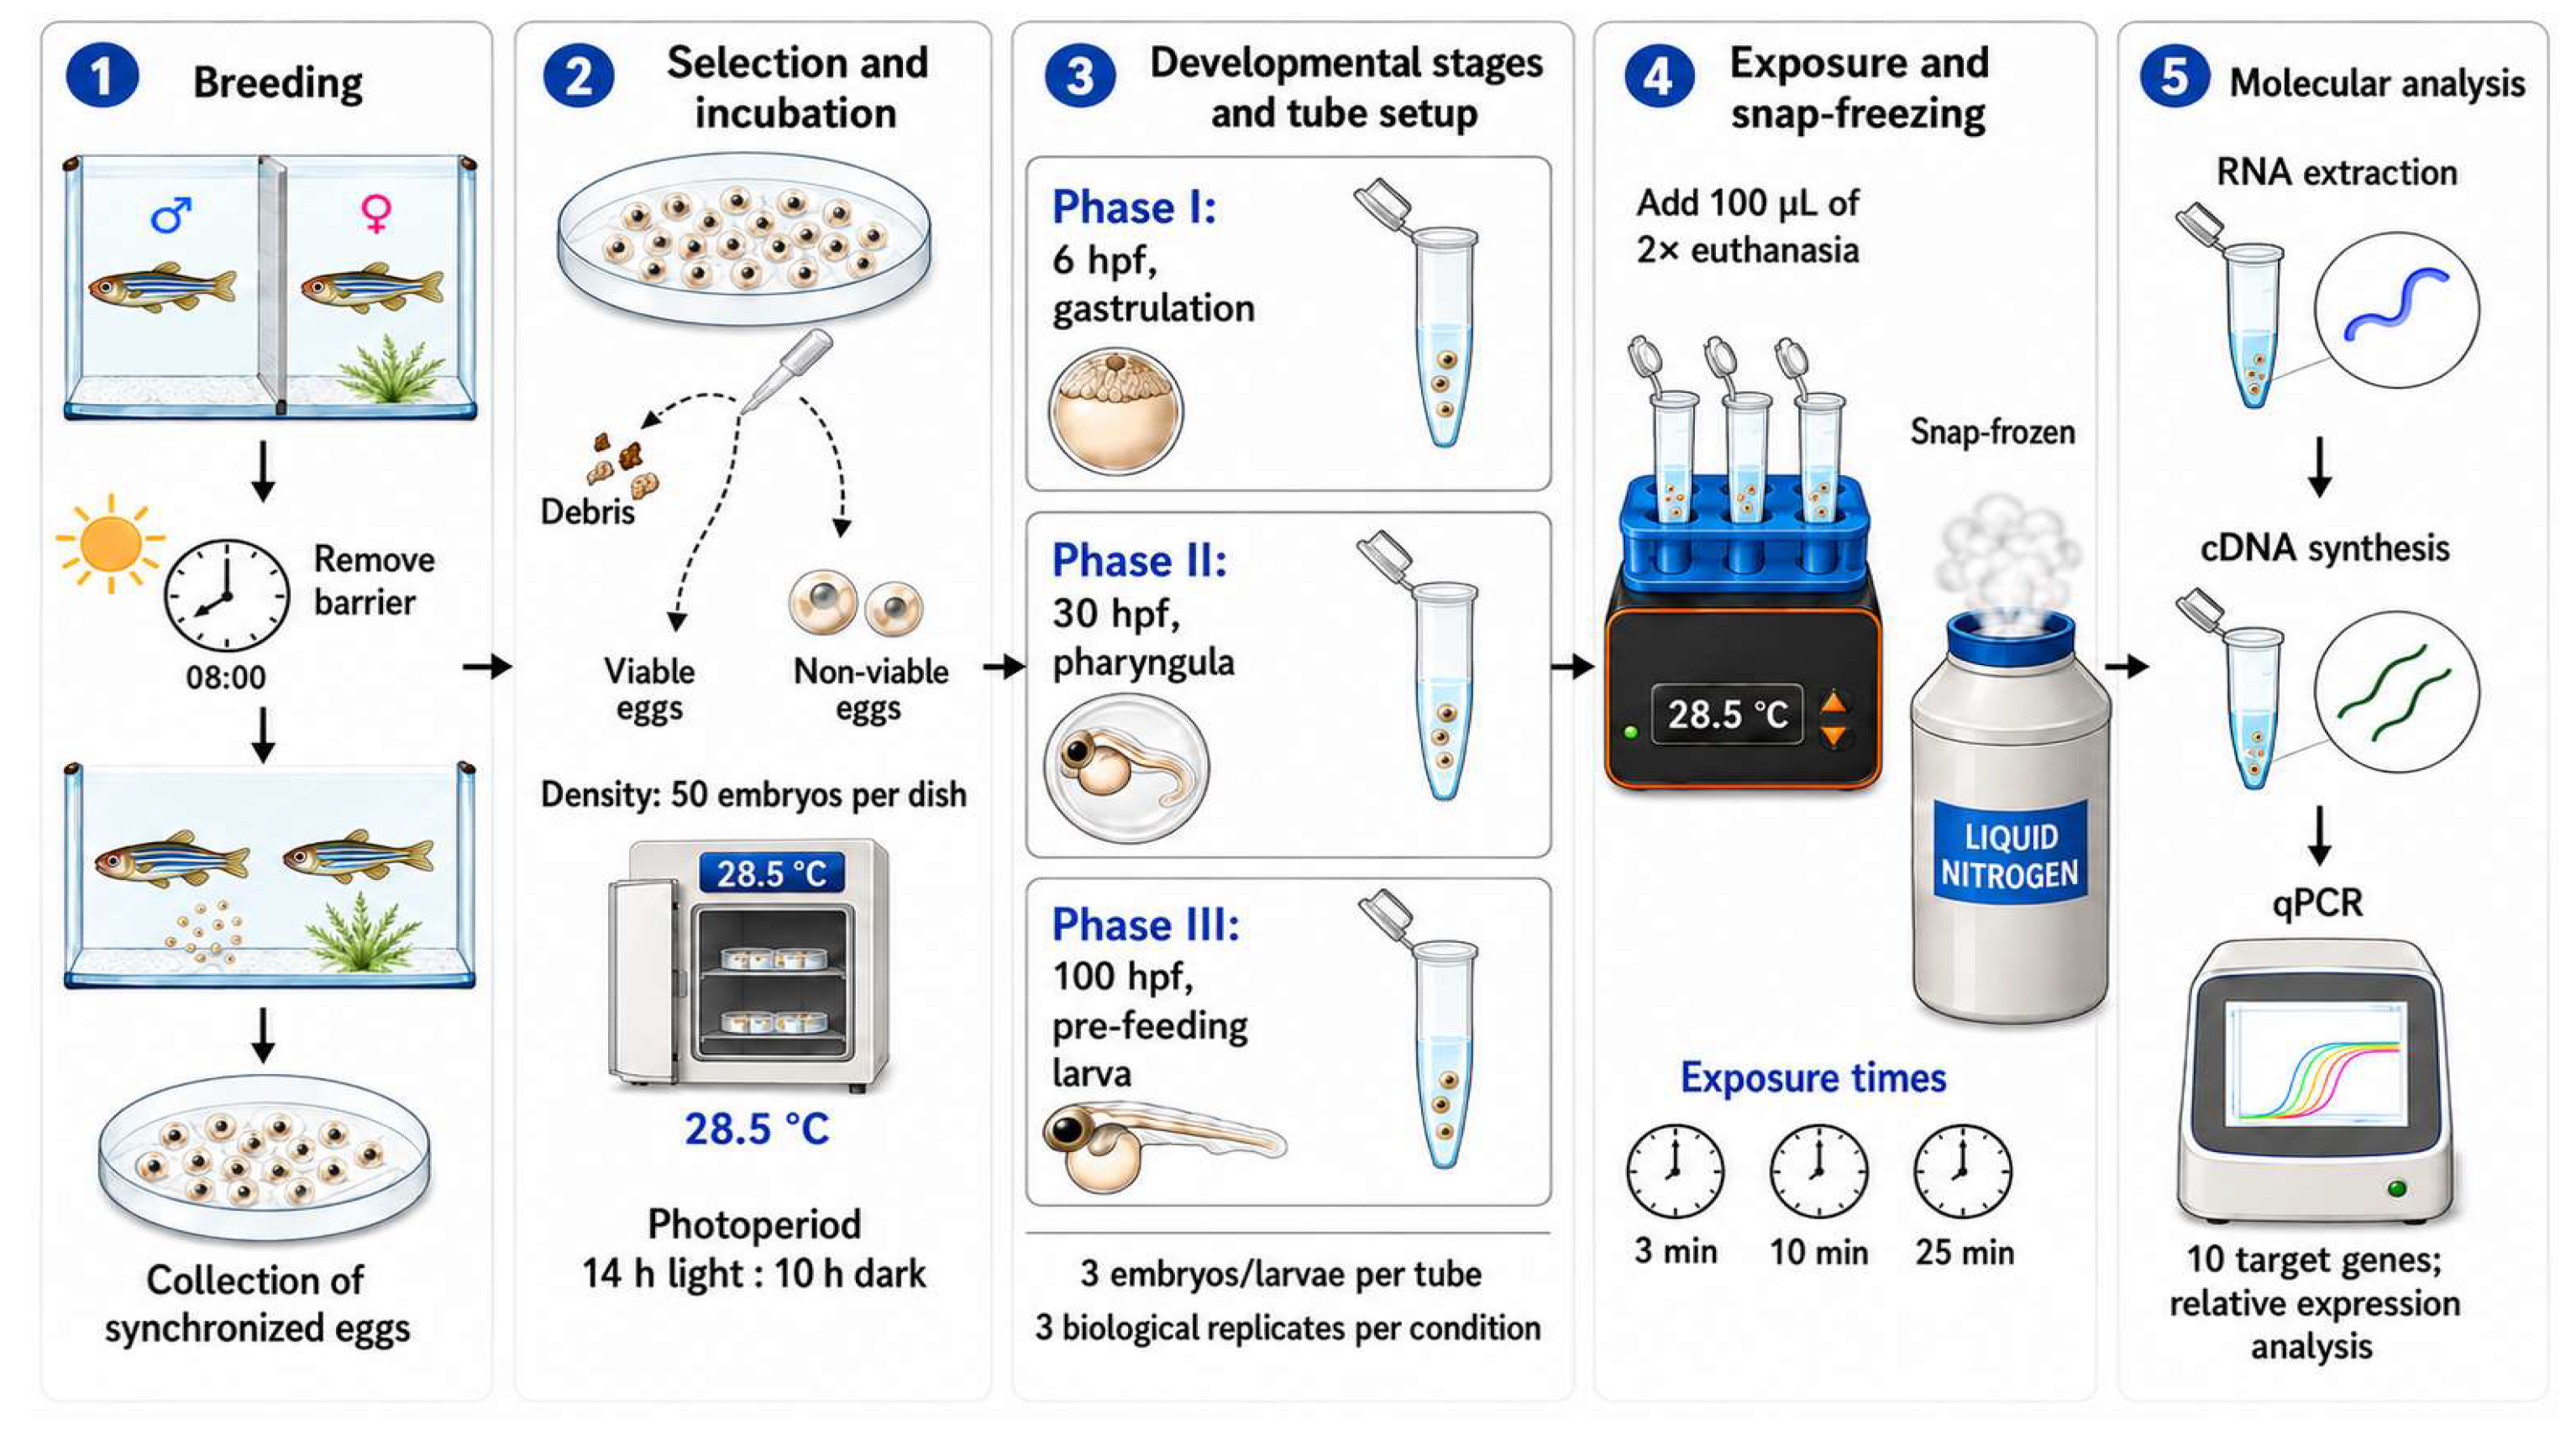
Embryos were obtained from a wild-type colony of 1-year-old (1.25 ± 0.25 g) kept in an AquaneeringTM (San Diego, CA, USA) recirculation system (RAS). Zebrafish were kept under standard conditions: 20 fish in a 2.8 L tank, temperature: 27 ± 1° C, pH 7.5 ± 0.5, O2 > 80%, conductivity 900 ± 300 µS/cm, and photoperiod 14 h light: 10 h dark. The broodstock was fed twice daily with SparosTM (Olhao, Portugal) pellets and Inve Artemia salina (Dendermonde, Belgium) once per day. In order to obtain synchronised eggs, individual crosses (1 male: 1 female) were set with a barrier that was removed to allow spawning at light onset (08:00 h). Breeding pairs were randomly selected from the colony and used only once per spawning event to minimise parental bias.
Synchronised eggs were collected, and all the debris and non-viable eggs were removed by pipetting. The viable eggs were randomly mixed and placed in a Petri dish (9 cm diameter) with water from the fish system filtered at 20 µm and disinfected using a 550 W UV (ultraviolet) lamp, and at a density of 50 eggs per dish, to minimise density-related variability. To control environmental conditions, Petri dishes with eggs were placed in an incubator, under a controlled temperature of 28.5° C and a photoperiod (14 light: 10 dark). Each day, every Petri dish was cleaned with a 3 mL plastic Pasteur pipette, removing chorions, debris, and dead embryos. After cleaning, a total of 10 mL of water was removed and replaced with fresh water, with the same parameters. No significant numbers of non-viable embryos were detected (no more than 2 embryos on each). A visual confirmatory test of the developmental stage was performed before setting experimental conditions. The experimental timepoints were selected following staging established by Kimmel et al. in hours post fertilisation (hpf) [
5]: Phase I (6 hpf, gastrulation), Phase II (30 hpf, pharyngula), and Phase III (100 h, pre-feeding larva). Phase I and Phase II embryos retained the chorion at the time of treatment, whereas Phase III organisms were treated as hatched pre-feeding larvae. Hatching rate was not quantified as a formal endpoint, and compound entry across the chorion or internal tissue concentrations of the active compounds were not measured.
2.2. Euthanasia Formulations and Exposure
Three prefixed formulations were selected as their efficiency has been previously studied at the three developmental stages, and their main active compounds are the three most commonly used at zebrafish facilities. Each formulation required different buffering and solutions, as their main active compounds have different solubility and pKa values [
15,
16]. Tricaine methanesulfonate /MS-222 (Sigma Aldrich, Saint Louis, MO, USA), lidocaine hydrochloride (Sigma Aldrich, Saint Louis, MO, USA), and clove oil/eugenol-based anaesthetic (Sol Natura, Barcelona, Spain) were used to prepare the operational euthanasia formulations. Sodium bicarbonate (Sigma Aldrich, Saint Louis, MO, USA), sodium chloride (Sigma Aldrich, Saint Louis, MO, USA), and ethanol (Sigma Aldrich, Saint Louis, MO, USA) were used for buffering, osmotic adjustment, or solubilisation as required. All the solutions were made using reverse osmosis water, with <10 µS/cm. Final formulations are shown in
Table 1. A control group was established, adjusting pH and conductivity to the water; however, because the operational formulations differed in buffering and vehicle composition, formulation-related physicochemical effects cannot be fully separated from active-compound effects.
The three different protocols were previously tested to check their efficiency, checking visible malformations and coagulations that started at 30 min, and their capacity to induce acute transcriptional responses during exposure. Final exposure concentrations correspond to those described by Mocho et al. [
10]. Because embryos were maintained in 100 µL prior to treatment, euthanasia solutions were prepared at double (2×) concentration and mixed 1:1 (
v/
v) to reach the intended final exposure concentrations. The 3, 10, and 25 min points were selected to sample an acute operational exposure window before gross morphological deterioration observed beyond this range, rather than to verify euthanasia endpoints. These sampling times were not selected as predefined confirmation points for euthanasia; snap-freezing for molecular sampling was performed after exposition time.
2.3. Experimental Design
A pre-test determined that three larvae per tube was optimal, as any escape response was seen after hatching. The experimental unit was one tube containing three embryos/larvae, with three independent biological replicates per condition (n = 3). This replication level was selected as a feasible exploratory qPCR design across the full factorial structure, balancing biological replication, sample availability, and the practical constraints of processing synchronised embryos/larvae across multiple stages, formulations, and exposure times. The upper exposure window was limited to 25 min based on preliminary observations showing gross morphological deterioration beyond this range. These observations were used only to define the sampling window and were not treated as formal endpoint verification.
Embryos were randomly allocated to treatment groups using a predefined randomised distribution scheme. For the experiment, three embryos or larvae were placed in each 1.5 mL Eppendorf tube by gentle handling with a plastic Pasteur pipette. Tubes were normalised to an initial volume of 100 µL of system water before treatment administration.
Euthanasia solutions were prepared at double (2×) the target final concentration, and 100 µL were added to each tube (1:1 v/v), resulting in a final volume of 200 µL and achieving the intended exposure concentration.
To minimise thermal variability during preparation, tubes were placed in a plastic rack over a thermal blanket. A standardised 5 s interval was maintained between consecutive administrations. All euthanasia solutions were previously equilibrated to the incubation temperature and gently administered using an automatic pipette to avoid mechanical disturbance and to ensure proper homogenization.
Three time points (3, 10, and 25 min) were tested for each of the three developmental stages, with three biological replicates per condition. Embryos were incubated at 28.5 °C until the selected developmental windows: 6 hpf for Phase I/gastrulation, 30 hpf for Phase II/pharyngula, and 100 hpf for Phase III/pre-feeding larvae. The study protocol was not registered prior to the experiments.
Samples were snap-frozen in liquid nitrogen immediately after exposure without removing the euthanasia solution to preserve transcriptional status at the sampling time. Samples were kept at -80 °C until gene expression analysis. Due to the objective nature of molecular endpoints and automated qPCR quantification, blinding during data acquisition was not implemented. However, sample handling and analysis were performed following standardised procedures to minimise operator-related variability (
Figure 1).
2.4. RNA Extraction, Quality Control and qPCR
Total RNA was extracted using an automated extraction platform (Applied Biosystems, Waltham, MA, USA) according to the manufacturer’s instructions. RNA quantity and purity were assessed using a NanoDrop ND-2000 spectrophotometer (Thermo Fisher Scientific, Waltham, MA, USA), and RNA integrity was evaluated in a subset of samples using a Bioanalyzer, with RIN (RNA integrity number) values >7.5. cDNA (complementary DNA) was synthesised from 2 µg of total RNA using the High-Capacity cDNA Reverse Transcription Kit (Applied Biosystems, Waltham, MA, USA), and cDNA samples were stored at −20 °C until analysis.
Gene expression was analysed for markers related to immediate-early activation (
c-fos), cellular stress (
hsp70), energy metabolism (
ampk,
sirtuin), neuroendocrine signalling (
crh,
gr), apoptosis (
caspase3), inflammation (
il1β), MAPK signalling (
jnk) and developmental signalling (
shh). qPCR was performed using iTaq Universal SYBR Green Supermix (Bio-Rad, San Francisco, CA, USA) on a CFX384 Touch Real-Time PCR Detection System (Bio-Rad, San Francisco, CA, USA), with technical duplicates for each reaction. Thermal cycling conditions were 95 °C for 3 min, followed by 40 cycles of 95 °C for 30 s and 60 °C for 30 s. Melting curve analysis confirmed amplification specificity. Primer sequences, amplicon sizes, and efficiencies are provided in
Supplementary Table S1.
Relative expression was calculated using the Pfaffl method. Normalisation used the geometric mean of three reference genes,
EF1α,
β-actin, and
18S. Reference-gene Cq (quantification cycles) distributions are summarised in
Supplementary Table S2.
2.5. Data Processing and Statistical Analysis
For each gene, log2-scale expression response values were analysed using a factorial framework including developmental phase, formulation and exposure time as categorical predictors. Phase (I, II, III), Treatment (control, clove oil, tricaine/MS-222 and lidocaine) and Time (3, 10 and 25 min) were treated as categorical factors. Categorical factors were coded using sum-to-zero contrasts for Type III inference. Type III tests were performed using ordinary least-squares models with HC3-robust covariance estimation, or HC1 when HC3 was inestimable, to reduce sensitivity to heteroscedasticity. Benjamini–Hochberg false discovery rate correction was applied globally across the primary gene-by-term tests.
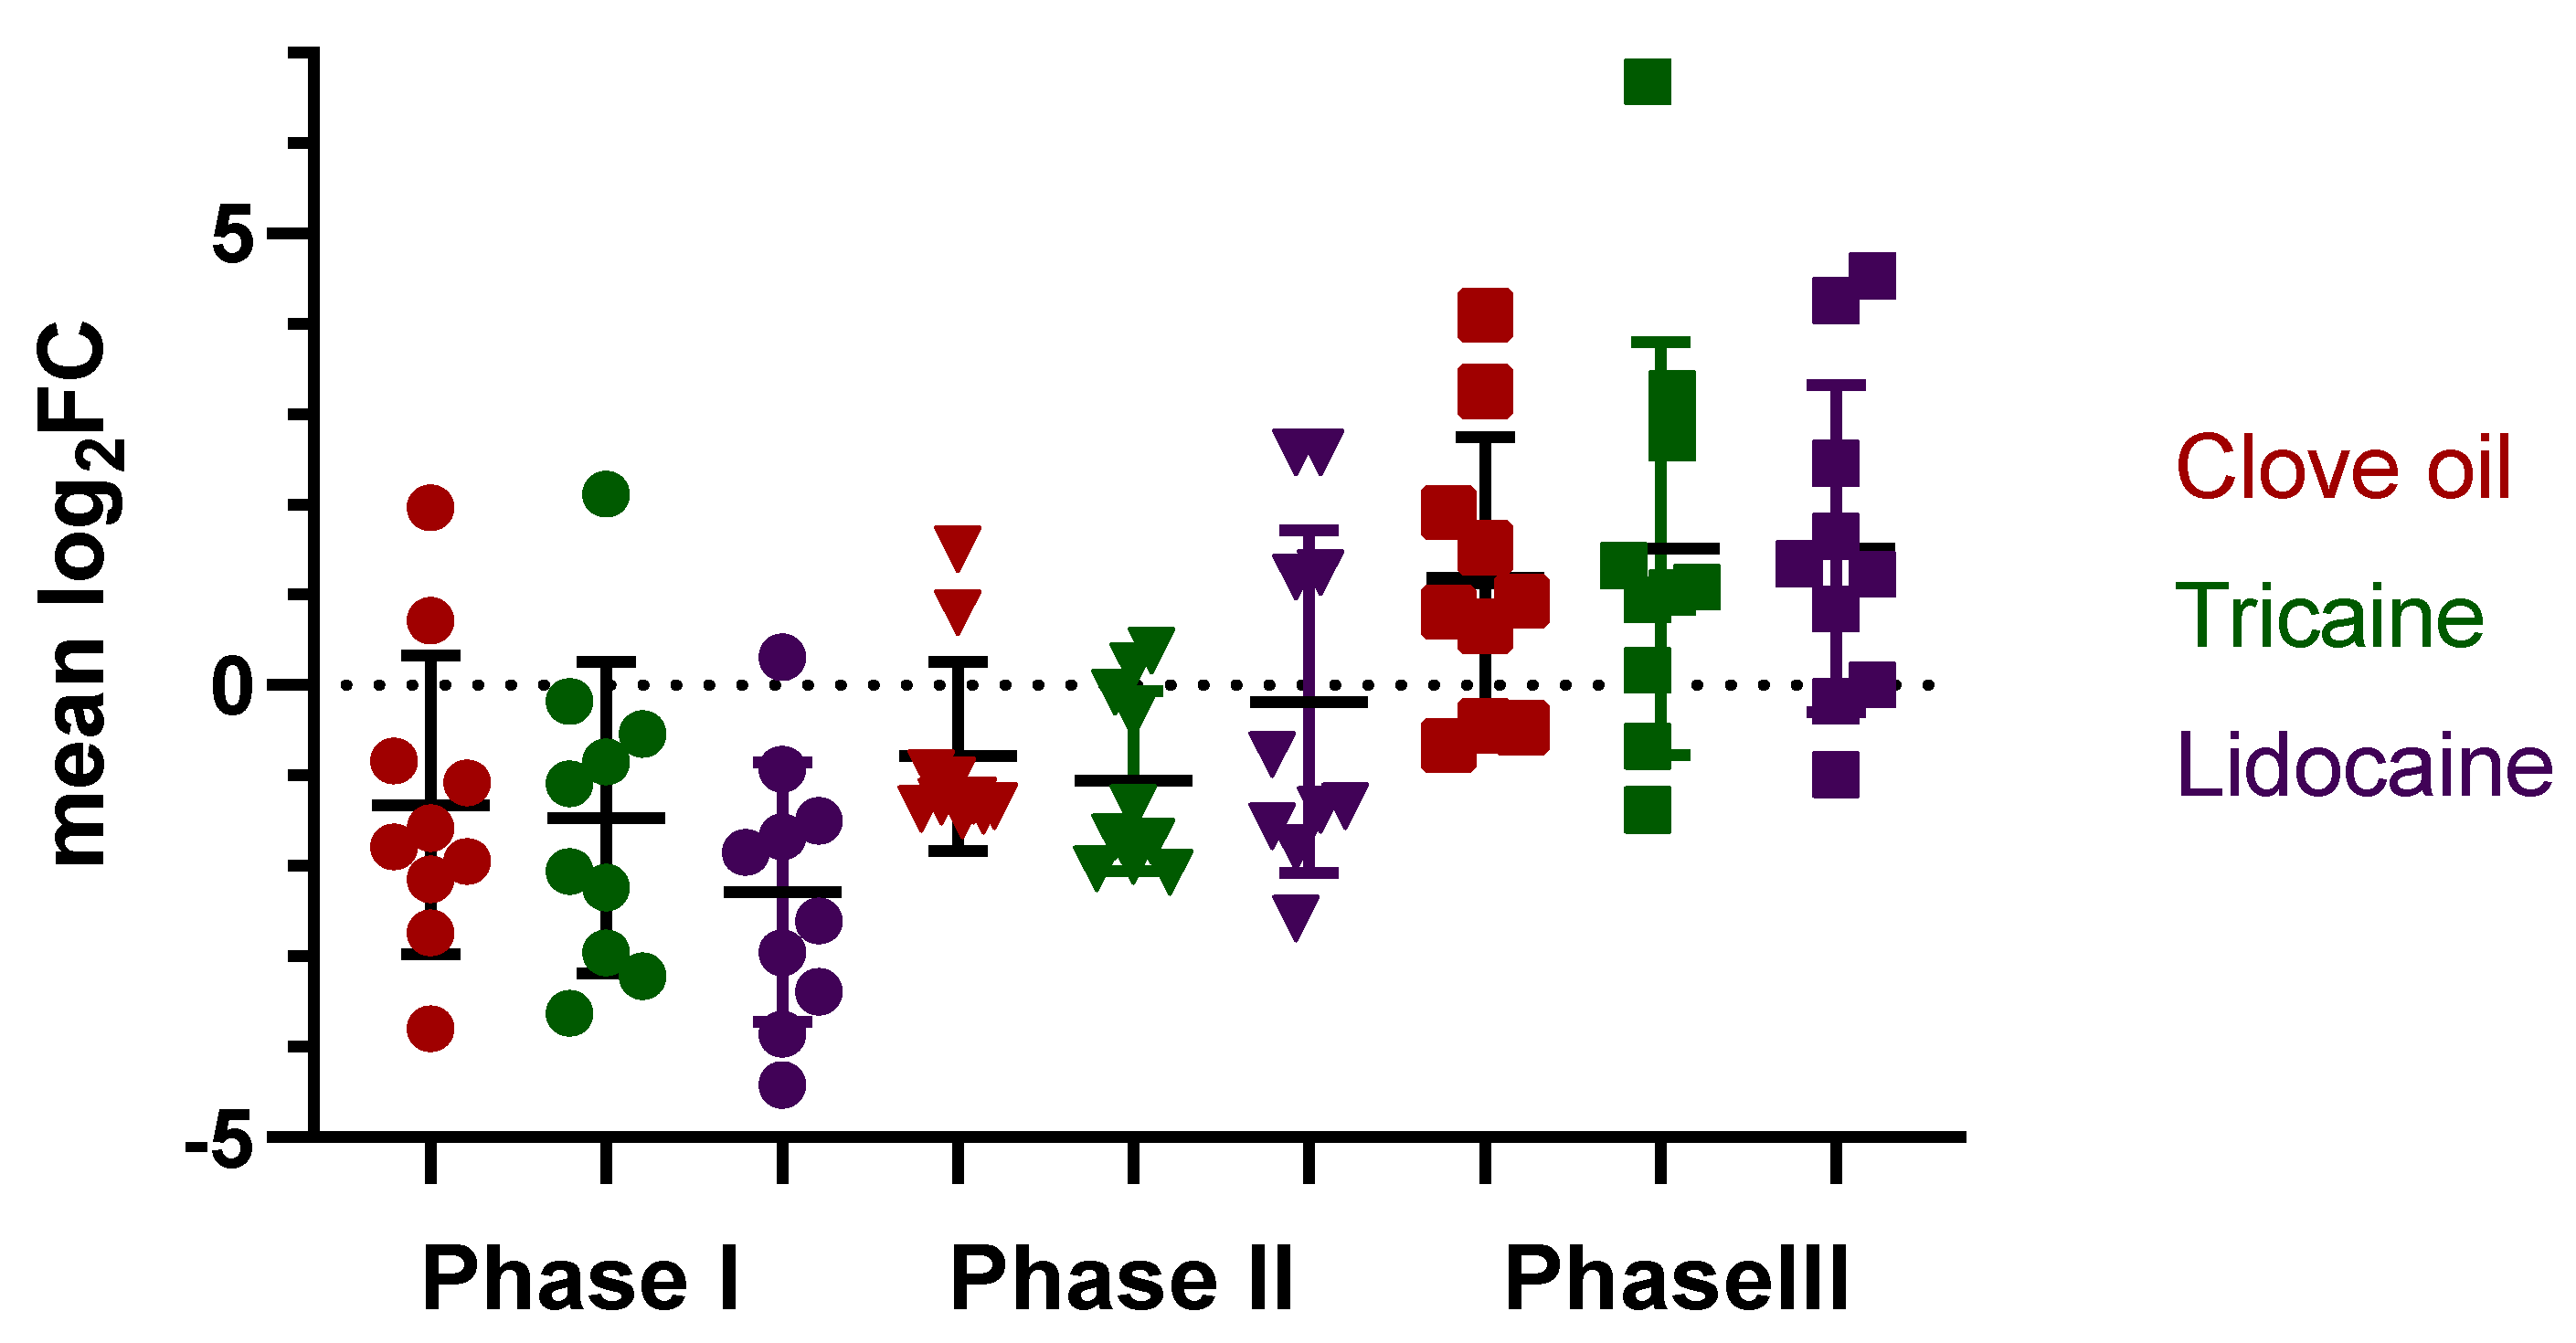
Model-based contrasts and descriptive summaries were used to visualise the structure and magnitude of transcriptional profiles. Mean log2FC summaries were treated as descriptive outputs only and were not interpreted as additional inferential tests or as formulation rankings.
4. Discussion
The present study explores the transcriptional response of three operational chemical euthanasia formulations in early development stages of zebrafish. The main message is not that one formulation is universally associated with a smaller molecular footprint. Rather, the central pattern is that the transcriptional footprint is related to the developmental stage. Within each developmental phase, responses tended to follow a stage-specific biological context, suggesting that ontogeny constrained the transcriptional profile associated with each formulation. The main recurrent signal was the Phase × Treatment interaction, whereas treatment main effects did not support a stable cross-stage ranking after accounting for the interaction structure. Although the formulations differed in their active anaesthetic compounds and physicochemical composition, our transcriptional panel was not designed to resolve mechanisms of action [
26,
27]. The observed signatures should therefore be interpreted as formulation- and stage-associated profiles rather than mechanistic pathways.
In fish, the relationship between anaesthesia and euthanasia is dose-, time-, species-, and stage-dependent rather than categorical. The same compound may produce light sedation, surgical anaesthesia, immobilisation, or death depending on concentration, exposure duration, water chemistry, and developmental stage. Therefore, chemical euthanasia by anaesthetic overdose should be interpreted as an operational protocol whose biological effect depends on the complete exposure context, not simply as the application of a single active ingredient. This distinction is particularly important for embryos and larvae, where drug entry, physiological maturity, and endpoint verification may differ markedly across developmental windows.
The tested protocols differed not only in active compound but also in vehicle and buffering conditions. Clove oil and lidocaine formulations contained ethanol, whereas tricaine/MS-222 did not. These formulation differences are biologically relevant because anaesthetic performance in fish is shaped by the interaction between the compound and the exposure medium, including pH, buffering capacity, vehicle composition, and nominal drug concentration [
15,
16]. Therefore, ethanol should be considered part of the complete operational formulation rather than treated as an isolated explanatory variable. Because solvent-matched controls were not included, the present design cannot formally separate active-compound-, vehicle-, buffering-, ethanol-, and pH-related effects. Accordingly, the results should be interpreted as responses to complete operational formulations, not to isolated active ingredients.
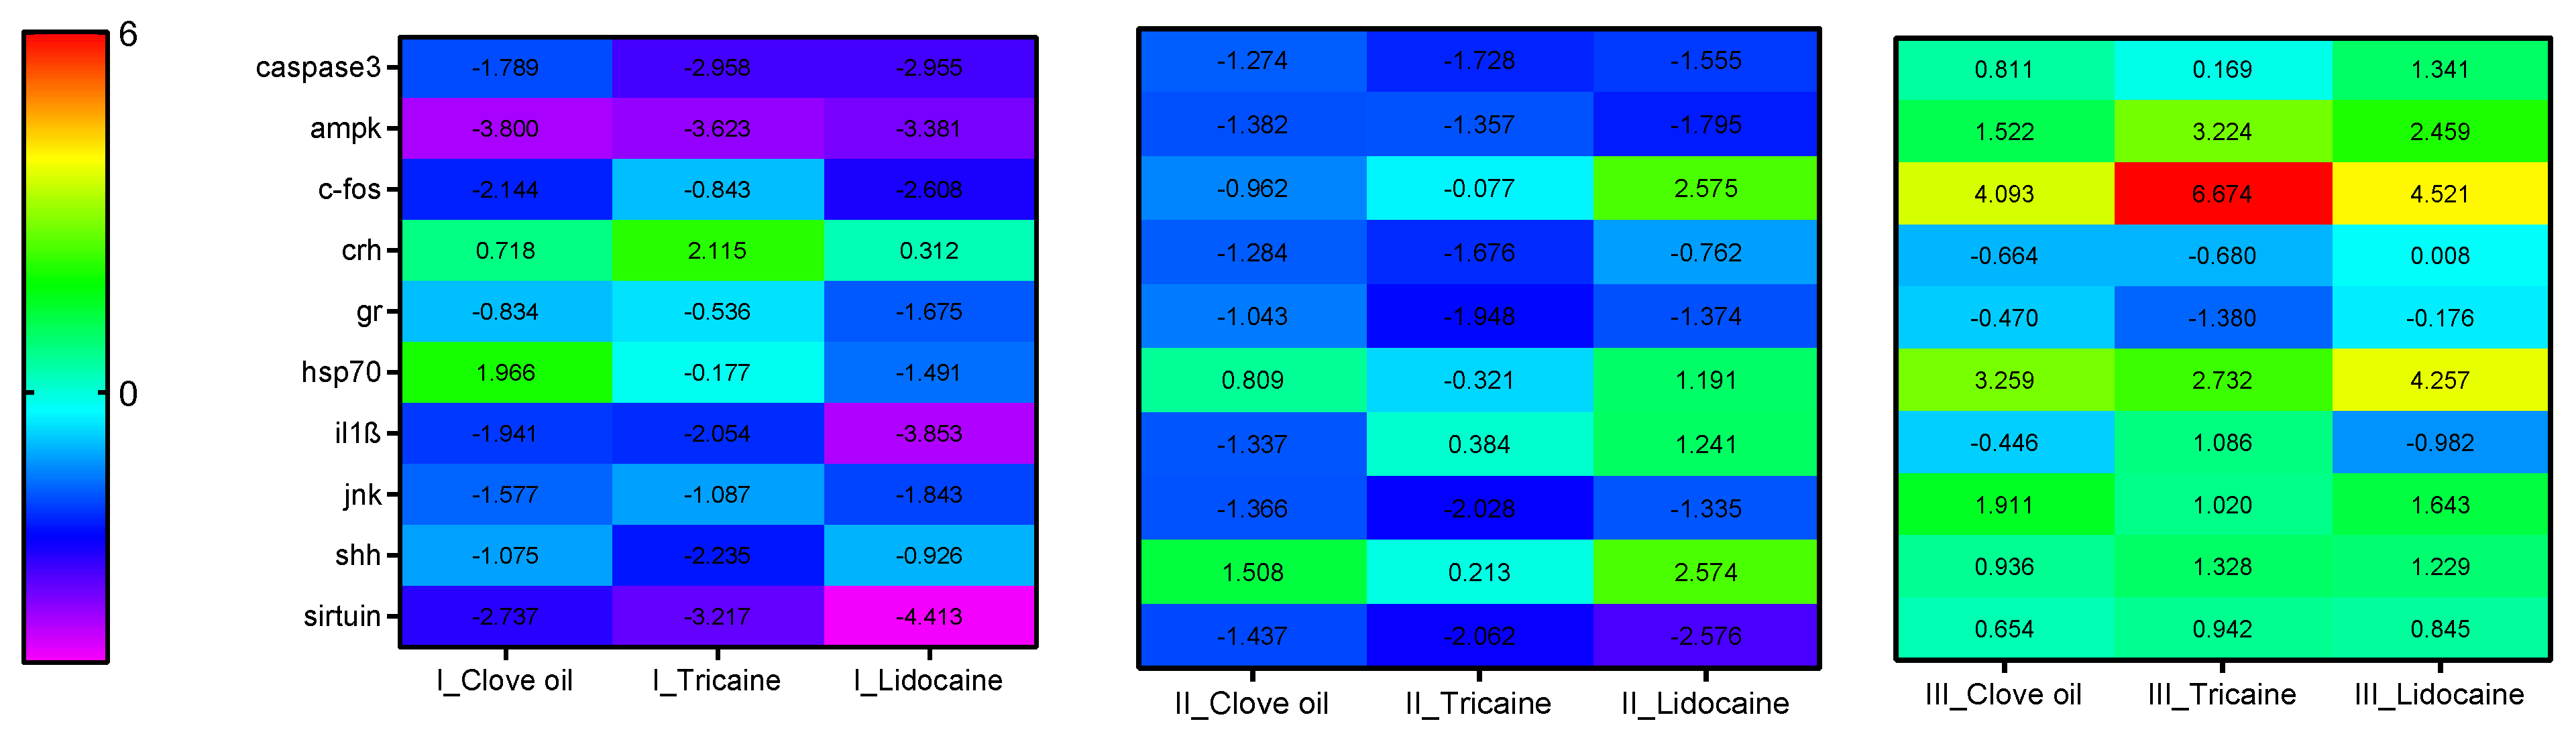
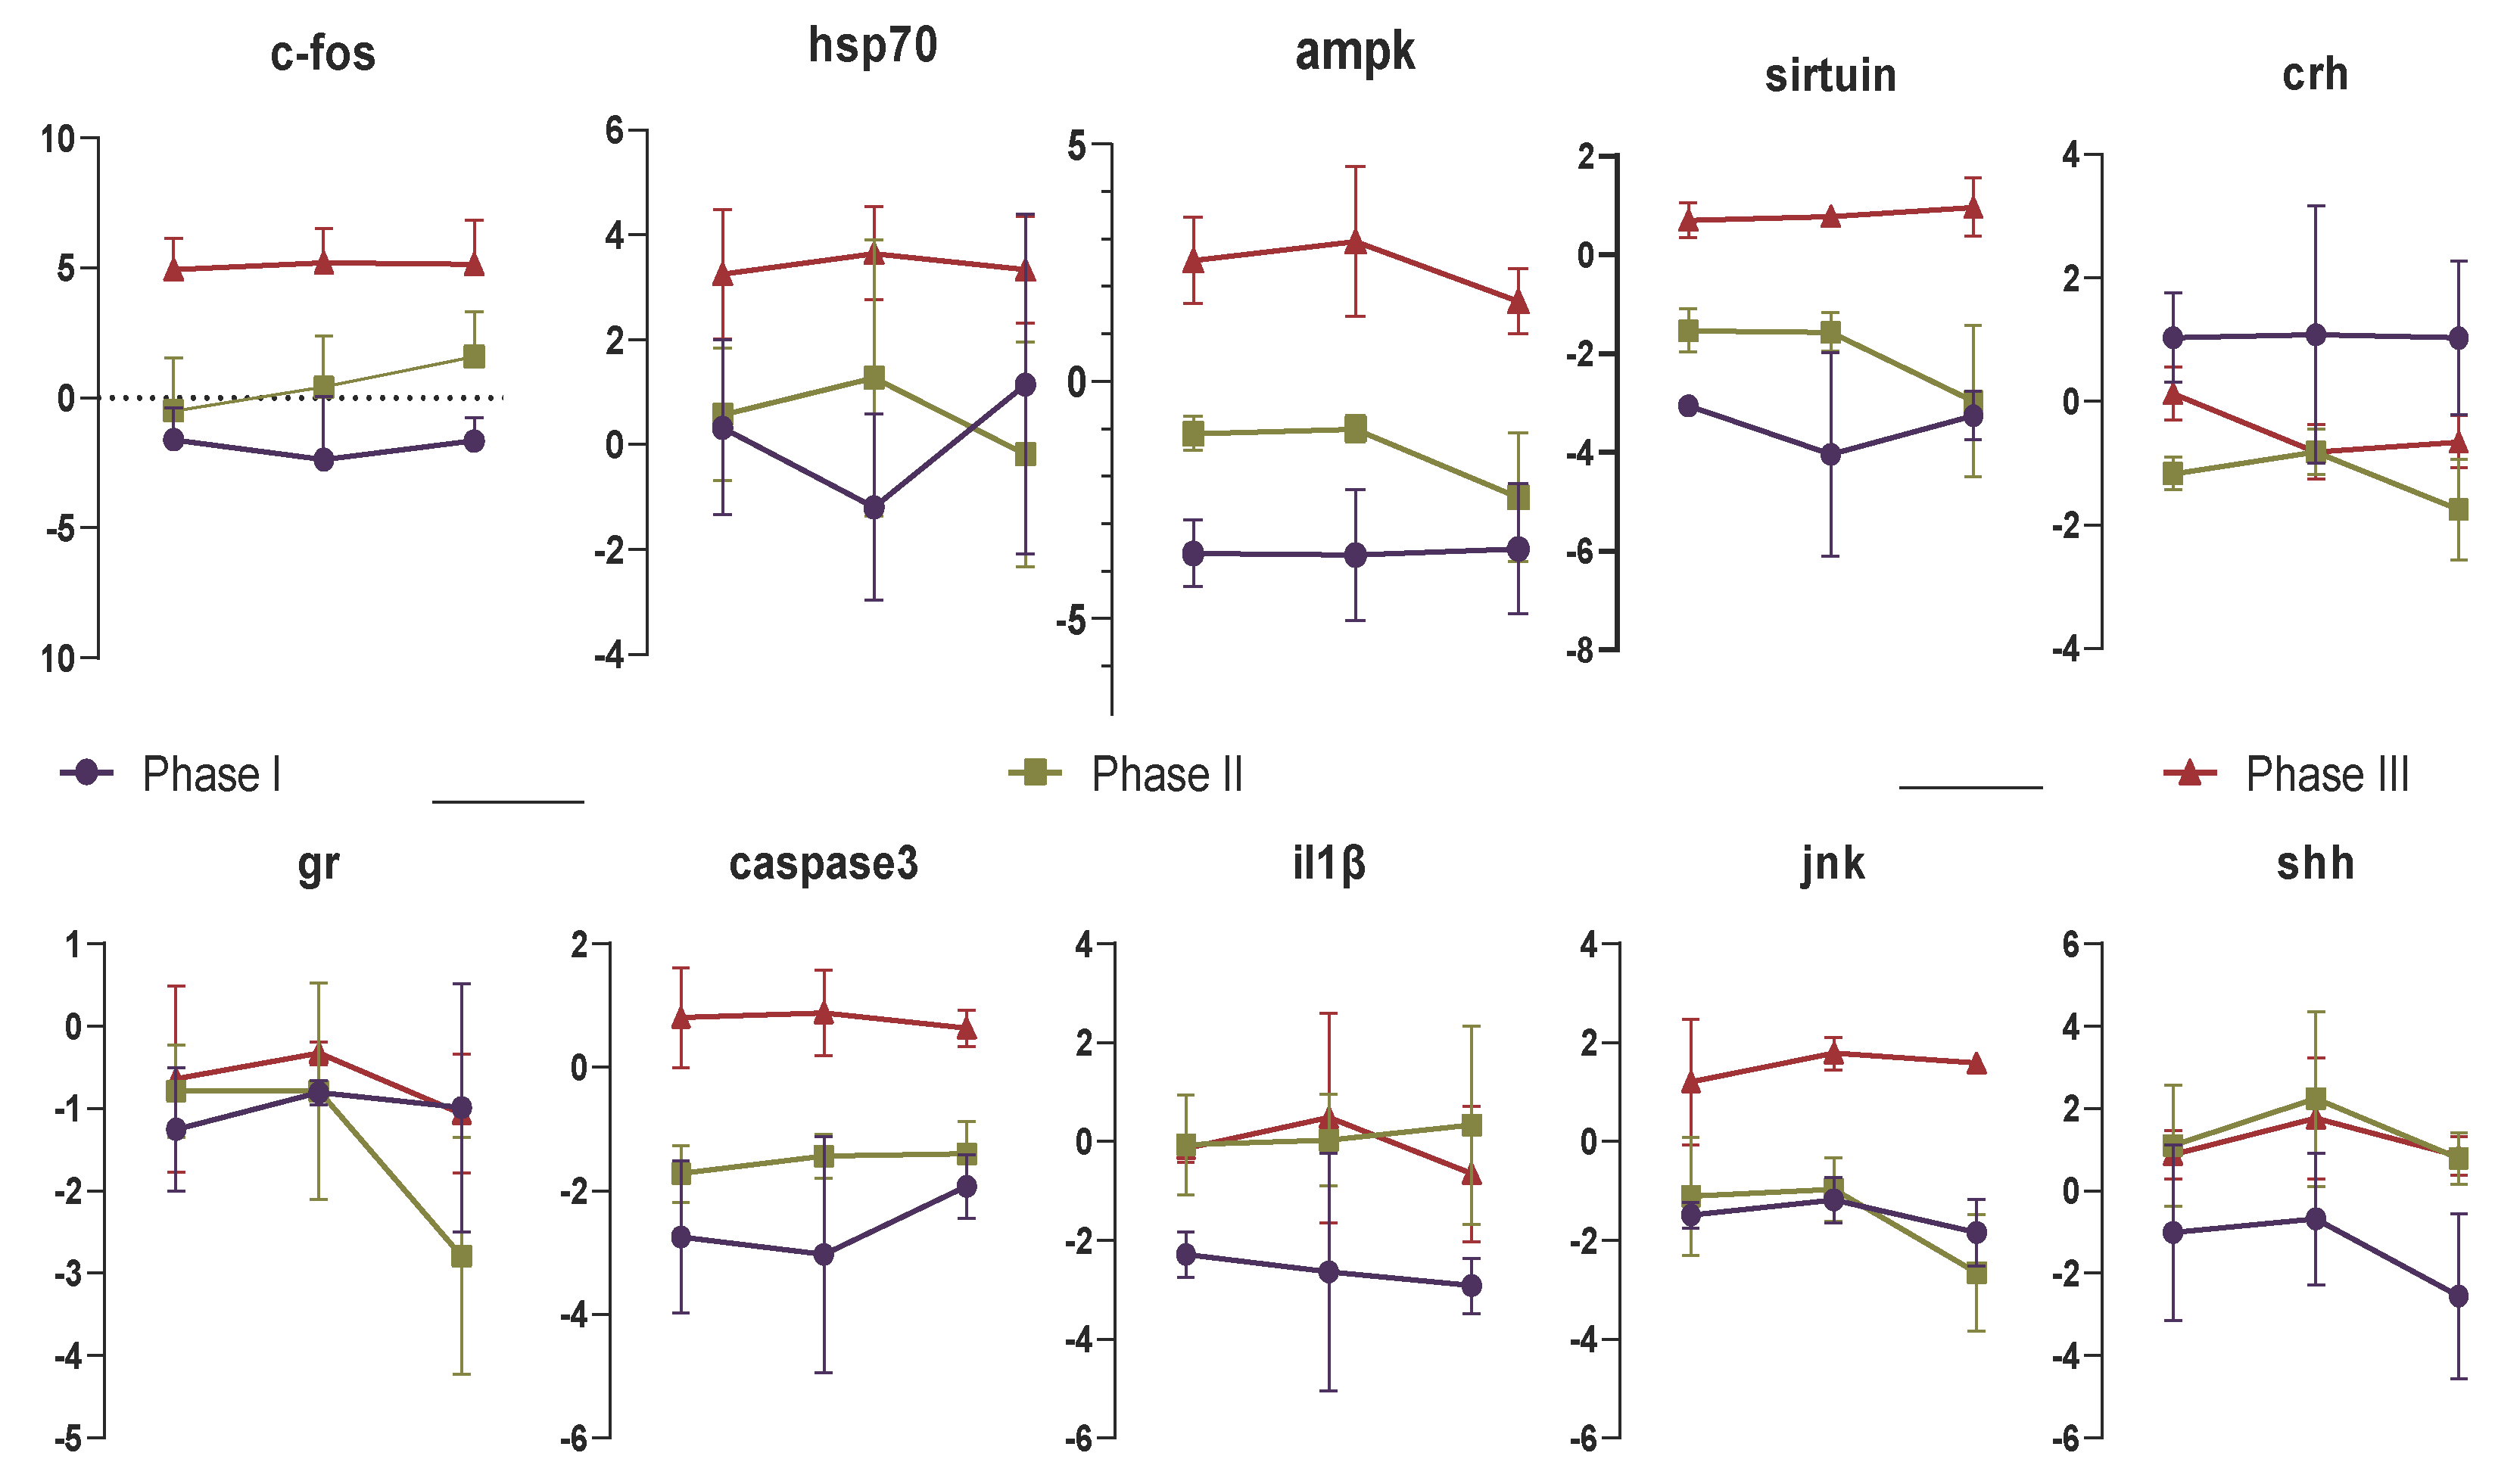
Developmental stages of zebrafish showed distinct transcriptional profiles after exposure to the operational euthanasia formulations. At gastrulation, the transcriptional response shows a general downregulation, rather than a specific activation of pathways or genes. In phase II, the pattern becomes more selective, with strong modulation in individual markers, but without a uniform response or damage pathway activation. In phase III larvae, several genes showed upregulation, including markers of cellular stress and neuronal activation.
These ontogeny patterns are consistent with the rapid biological transition from early embryogenesis to a physiologically more complex larval stage [
5,
10,
28]. At gastrulation, classical neural targets of anaesthetic action are not yet functionally mature; therefore, Phase I responses should not be interpreted as evidence of neuronal anaesthetic effects, but rather as early embryonic transcriptional responses potentially related to developmental signalling, cellular stress, metabolic disruption, or general transcriptional modulation. As the embryo develops, more homeostatic functions are developed and specifically regulated, as organs and physiological regulations develop. These events also affect gene function, for example
gr, which is related in adults with HPI (hypothalamic–pituitary–interrenal) axis and stress response, in early developmental stages, and regulates mesoderm, somitogenesis, and eye formation [
8,
9]. So, interpreting transcriptional response should also be stage-specific, taking into account the specific moment and function that genes are performing. These also have stage-specific implications if we are going to target specific genes. Gene selection should therefore be stage-specific, because markers cannot always be translated directly from adult stress or welfare paradigms.
Euthanasia protocols are intended to achieve rapid humane killing while minimising avoidable biological activation [
10]. Previous behavioural studies indicate that anaesthetic and euthanasia formulations can differ in aversiveness, with tricaine often associated with stronger avoidance responses than some alternatives [
29]. However, such evidence should not be directly extrapolated to early developmental stages. This is particularly relevant in zebrafish because the HPI axis is still maturing during the window studied here, making adult-like stress interpretations inappropriate [
8]. We therefore interpret markers such as
c-fos [
17,
30],
hsp70 [
18], and
il1β [
23] as indicators of acute neural, cellular, or inflammatory activation, rather than as direct measures of distress. Within this cautious framework, the positive Phase III values observed for several markers, including c-fos and hsp70, are consistent with a stronger larval-stage molecular signature than in earlier phases. However, because the
c-fos contrast was hypothesis-generating and
hsp70 was the only marker showing a significant Phase × Treatment × Time interaction, these findings should be used to motivate stage-aware validation rather than to rank formulations by welfare impact.
The exposure window also reflects the operational nature of the study. The 3, 10, and 25 min points were selected to capture an early molecular footprint of exposure to complete operational formulations, not to define gene-specific peak-expression times or to verify euthanasia endpoints. Previous zebrafish embryo studies have shown that brief MS-222 exposure, including 20 min treatments, can produce developmental, behavioural, biochemical, and transcriptional consequences that depend on developmental stage [
12,
28]. More broadly, experimental work on euthanasia-associated anaesthesia and tissue sampling has shown that even a few minutes of anaesthetic exposure can modify mRNA readouts, particularly among early-regulated genes. [
31,
32]. However, transcriptional initiation, mature-transcript accumulation, physiological disruption, and endpoint confirmation occur on different time scales; therefore, later gene-specific expression peaks may fall outside the sampled window. The absence of a recurrent Time effect should therefore not be interpreted as evidence that exposure duration is biologically irrelevant, but rather as indicating that, within the current 3–25 min window, the developmental phase was the dominant source of structure in the transcriptional profiles.
Another circumstance that could determine stage-specific response is the permeability and diffusion process. The epithelia permeability, ionic regulation, and metabolism are developing and changing from one stage to another [
5]. In Phase I and II, the embryos are protected by the chorion, which is a semipermeable barrier that modulates diffusion, but in the third stage is removed as the embryo hatches [
13]. All these changes may influence the pharmacokinetics and biodistribution of the operational formulation in the embryo, and so the effects of these compounds are dose-related, and could also influence the specific stage-related effects noticed in our experiment. This is especially relevant for studies in which euthanasia is followed immediately by molecular sampling, because protocol-related transcriptional artefacts may differ across developmental windows even when the same nominal formulation is used.
5. Conclusions
This study shows that acute transcriptional responses to operational chemical euthanasia formulations in zebrafish embryos and larvae are strongly shaped by developmental stage. Across the targeted qPCR panel, formulation-associated profiles were not consistent enough to support a universal ranking of clove oil, tricaine/MS-222, and lidocaine. Under the conditions of this study, the transcriptional endpoints did not identify a single superior formulation among those tested in Phase I, Phase II, or Phase III. Likewise, the results do not indicate that any formulation was ineffective, nor do they support the conclusion that all formulations were biologically equivalent. Instead, the findings suggest that formulation-specific transcriptional responses varied according to developmental stage, highlighting stage-dependent differences in the host response to the tested formulations.
The value of the study does not lie in ranking formulations, nor in claiming a direct readout of euthanasia quality, but in showing that developmental context shapes the molecular response to exposure. This supports two practical recommendations: First, euthanasia conditions in embryos and larvae should be reported in a stage-aware and formulation-aware manner. This includes developmental stage and hpf, hatching or chorion status, full formulation concentration, pH, buffer composition, vehicle or ethanol percentage, exposure duration, whether the exposure solution was removed before sampling, and whether death or non-recovery was formally verified. Second, the choice of molecular markers used to assess acute protocol-related effects should also be considered in a phase-aware way. Framed in this manner, the dataset provides a useful exploratory basis for improving both reporting standards and the biological interpretation of molecular endpoints in early zebrafish studies.