Article

Optimization of Aeration Tube Configuration Considering the Efficiency of Waste Collection and Water Mixing in Aquaculture Tanks


1
School of Fisheries, Zhejiang Ocean University, Zhoushan 316022, China
2
National Engineering Research Center for Marine Aquaculture, Zhejiang Ocean University, Zhoushan 316022, China
3
Fisheries College, Ocean University of China, Qingdao 266003, China
*
Authors to whom correspondence should be addressed.
Fishes 2026, 11(5), 283; https://doi.org/10.3390/fishes11050283
Submission received: 12 March 2026 / Revised: 3 April 2026 / Accepted: 9 April 2026 / Published: 9 May 2026
(This article belongs to the Section Sustainable Aquaculture)

Abstract

Proper configuration of aeration tubes is crucial for improving water quality and promoting the welfare and growth of cultured organisms in Recirculating Aquaculture Systems (RASs). To investigate the effects of aeration tube shapes (arc-shaped, disc-shaped, and linear-shaped) and positions (d = r, 1/2r) on performance, this study conducted experiments in a circular RAS tank. Methodologically, feed pellets were used to simulate solid waste, while ink was added to visualize the flow field, and mixing performance was quantitatively assessed using the spatial distribution uniformity. The results indicated that without aeration, the physical presence of the tubes affected waste collection but had minimal impact on water mixing. Under aeration conditions, placing tubes at d = 1/2r instead of d = r resulted in more efficient waste collection and improved water mixing. Waste collection performance was ranked as arc-shaped > disc-shaped > linear-shaped, whereas water mixing performance ranked linear-shaped > arc-shaped > disc-shaped. It is therefore recommended to place arc-shaped aeration tubes at d = 1/2r to achieve optimal overall performance. These findings provide valuable baseline insights into the selection and placement of aeration devices, offering preliminary practical guidance for aquaculture engineering.
Key Contribution: This study comprehensively investigates the effects of aeration tube shapes, placements, and bubble plumes on flow field characteristics, waste collection, and water mixing efficiency in circular RAS tanks. Furthermore, it innovatively utilizes image grayscale analysis to evaluate and visualize water mixing dynamics.

1. Introduction

Recirculating aquaculture systems (RAS) are an intensive aquaculture technology that raises fish and other aquatic organisms in a closed or semi-closed environment by reusing water resources, offering advantages such as high stocking density, strong controllability, and efficient use of water and land [1,2,3]. Based on the high-density characteristics of aquaculture in RAS, aerating and oxygenating the water is particularly important to support the welfare and growth of farmed fish. The mainstream methods of oxygenation currently include pure oxygen and aeration [4]. Aeration technology is gaining increasing attention due to its advantages of low energy consumption and easy installation [5,6], gradually becoming one of the most common oxygenation devices in commercial RAS.
Most research on aeration tubes primarily focuses on the effects of pore size, air intake, installation depth, temperature, and impurities in the water on aeration performance [7,8,9,10,11,12,13]. Previous studies have mostly focused on the aeration performance of aeration tubes, ignoring the fact that placing these tubes at the bottom of the tank affects both waste collection and water mixing performance. In the design of recirculating aquaculture tanks, the bottom is often used for the collection and discharge of solid waste [14]. Since aeration tubes are also located at the tank bottom, their placement inevitably affects the tank’s waste collection performance (Figure 1a); moreover, the bubble plume generated during aeration creates irregular turbulence in the water, which also impacts the water mixing within the tank [15] (Figure 1b). Cheng et al. investigated the aeration performance of four different shapes of aeration tubes (I-shaped, C-shaped, S-shaped, and disc-shaped) in a rectangular tank model. The results showed that the I-shaped tube had the best aeration performance, while the S-shaped tube had the worst. However, because this study only focused on the aeration performance of the tubes and did not investigate their waste collection performance, its guidance for the aquaculture industry is highly limited [5]. Recently, Du et al. used CFD technology to study the effects of different shapes of fine-pore aeration tubes on solid waste collection and aeration performance in rectangular aquaculture tanks. Their results indicated that a four-corner aeration tube layout maximizes solid waste collection efficiency, while distributed diffusers provide the best aeration performance [4]. Although this study innovatively combined solid waste collection and aeration performance with the layout shapes of fine-pore aeration tubes, its focus remained on solid waste collection and oxygenation efficiency, without addressing solid waste removal and water mixing. Furthermore, the tank designs they studied did not involve circular recirculating aquaculture tanks. Among various tank designs, circular tanks are widely used in RAS because they provide a stable flow pattern, a more uniform distribution of dissolved oxygen and metabolites, and better self-cleaning performance [16,17,18].
Furthermore, the selection of aeration tube configurations in commercial RAS is often highly subjective and driven by availability rather than hydrodynamic optimization. The three most representative configurations are the disc-shaped, linear-shaped, and arc-shaped designs. The disc-shaped configuration represents the standard point-source aerator; the linear-shaped configuration is the most common commercial standard diffuser; and the arc-shaped configuration is a specialized design introduced to structurally match the curved tank walls. Despite their widespread use, there is a lack of targeted research systematically evaluating how these specific shapes and their installation positions influence both waste collection and water mixing performance under actual aeration conditions.
Therefore, this study is motivated to fill this gap by investigating the impact of aeration tube design and positioning to provide data-driven insights. To bridge these specific research gaps, the present study differentiates itself from previous investigations by transitioning from single-objective aeration analysis in rectangular tanks to a multi-objective optimization of bottom-mounted aeration systems in circular RAS. Specifically, this study conducted laboratory-scale experiments to analyze the impact of three distinct shapes of aeration tubes (arc-shaped, disc-shaped, and linear-shaped) placed at two different positions (d = r and 1/2r, where d represents the maximum distance from the aeration tube to the central outlet, and r is the tank radius) on the waste collection performance and water mixing efficiency of circular aquaculture tanks, providing empirical insights previously lacking in the field. This study uniquely focuses on the role of bubble plumes generated by these configurations and their effects on tank hydrodynamics. Based on the experimental findings, we propose practical recommendations to optimize aeration tube configurations in commercial circular RAS tanks, helping practitioners improve system efficiency, reduce stagnant zones, and enhance dissolved oxygen distribution.
The remainder of this paper is organized as follows: Section 2 presents the experimental setup and design, followed by a detailed explanation of the data analysis and processing methods. Section 3 introduces the experimental data and provides a brief analysis. In Section 4, an in-depth discussion of the results is provided, along with an analysis of the underlying factors contributing to the findings. Finally, Section 5 concludes the paper and outlines directions for future research.

2. Materials and Methods

2.1. Experimental Setup

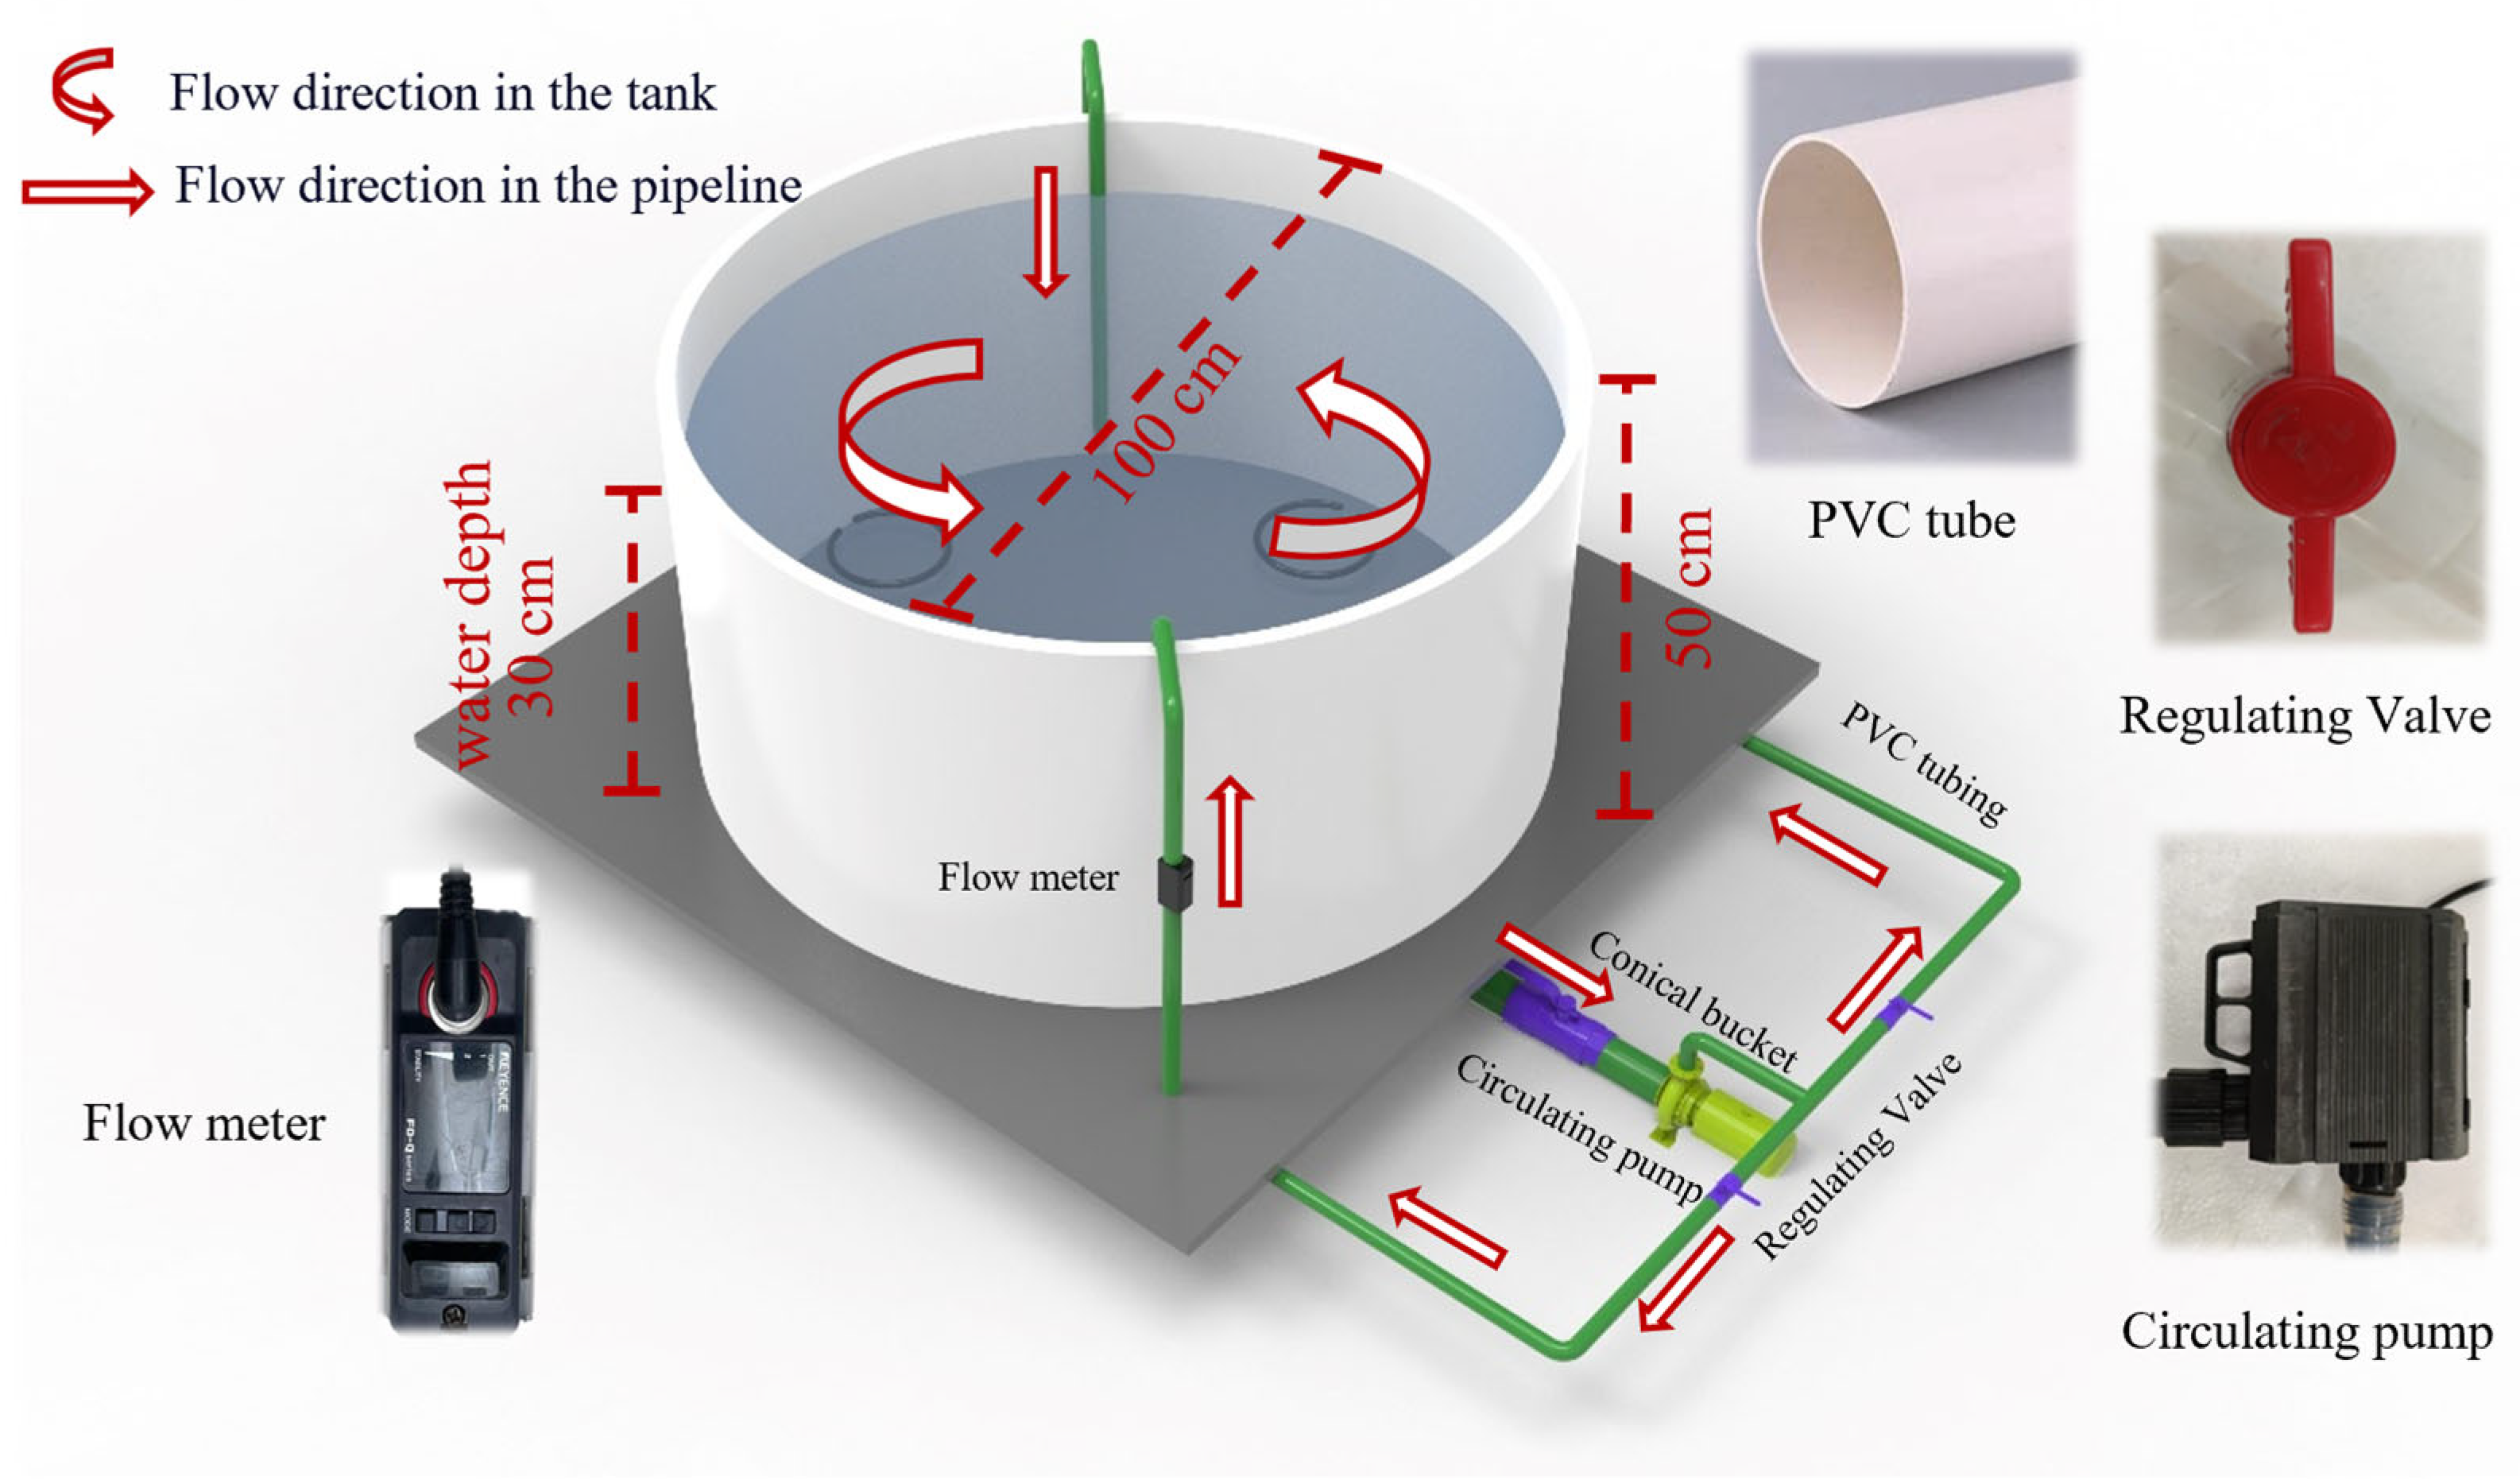
Experiments were conducted in a laboratory-scale circular recirculating aquaculture tank, analyzing the effects of different aeration tube configurations on the efficiency of solid waste collection and water mixing performance within the tank driven by a dual-inlet pipe. The experiments were carried out in the aquaculture laboratory of the National Engineering Research Center for Marine Aquaculture of Zhejiang Ocean University, China. The experimental setup consisted of a circular recirculating aquaculture system, an image acquisition system, and an aeration oxygenation system, as shown in Figure 2 and Figure 3.
The experimental recirculating aquaculture tank model was designed based on existing commercial-scale RAS tanks and constructed using transparent acrylic sheets. The tank has a radius of r = 50 cm and a wall height of h = 50 cm, with a 5 cm diameter waste outlet at the bottom. The operating water depth was set to 30 cm, corresponding to a total water volume of approximately 235 L, and the tank was filled with freshwater (tap water maintained at 20 ± 1 °C) to isolate baseline multiphase flow characteristics without seawater surface tension effects. The tank rests on a support frame made of aluminum material. The water recirculation system is powered by a submersible pump (YF-9220, Yafeng Pump Industry, Taizhou, China; 40 W) connected to PVC pipes with an outer diameter of 20 mm. The pump was operated at a constant setting, and the inlet flow rate was monitored and maintained at Q1 = 10.6 L/min for all trials to standardize the hydraulic condition across experiments. Water is drawn out from the outlet at the bottom of the tank, through a steel-reinforced hose connected to the circulation pump, and is directed through a conical filter (to prevent solid waste from re-entering the tank). The water is then returned to the tank through inlet pipes. Flow meters (FD-Q20C, KEYENCE Corporation, Osaka, Japan) and valves (HUAYA, Dongying, China) are installed on the PVC pipes (LESSO, Foshan, China) connecting the pump and the two inlet pipes, allowing control and adjustment of water flow speed and inflow volume, creating a complete closed-loop recirculating water system. In this experiment, the dual-inlet system is used, with the two inlet pipes symmetrically arranged around the center of the tank and vertically placed inside the tank. At heights of 1 cm, 21 cm, and 41 cm from the tank bottom, there are water inlets with a radius of 0.3 cm on each pipe. The pipes are fixed to the support frame with graduated scales, which allow for adjustment and fixation of the inlet pipe angle and position.
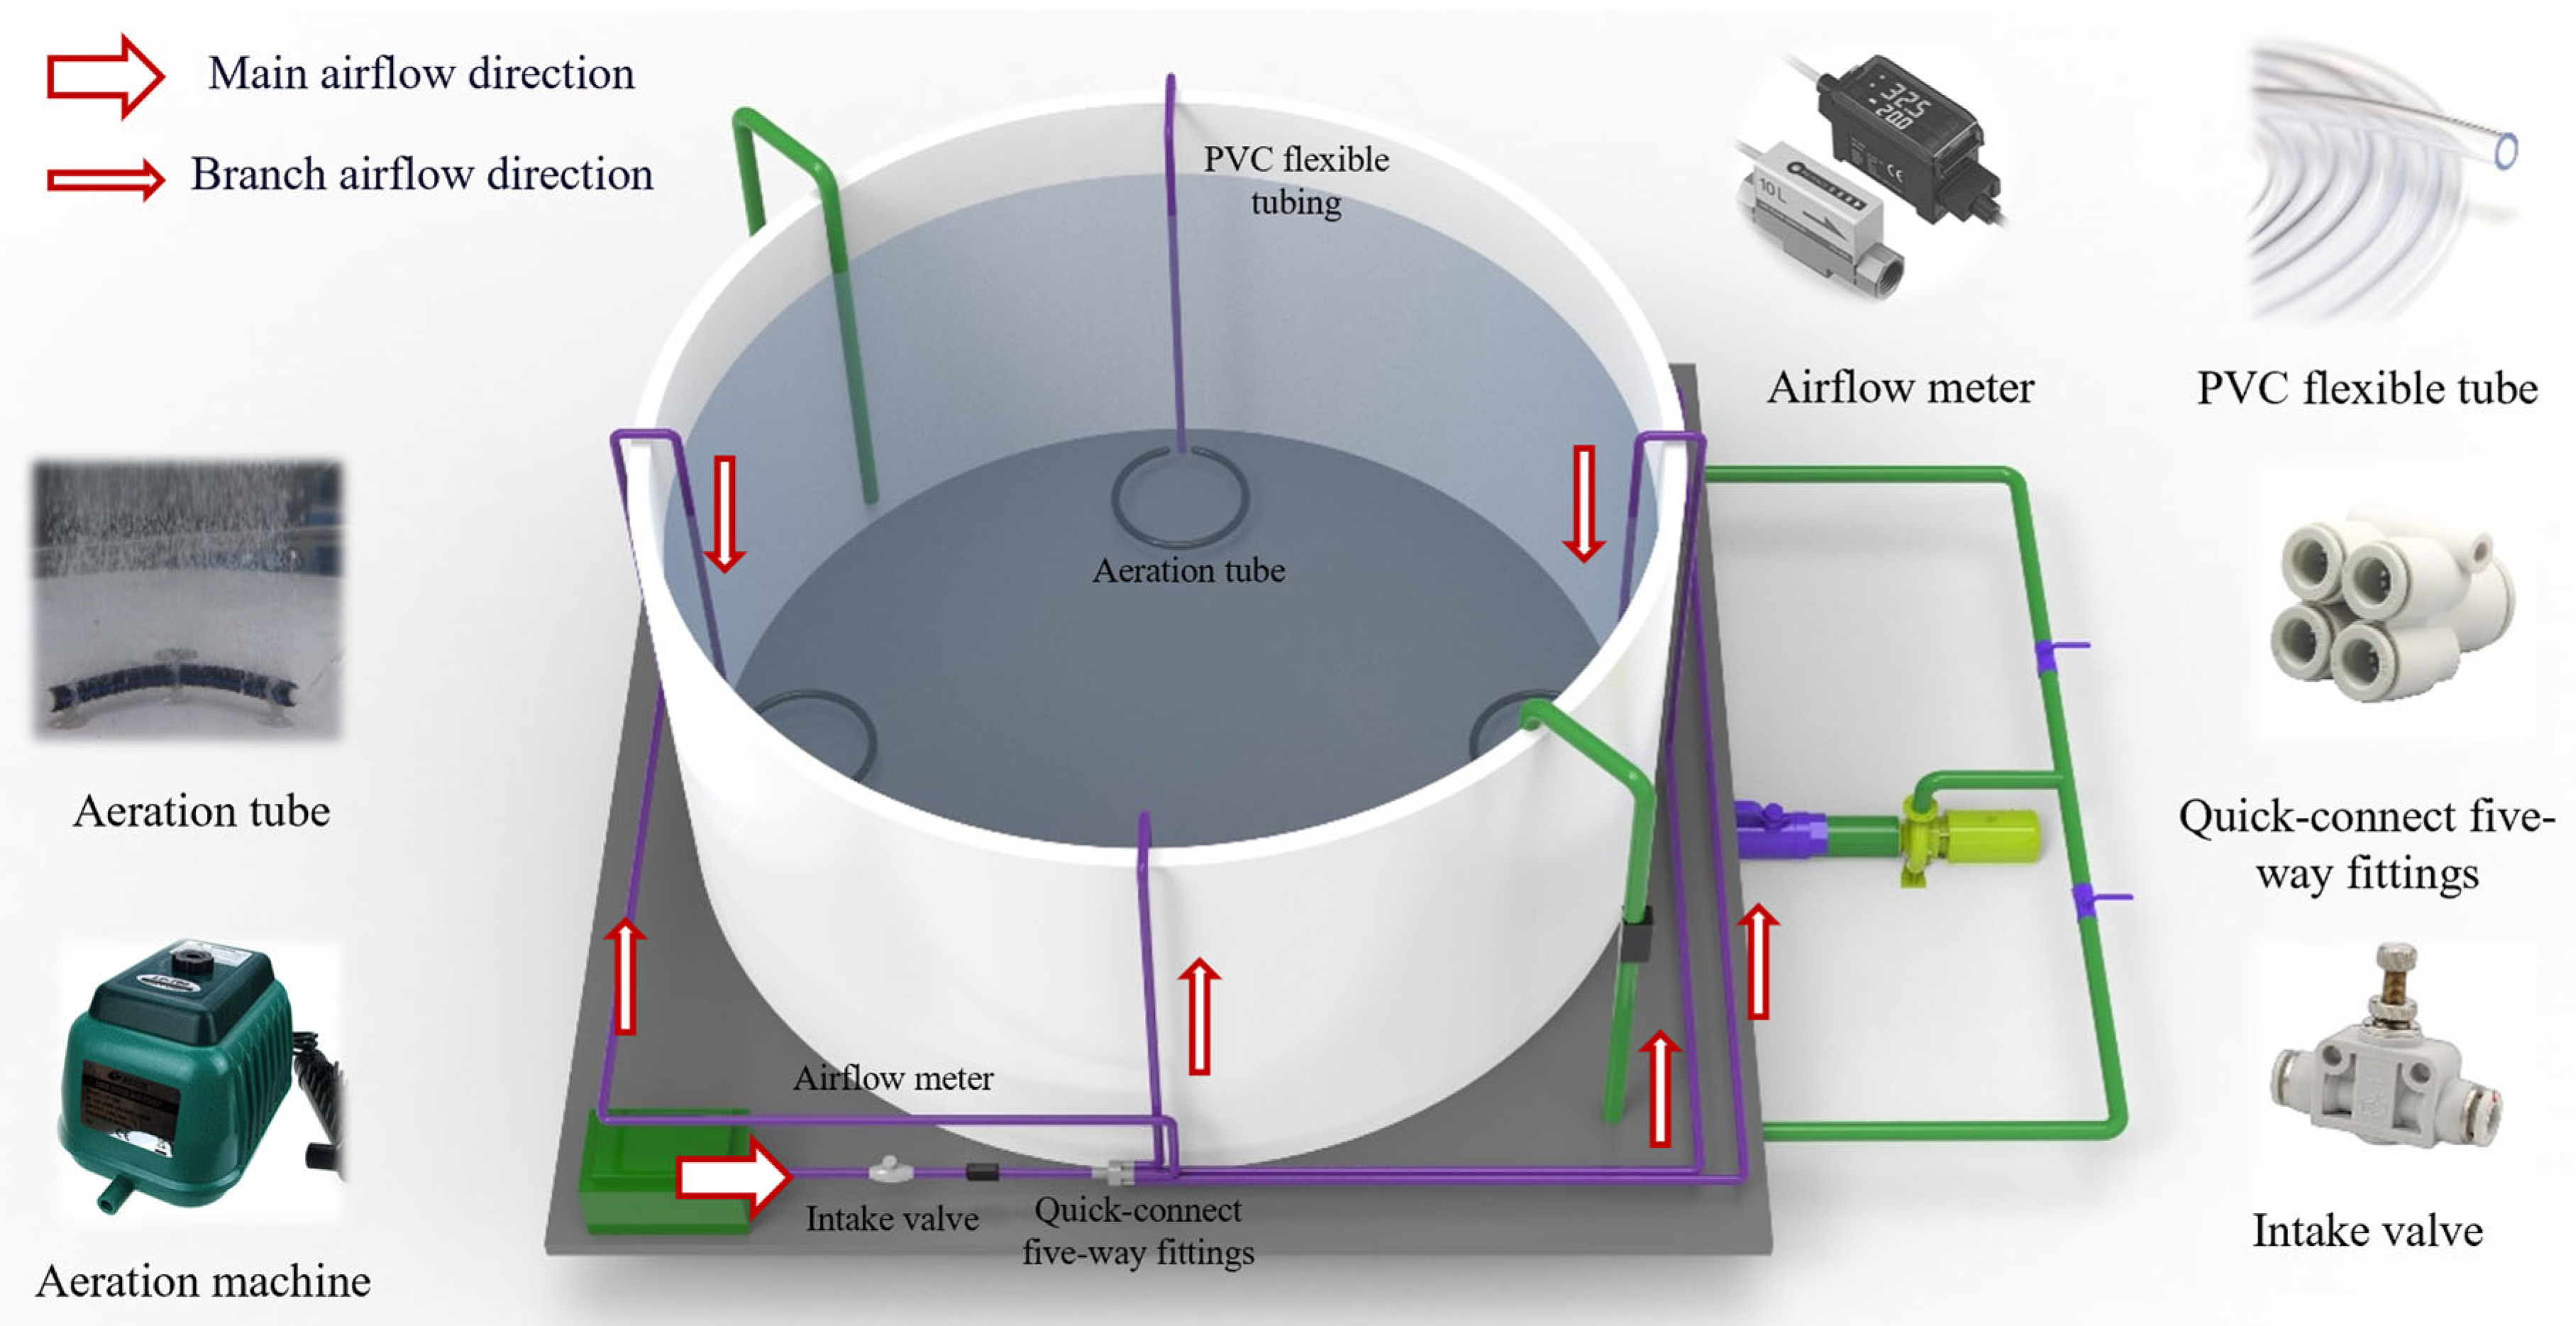
The aeration system consists of a laboratory-scale aeration machine (model LP-100, Zhejiang Risheng Pump Co., Ltd., Taizhou, China; rated power: 100 W; maximum airflow: 140 L/min), PU tubing (LESSO, Foshan, China), PVC flexible tubing (LESSO, Foshan, China), intake valve, quick-connect five-way fittings, airflow meter, aeration tubes, and aeration attachments. After the aeration machine is connected to the PU tubing (LESSO, Foshan, China) (main intake tube), the total oxygen input is adjusted using the intake valves, which then connect to the five-way fittings to distribute the oxygen into the flexible PVC tubing. Once the PVC tubing is routed into the aquaculture tank, it connects to aeration tubes to form an oxygen flow channel. Crucially, the material, diameter, and vertical routing of these transport pipes were strictly standardized across all configurations. This ensured their hydrodynamic drag acted as a constant background variable, attributing any observed differences exclusively to the bottom aeration tube designs. To ensure a fair comparison of oxygenation efficiency and hydrodynamic influence, the total effective length of the aeration tubes was strictly fixed at 100 cm for all configurations. This ensures that the total bubble generation surface area remains constant. Technically, the tubes were fabricated using hoses (outer diameter 10 mm, average pore diameter approximately 30 μm) connected via PVC fittings to form a rigid skeleton. They were divided into four equal sections (25 cm each). The three shapes—linear-, disc-, and arc-shaped—were selected based on standard configurations used in commercial RAS. Specifically, the arc-shaped configuration consists of four identical segments. When positioned at the mid-radius (d = 25 cm), each segment spans a central angle of approximately 1 radian (57.3°), arranged symmetrically to align with the rotational flow streamlines to minimize flow resistance. The PVC tubing is connected to these attachments, ensuring that oxygen is delivered to the aeration tubes inside the tank. The entire aeration system’s airflow is measured by a high-precision airflow meter (KEYENCE FD-V40, Osaka, Japan). To ensure that the air was transferred efficiently and equally without leakage, the entire gas pipeline was securely connected using polyurethane (PU) tubing and quick-connect fittings, and leak-tested with a soap solution prior to the trials. The specific parameters of the experimental set-up were carefully selected based on standard RAS engineering guidelines. The water depth was maintained at H = 0.3 m, yielding a tank diameter-to-depth ratio (D/H) of approximately 3.33. This ratio falls within the optimal design range of 3:1 to 5:1, which is widely recommended for achieving stable hydrodynamics and efficient self-cleaning performance in circular aquaculture tanks [19]. Furthermore, during the aeration trials, the airflow rate was adjusted using the airflow meter and maintained at 60 L/min. This provides an aeration volume ratio of approximately 0.25 vvm (volume of air per volume of water per minute), ensuring sufficient turbulent kinetic energy for effective water mixing while preventing excessive surface splashing [1].
The main component of the video image capture system is a high-definition wide-angle camera (model VHD4K, Shenzhen Tenveo Video Technology, Shenzhen, China), which is securely mounted at the center of the aluminum frame. The height of the frame is adjusted by reviewing the video feed to ensure that the camera captures a stable, full view of the images. To enhance the clarity and allow for better observation of the solid waste particle accumulation and water mixing process within the aquaculture tank, a white construction membrane is placed at the bottom of the tank.

2.2. Experimental Design

Previous study had indicated that in a circular recirculating aquaculture tank, under the dual-inlet mode, the optimal waste collection performance is achieved when the inlet pipe placement distance is l = 0 and the angle θ is between 45° and 50° (where l is the vertical distance between the inlet pipe and the tank wall, and θ is the angle between the jet direction of the inlet pipe and the tangent plane of the tank wall) [20]. Based on these findings, this study follows the conclusions for the placement of the inlet pipes, selecting the experimental condition of l = 0 and θ = 45° for the dual-inlet pipe-driven mode. The total inflow rate was set to Q1 = 10.6 L/min, with an individual inflow rate of 5.3 L/min per pipe, according to a hydraulic retention time (HRT) of 30 min. The experimental conditions are detailed in Table 1. In this study, energy consumption was controlled to be comparable across all aeration groups to evaluate the efficiency of different configurations. The total aeration rate was fixed at Q2 = 12 L/min. Therefore, the aeration energy input was expected to be similar across treatments under the standardized operating conditions, allowing us to focus on the performance differences caused solely by the tube configuration.
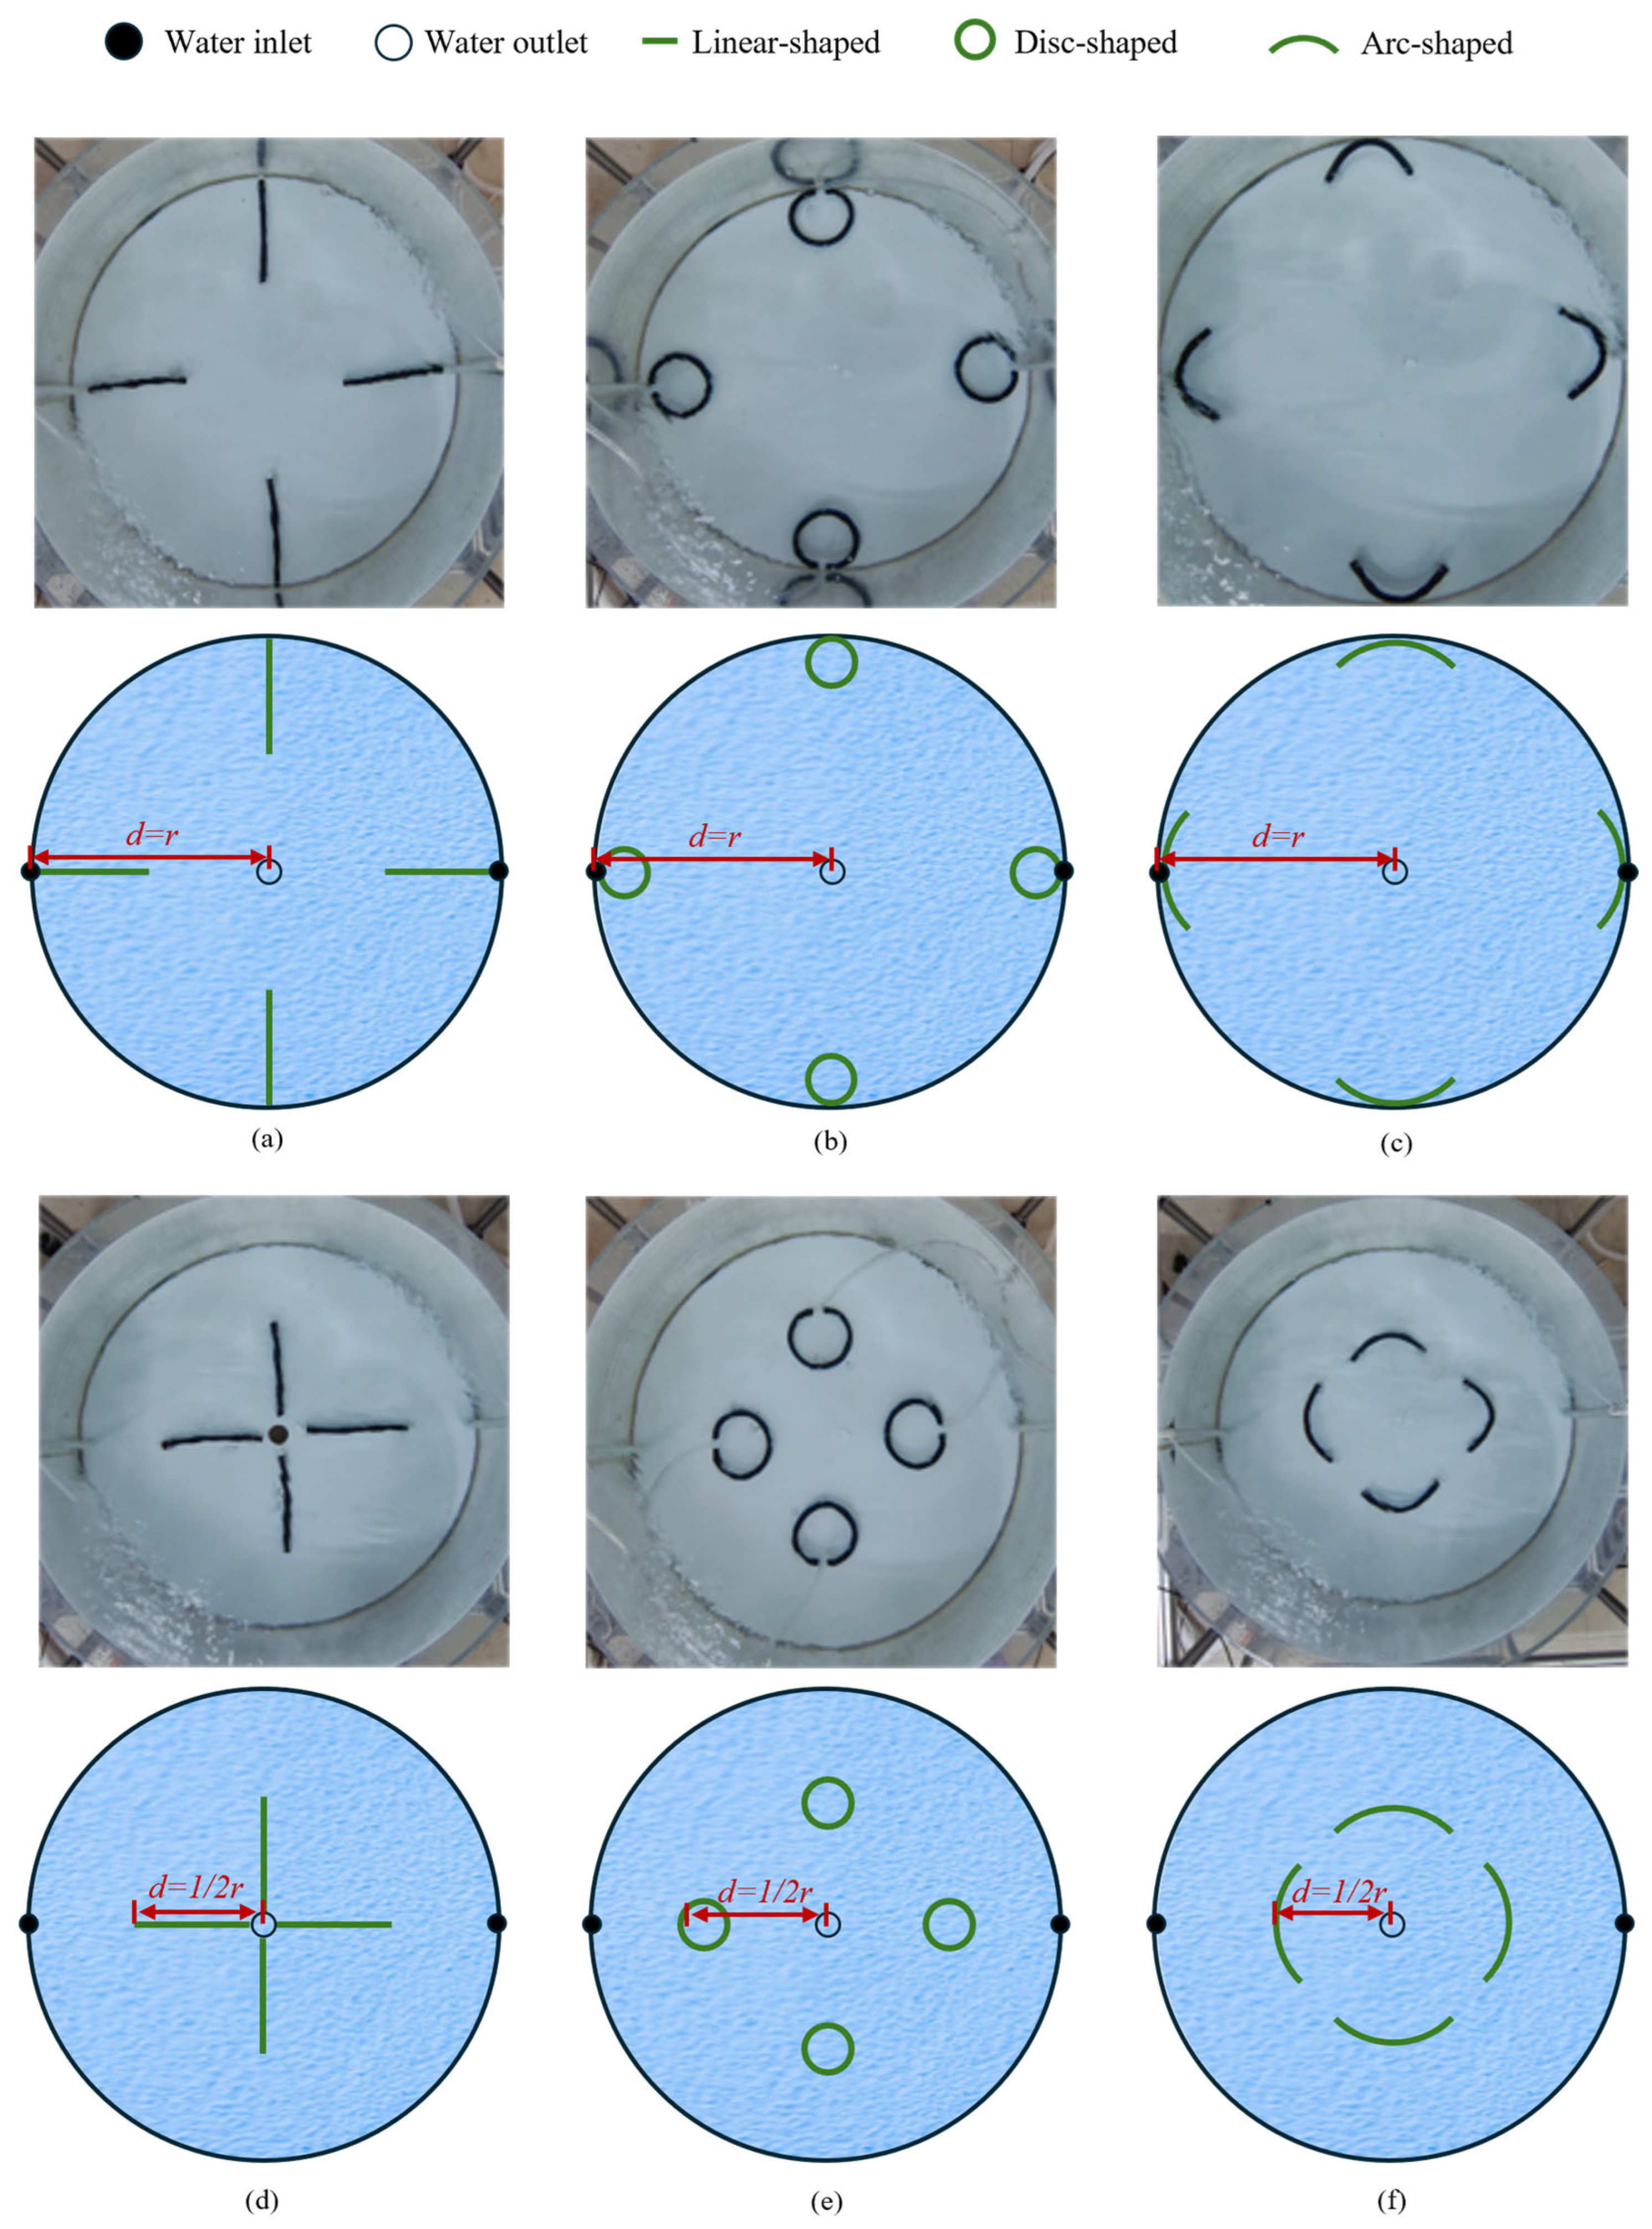
The experimental configurations were selected based on commonly used aeration tube layouts in industrial recirculating aquaculture systems (arc-shaped, disc-shaped, and linear-shaped). To ensure a rigorous comparison, all tubes were fabricated using hoses (LESSO, Foshan, China) mounted on rigid PVC skeletons (LESSO, Foshan, China), with the total effective length strictly fixed at 100 cm (divided into four 25 cm sections) to maintain a constant bubble generation surface area. Specifically, the arc-shaped tubes were designed with a curvature concentric to the tank wall to minimize flow resistance. Based on these standardized designs, this study investigates the impact of these three types of aeration tube configuration, as well as different placement positions of d = r and 1/2r, on the waste collection performance and water mixing efficiency within the tank under a total aeration volume of Q2 = 12 L/min (with an individual air intake of 3 L/min per aeration tube). A total of six experimental conditions were tested, and the aeration tube layouts are shown in Figure 4.

2.2.1. Aeration System Operation

Before each experiment involving aeration, a standardized startup protocol was strictly followed. The aeration system was activated and allowed to run for at least 10 min to stabilize the airflow. The airflow rate was monitored and adjusted using the flow meter to ensure a precise output of 3 L/min per tube (total 12 L/min). The bubble plume formation was visually inspected to ensure uniformity before commencing waste collection or mixing tests.

2.2.2. Waste Collection Experiment Procedure

To study the effects of six different aeration tube configurations on the collection and discharge of waste in a circular recirculating aquaculture tank, this experiment used commercial sinking aquaculture feed pellets (cylindrical, approximately 0.4 cm in diameter, specific gravity of >1.0) as a standardized substitute for solid waste. The use of such pellets is a well-established methodology in RAS hydrodynamic research, as their specific gravity and resulting settling velocities effectively mimic the physical behavior of actual fish feces and uneaten feed in the flow field [14]. For each individual experimental trial, exactly 30 pellets were introduced into the tank. A stopwatch was used to record the time taken for the waste within the tank to be completely collected, which was then used to quantify the waste collection performance of the tank.
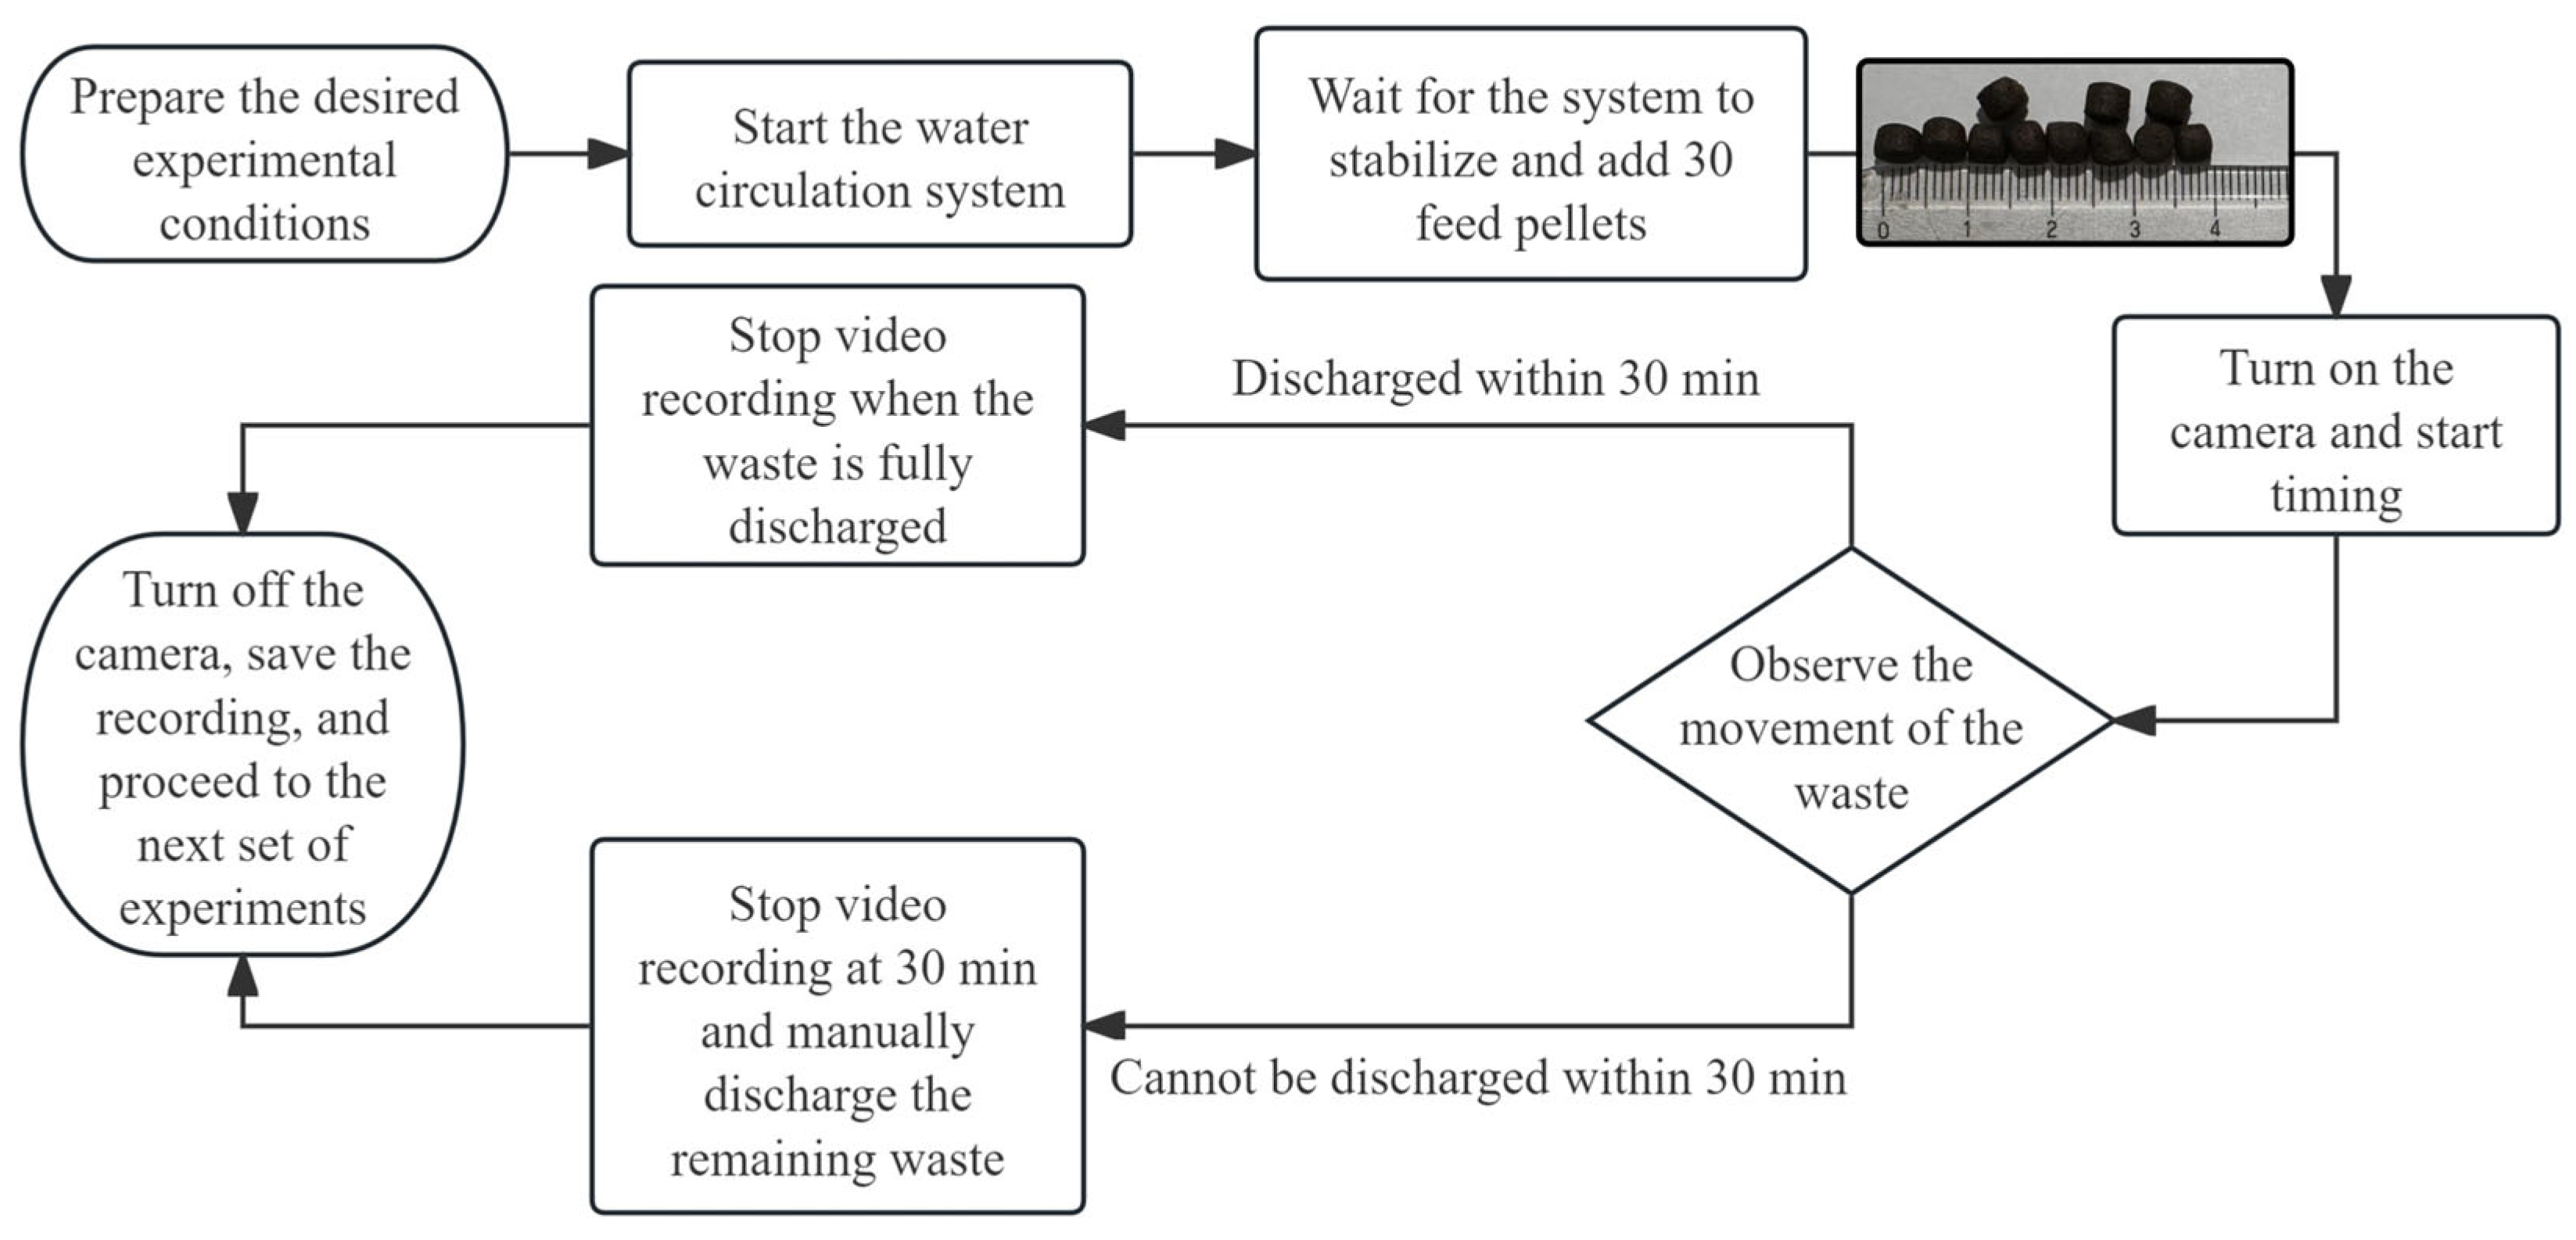
The experimental process is as follows: (1) Adjust the experimental design conditions (such as the arrangement of aeration tubes, total aeration volume, and the air intake of each aeration tube). (2) Adjust the water level in the tank and activate the water circulation system. Once the water in the tank reaches a stable state, turn on the camera, and pour a solid waste into the tank near one of the inlet pipes, at a position 5 cm above the water surface. (3) Visually monitor the removal process of the solid waste and record the time for each piece of waste to be fully collected using a stopwatch. The maximum observation time is set at 30 min. If the solid waste has not been fully removed within 30 min, the experiment will be stopped; otherwise, the experiment will be stopped whenever the waste is fully collected within this time frame. (4) Turn off the camera, save the video footage, and begin the next experiment. (5) Use the captured video and images to analyze the solid waste removal process. The experimental process is shown in Figure 5.
For each aeration tube configuration, the experiment was repeated three times under identical conditions. Before each trial, the tank was returned to the same initial state (water level, flow rate, aeration rate, and number of feed particles). Each 30 min observation was treated as an independent trial, concluding strictly at the 30 min mark without waiting for the complete removal of all particles. The final waste collection performance for each configuration was then determined by averaging the results of these three trials.

2.2.3. Water Mixing Experiment Procedure

The water mixing experiment aims to study the impact of different aeration tube layouts on the water mixing performance within the circular recirculating tank. By using black ink to visualize the mixing process between the recirculating water entering the tank and the existing tank water, the mixing process can be observed. Through image processing techniques, the efficiency of water mixing in the circular tank is quantified, which allows for a comparison of the water mixing performance under different aeration tube layout conditions.
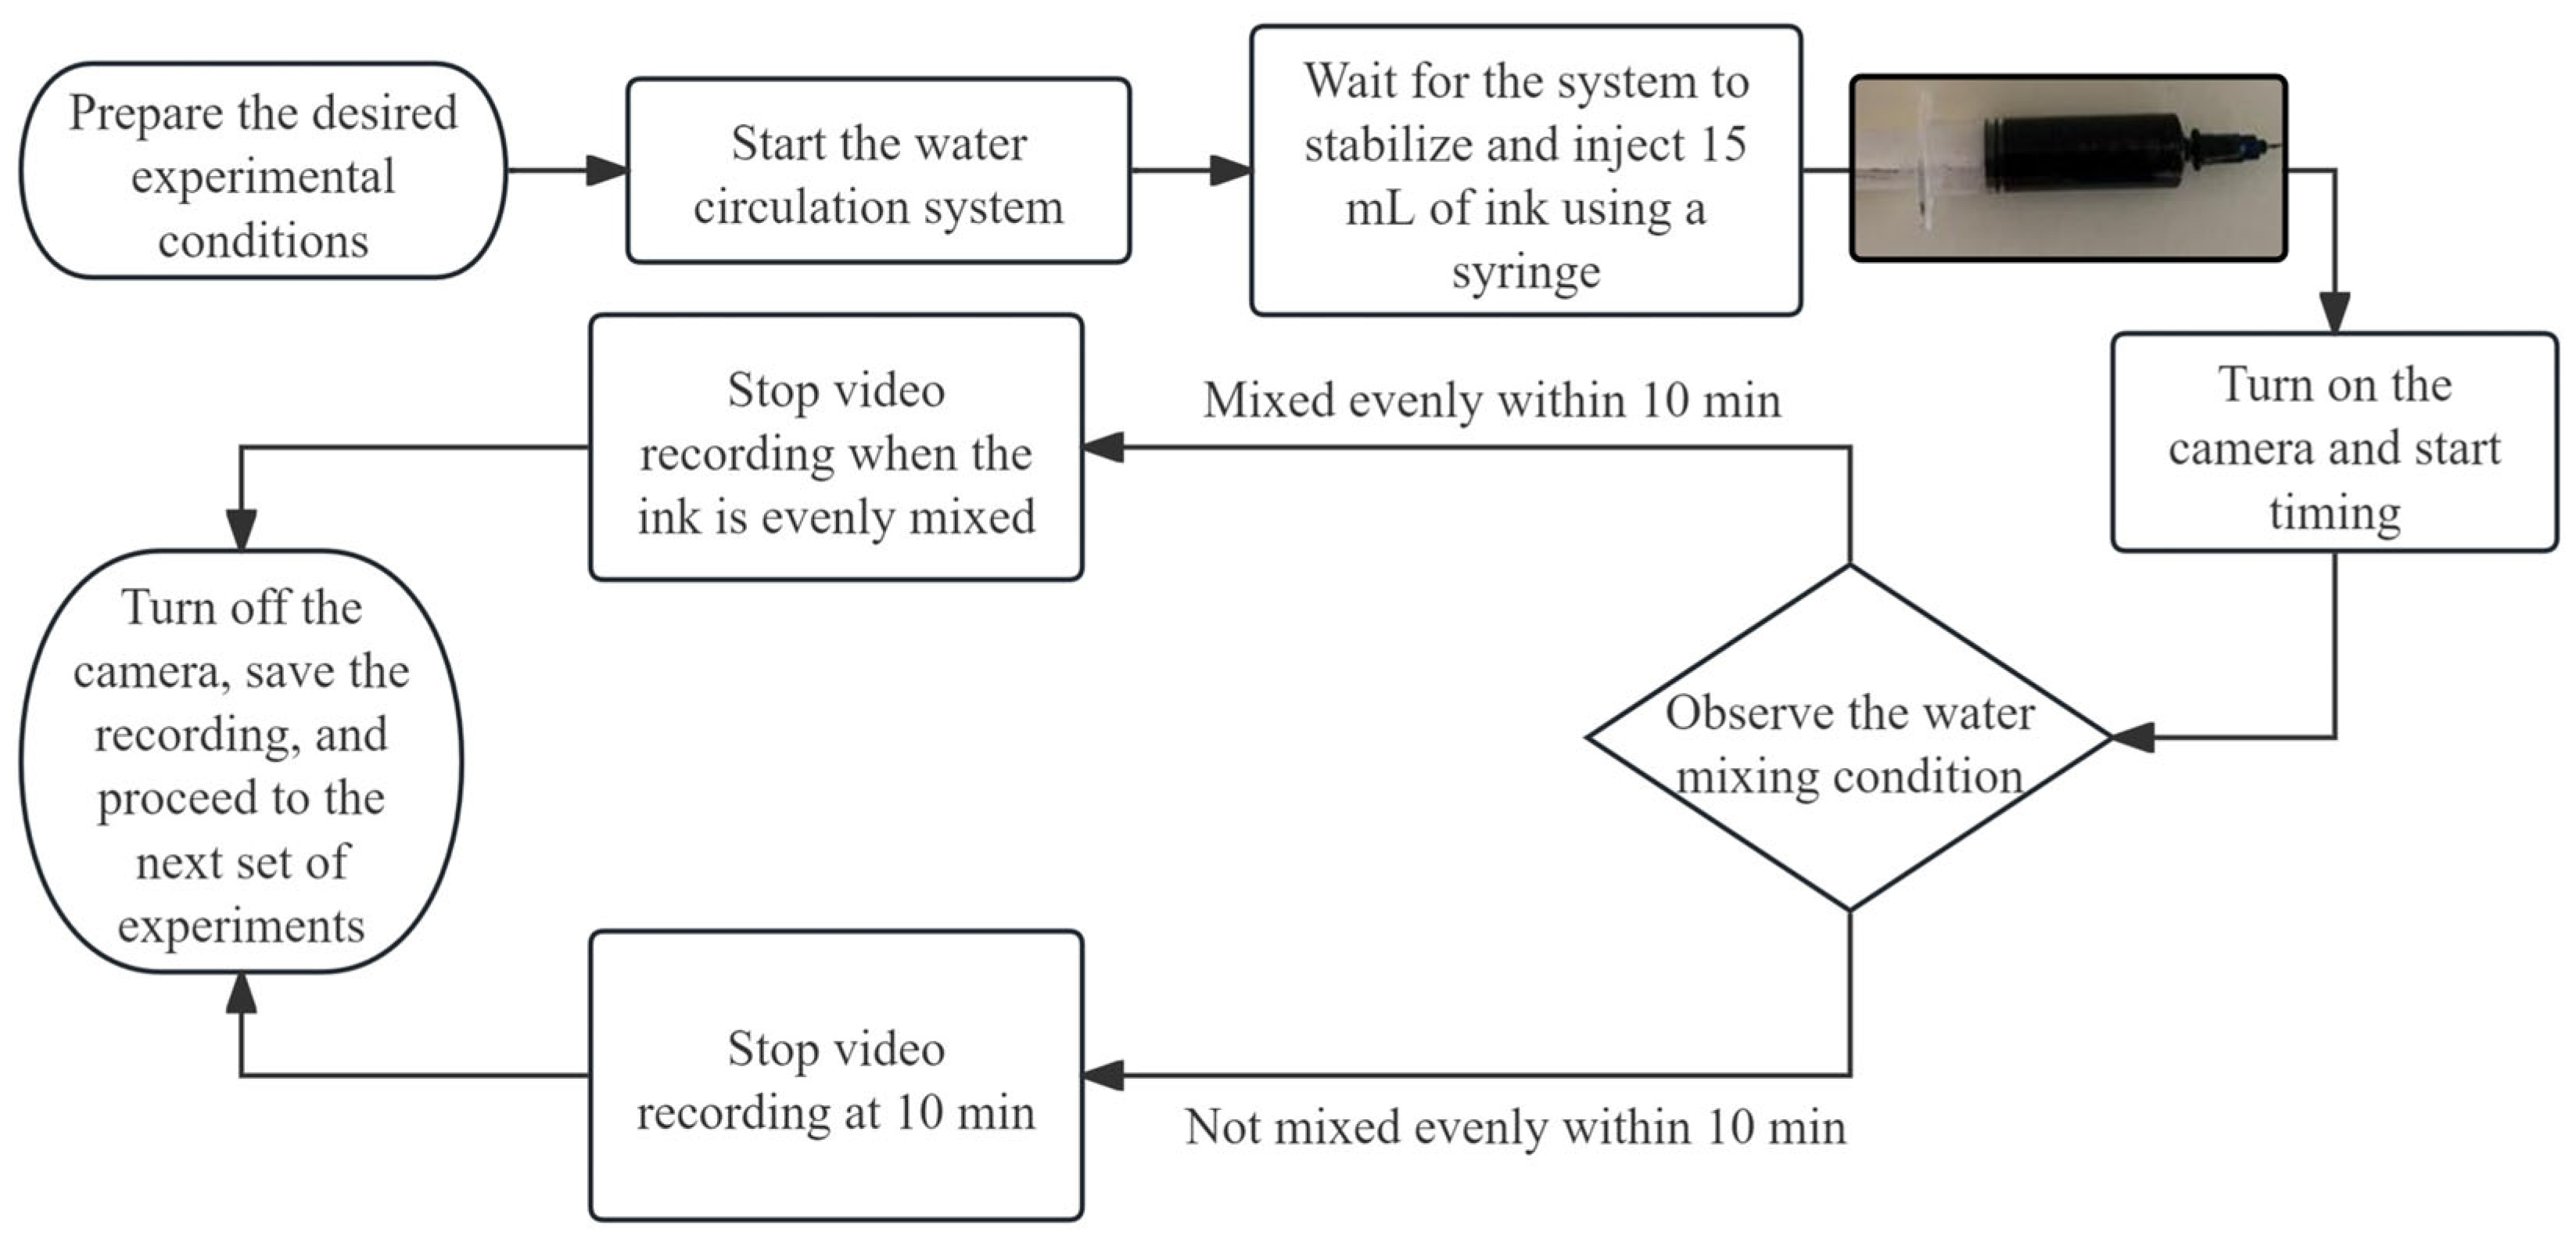
The experimental setup for the water mixing trial is the same as that for the waste collection trial. The procedure is as follows: (1) Adjust the experimental design conditions. (2) Adjust the water level in the aquaculture tank and start the water circulation system. After waiting 30 min for the system to reach a stable state, turn on the camera and quickly inject a black ink tracer (15 mL) at a fixed location using a syringe positioned at a fixed location. (3) Monitor the water mixing performance test visually. The maximum observation time is set to 10 min. (4) Save the video recordings and proceed to the next set of experiments. (5) Import the captured videos into MATLAB R2022b to analyze the water mixing process. The experimental process is shown in Figure 6.
For each aeration tube configuration, three independent mixing trials were conducted. In each trial, a new injection of dye was added after the flow field had restabilized. The video sequence from each trial (600 frames over 10 min) was used to calculate a time series of mixing indices. The final mixing performance for each configuration was then determined by averaging the results of the three trials.

2.3. Experimental Data Processing

The waste collection efficiency and water mixing efficiency in the aquaculture tank under different aeration tube configurations represent the tank’s self-cleaning and water mixing performance, respectively. Conducting further quantitative analysis based on the experimental data and captured images is crucial for optimizing the aquaculture performance of the tank. This analysis helps improve the tank’s operational efficiency by ensuring effective waste removal and enhancing water circulation, which are key to promoting healthier environments for the cultured species.

2.3.1. Waste Collection Experiment Data Analysis

The waste collection performance of the tank is directly related to the efficiency of waste collection. The fewer solid waste particles remaining in the tank over the same time, the better the tank’s waste collection performance under this condition.
Due to the large number of bubbles generated by the aeration tubes during the experiment, it was not possible to directly count the time and number of solid wastes collected from the video recordings. Instead, a visual observation method was employed, with observations conducted from the sidewall of the aquaculture tank. A stopwatch was used to record the time each solid waste particle was discharged. These per-second records were then aggregated to calculate the number of solid waste particles remaining in the tank every minute. By comparing the continuous removal speed over a 30 min period, we were able to quantify the waste collection performance of the tank under different conditions.

2.3.2. Water Mixing Experiment Data Analysis

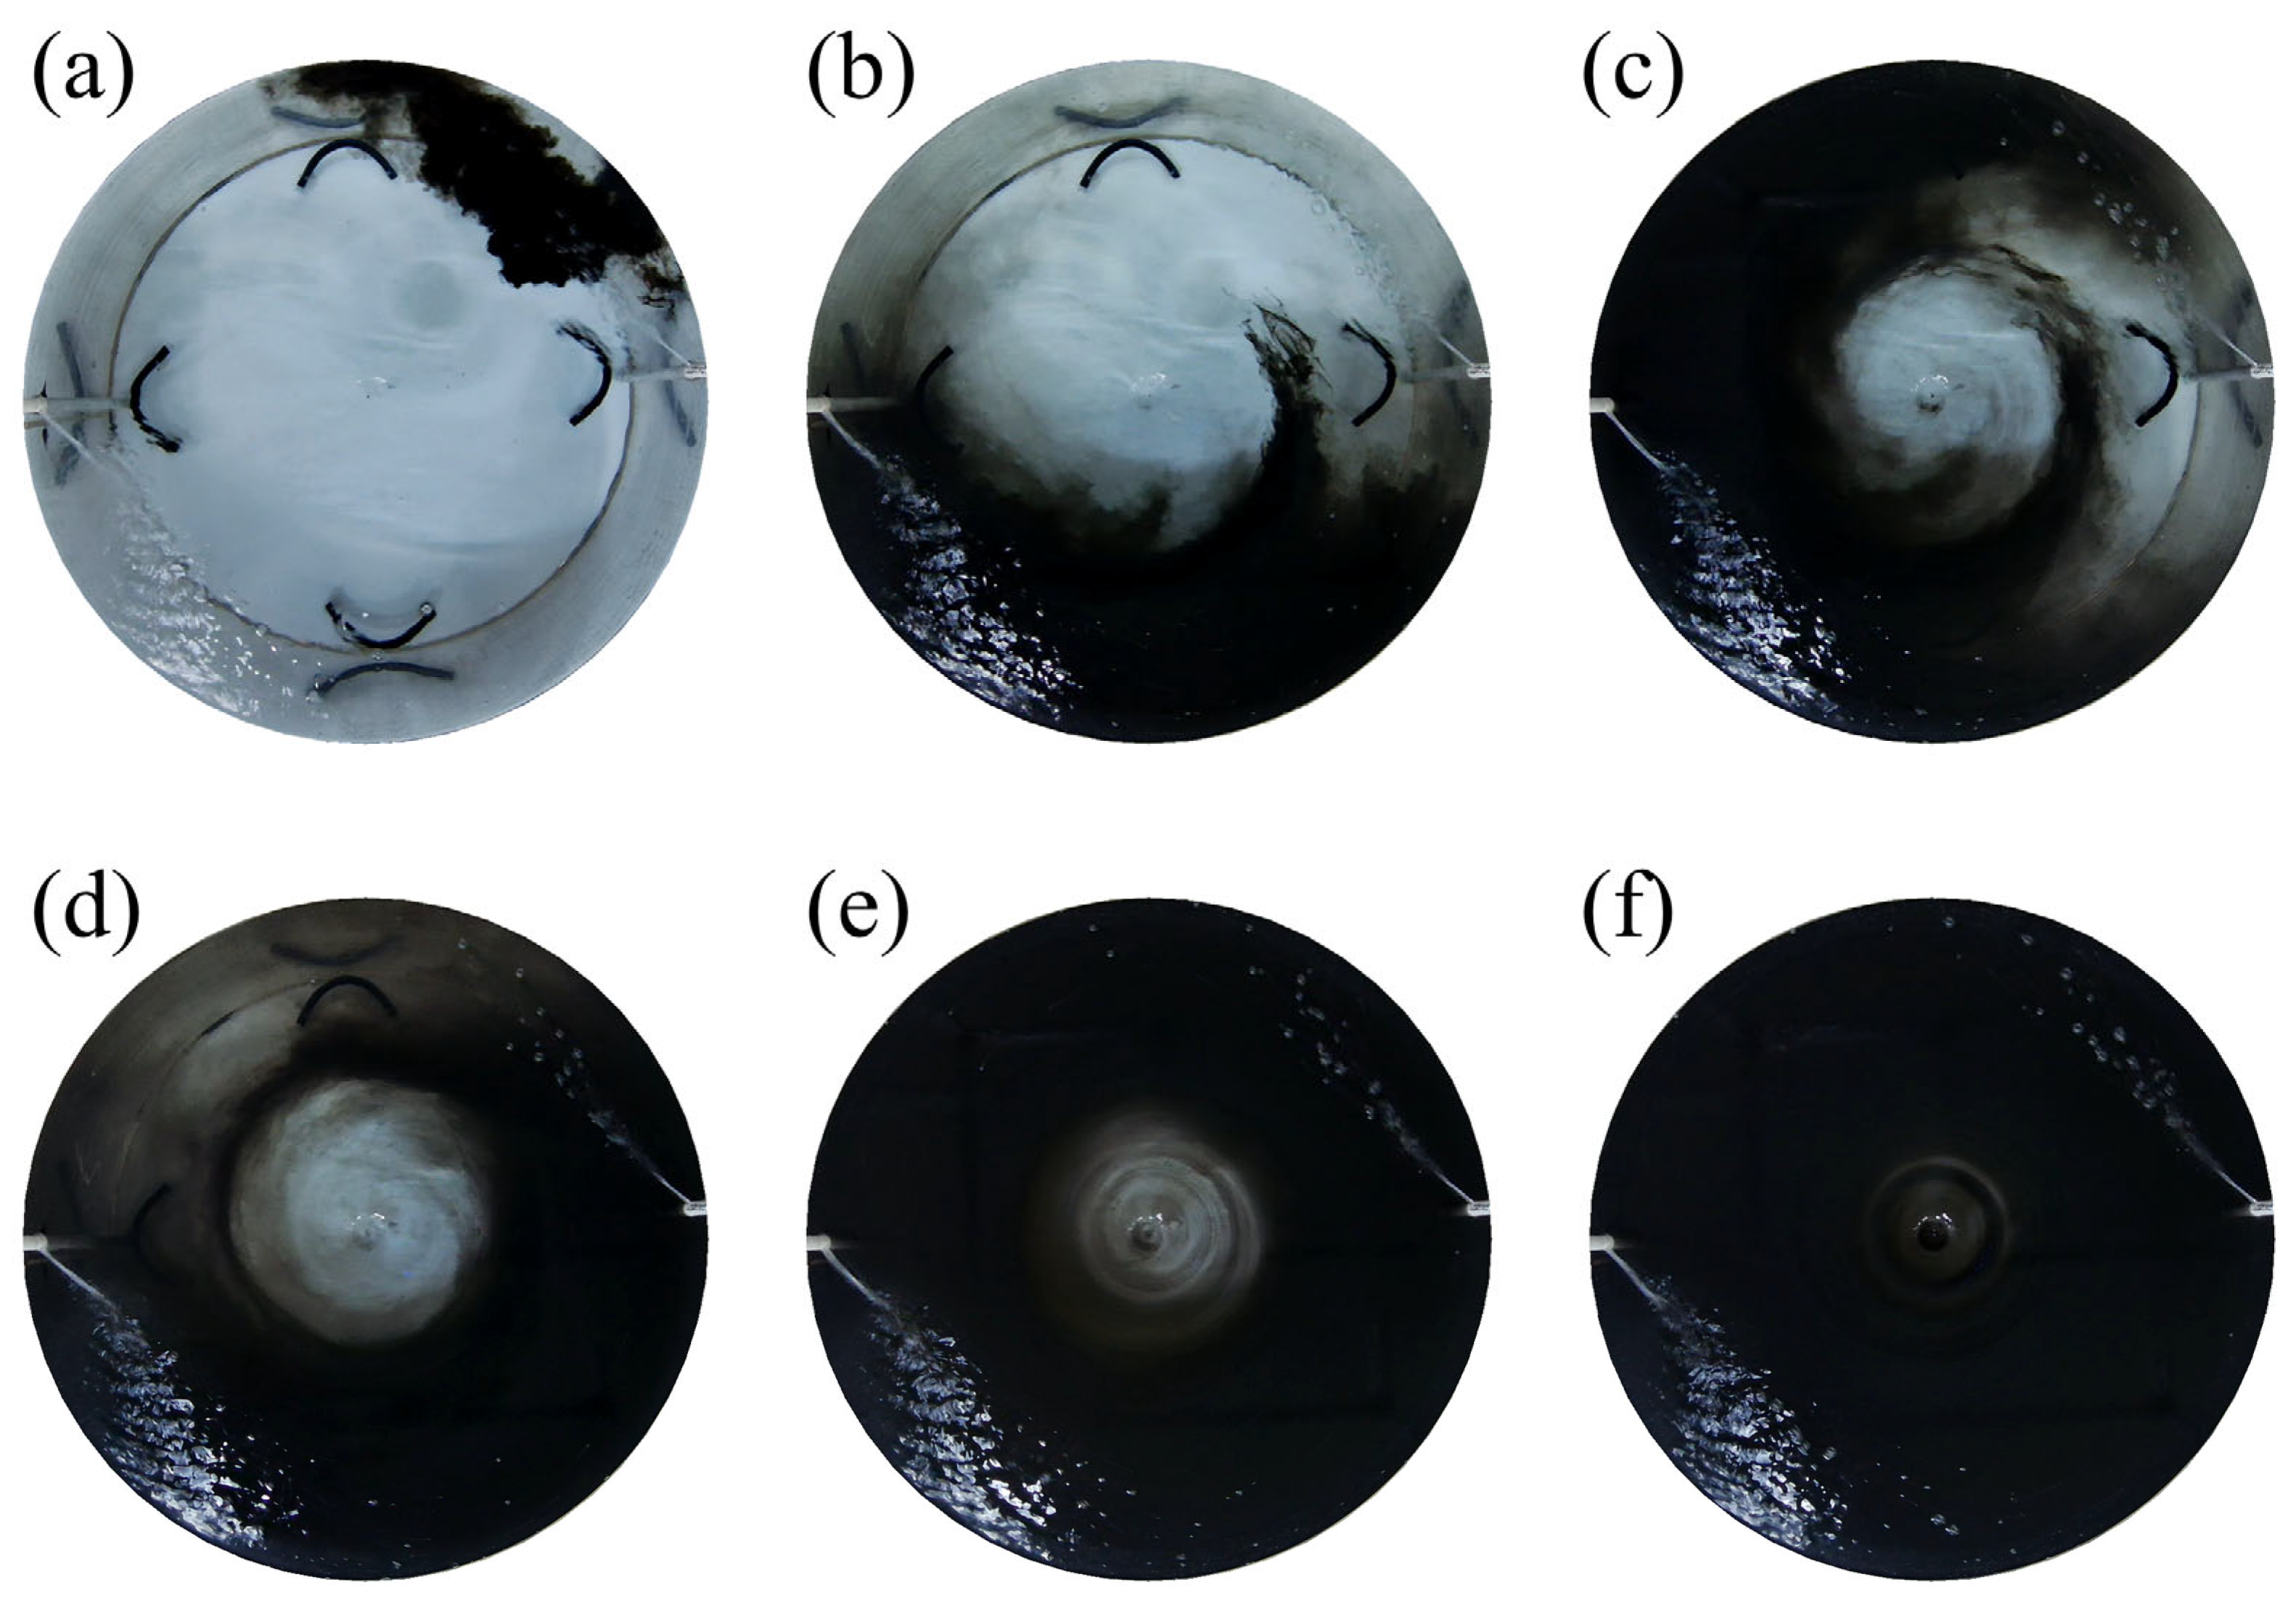
In the water mixing experiment within the aquaculture tank (Figure 7), MATLAB R2022b software was used to process the original video footage of the ink diffusion in the tank to quantitatively compare the diffusion effect under different aeration tube layouts. First, identify the frame immediately before the ink enters the aquaculture tank (t = 0 s) and use it as the background reference. Then, screenshots were taken at 1 s intervals (30 frames) over the first 10 min of the experiment, resulting in 600 captured images.
To mitigate the influence of the aeration tube color, specular reflections, and non-uniform illumination, a background subtraction was performed prior to the grayscale statistics. Specifically, the pre-injection frame (t = 0 s, before ink entered the tank) was used as the background, and each subsequent grayscale frame was background-corrected as ΔI(x, y, t) = I(x, y, t) − I(x, y, 0) before calculating the mean grayscale value and the uniformity index.
The grayscale value average formula (Equation (1)) is introduced here, where x ¯ represents the average grayscale value, x i is the grayscale value of each pixel, and N is the total number of pixels in the image. This value indicates the average grayscale of all pixels in the image, with grayscale values ranging from 0 to 255, where 0 represents black and 255 represents white. The larger the average grayscale value, the brighter the overall image; the smaller the average, the darker the image.
x ¯ = 1 N i = 1 N x i
Equation (2) is the uniformity index calculation formula, which reflects the degree of uniformity in the distribution of grayscale values. In Equation (2), U represents the uniformity index; x i is the grayscale value of each pixel; x ¯ is the mean grayscale value; and N is the total number of pixels in the image. In this experiment, the uniformity index is expressed by calculating the standard deviation of the grayscale values within the selected circular region (the aquaculture tank area in the image). A smaller uniformity index indicates that the grayscale values are closer, the image has better uniformity, and the water mixing performance is stronger; conversely, a larger uniformity index suggests greater differences in grayscale values, poorer image uniformity, and weaker water mixing performance.
U = 1 N i = 1 N ( x i x ¯ )
Using MATLAB R2022b, the 600 images were batch-processed. After background subtraction, the mean grayscale value for each background-corrected image was calculated using Equation (1), and the water mixing uniformity was quantified using Equation (2).

3. Results

3.1. The Effect of Aeration Configuration on Waste Collection Efficiency

To further investigate the impact of aeration tube arrangement on the waste collection performance of the tank, waste collection tests were conducted with the aeration pump turned off. Additionally, a blank control waste collection test (without aeration tubes placed in the tank) was added to exclusively analyze the effect of the aeration tube arrangement on the waste collection performance of the tank. The experimental results are shown in Figure 8.
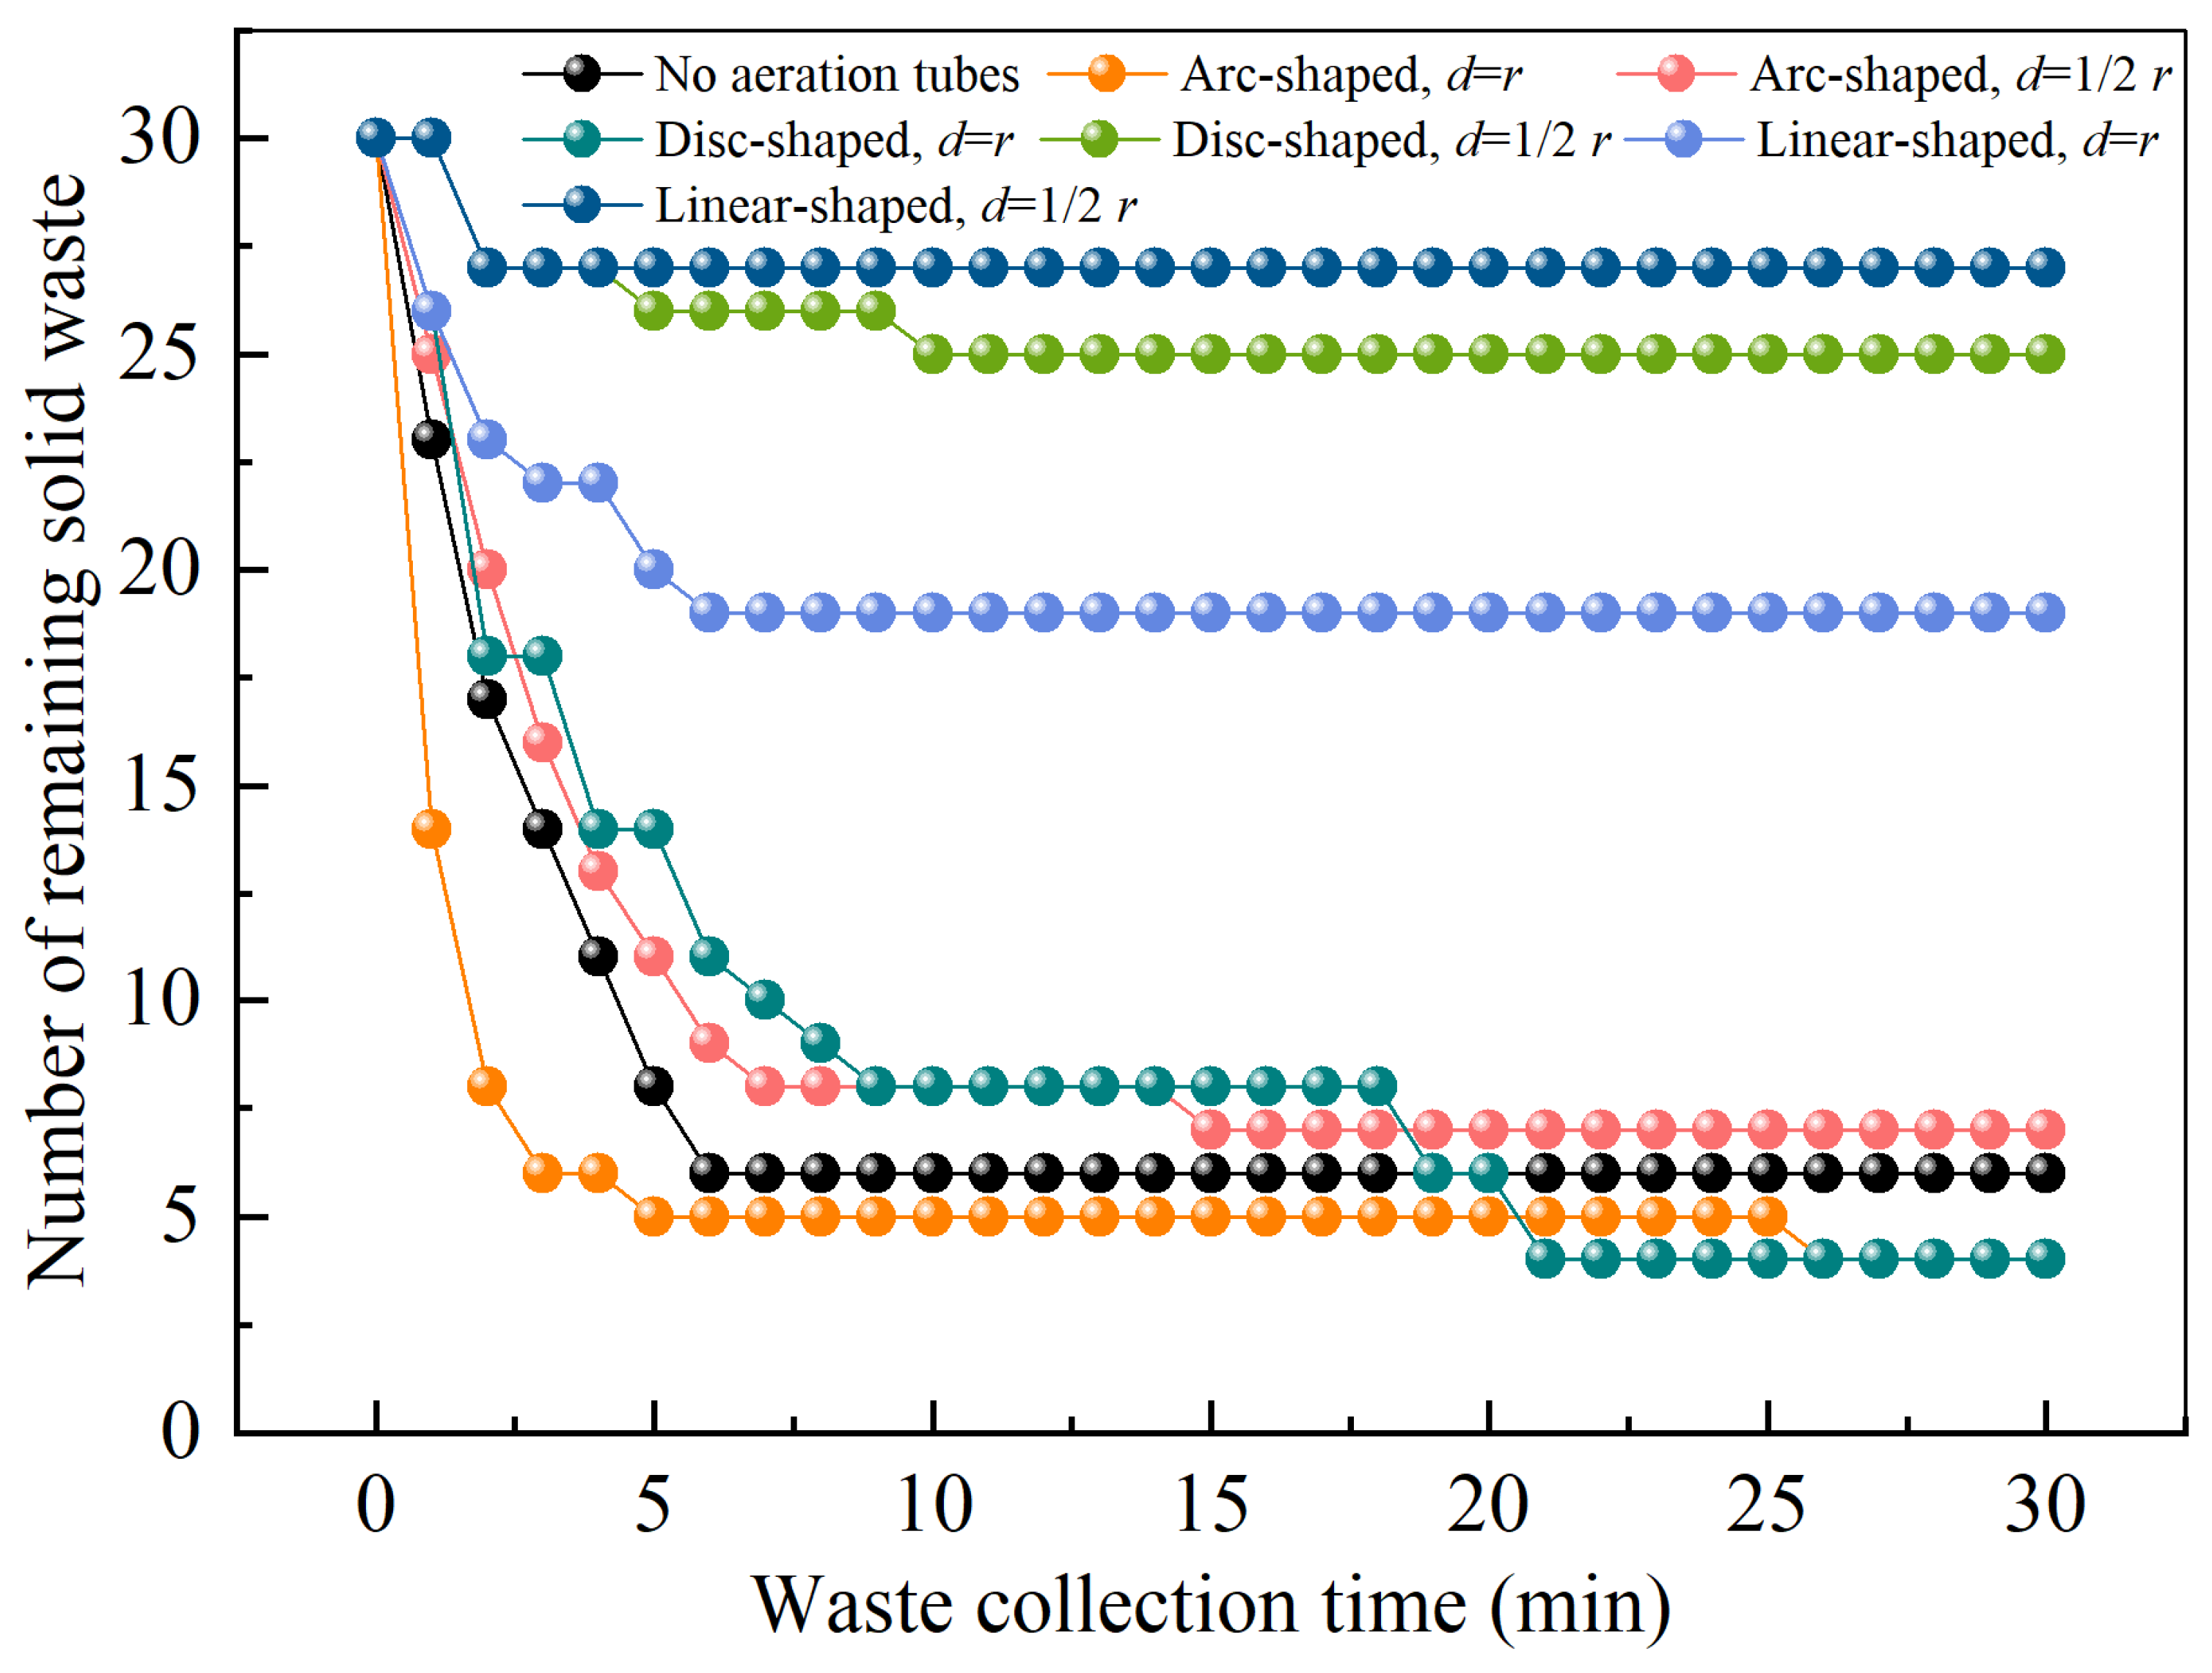
Figure 8 presents the chart of the remaining solid waste per minute in the aquaculture tank under six different aeration tube configurations without aeration. The graph indicates the following: (1) In the first 5 min, the number of remaining solid waste in the tank rapidly decreased under all conditions and then stabilized, indicating that most solid waste was effectively collected within the first few minutes, with minimal changes thereafter. Even without aeration tubes, the remaining solid waste showed a similar trend, suggesting that some waste could still be collected to a certain extent. However, the number of remaining solid waste and their trends varied under different aeration tube configurations, indicating that the shape and placement of the aeration tubes affected the tank’s waste collection performance. (2) Compared to the placement at d = 1/2r, when the aeration tube was placed near the wall (d = r), less solid waste remained at the end of the experiment, indicating more efficient waste collection performance. When the placement position of the aeration tube was the same, different tube shapes led to variations in the waste collection performance, ranked from strongest to weakest: arc-shaped > disc-shaped > linear-shaped. (3) Comparing the results with the blank control group (without aeration tubes), the waste collection performance of the tank under arc-shaped near-wall, arc-shaped 1/2r, and disc-shaped near-wall configurations was like the no-tube condition. In contrast, the performance differed significantly when the arrangement was linear-shaped and d = r, linear-shaped 1/2r, or disc-shaped 1/2r.
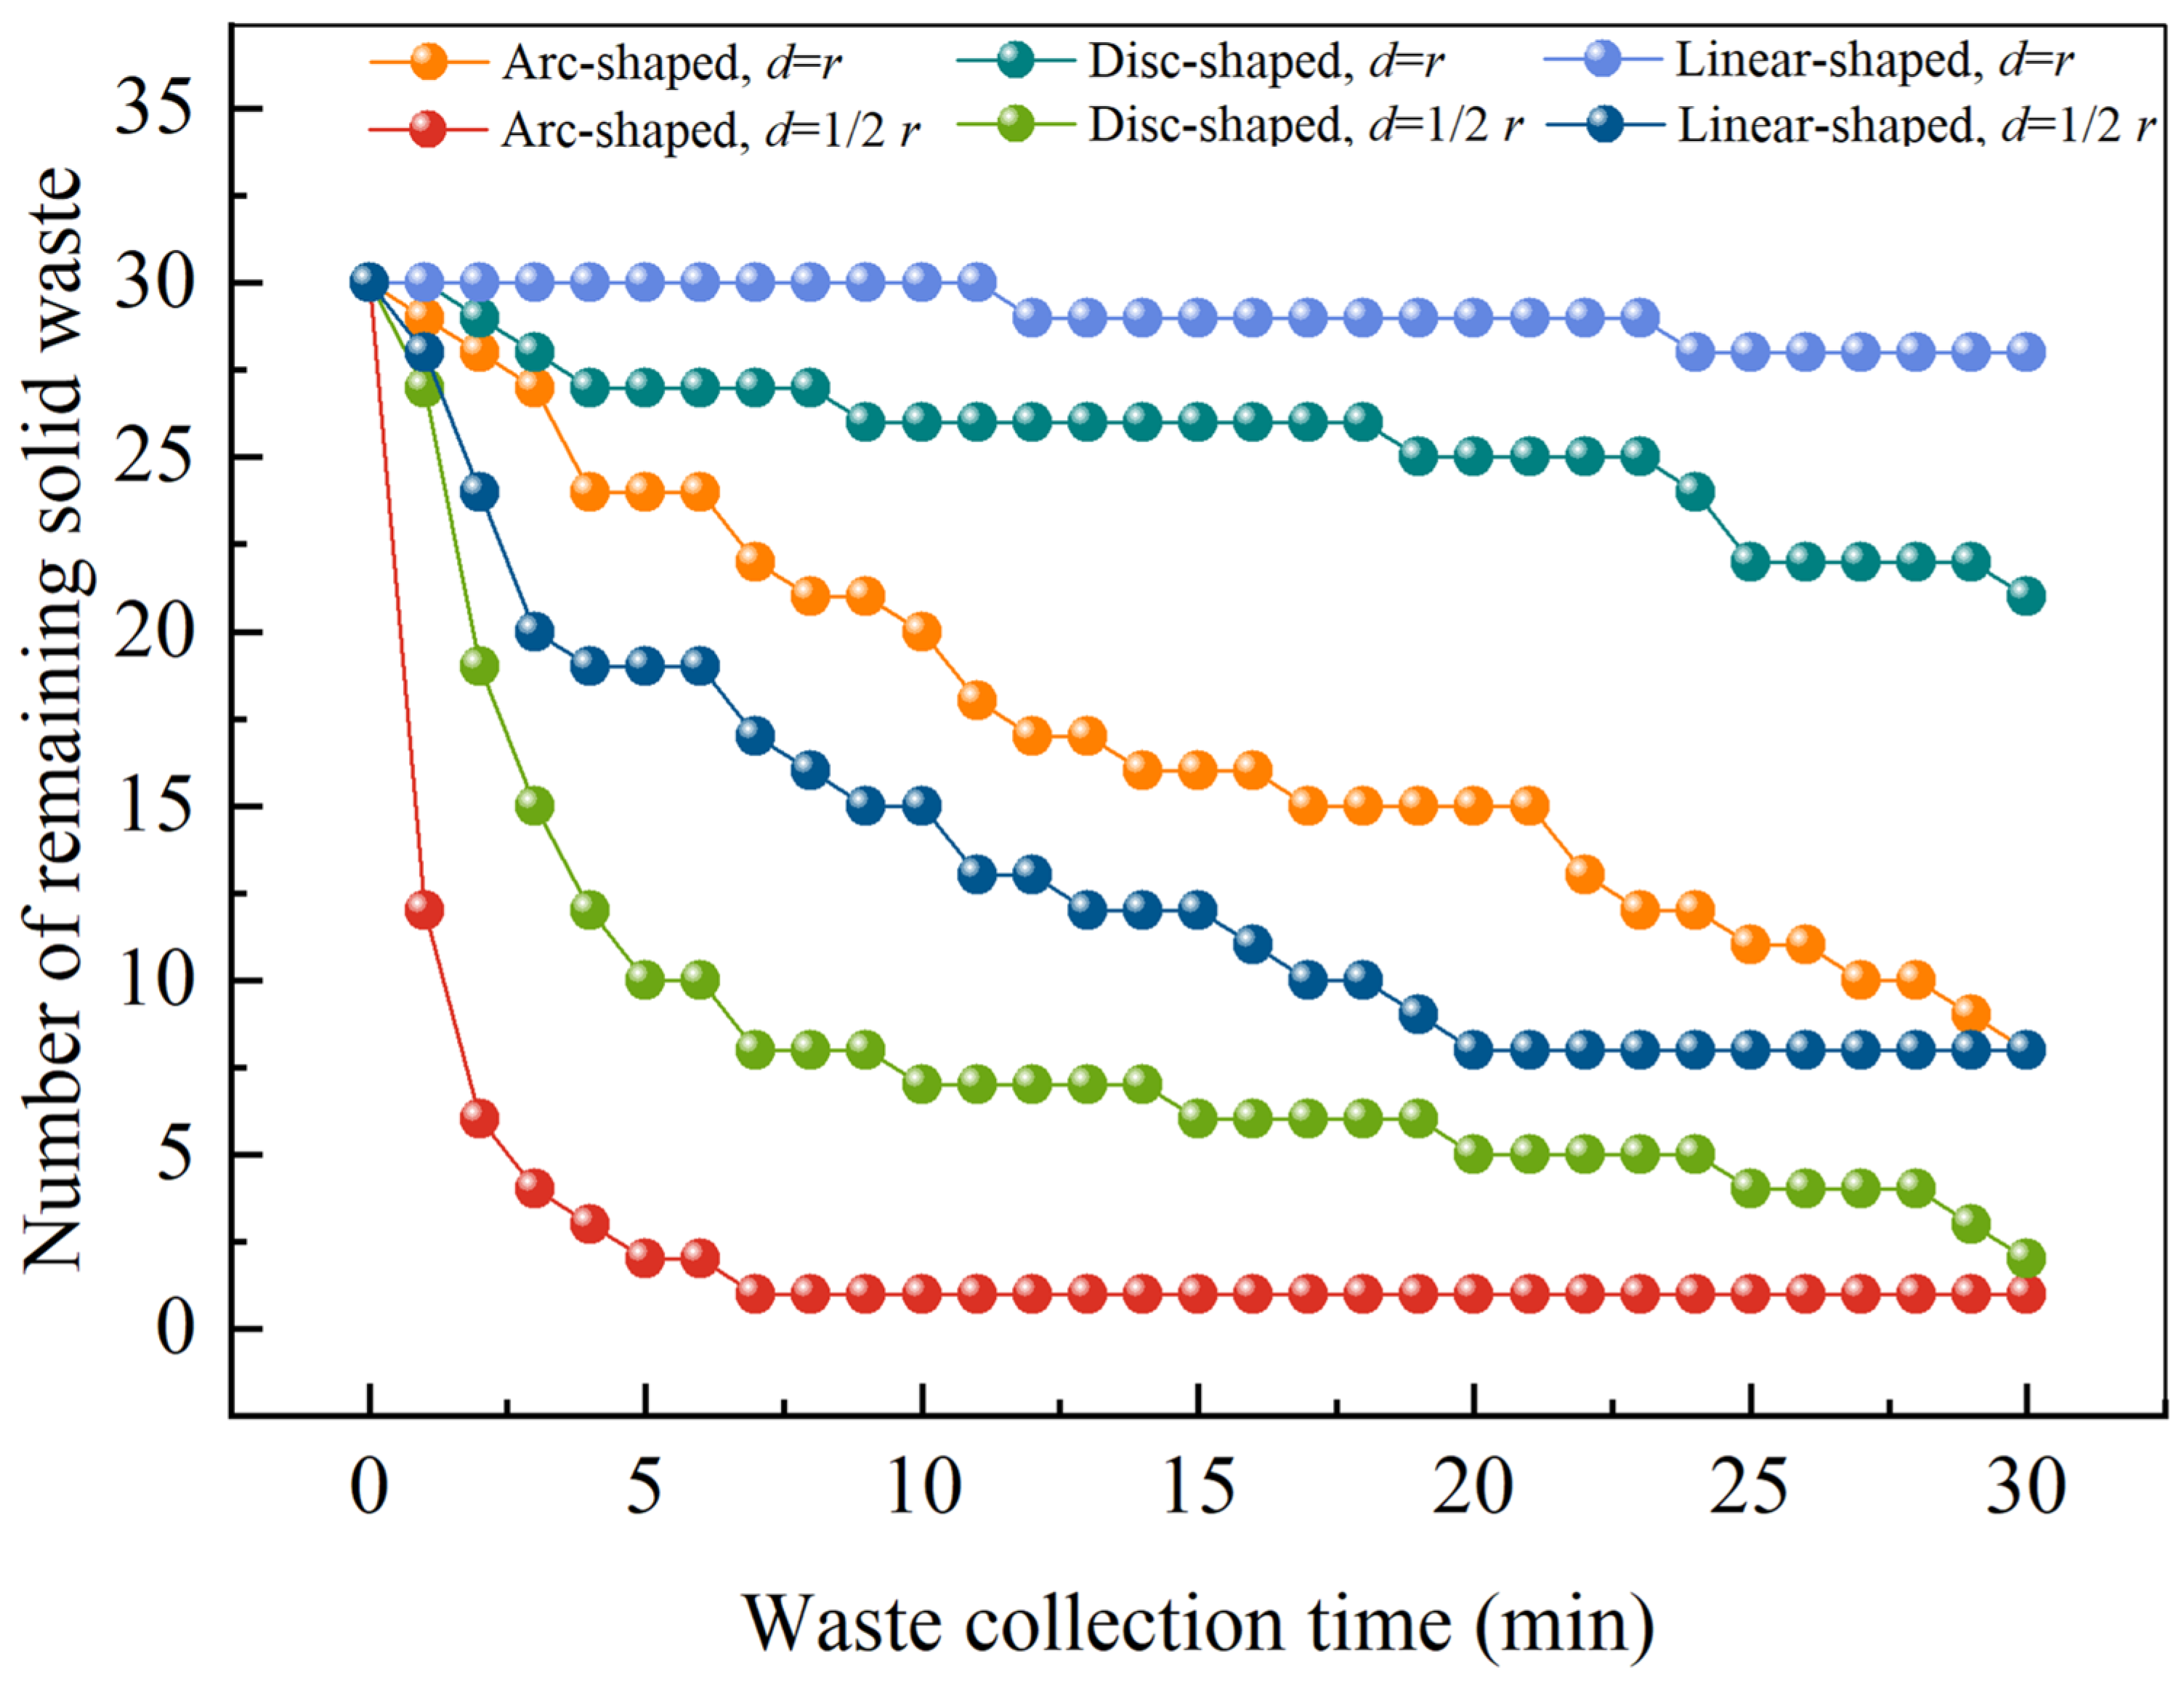
In actual aquaculture production, the operation of aeration equipment in the tanks generates a large amount of bubble plumes, and the formation of these bubble plumes inevitably leads to changes in the internal flow field and the generation of irregular turbulence. To further explore the impact of aeration on the waste collection performance of the aquaculture tank, waste collection experiments were conducted under the set aeration conditions and configurations. The results are shown in Figure 9.
Figure 9 presents the results of the remaining solid waste per minute over 30 min under different aeration tube configurations with aeration. The figure reveals that the waste collection performance of the aquaculture tank, from strongest to weakest, follows this order: arc-shaped aeration tube (d = 1/2r) > disc-shaped aeration tube (d = 1/2r) > linear-shaped aeration tube (d = 1/2r) > arc-shaped aeration tube (d = r) > disc-shaped aeration tube (d = r) > linear-shaped aeration tube (d = r). When the shape of the aeration tubes is the same, the waste collection performance is better when the aeration tubes are positioned at d = 1/2r compared to being near the tank wall (d = r). Moreover, compared to d = 1/2r, a significantly larger amount of solid waste was not removed from the tank within 30 min when the aeration tubes were placed near the tank wall, and the amount of remaining solid waste in the tank was greater.
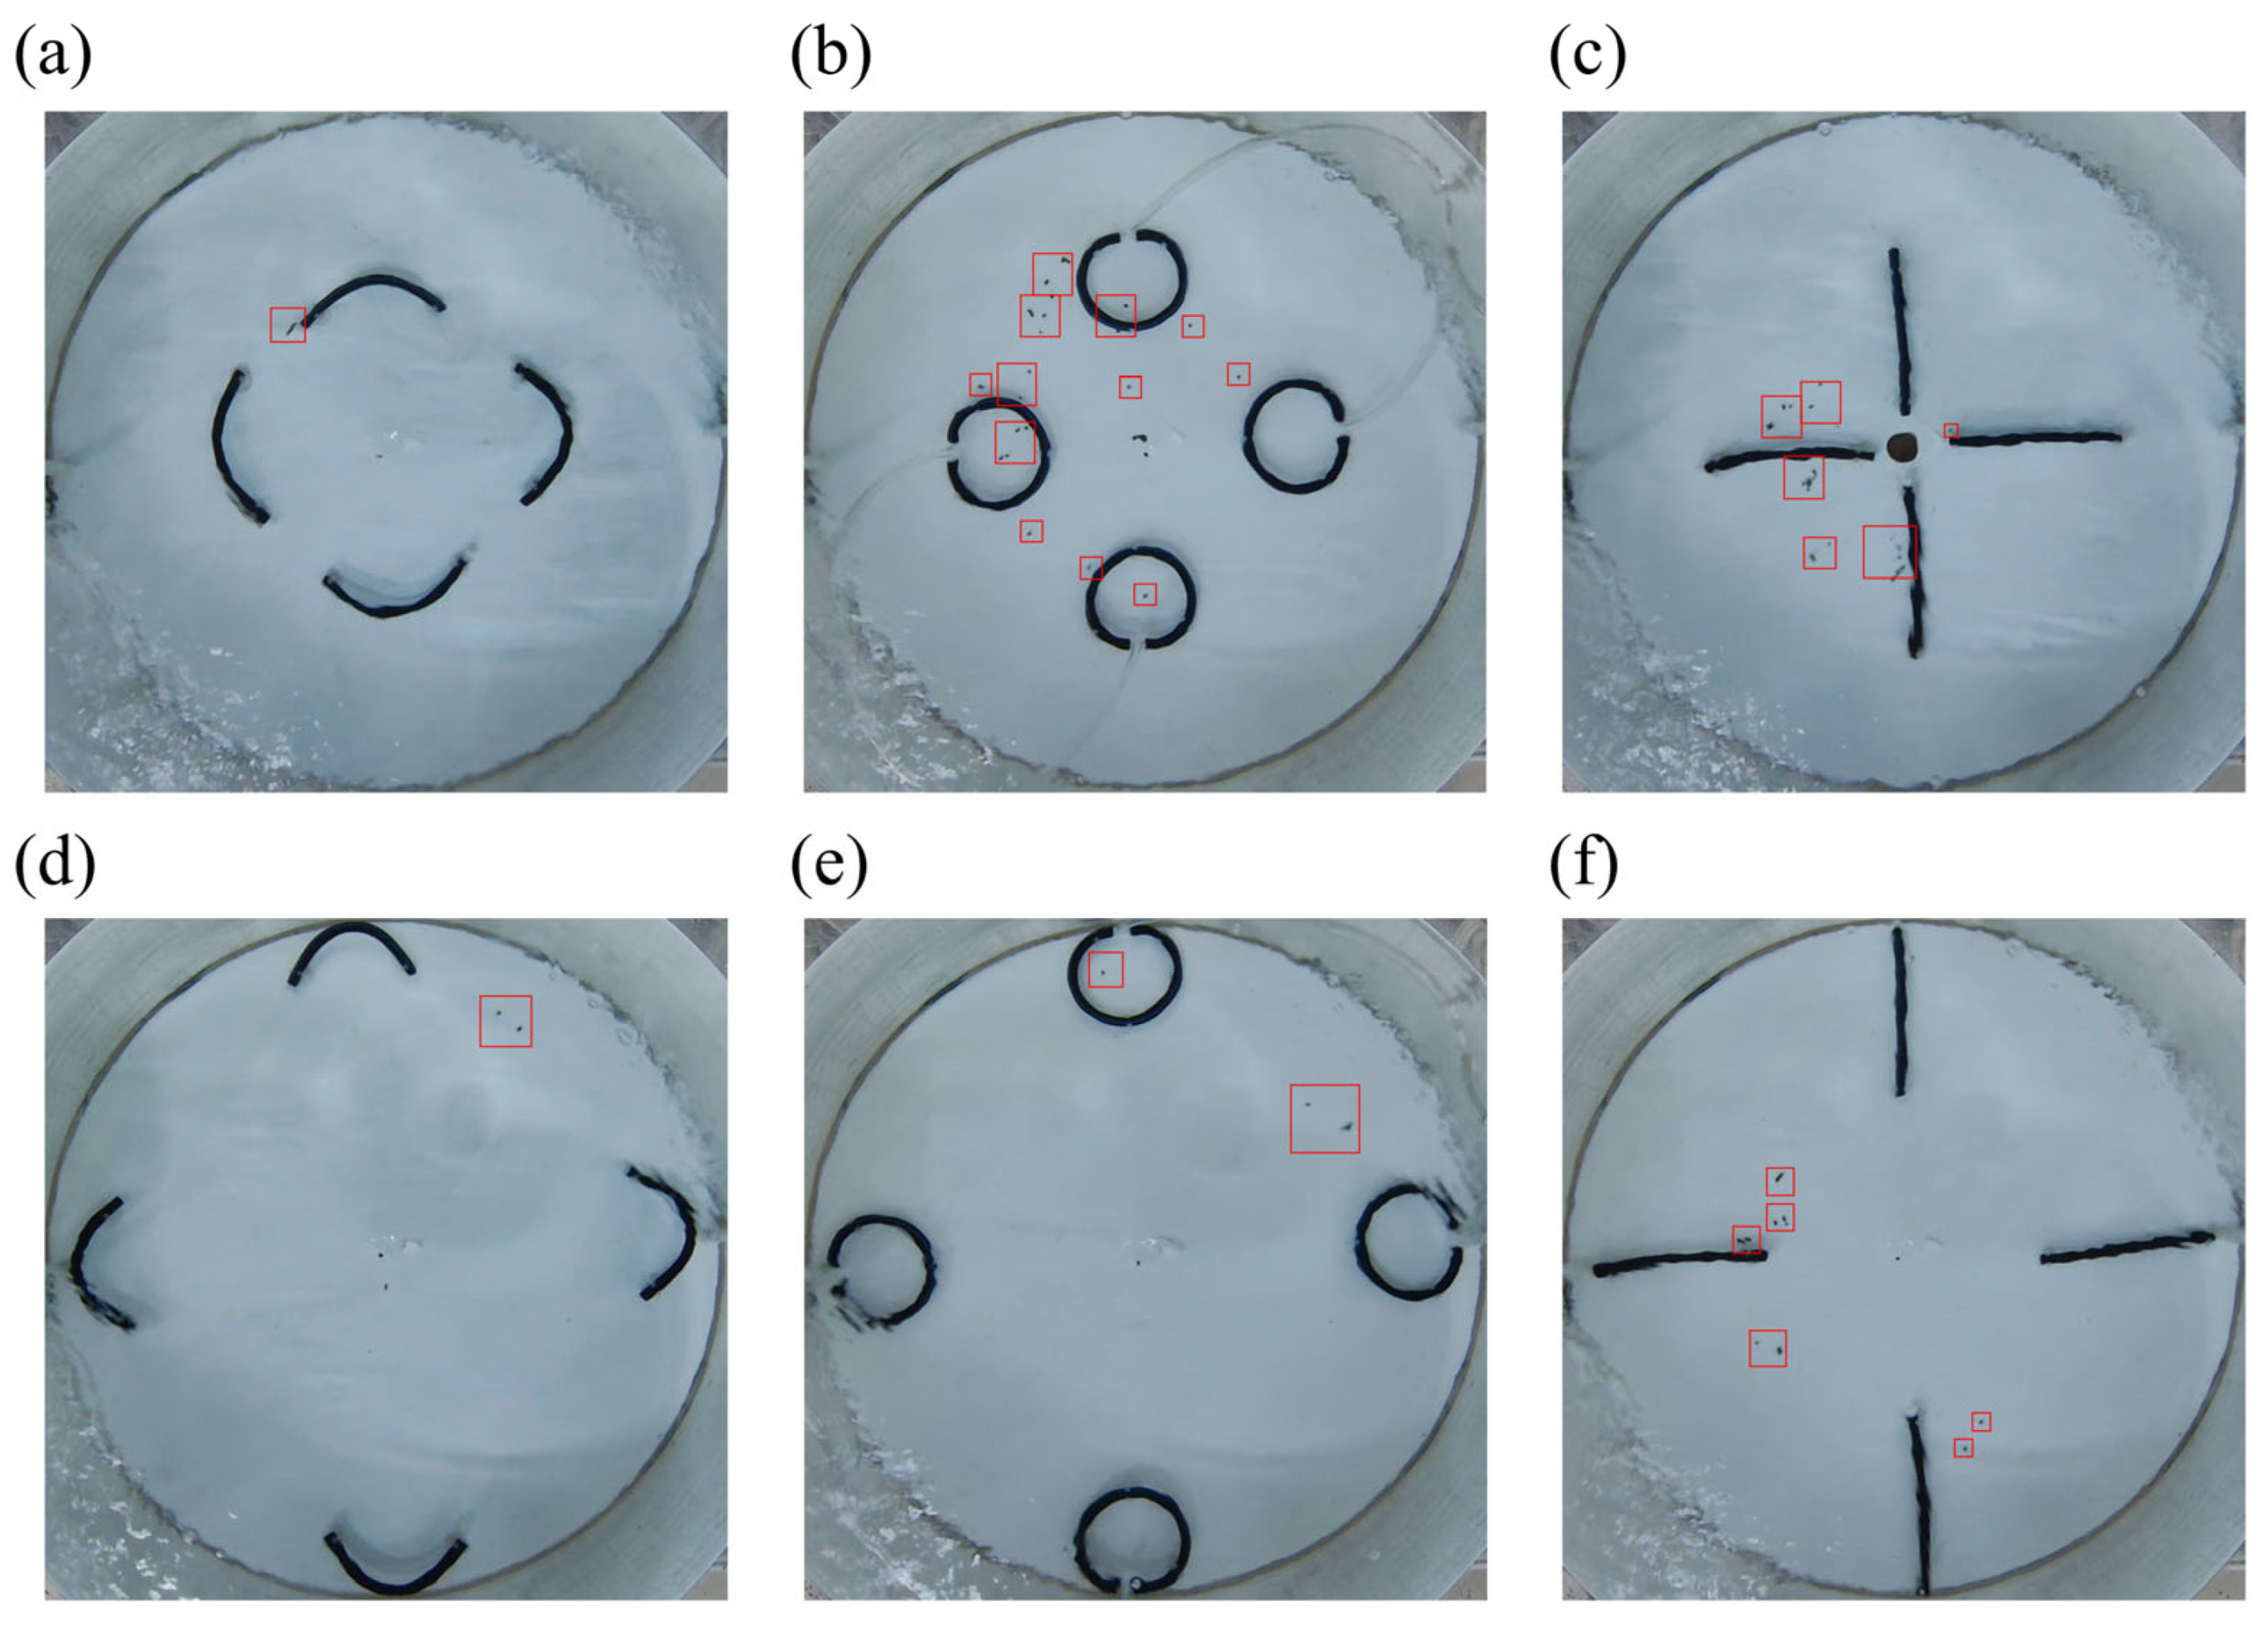
The results in Figure 8 indicate that the shape of the aeration tubes impacts the waste collection performance in the tank, ranked from strongest to weakest as follows: arc-shaped > disc-shaped > linear-shaped. The waste collection performance in the tank, based on different aeration tube placements, was ranked from strongest to weakest as follows: d = r > d = 1/2r. To investigate the reasons behind this phenomenon, a comparative observation of the waste collection experiment videos under non-aerated conditions, along with images of waste accumulation under different aeration tube configurations (Figure 10).
Figure 10 reveals the following: The arc-shaped aeration tube, due to its curvature, almost does not obstruct the collection or removal of solid waste when placed in the tank. As a result, the waste collection performance with the arc-shaped tube placed at d = 1/2r or r (Figure 10a,d) is similar to that of the setup without aeration tubes. The disc-shaped aeration tube, when positioned along the tank wall (Figure 10e), minimally obstructs waste movement, but when placed at d = 1/2r (Figure 10b), it blocks a significant amount of solid waste, leading to waste accumulation around the tube and reducing the waste collection efficiency. This also explains the significant performance difference between the disc-shaped tube placed near the wall and at d = 1/2r. The linear-shaped aeration tube, vertically installed in the tank, tends to obstruct the solid waste as it collects towards the drain. Therefore, compared to setups without aeration tubes, both the d = r (Figure 10c) and d = 1/2r (Figure 10f) configurations of the linear-shaped tube result in more waste accumulation, leading to a decrease in the tank’s waste collection performance.
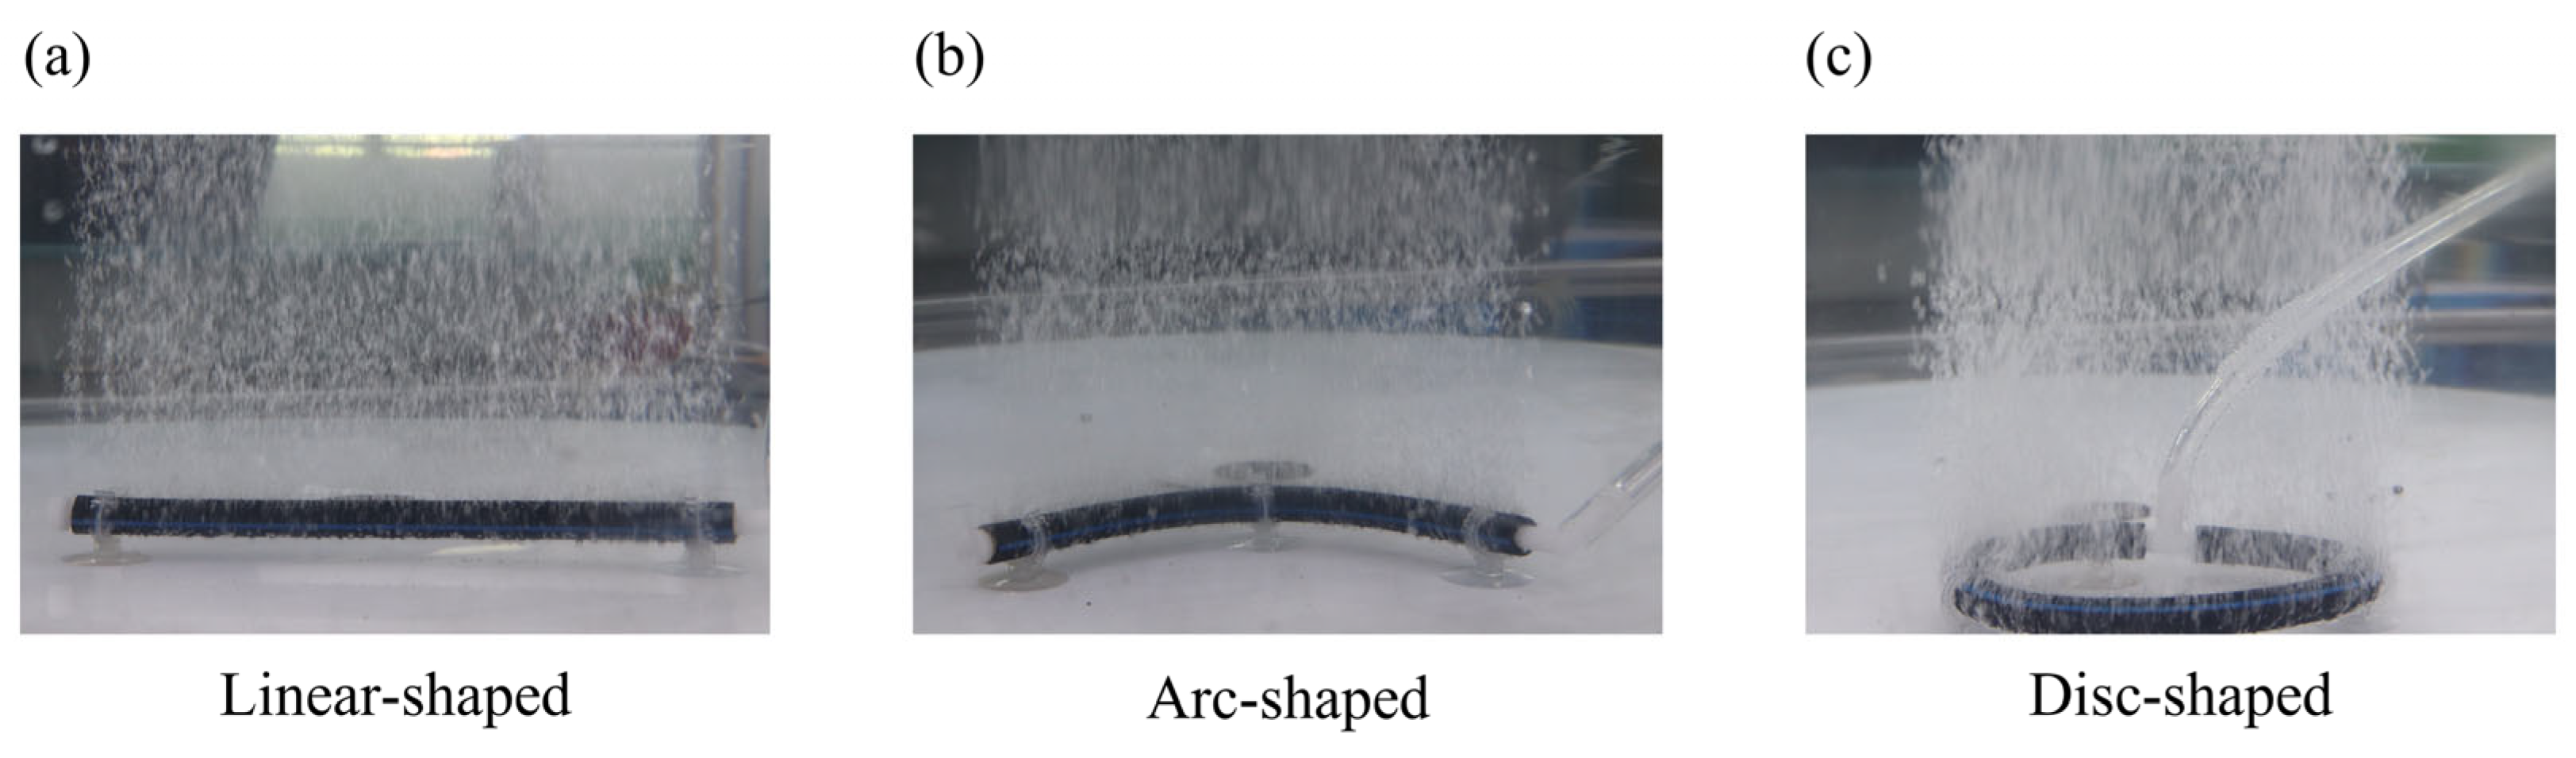
Comparing Figure 8 and Figure 9, it can be observed that when aeration tubes are installed but not operating, the tanks with aeration tubes placed near the wall show better waste collection performance. However, under aeration conditions, the waste collection performance of the tanks with the aeration tube placed at d = 1/2r becomes stronger compared to d = r. To explore the reasons behind this result, by reviewing the video footage from the waste collection experiment, it was found that during aeration, many bubbles are generated and continuously rise from the bottom to the surface, eventually forming a bubble plume in a shape like that of the aeration tube’s configuration (Figure 11).
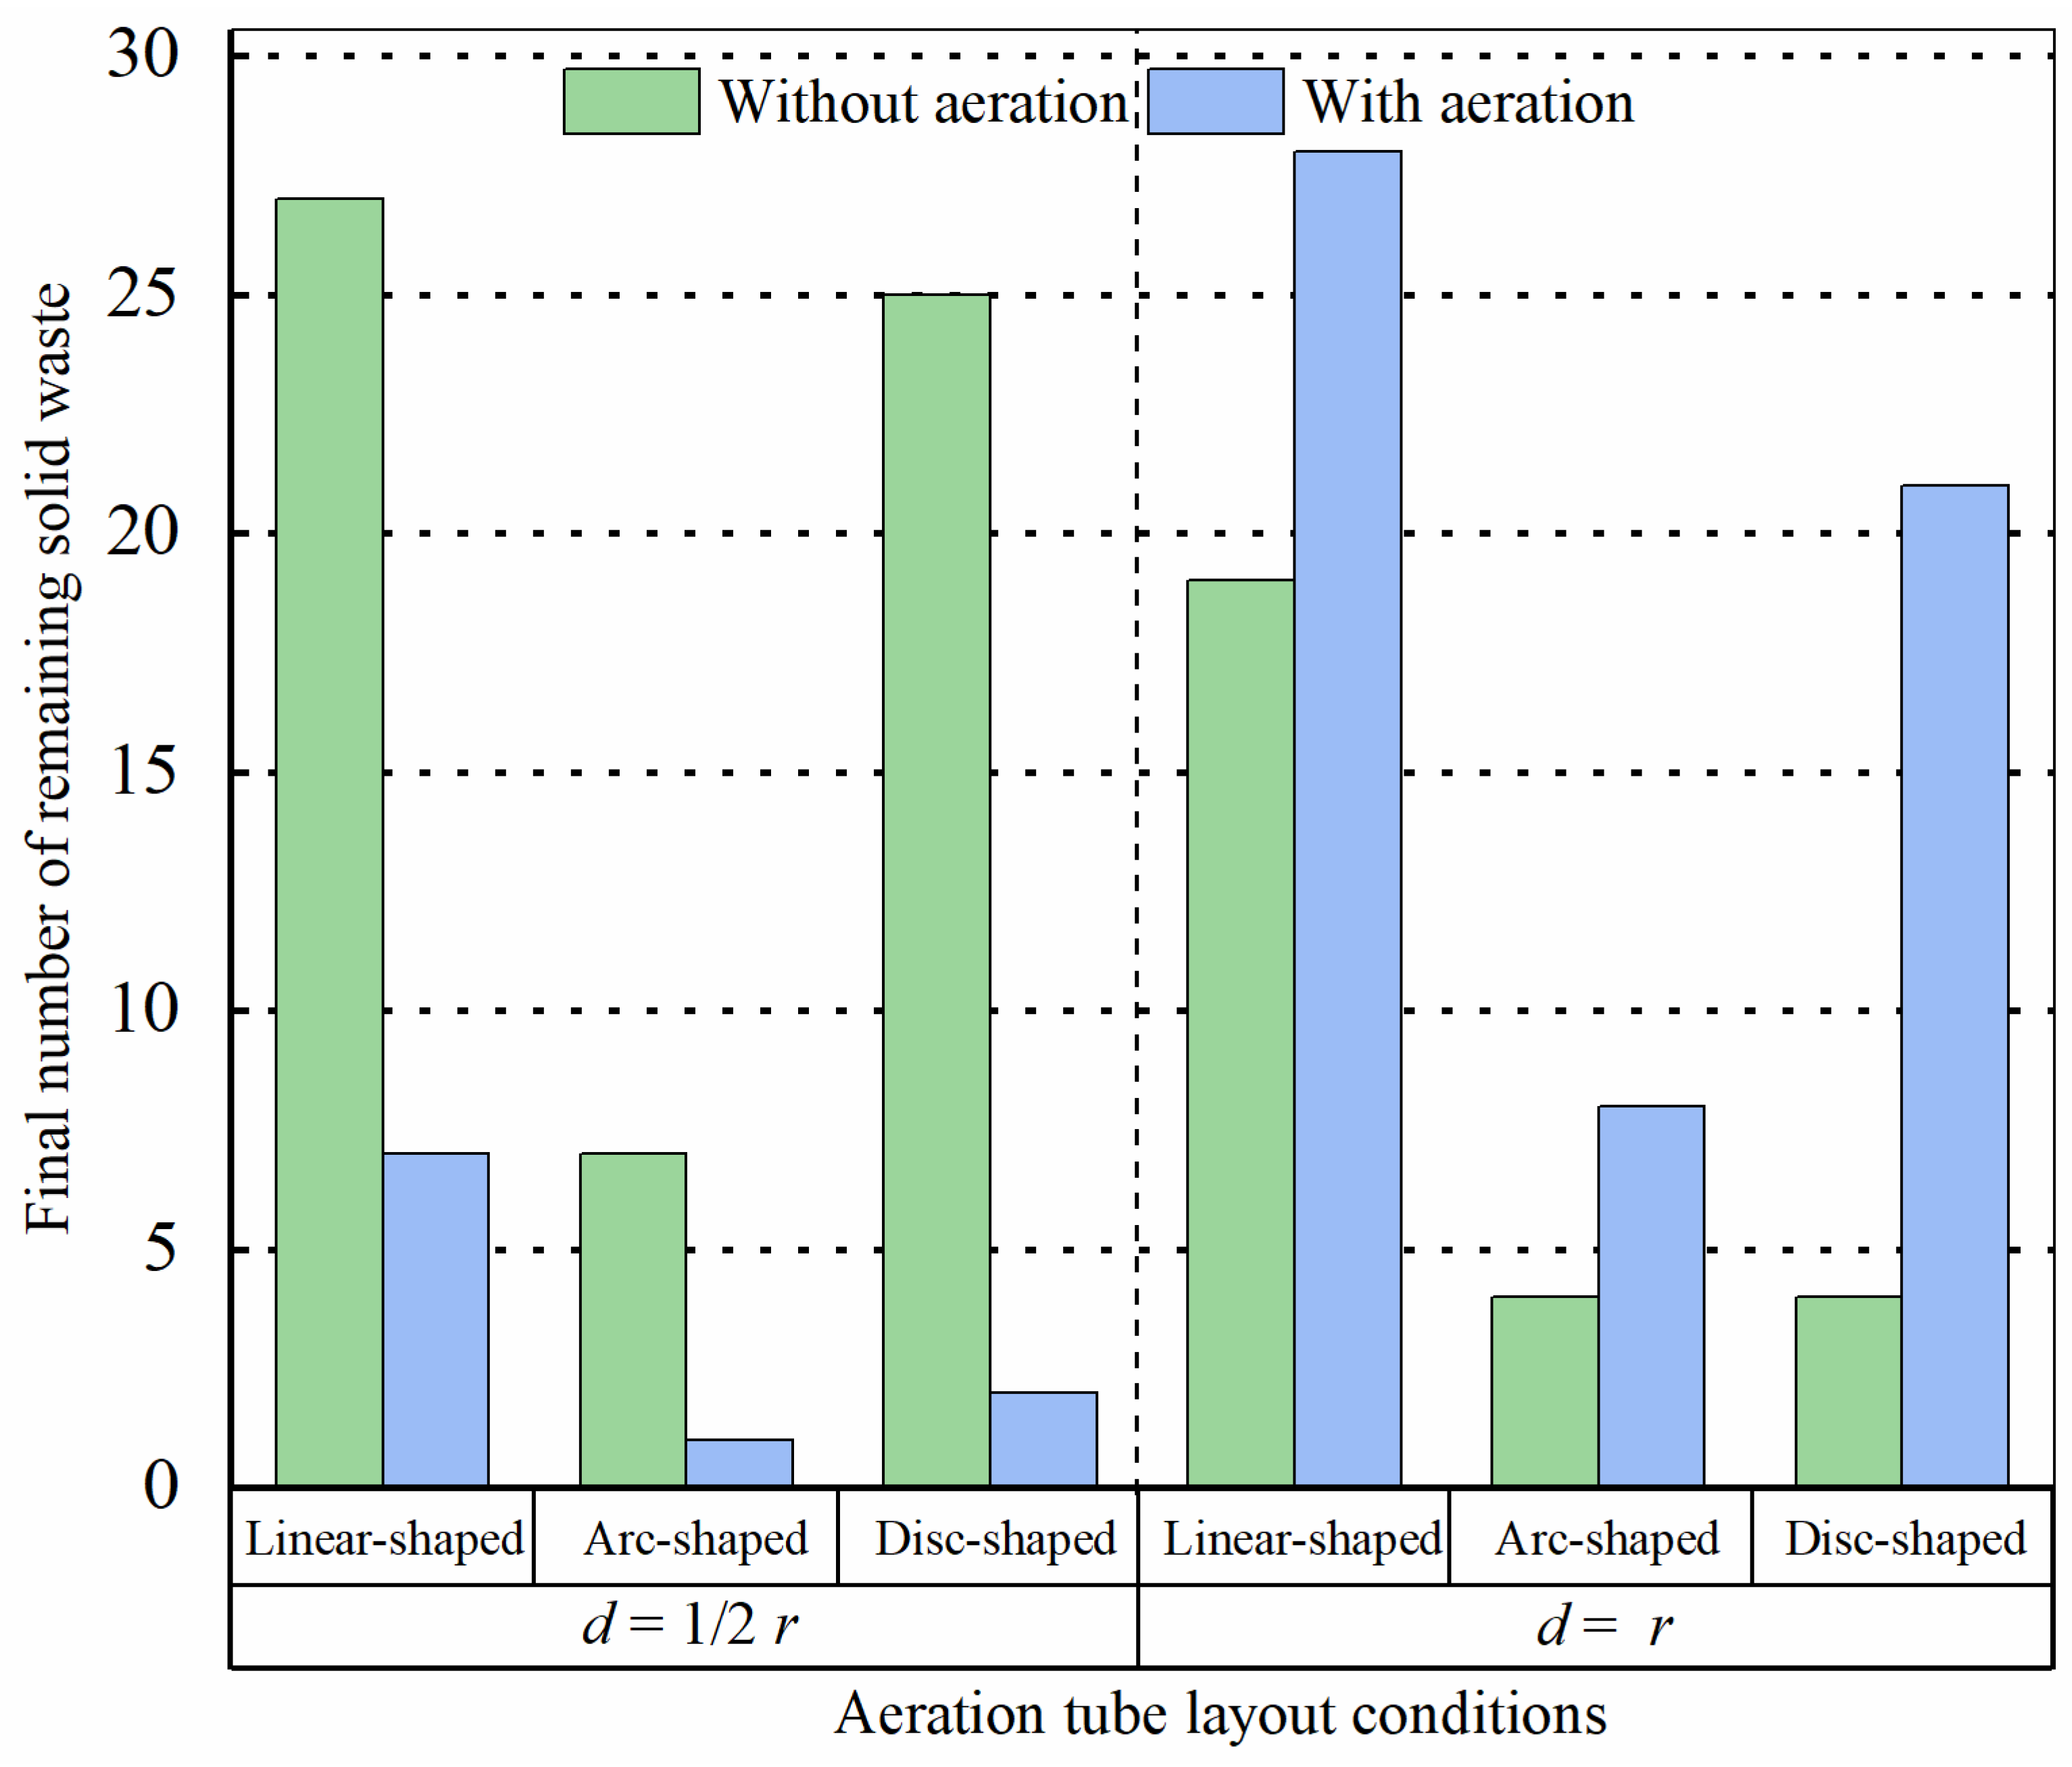
Based on the differences in the experimental results, to comprehensively analyze the impact of bubble plume generated by aeration on the waste collection performance in circular recirculating aquaculture tanks, a comparative analysis was conducted on the number of remaining solid waste in the tank at the end of the collection experiments under different aeration tube configurations, both with and without aeration, as shown in Figure 12.
Figure 12 shows that when the aeration tubes are positioned at d = 1/2r, the amount of remaining solid waste in the tank under aeration conditions decreases for all three shapes of aeration tubes compared to the non-aeration condition, resulting in a significant improvement in the waste collection performance of the aquaculture tank. Conversely, when the aeration tubes are placed at d = r, the amount of remaining solid waste in the tank under aeration conditions increases for all three shapes compared to the non-aeration condition, leading to a reduction in waste collection performance. During the transition from non-aeration to aeration, the different placements of the aeration tubes in the aquaculture tank resulted in completely opposite trends in waste collection performance. In this experiment, when the shapes of the aeration tubes are the same, the only varying factor under the set aeration and non-aeration conditions is the position of the bubble plume generated within the tank. Based on this, bubble plumes have a significant impact on the waste collection performance of the aquaculture tank.

3.2. The Effect of Aeration Configuration on Water Mixing Efficiency

In RAS, dissolved oxygen (DO) is one of the key factors in maintaining the life activities of aquatic organisms and ensuring the effective operation of the system [21]. Efficient water mixing performance in aquaculture tanks greatly enhances both water quality optimization and the uniform distribution of dissolved oxygen. Therefore, analyzing and optimizing the placement of aeration tubes to improve water quality and the even distribution of dissolved oxygen is a crucial step in enhancing the efficiency of RAS. This can also provide valuable technical support for the sustainable development of the aquaculture industry.
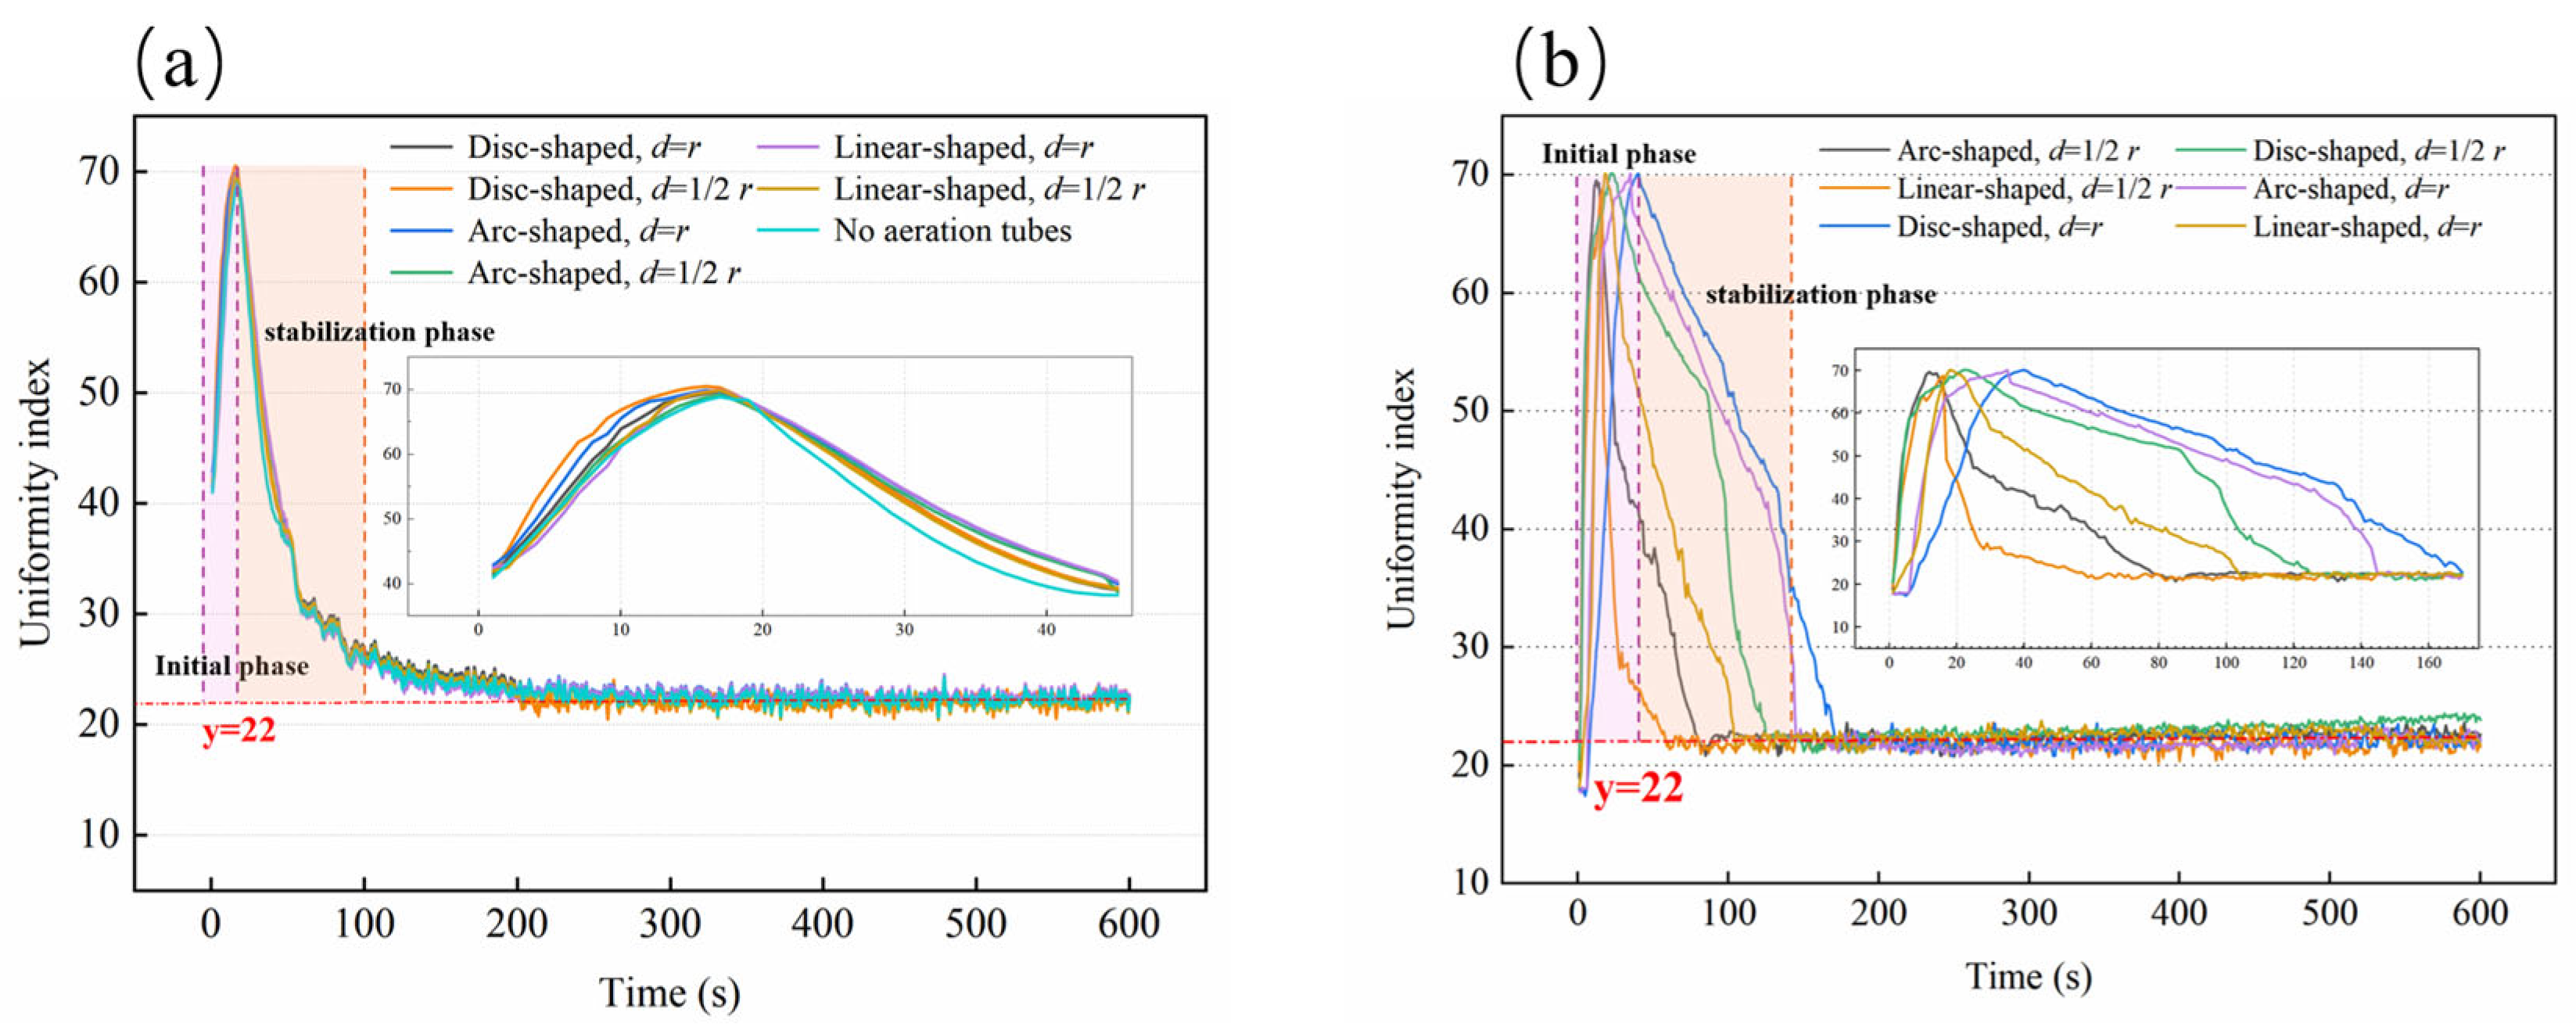
To comprehensively study the effect of aeration tube placement on water mixing performance within the tank, seven aeration tube configurations identical to those used in the waste collection experiment were set for the water mixing test under non-aeration conditions. A camera was used to record the entire experiment. MATLAB was then used to process the relevant video footage, and Equation (2) was applied to calculate the uniformity index changes in the water within the tank over 10 min under different conditions. The results are shown in Figure 13.
As defined in Section 2.3.2, a smaller uniformity index corresponds to a more homogeneous state. Therefore, a steeper and faster reduction in the index curve over time represents a more rapid water mixing process, whereas a slower reduction indicates delayed mixing. Figure 13 shows the variation in the uniformity index (standard deviation of grayscale values) within a circular recirculating aquaculture tank over 600 s under different aeration tube configurations. Figure 13a indicates that in the initial phase (0–100 s), during the first 0–25 s, the uniformity index within the tank increased rapidly with significant fluctuations. Around 25 s, the uniformity index in all scenarios peaked, rising from approximately 42 to around 70 (It should be noted that the maximum uniformity index of approximately 70 observed in this study is not the theoretical mathematical maximum for grayscale standard deviation; rather, it represents the empirical maximum detectable under the specific experimental setup, determined by the initial contrast between the ink and water, lighting conditions, and camera parameters.), indicating that the tank’s water was in the initial mixing stage, with a clear distinction between the clear and black mixed water. As time progressed, the spread of ink increased, but the proportion of mixed water in the tank did not exceed half. During the 25–100 s period, the uniformity index rapidly decreased from around 70 to approximately 27, as the proportion of mixed water in the tank exceeded half and continued to grow. During the stabilization phase (100–200 s), the uniformity index showed a fluctuating downward trend, though the overall decline was minimal, from around 27 to about 22. At this point, the water in the tank was mostly mixed, though not fully uniform. In the stable phase (200–600 s), the fluctuation of the curves was minimal, indicating that the mixing of ink and tank water was complete, with the uniformity index remaining steady within a certain range.
Additionally, in Figure 13a, the trend in the uniformity index for the control group without aeration tubes is consistent with the other six setups that had aeration tubes installed. This indicates that, under non-aerated conditions, the shape and placement of the aeration tubes at the bottom of the tank had minimal impact on water mixing performance. Figure 13b shows the variation in the uniformity index under different aeration tube configurations during aeration. The curves in the image exhibit an initial rise followed by a decline within the first 50 s, after which they stabilize, with the uniformity index maintaining around 22, indicating that the water mixing process had reached a stable and uniform state. By comparing Figure 13a, where the water mixing in tanks without aeration tubes is completed in about 200 s, it is evident that aeration enhances water mixing performance. However, Figure 13b also shows that the time required to achieve uniform mixing varied across different aeration tube shapes and placements, indicating that tube configuration affects water mixing performance. The water mixing performance, ranked from strongest to weakest across the six setups, was: linear-shaped aeration tube (d = 1/2r) > arc-shaped aeration tube (d = 1/2r) > linear-shaped aeration tube (d = r) > disc-shaped aeration tube (d = 1/2r) > arc-shaped aeration tube (d = r) > disc-shaped aeration tube (d = r).
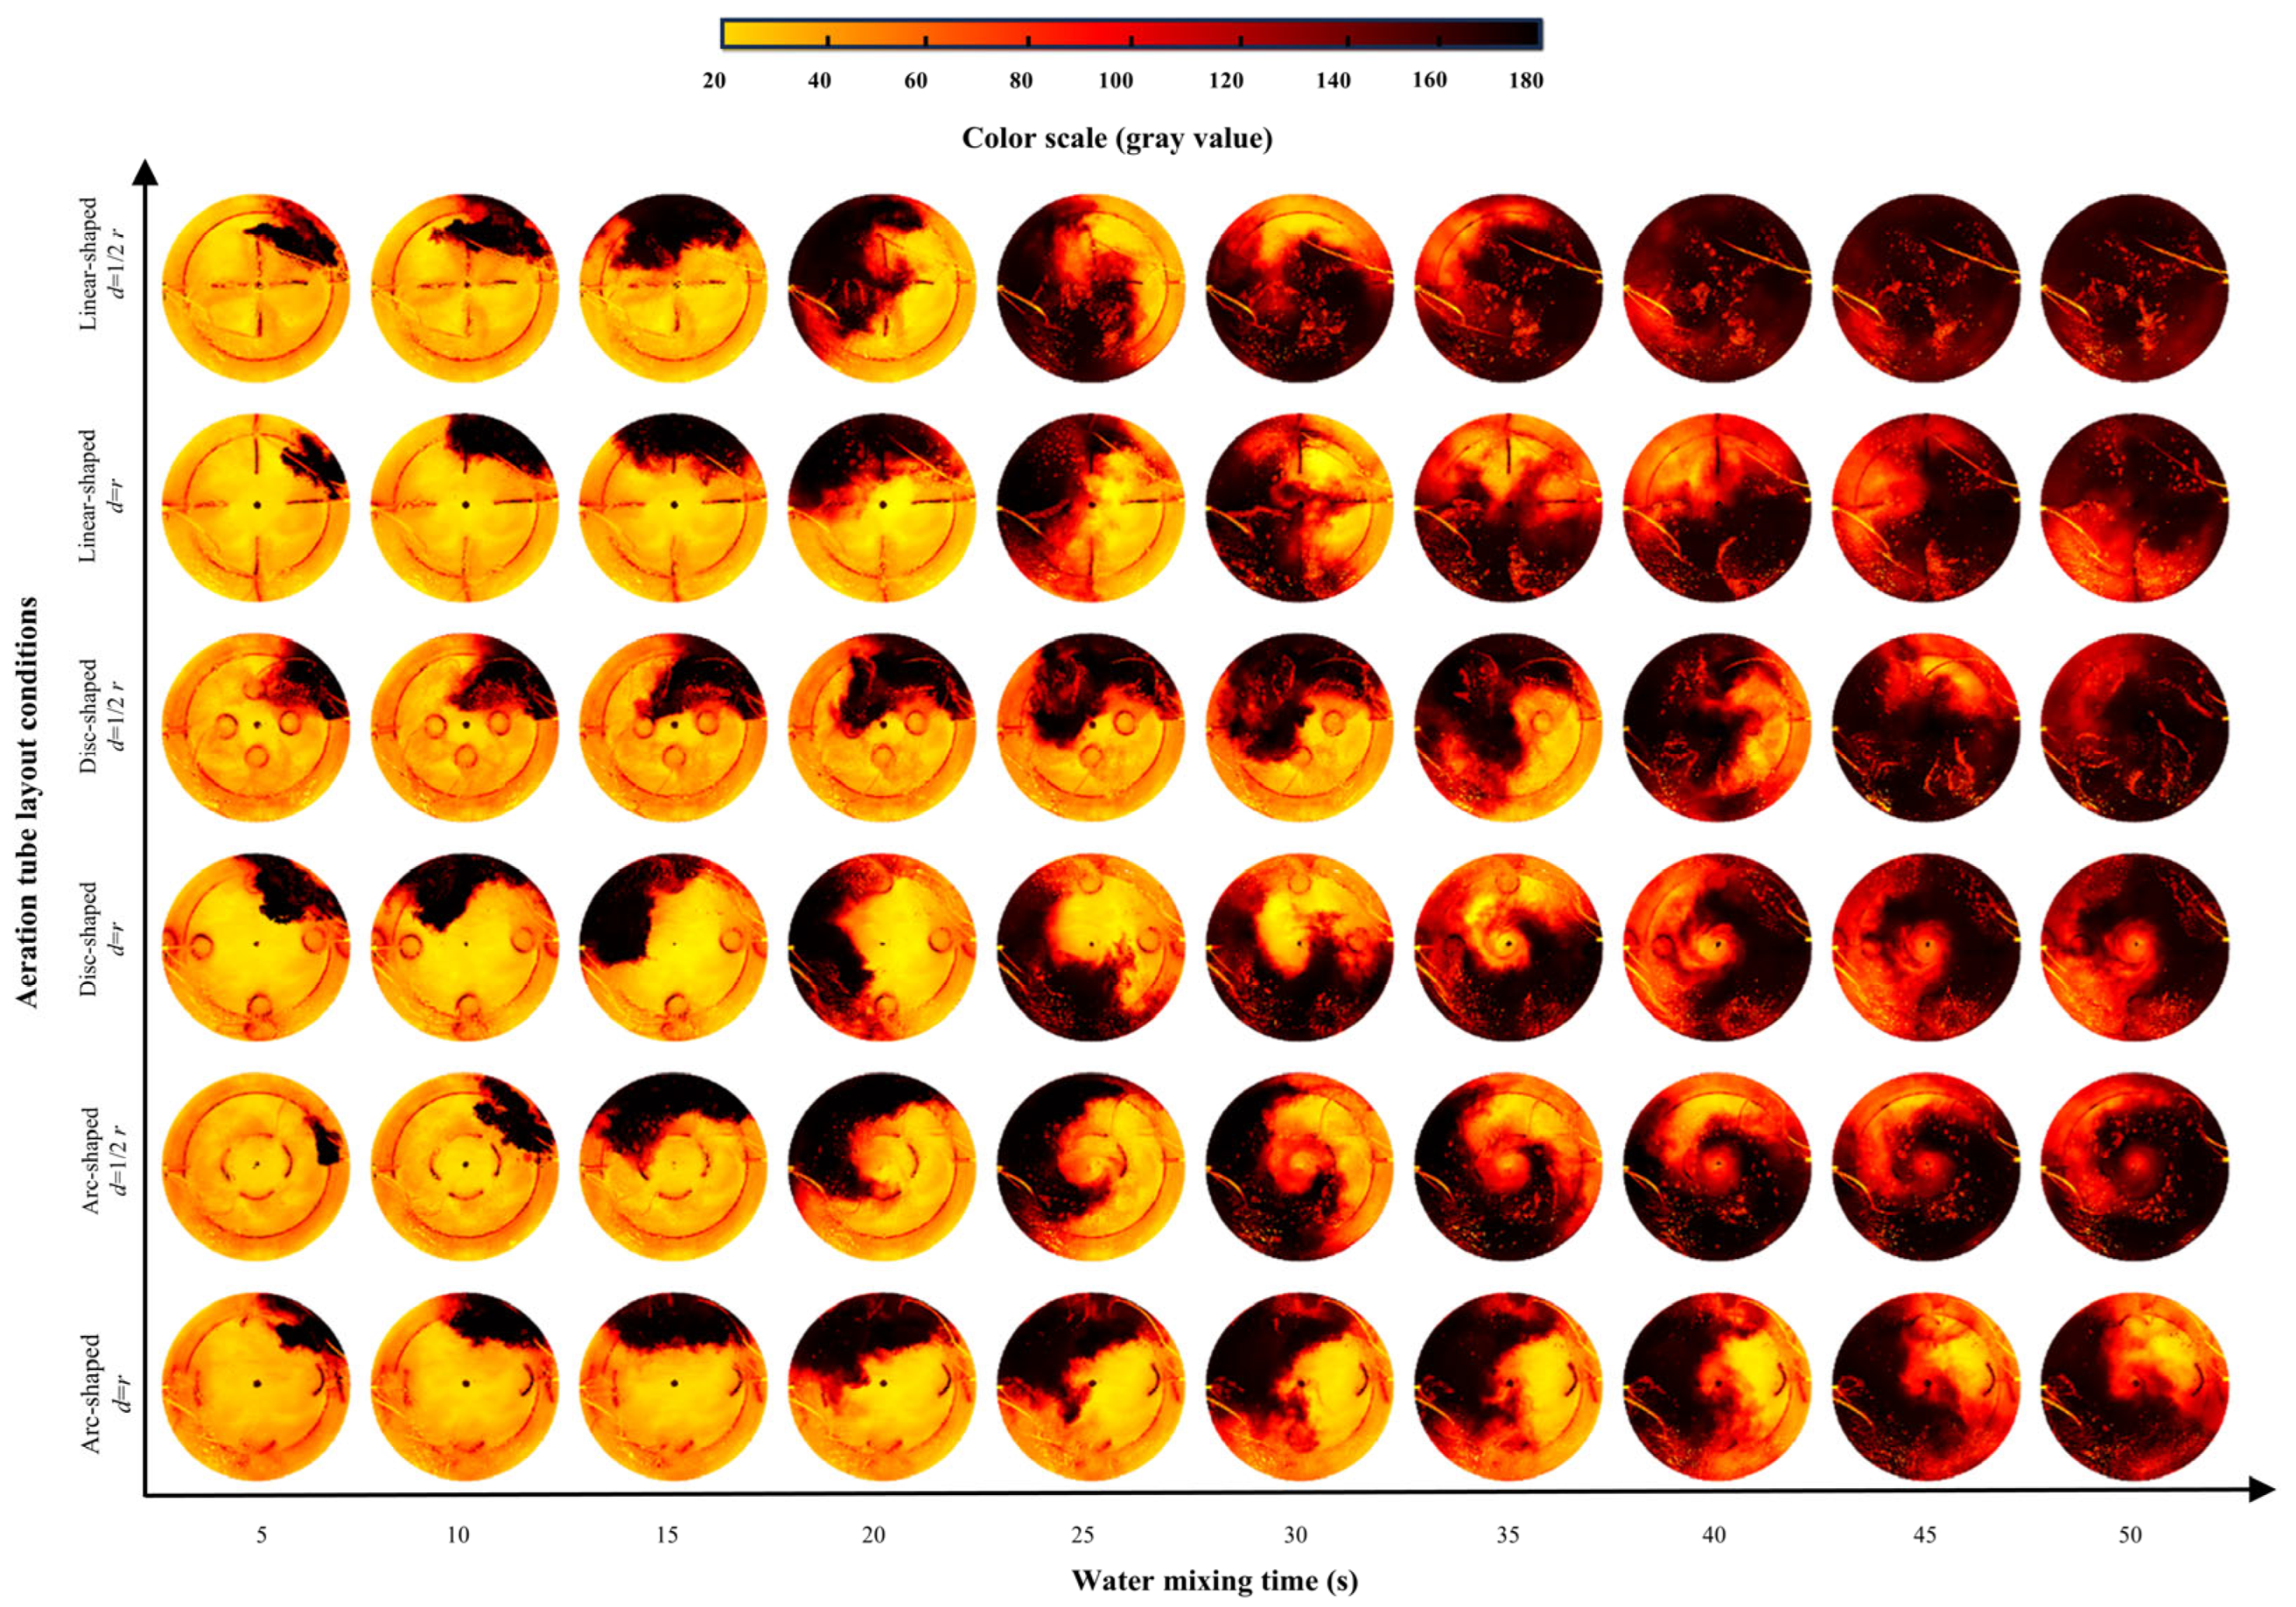
Based on the differences in the experimental results, the formation of a bubble plume is also closely related to the water mixing performance in the aquaculture tank. As shown in Figure 13b, the uniformity index of the water in the tank under different aeration tube configurations continuously changes between 0 and 50 s, although the extent of the changes varies. In the water mixing experiment, except for the difference in aeration tube configurations, all other test conditions were the same. Therefore, the movement of the mixed water (ink mixed with transparent water) in the tank can be observed to analyze the reason for the differences in water mixing performance across different aeration tube configurations. Images of the changes in mixed water from 5 to 50 s were captured at 5 s intervals under different aeration tube configurations. These images were then converted into more intuitive heatmaps using MATLAB, allowing for a better analysis of the water mixing conditions under each configuration, as shown in Figure 14.
From observing Figure 14, during the 0–50 s water mixing experiment, when the aeration tube shapes are the same, the ink diffuses faster at d = 1/2r than at d = r. Similarly, in the heatmap at 50 s, the grayscale values of water at different locations in the tank vary significantly when the aeration tubes are positioned at d = r, while the differences are smaller at d = 1/2r. Therefore, when the aeration tube shapes are the same, positioning the tube at d = 1/2r results in better water mixing performance. When comparing different aeration tube shapes with the same positioning, the linear-shaped aeration tube, which had the poorest waste collection performance, exhibited excellent water mixing performance. Over the same time frame, the water was more evenly mixed, and the grayscale value differences were smaller at 50 s compared to tanks with other aeration tube shapes. The water mixing performance in tanks equipped with arc-shaped aeration tubes ranked second. When positioned at d = r, the water in the center of the tank mixed more slowly compared to the surrounding water, resulting in larger differences in grayscale values at different locations within the tank after 50 s. In comparison to the other two aeration tube shapes, the disc-shaped aeration tubes exhibited the slowest water mixing speed during the 5–50 s interval, with the largest variations in grayscale values across different areas within the tank. At the 50 s, the water at the center of the tank, where the arc-shaped aeration tube was positioned at d = 1/2r, had not yet completed mixing.

4. Discussion

4.1. How Does Aeration Tube Shape Affect Waste Collection Efficiency

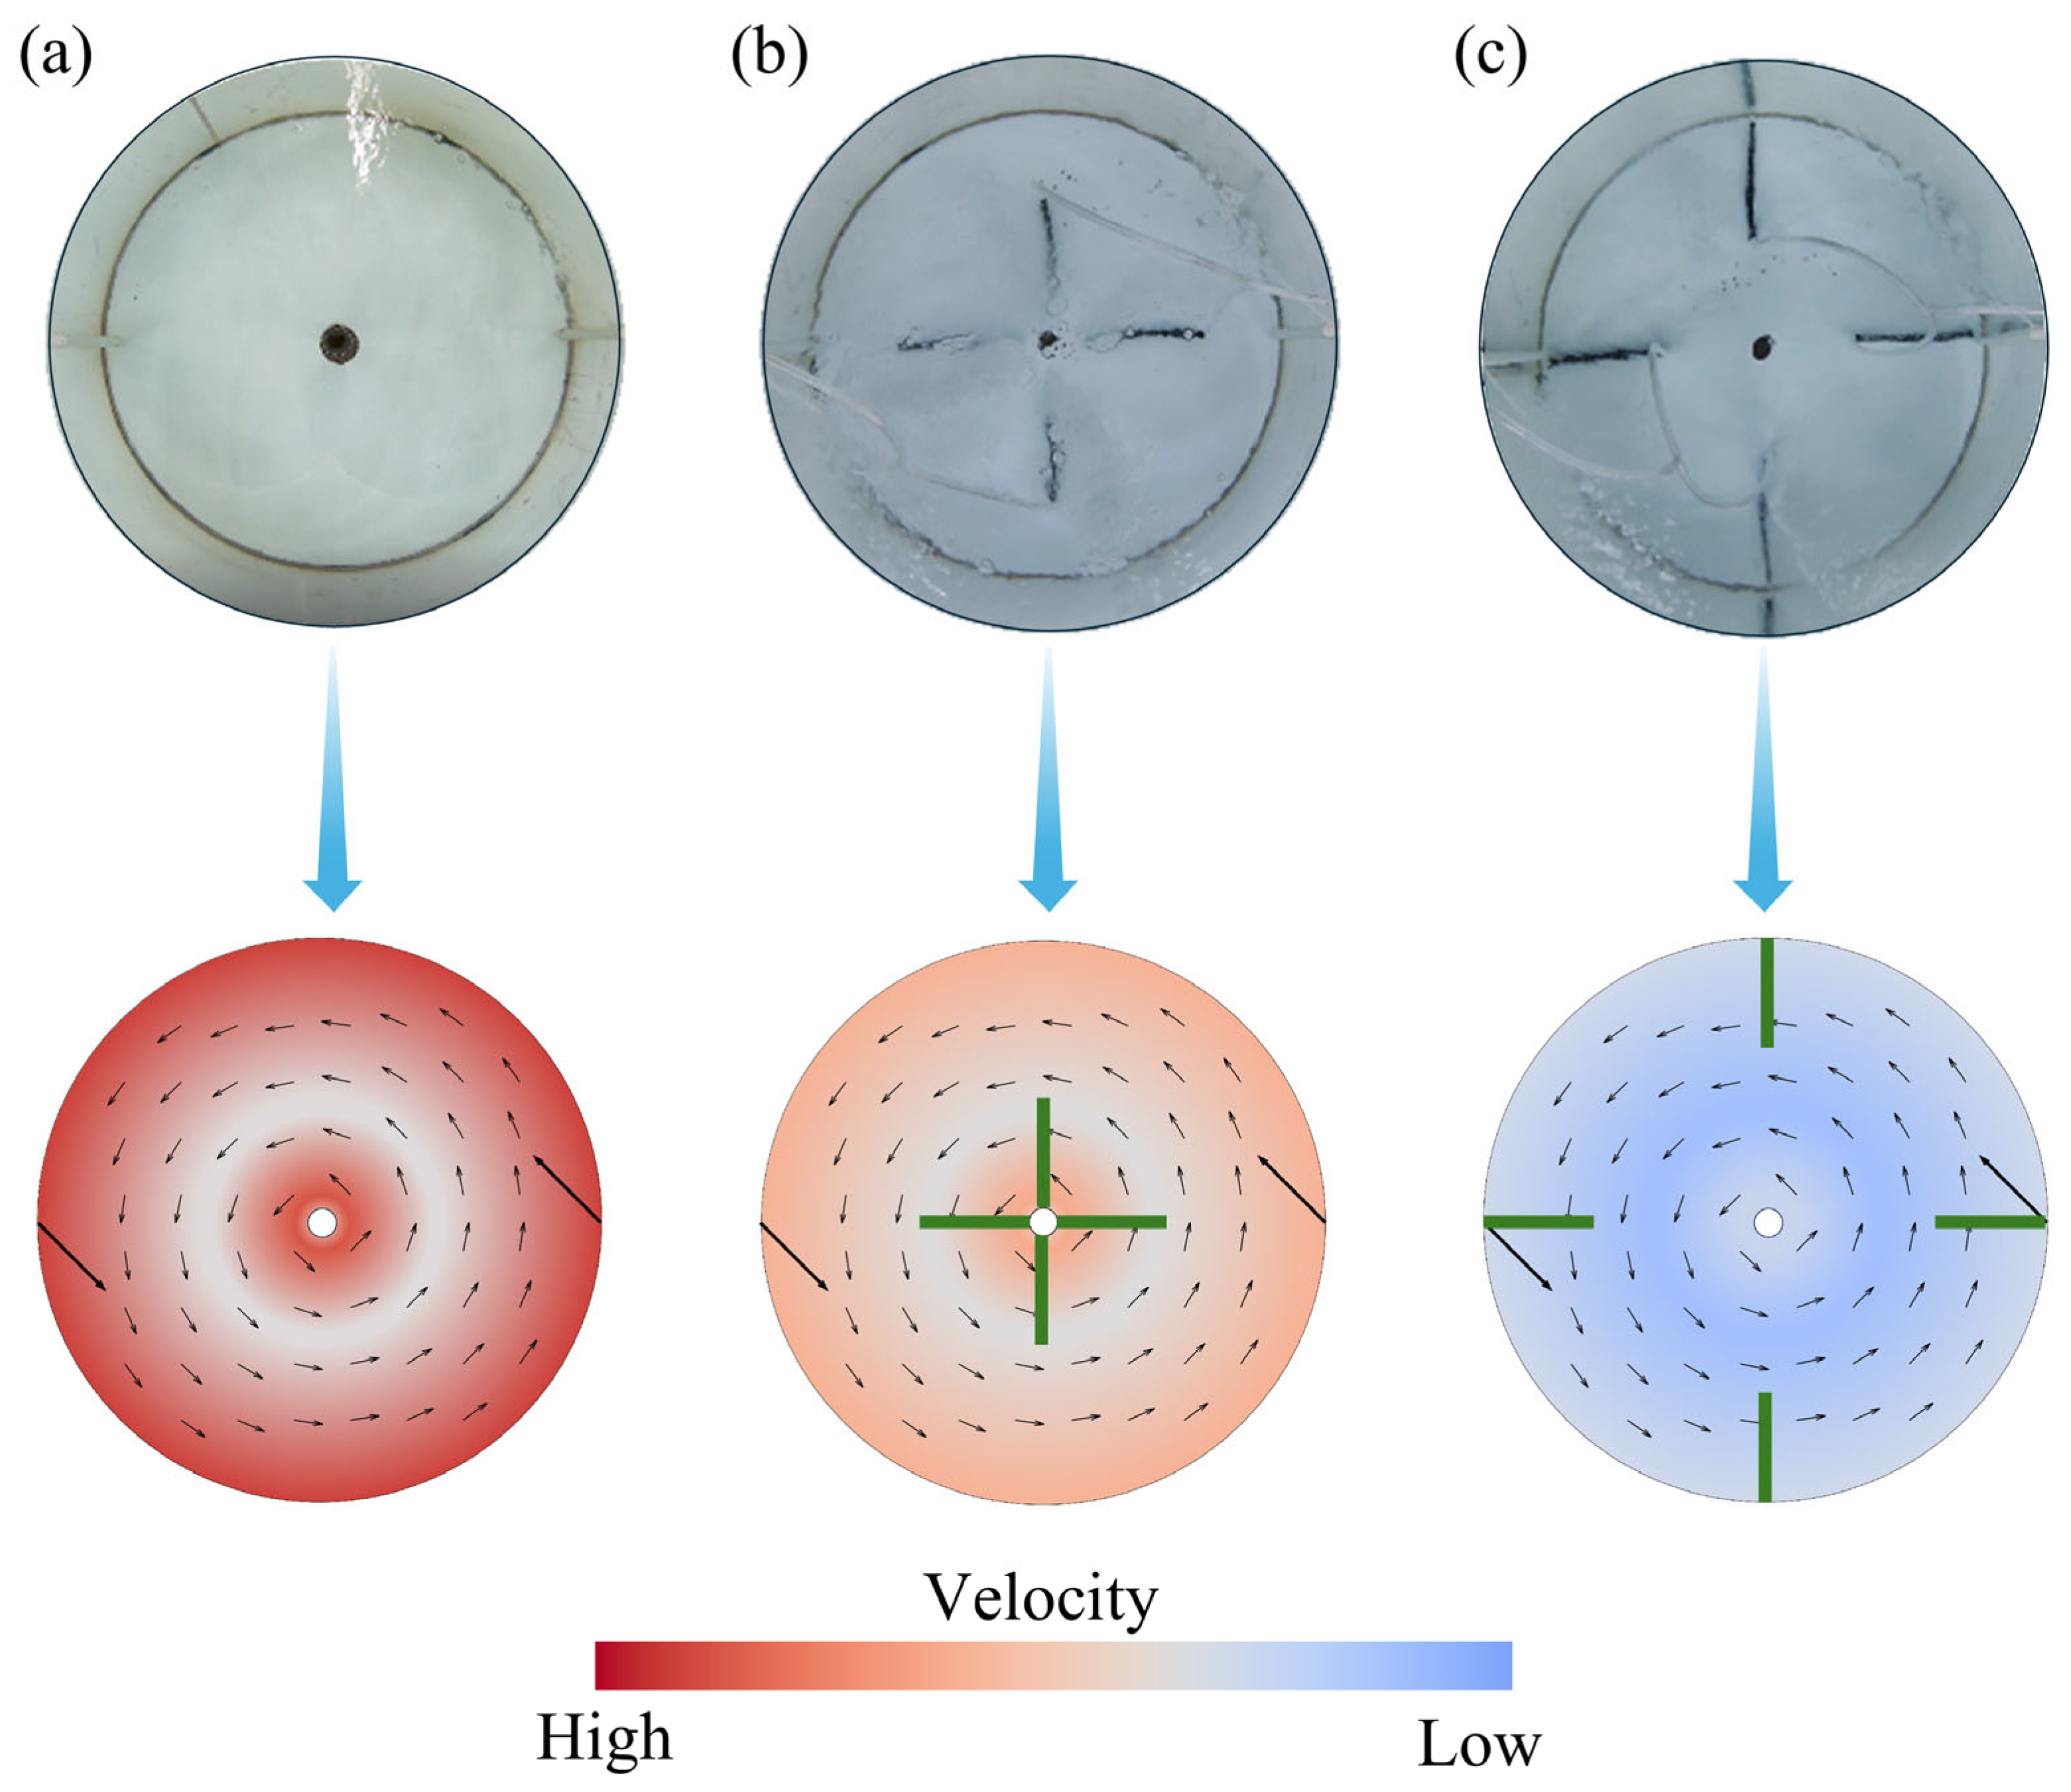
Efficient waste collection in RAS relies heavily on tank hydrodynamics and flow field quality [19,22]. For a typical central-drain circular tank [14], physical obstacles at the bottom inevitably disrupt this flow. Without aeration, bottom-mounted tubes act as physical obstructions that increase flow resistance. As visualized in Figure 15, water flowing past these tubes undergoes flow separation, creating a localized low-velocity wake region characterized by complex vortices. Because minimizing central low-velocity zones is crucial for optimal self-cleaning [23], this wake-induced velocity reduction directly impairs waste collection. These hydrodynamic principles explain our experimental observations under non-aeration conditions. First, placing tubes at d = 1/2r rather than near the tank wall (d = r) further reduced the central velocity, creating more low-velocity zones and thus decreasing waste collection efficiency. Second, since bottom structures fundamentally alter velocity distributions and waste accumulation [24], the shape of the aeration tube dictates its obstructive effect. In this study, the linear-shaped tube caused the greatest obstruction to bottom circulation (resulting in a higher drag coefficient), the disc-shaped tube had a moderate impact, and the arc-shaped tube offered the least resistance. Given that higher resistance coefficients negatively impact waste accumulation [25,26], the arc-shaped tube inherently demonstrated the best waste collection performance among the configurations.

4.2. How Does Bubble Plume Affect Waste Collection Efficiency

During the process of aeration in recirculating aquaculture tanks, the situation differs from aeration in large water surface aquaculture systems due to the smaller surface area of the water in the recirculating tanks. The significant number of bubble plumes generated during aeration is more visually apparent, which inevitably has a substantial impact on the flow field within the tank. Comprehensive research on bubble plume and waste has primarily been applied in the dredging industry. For instance, Boskalis Dredging Company utilized bubble plume anti-pollution diffusion technology in the sediment dredging project at Hamina Port, Finland. This system consists of hoses located at the bottom of the port and compressors onshore, generating a continuous upward flow of compressed air that forms a continuous bubble plume. This action drives the water flow near the hose upward and creates a circulation shear flow on both sides of the bubble plume, thereby containing dredged solid waste and suspended matter within the work area. This application demonstrates the significant effect of bubble plumes on the movement of solid waste. During the aeration process in aquaculture tanks, the interaction between the bubble plume and solid waste is constantly occurring. This process primarily involves the dynamics of the bubble plume flow field in a gas–liquid two-phase system and the particle–bubble dynamics in a gas–liquid-solid three-phase system. Therefore, analyzing the impact of bubble plume on particles using the principles of fluid mechanics is of great significance.
The waste collection performance in aquaculture tanks is closely related to the flow field within the tank. The internal circulation of the tank is an important component of its self-cleaning capacity, while the generation of many bubble plumes disrupts the stable flow field, which inevitably reduces the tank’s waste collection capability [18]. In previous studies, the author measured the flow field distribution characteristics in the tanks using Particle Image Velocimetry (PIV) technology. The results indicated that under these experimental conditions (dual-inlet mode, l = 0, θ = 45°), the flow field intensity near the tank wall and center was relatively high. Figure 15a illustrates the flow field intensity in the tank without aeration tubes under these experimental conditions. Diagrams of the flow field after the placement of a linear-shaped aeration tube at d = 1/2r and r are shown in Figure 15b,c (the influence of the bubble plume generated by other shapes of aeration tubes on the flow field is similar). Figure 15b,c show that the bubble plume produced by placing the linear-shaped aeration tube at d = 1/2r, r hinders the annular flow field within the tank, negatively affecting the flow field and reducing its intensity. Additionally, due to the high intensity of the outer annular flow field near the tank wall and the inner annular flow field near the outlet, as well as the larger distribution area of the outer high-speed circulation, this ultimately results in a more pronounced attenuation effect of the bubble plume generated by the aeration tubes of the same shape placed at d = r on the flow field intensity within the tank in this experiment.
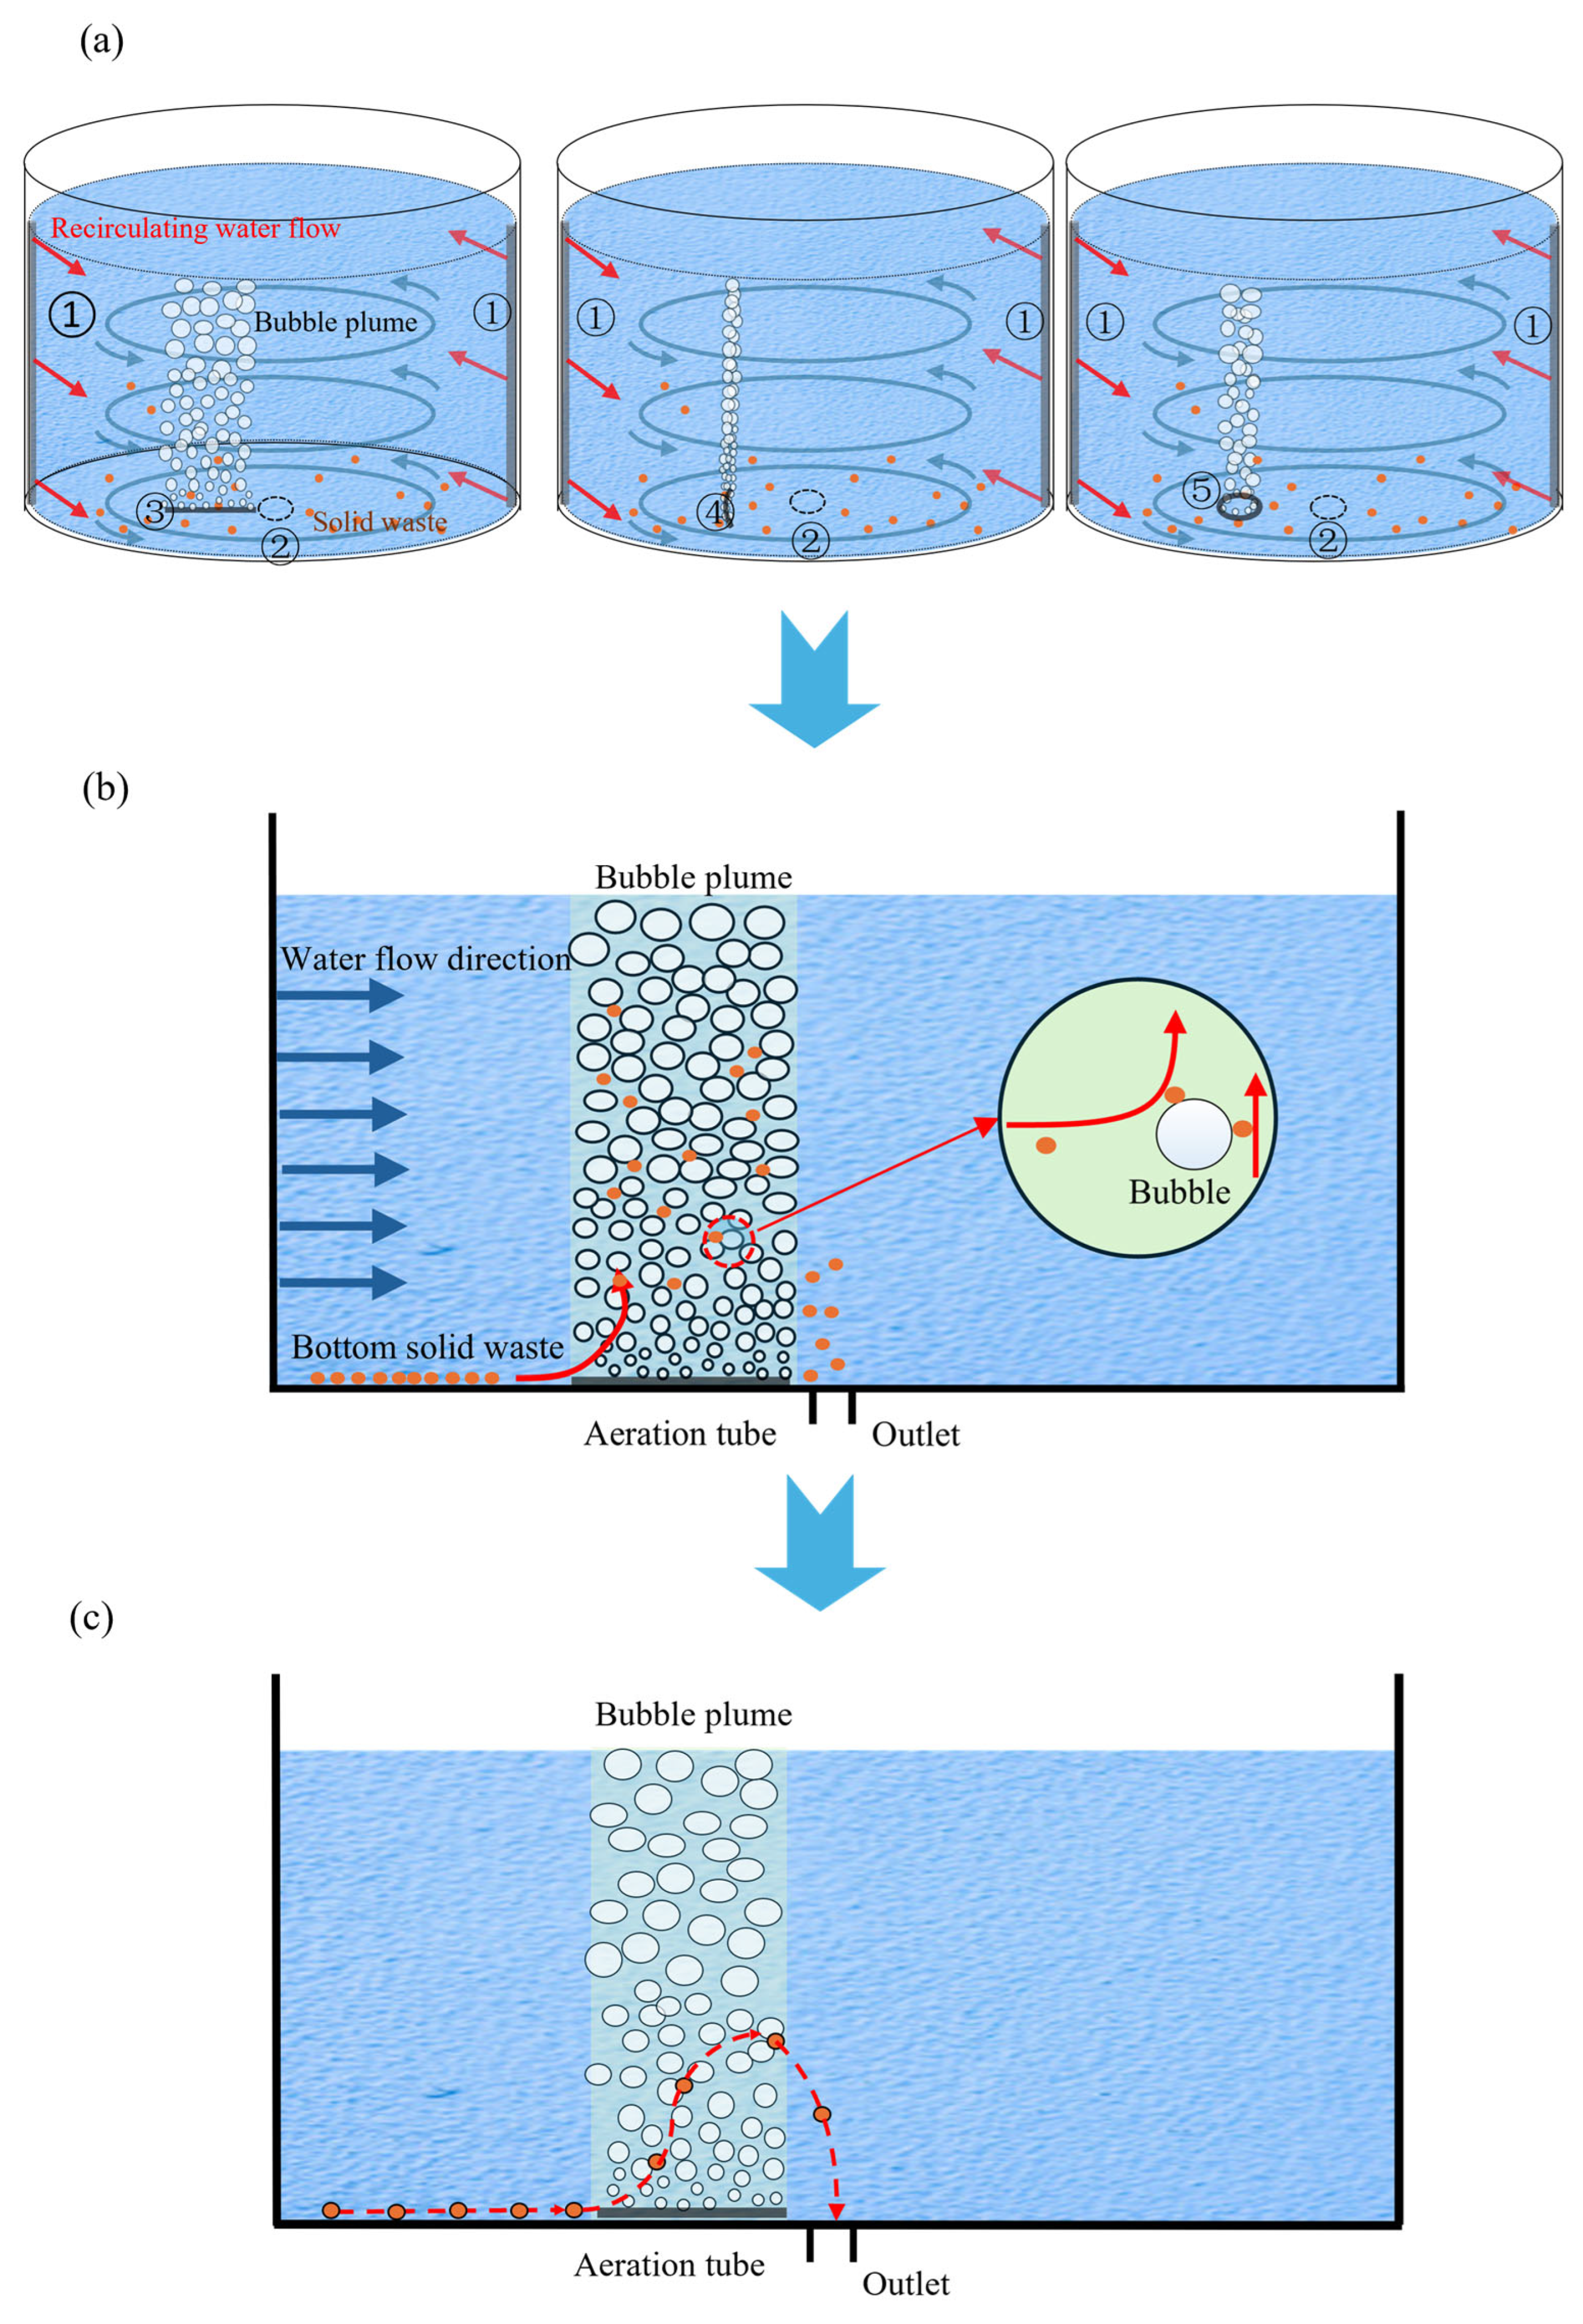
Based on the above discussion, the placement of aeration tubes at positions d = 1/2r, r leads to a decrease in flow field intensity within the tank. This decrease in flow field intensity should logically result in a decline in the tank’s waste collection performance. However, Figure 12 indicates that when the aeration tubes are positioned at d = 1/2r, the number of remaining solid waste under aeration conditions is reduced compared to the non-aeration case for all three tube shapes, suggesting an enhancement in the tank’s waste collection performance. To explore the reasons for this outcome, it is essential to analyze the impact of bubble plumes on the movement of solid waste. Previous studies have shown that a bubble plume can separate the particle trapping process into two subprocesses: the disturbance of waste particles by the plume in the shear flow field and the particle–bubble interactions in the core region of the plume [27]. In conjunction with the comprehensive analysis of this study, since the solid waste in this research consists of settling particles, the bubble plume induces vertical circulation and suspension effects on the solid waste. During this process, the bubble plume creates a significant amount of turbulence. Oca has indicated in previous studies that turbulence positively influences the movement of solid waste [19]. Additionally, the influence of the horizontal water flow generated by the bubble plume on the solid waste at the bottom of the aquaculture tank is also noteworthy. This is because the bubble plume alters the water flow, causing the solid waste to move towards the center of the tank, facilitating the concentration of waste near the outlet for easier discharge. Thus, analyzing this process is crucial for optimizing the self-cleaning performance of aquaculture tanks. Observation of Figure 10 in Section 4.1 reveals that under non-aeration conditions, the accumulation of waste in the aquaculture tank primarily occurs near d = 1/2r. To conduct a more in-depth analysis of the promoting effect of the bubble plume on the aggregation of solid waste, video footage of the experiments was reviewed, and based on the principles governing the impact of bubble plume on solid waste movement, diagrams were created to illustrate the effects of bubble plume on the movement of solid waste particles under different shapes of aeration tubes placed at d = 1/2r, along with their corresponding trajectories influenced by the bubble plume, as shown in Figure 16.
Figure 16a illustrates the bubble plume generated by three different-shaped aeration tubes positioned at d = 1/2r in this experiment (only one aeration tube in the aquaculture tank is depicted). Observing Figure 16a, all three aeration tube shapes produce a similar bubble plume wall at d = 1/2r. Based on the principles of how bubble plumes affect particle movement, Figure 16b depicts the influence of the bubble plume generated at this position on the movement of sedimented waste at the bottom of the aquaculture tank. It is observed that under aeration conditions, when the aeration tubes are placed at d = 1/2r, the bubble plume also disturbs the solid waste at the tank bottom (with shear flow being the primary factor). Interactions between particles and bubbles occur in the plume core region (the light green circle in Figure 16b illustrates this process). In this process, collisions and adhesion between bubbles and particles transport solid waste from the tank bottom into the water column, thus reducing sedimentation. Additionally, the high turbulence intensity and upward water flow in the core region help lift waste particles off the bottom, increasing the likelihood of their movement toward the discharge outlet. Therefore, the continuous disturbance from the bubble plume effectively prevents the accumulation of solid waste at the bottom, thereby enhancing the self-cleaning performance of the aquaculture tank.
It is worth noting that during this process, the bubble plume does not always have a positive effect on the solid waste in the aquaculture tank. Specifically, within the shear flow field created by the bubble plume, the disturbance caused by the plume can lead to solid waste being rebounded back to the tank bottom, resulting in secondary sedimentation of the solid waste. Additionally, when the bubble plume interacts with the particles, the upward disturbance from the bubbles may temporarily suspend the solid waste; however, the rising flow velocity of the plume may not be sufficient to completely overcome the gravitational force and fluid resistance on some solid waste particles, leading to a portion of the waste potentially resettling on the tank bottom. Furthermore, the vortices and turbulence within the flow field can alter the movement direction of the solid waste, causing repeated cycles of suspension and sedimentation. Although this phenomenon is not the focus of this study, it is quite common during the experiment and worth mentioning. However, this negative effect does not negate the secondary suspension effect that the bubble plume has on the accumulated waste. After being suspended, a portion of the solid waste can further aggregate and be discharged from the outlet under the influence of the circular flow field within the tank, thereby enhancing the tank’s waste removal efficiency. Figure 16c illustrates the trajectory of solid waste being discharged from the aquaculture tank under the influence of the bubble plume (this schematic diagram only represents the process and does not involve specific principles); as shown in the figure, during this process, the core region of the plume can disturb and temporarily suspend the settled waste particles due to turbulence and upward flow. The suspended solid waste gradually moves under the influence of the flow field and vortices, and as the water circulates, guided by the tank’s flow field, the secondarily suspended solid waste gradually approaches the outlet, ultimately being effectively collected under the combined action of the bubble plume and the flow field, this process is influenced by the rising speed of the bubbles, turbulence intensity, and water flow direction. Additionally, since the accumulation location of solid waste under non-aeration conditions in this study is mostly near d = 1/2r (as shown in Figure 10), this also well explains why, despite the installation of aeration tubes at d = 1/2r leading to a weakened flow field intensity, the self-cleaning performance of the aquaculture tank is improved.

4.3. How Does Bubble Plume Affect Water Mixing Efficiency

In RAS, high-density farming has become a trend, which in turn increases the demand for DO (dissolved oxygen) by the cultured organisms. DO is one of the key factors that sustain aquatic life and ensure the effective operation of the system. Therefore, studying the relationship between aeration and water mixing performance is crucial for promoting the rapid and even distribution of mixed water and maintaining sufficient dissolved oxygen levels in the tank.
During the aeration process, aeration tubes may generate bubble plumes that hinder circulation within the tank. However, the formation of these bubble plumes plays a positive role in water mixing. Research on bubble plumes has been conducted for many years, dating back to the early 20th century. With the rapid development of industry, water pollution has become increasingly prominent, including in the aquaculture industry. As a result, Sato proposed the use of aeration to oxygenate the aquaculture water and break stratification, thereby promoting the rapid mixing of the water [28]. Abess suggested that bubble plumes can be regarded as buoyant jets, where the initial jet momentum is minimal or entirely dominated by buoyancy [29]. A buoyant jet refers to the phenomenon where fluid movement is driven by buoyancy, resulting from density differences within the fluid. During aeration with aeration tubes in aquaculture tanks, bubbles are released into the water from the tubes. Since the density of air is much lower than that of water, the bubbles experience an upward buoyant force, causing them to rise and create an upward flow, which is a typical buoyant jet [30]. The bubble plume generated by the aeration tubes can, to some extent, promote the mixing of ink with the water in the tank, and the speed of this water mixing largely depends on the strength of the bubble plume, which in turn is determined by the strength of the buoyant jet [31]. The strength of the buoyant jet is influenced by the density of the liquid and the turbulence intensity of the jet. The greater the liquid density, the stronger the buoyant force and the higher the jet strength. In this experiment, the density of the water during the mixing process remains almost unchanged, so this factor does not affect the strength of the buoyant jet. However, the turbulence intensity of the jet directly affects its mixing with the surrounding water. The greater the turbulence intensity generated by the bubble plume from the aeration tube, the more intense the internal fluid disturbance, and the stronger the water mixing performance within the tank [32,33]. This also provides a clear explanation of the conclusions derived from this experiment: The bubble plume produced by the linear-shaped aeration tube has the largest contact area with the circular flow field in the tank, leading to the highest turbulence intensity. Therefore, the tank equipped with a linear-shaped aeration tube exhibits the strongest water mixing performance. The disc-shaped aeration tube has less contact with the circular flow, resulting in a relatively weaker water mixing performance. Similarly, when the aeration tube shapes are the same, the bubble plume formed by the aeration tubes near the wall (d = r) is partially obstructed by the tank walls, which leads to a reduction in the turbulence intensity within the tank. This results in better water mixing performance when the aeration tube is positioned at d = 1/2r.

4.4. Analysis of Potential Influencing Factors and Study Limitations

While this study provides valuable baseline insights into the configuration of aeration devices, the hydrodynamic dependence of the results on tank size, shape, and other set-up characteristics must be acknowledged. First, regarding tank geometry, the findings presented herein are intrinsically dependent on the unique rotational flow fields of circular tanks [34]. In non-circular geometries, such as rectangular or raceway tanks, the lack of a uniform rotational flow means that the bubble plumes generated by aeration tubes may induce complex secondary flows or exacerbate dead zones [5], fundamentally altering the optimal placement strategy.
Second, scale effects represent a notable limitation. The present experiments were conducted at a laboratory scale. In commercial-scale RAS facilities, the increased water volume and depth dictate that bubble plumes undergo a longer ascent, which may alter the momentum transfer efficiency and bubble coalescence dynamics [35]. Generalizing these laboratory findings to industrial scales requires cautious application.
Third, other set-up characteristics, particularly the length and span of the aeration tubes, independently influence system hydrodynamics. A longer aeration tube generates a wider bubble curtain, which theoretically enhances spatial water mixing [28]; however, it concurrently acts as a larger physical obstacle at the tank bottom, increasing the drag coefficient and potentially hindering waste collection. Consequently, determining the optimal tube length-to-radius ratio remains a critical objective.
To address these limitations, our future research will focus on pilot-scale and commercial-scale empirical validations. This involves establishing rigorous scaling relationships between the model dimensions and actual operational conditions, systematically investigating a wider range of hardware parameters (such as varying tube lengths and tank profiles). Furthermore, subsequent studies will incorporate live fish trials to evaluate how fish swimming behavior and spatial distribution interact with the aeration-induced hydrodynamics to influence overall waste collection and water mixing.

5. Conclusions

This paper employs a small-scale tank to investigate the effects of three widely used shapes of aeration tubes and two common placement positions on the solid waste collection and water mixing performance in circular recirculating tanks. Through a comprehensive analysis of the waste collection and water mixing experiment results, this study reveals the relationship between the aeration tube configurations and the tank’s performance in waste collection and water mixing. It also enriches the evaluation criteria for aeration in aquaculture tanks and provides valuable insights for professionals in RAS, as well as contributing to the system’s development. The comprehensive experimental findings are summarized as follows:
(1)
Under non-aeration conditions, the shape and placement of the aeration tubes impact the solid waste collection performance of the tank, but do not affect water mixing. However, under aeration conditions, the bubble plume generated during the aeration process significantly influenced both the tank’s waste collection and water mixing performance.
(2)
Under the experimental conditions of this study’s circular recirculating tank, the waste collection performance was superior when the aeration tubes were positioned at d = 1/2r, compared to placement at d = r. Among the three different shapes of aeration tubes, the arc-shaped aeration tube demonstrated the highest efficiency in waste collection, followed by the disc-shaped tube, while the linear-shaped tube showed the poorest performance. Considering waste collection efficiency, it is not recommended to place the aeration tubes at d = r, nor to use linear-shaped aeration tubes in the aquaculture tank.
(3)
To enhance the water mixing performance in the tank, positioning the aeration tube at d = 1/2r is more reasonable than d = r. The placement at d = 1/2r allows for faster water mixing, thereby improving overall water mixing efficiency. Among the three aeration tube shapes tested, the linear-shaped aeration tube provided the best water mixing performance, followed by the arc-shaped tube, while the disc-shaped tube resulted in poorer mixing performance. To ensure optimal water mixing under aeration conditions, placing aeration tubes at d = r or using disc-shaped aeration tubes is not recommended.
In conclusion, to achieve both optimal waste collection and water mixing performance under aeration conditions in the circular recirculating tank, ultimately reducing cultured costs, improving water quality, and enhancing water utilization efficiency, it is recommended to place arc-shaped aeration tubes at the d = 1/2r position in industrial-scale circular tanks. To support this recommendation and provide a clear comparison for practical applications, the overall effectiveness of all evaluated configurations is summarized in Table 2.
Although this study represents the first experimental investigation into the effects of aeration devices on waste collection and water mixing, certain limitations should be acknowledged. Primarily, due to laboratory constraints, the current experiments were not conducted at the scale of commercial aquaculture tanks. Future research will address this gap by establishing rigorous scaling relationships between the model dimensions and actual operational conditions (e.g., tube length, flow rate, aeration rate, and water depth). Furthermore, subsequent studies will incorporate live fish trials to evaluate how fish behavior and movement interact with the aeration system to influence tank hydrodynamics and waste collection. Despite these limitations, the present findings provide valuable baseline insights into the selection and placement of aeration devices, offering practical guidance for aquaculture engineering.

Author Contributions

Conceptualization, C.C., D.L., F.Z., D.F., X.Q. and Y.T.; Methodology, C.C., D.F. and Y.T.; Formal Analysis, C.C. and Y.T.; Investigation, C.C. and Y.T.; Data Curation, C.C.; Writing—Original Draft, C.C., X.Q. and Y.T.; Writing—Review and Editing, C.C., D.L. and F.Z.; Visualization, D.L.; Supervision, D.F.; Funding Acquisition, D.F. All authors have read and agreed to the published version of the manuscript.

Funding

This study was funded by the Key Laboratory of Mariculture, Ministry of Education (Ocean University of China) (No. KLM2510) and the National Natural Science Foundation of China (Grant No. 32273189).

Institutional Review Board Statement

Not applicable.

Data Availability Statement

All data sets generated by this study are included in the article.

Conflicts of Interest

The authors state that this study was conducted without any commercial or financial relationships, which may be interpreted as potential conflicts of interest.

References

  1. Ebeling, J.M.; Timmons, M.B. Recirculating aquaculture systems. In Aquaculture Production Systems; John Wiley & Sons: Hoboken, NJ, USA, 2012; pp. 245–277. [Google Scholar]
  2. Li, H.; Cui, Z.; Cui, H.; Bai, Y.; Yin, Z.; Qu, K. Hazardous substances and their removal in recirculating aquaculture systems: A review. Aquaculture 2023, 569, 739399. [Google Scholar] [CrossRef] [Scilit]
  3. Lindholm-Lehto, P. Water quality monitoring in recirculating aquaculture systems. Aquac. Fish Fish. 2023, 3, 113–131. [Google Scholar] [CrossRef] [Scilit]
  4. Du, Y.; Chen, F.; Zhou, L.; Qiu, T.; Sun, J. Effects of different layouts of fine-pore aeration tubes on sewage collection and aeration in rectangular water tanks. Aquac. Eng. 2020, 89, 102060. [Google Scholar] [CrossRef] [Scilit]
  5. Cheng, X.; Xie, Y.; Zhu, D.; Li, R.; Xie, J. Experiment on effects of microporous diffuser types on aeration oxygenation performance. Trans. Chin. Soc. Agric. Eng. 2017, 33, 226–233. [Google Scholar]
  6. Lu, C.; Cheng, W.; Li, Z.; Wang, M.; Liu, J. Influence of aeration rates on oxygen mass transfer and flow-field in a microporous aeration system. Pol. J. Environ. Stud. 2021, 30, 3727–3739. [Google Scholar] [CrossRef] [Scilit] [PubMed]
  7. Ashley, K.; Mavinic, D.; Hall, K. Effect of orifice diameter, depth of air injection, and air flow rate on oxygen transfer in a pilot-scale, full lift, hypolimnetic aerator. Can. J. Civ. Eng. 2009, 36, 137–147. [Google Scholar] [CrossRef] [Scilit]
  8. Ashley, K.I.; Hall, K.J.; Mavinic, D.S. Factors influencing oxygen transfer in fine pore diffused aeration. Water Res. 1991, 25, 1479–1486. [Google Scholar] [CrossRef] [Scilit]
  9. Baquero-Rodríguez, G.A.; Lara-Borrero, J.A.; Nolasco, D.; Rosso, D. A Critical Review of the Factors Affecting Modeling Oxygen Transfer by Fine-Pore Diffusers in Activated Sludge. Water Environ. Res. 2018, 90, 431–441. [Google Scholar] [CrossRef] [PubMed]
  10. Chern, J.-M.; Yang, S.-P. Oxygen transfer rate in a coarse-bubble diffused aeration system. Ind. Eng. Chem. Res. 2003, 42, 6653–6660. [Google Scholar] [CrossRef] [Scilit]
  11. Gillot, S.; Heduit, A. Effect of air flow rate on oxygen transfer in an oxidation ditch equipped with fine bubble diffusers and slow speed mixers. Water Res. 2000, 34, 1756–1762. [Google Scholar] [CrossRef] [Scilit]
  12. Iranpour, R.; Stenstrom, M.K. Relationship between oxygen transfer rate and airflow for fine-pore aeration under process conditions. Water Environ. Res. 2001, 73, 266–275. [Google Scholar] [CrossRef] [Scilit]
  13. Rosso, D.; Iranpour, R.; Stenstrom, M. Fifteen years of offgas transfer efficiency measurements on fine-pore aerators: Key role of sludge age and normalized air flux. Water Environ. Res. 2005, 77, 266–273. [Google Scholar] [CrossRef] [Scilit]
  14. Gorle, J.; Terjesen, B.F.; Mota, V.C.; Summerfelt, S. Water velocity in commercial RAS culture tanks for Atlantic salmon smolt production. Aquac. Eng. 2018, 81, 89–100. [Google Scholar] [CrossRef] [Scilit]
  15. Saffman, P. On the rise of small air bubbles in water. J. Fluid Mech. 1956, 1, 249–275. [Google Scholar] [CrossRef] [Scilit]
  16. Choi, W.; Lee, S.; Baek, S.; Lee, S.; Seo, J.; Shin, D.; Jeong, H.; Sung, Y. Numerical analysis of thermal and hydrodynamic characteristics in aquaculture tanks with different tank structures. Ocean Eng. 2023, 287, 115880. [Google Scholar] [CrossRef] [Scilit]
  17. Khater, E.-S.; Ali, S.; Abbas, W.; Morsy, O. Flow patterns in circular fish tanks and its relations with flow rate and nozzle features. Sci. Rep. 2022, 12, 12883. [Google Scholar] [CrossRef] [Scilit] [PubMed]
  18. Oca, J.; Masaló, I.; Reig, L. Comparative analysis of flow patterns in aquaculture rectangular tanks with different water inlet characteristics. Aquac. Eng. 2004, 31, 221–236. [Google Scholar] [CrossRef] [Scilit]
  19. Oca, J.; Masalo, I. Flow pattern in aquaculture circular tanks: Influence of flow rate, water depth, and water inlet & outlet features. Aquac. Eng. 2013, 52, 65–72. [Google Scholar] [CrossRef] [Scilit]
  20. Zhu, F.; Gui, F.; Hu, J.; Kong, J.; Pan, X.; Zhang, Z.; Feng, D.; Qu, X. Effect of inlet pipe setting angle on the self-cleaning performance of circular recirculating aquaculture tank. J. Fish. China 2024, 48, 174–183. [Google Scholar]
  21. Chern, J.-M.; Chou, S.-R.; Shang, C.-S. Effects of impurities on oxygen transfer rates in diffused aeration systems. Water Res. 2001, 35, 3041–3048. [Google Scholar] [CrossRef] [Scilit] [PubMed]
  22. Labatut, R.A.; Ebeling, J.M.; Bhaskaran, R.; Timmons, M.B. Modeling hydrodynamics and path/residence time of aquaculture-like particles in a mixed-cell raceway (MCR) using 3D computational fluid dynamics (CFD). Aquac. Eng. 2015, 67, 39–52. [Google Scholar] [CrossRef] [Scilit]
  23. Sin, M.G.; An, C.H.; Cha, S.J.; Kim, M.J.; Kim, H.N. A method for minimizing the zone of low water flow velocity in a bottom center drain circular aquaculture tank. J. World Aquac. Soc. 2021, 52, 1221–1233. [Google Scholar] [CrossRef] [Scilit]
  24. Xue, B.; Ren, X.; Liu, C.; Yu, L.; Bi, C.; Zhang, Q. A study on the influence of bottom structure in recirculating aquaculture tank on velocity field. In Proceedings of the ISOPE International Ocean and Polar Engineering Conference, Honolulu, HI, USA, 16–21 June 2019. [Google Scholar]
  25. Masaló, I.; Oca, J. Hydrodynamics in a multivortex aquaculture tank: Effect of baffles and water inlet characteristics. Aquac. Eng. 2014, 58, 69–76. [Google Scholar] [CrossRef] [Scilit]
  26. Zhang, J.; Jia, G.; Wang, M.; Cao, S.; Mkumbuzi, S.G. Hydrodynamics of recirculating aquaculture tanks with different spatial utilization. Aquac. Eng. 2022, 96, 102217. [Google Scholar] [CrossRef] [Scilit]
  27. Wang, Y.; Zou, J.; Shui, B.; Yang, J.; Wei, W. Particle–bubble dynamics blocking sediment diffusion in the core region of bubble plumes. Part. Sci. Technol. 2025, 43, 1031–1052. [Google Scholar] [CrossRef] [Scilit]
  28. Sato, K.; Sato, T. A study on bubble plume behavior in stratified water. J. Mar. Sci. Technol. 2001, 6, 59–69. [Google Scholar] [CrossRef] [Scilit]
  29. Abessi, O.; Saeedi, M.; Bleninger, T.; Davidson, M. Surface discharge of negatively buoyant effluent in unstratified stagnant water. J. Hydro-Environ. Res. 2012, 6, 181–193. [Google Scholar] [CrossRef] [Scilit]
  30. List, E. Mechanics of turbulent buoyant jets and plumes. In Turbulent Buoyant Jets and Plumes; Elsevier: Amsterdam, The Netherlands, 1982; pp. 1–68. [Google Scholar]
  31. Fischer, H.B.; List, J.E.; Koh, C.R.; Imberger, J.; Brooks, N.H. Mixing in Inland and Coastal Waters; Elsevier: Amsterdam, The Netherlands, 2013. [Google Scholar]
  32. List, E. Turbulent jets and plumes. Annu. Rev. Fluid Mech. 1982, 14, 189–212. [Google Scholar] [CrossRef] [Scilit]
  33. Rogallo, R.S.; Moin, P. Numerical simulation of turbulent flows. Annu. Rev. Fluid Mech. 1984, 16, 99–137. [Google Scholar] [CrossRef]
  34. Xue, B.; Zhao, Y.; Bi, C.; Cheng, Y.; Ren, X.; Liu, Y. Investigation of flow field and pollutant particle distribution in the aquaculture tank for fish farming based on computational fluid dynamics. Comput. Electron. Agric. 2022, 200, 107243. [Google Scholar] [CrossRef] [Scilit]
  35. Zhang, S. Study on Collision and Attachment Behavior Between Particle and Bubble in Coal Slime Flotation. Master’s Thesis, China University of Mining & Technology, Beijing, China, 2015. [Google Scholar]
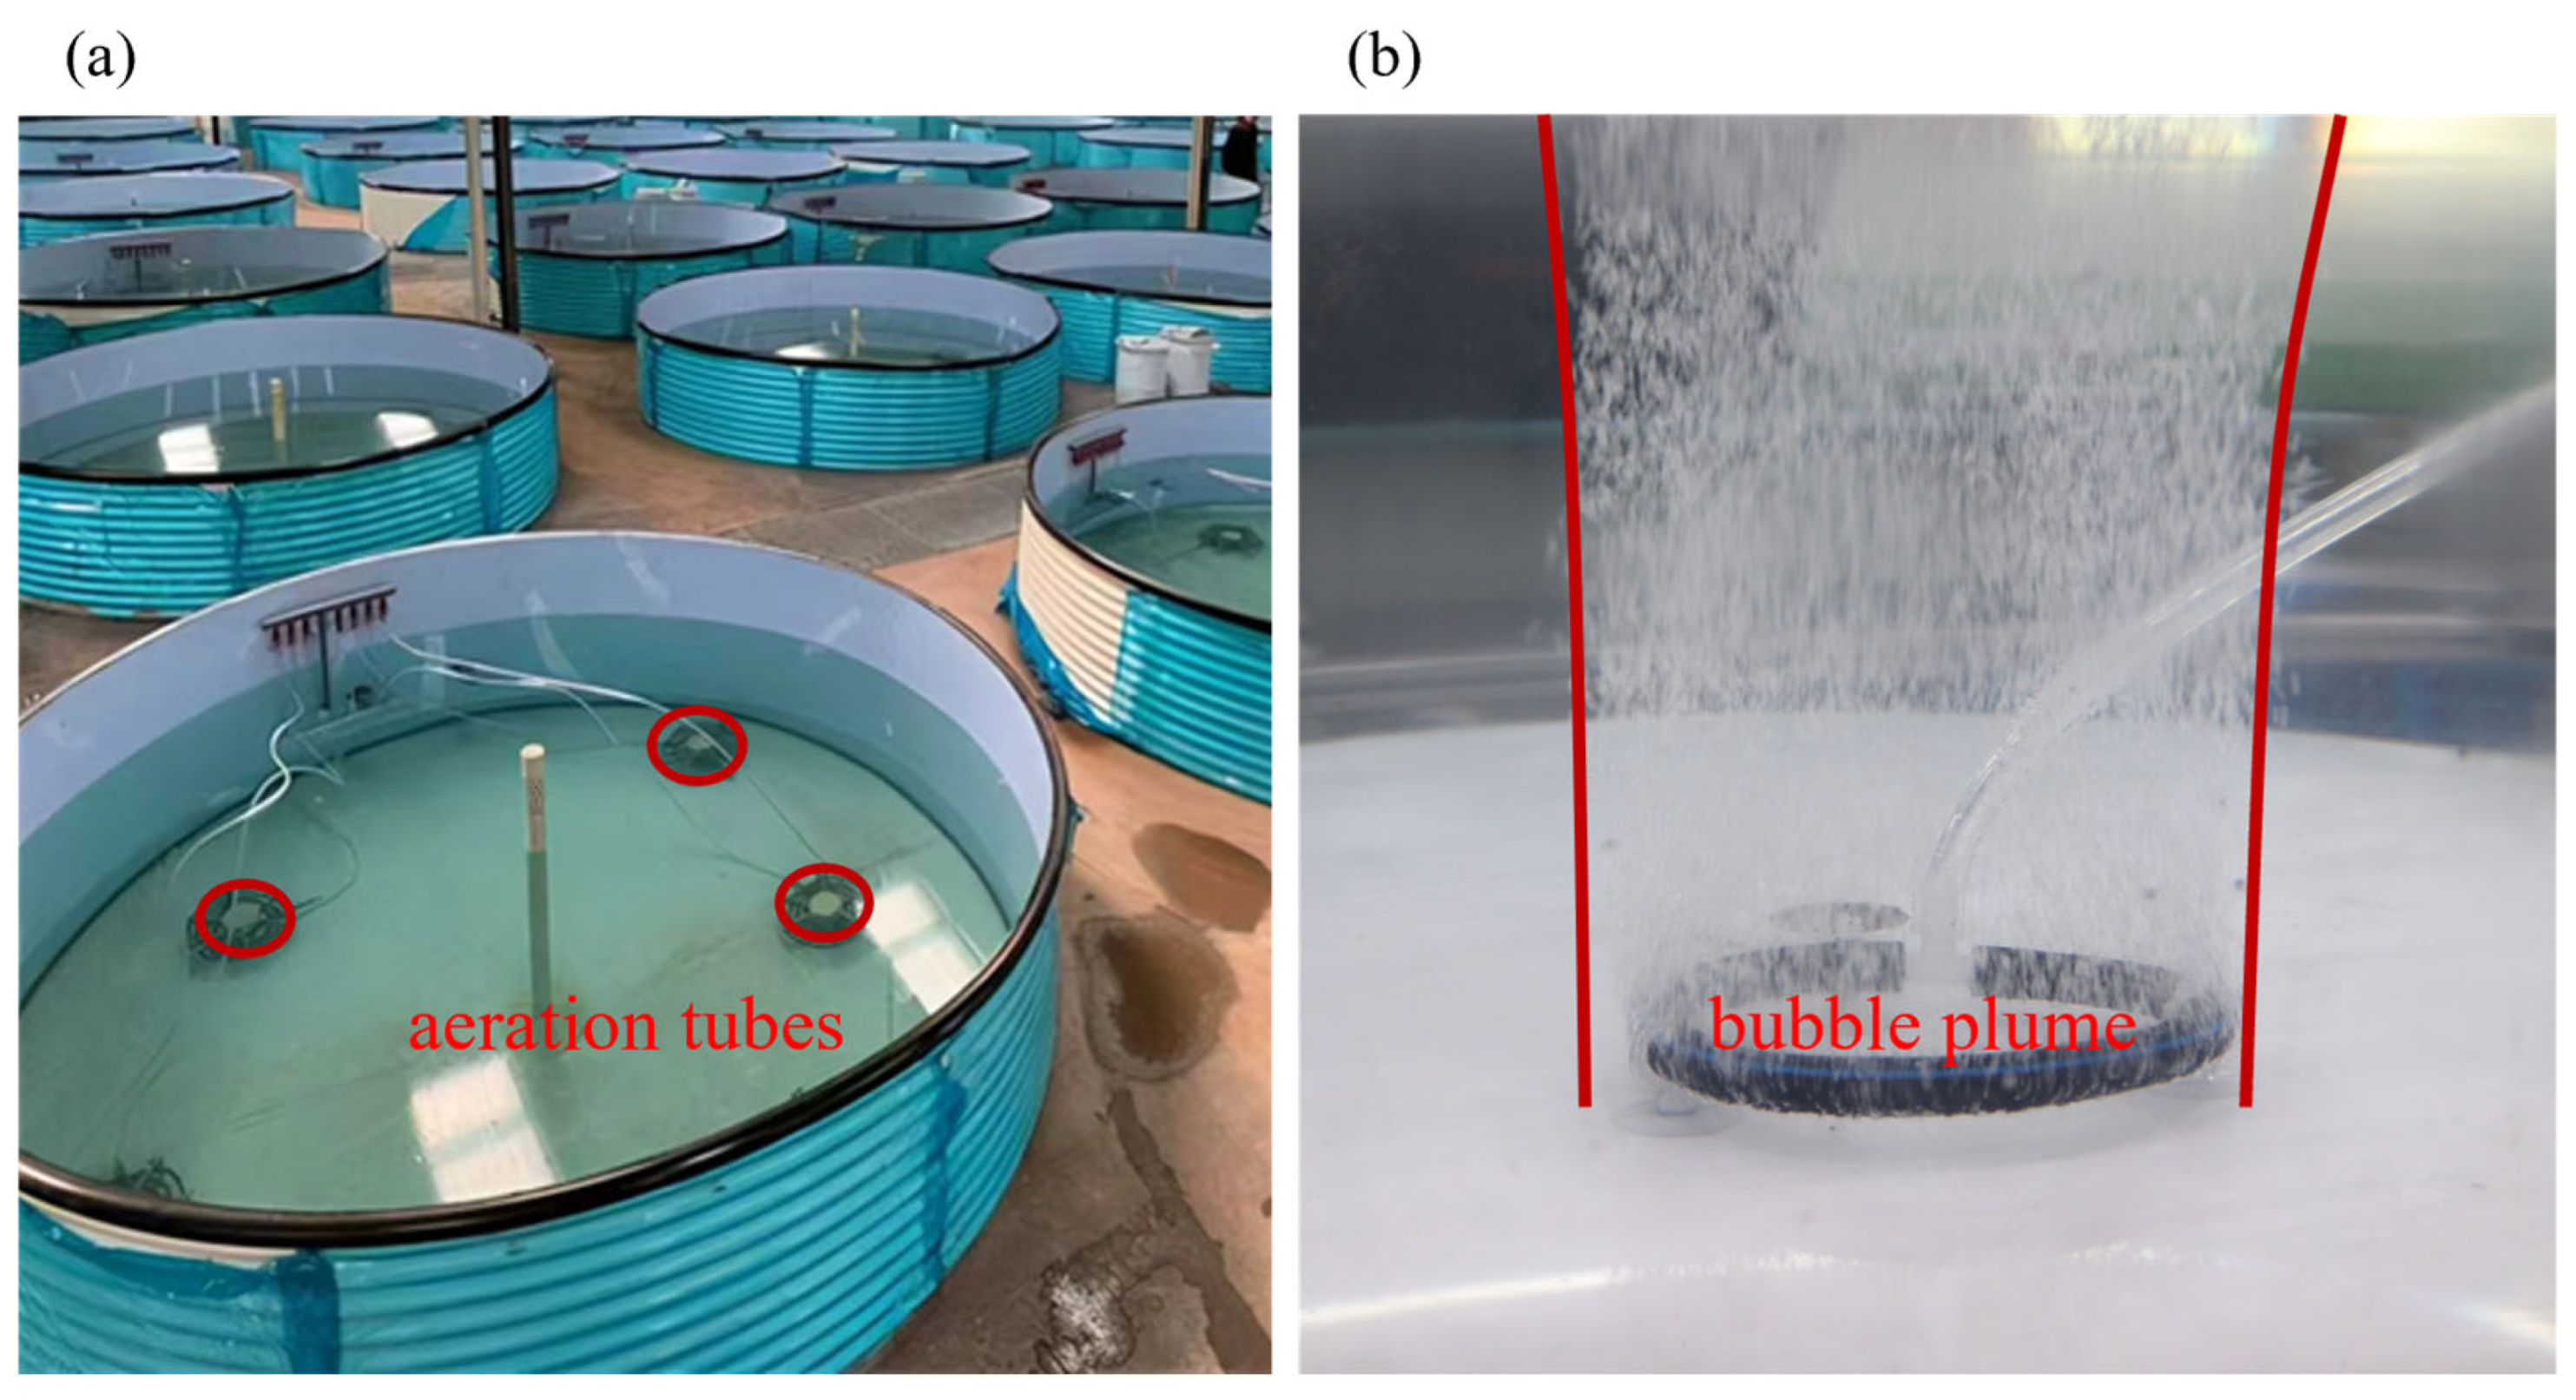
Figure 1. (a) Photograph of the aeration tubes in the RAS tank; (b) photograph of the corresponding bubble plume generated by the aeration.
Fishes 11 00283 g001
Figure 2. Schematic diagram of the circular recirculating aquaculture system.
Fishes 11 00283 g002
Figure 3. Schematic diagram of aeration oxygenation system.
Fishes 11 00283 g003
Figure 4. Photograph and diagram of aeration tube configurations: (a) linear-shaped, d = r; (b) disc-shaped, d = r; (c) arc-shaped, d = r; (d) linear-shaped, d = 1/2r; (e) disc-shaped, d = 1/2r; (f) arc-shaped, d = 1/2r.
Fishes 11 00283 g004
Figure 5. Waste collection test flowchart.
Fishes 11 00283 g005
Figure 6. Water mixing experiment flowchart.
Fishes 11 00283 g006
Figure 7. Ink diffusion process in a circular aquaculture tank: (a) initial release of ink; (b) early-stage diffusion; (c) formation of a swirling flow pattern; (d) further development of the vortex structure; (e) contraction of the dyed region toward the center; (f) final stable vortex state.
Fishes 11 00283 g007
Figure 8. Variation in the number of remaining solid waste per minute under different aeration tube configurations in the tank without aeration.
Fishes 11 00283 g008
Figure 9. Variation in the number of remaining solid waste per minute under different aeration tube configurations in the tank with aeration.
Fishes 11 00283 g009
Figure 10. Waste accumulation locations under different aeration tube configurations without aeration: (a) Arc-shaped (d = 1/2r); (b) Disc-shaped (d = 1/2r); (c) Linear-shaped (d = 1/2r); (d) Arc-shaped (d = r); (e) Disc-shaped (d = r); (f) Linear-shaped (d = r).
Fishes 11 00283 g010
Figure 11. Bubble plume generated by different shapes of aeration tubes in the tank.
Fishes 11 00283 g011
Figure 12. Number of remaining solid waste particles in the tank under different operating conditions.
Fishes 11 00283 g012
Figure 13. Changes in the water uniformity index within the tank over 600 s under different aeration tube configurations: (a) without aeration; (b) with aeration.
Fishes 11 00283 g013
Figure 14. Heatmaps of the water mixing process within the aquaculture tank from 5 to 50 s under different aeration tube configurations with aeration.
Fishes 11 00283 g014
Figure 15. Aerial view and corresponding flow field diagrams of the aquaculture tank under dual-inlet mode l = 0, θ = 45°: (a) without aeration tubes; (b) linear-shaped aeration tubes under d = 1/2r condition without aeration; (c) linear-shaped aeration tubes under d = r condition with aeration. (The green solid lines in the figures represent the bubble plume generated by the aeration tubes).
Fishes 11 00283 g015
Figure 16. (a) Schematic diagram of bubble plume formation by three types of aeration tubes at the d = 1/2r position in a circular aquaculture tank: ① inlet pipe, ② outlet, ③ linear-shaped aeration tube, ④ arc-shaped aeration tube, ⑤ disc-shaped aeration tube; (b) schematic diagram of bubble plume effect on the movement of solid waste accumulated at the tank bottom; (c) schematic diagram of the movement trajectory of a single solid waste particle towards the outlet under the influence of bubble plume.
Fishes 11 00283 g016
Table 1. Experimental condition.
Experimental ConditionValue
Inlet pipe installationl = 0, θ = 45°
Inlet modeDual-inlet mode
Water depth (cm)30
Flow rate (L/min)Q1 = 10.6
Total aeration rate (L/min)Q2 = 12
Placement of aeration tubesd = r, 1/2r
Shape of aeration tubeArc-shaped; disc-shaped; linear-shaped
Number of aeration tube4
Table 2. Comparison of waste collection and water mixing performance across different aeration tube configurations.
Aeration Tube ShapePositionWaste Collection PerformanceWater Mixing PerformanceOverall
Assessment
Arc-shapedd = 1/2rExcellent
(Rank 1)
Excellent
(Rank 2)
Optimal
d = rPoor
(Rank 4)
Poor
(Rank 5)
Not Recommended
Disc-shapedd = 1/2rGood
(Rank 2)
Moderate
(Rank 4)
Good
d = rPoor
(Rank 5)
Worst
(Rank 6)
Not Recommended
Linear-shapedd = 1/2rModerate
(Rank 3)
Excellent
(Rank 1)
Good
d = rWorst
(Rank 6)
Good
(Rank 3)
Not Recommended
Disclaimer/Publisher’s Note: The statements, opinions and data contained in all publications are solely those of the individual author(s) and contributor(s) and not of MDPI and/or the editor(s). MDPI and/or the editor(s) disclaim responsibility for any injury to people or property resulting from any ideas, methods, instructions or products referred to in the content.