Article

Seasonal Open-Water Diet Composition of Non-Native Yellow Bass in Six Iowa Natural Lakes
by
Jonathan R. Meerbeek
* and
Seth M. Renner
Iowa Department of Natural Resources, Spirit Lake Fish Hatchery, Spirit Lake, IA 51360, USA
*
Author to whom correspondence should be addressed.
Fishes 2026, 11(2), 124; https://doi.org/10.3390/fishes11020124
Submission received: 13 January 2026 / Revised: 18 February 2026 / Accepted: 20 February 2026 / Published: 22 February 2026

Abstract

Many species within the family Moronidae possess biological traits that facilitate their success as invasive species in freshwater ecosystems. In Iowa, USA, non-native Yellow Bass (Morone mississippiensis) have expanded their range into at least 19 glacial natural lakes, yet their trophic interactions in these complex systems remain poorly understood. From 2018 to 2020, we evaluated the open-water diet composition of 1300 Yellow Bass across six Iowa natural lakes to quantify diet composition, feeding intensity, and ontogenetic dietary shifts. While zooplankton numerically dominated diets across most systems (>80% by number) biomass was driven primarily by benthic invertebrates and fish. Feeding intensity was not uniform, characterized by a distinct suppression of foraging during late spring followed by intense feeding in early summer. Overall, we found that Yellow Bass foraging is highly plastic but heavily constrained by spatial (lake identity, season, and year) and biological (ontogeny, age, and sex) filters. Spatial heterogeneity was the primary driver of diet composition ( R 2 = 0.407 ) , with individual lakes explaining the largest portion of variance ( R 2 = 0.126 ) . The interaction between lake size and population history ( R 2 = 0.054 ) was also significant, highlighting that the ecological impact of Yellow Bass is context-dependent, differing among established populations in small lakes versus recent invasions in large lakes. We identified distinct ontogenetic breakpoints at 114 mm and 252 mm; fish < 114 mm were obligate zooplanktivores, while significant piscivory was restricted to large adults (>252 mm). These results suggest that the successful colonization of Yellow Bass is supported by high dietary plasticity, which may lead to intensive resource competition with native juveniles. Our findings provide a critical baseline for fisheries managers to assess the ecological risks associated with Yellow Bass expansion and emphasize the importance of monitoring trophic shifts to preserve the integrity of native fish communities in the Midwest.
Key Contribution: This study presents the first comprehensive assessment of non-native Yellow Bass diets in glacial natural lakes, revealing high dietary plasticity and a distinct ontogenetic shift to piscivory at sizes exceeding 252 mm. These findings highlight the species’ potential to impact native fish communities through both direct predation and intensive resource competition for zooplankton and benthic invertebrates.

1. Introduction

Freshwater fisheries management in North America has an extensive history of non-native fish species introductions. Regardless of whether introductions are intentional for recreational purposes or accidental, many non-native fishes often threaten biological diversity and ecosystem function in aquatic resources they inhabit through complex mechanisms such as direct predation, interspecific competition for resources, disease introduction, genetic interactions, and habitat modification [1,2,3,4]. Furthermore, non-native fish populations can exert unanticipated and detrimental pressures on native fish communities. Consequently, understanding the ecological role of non-native fishes is critical for fisheries management and risk assessments.
Evaluating the feeding ecology of non-native species is the most essential tool to managing these impacts, as available food resources directly influence the fitness and establishment of invaders [5]. More specifically, diet analysis identifies trophic links that connect non-native invaders to their new environment and may provide evidence of direct predation or interspecific competition with co-inhabiting native fish species [6,7]. Non-native fishes that exhibit more dietary plasticity are generally more successful biological invaders [8,9], yet these impacts are rarely static and may shift with ontogeny, as predators grow and their gape size increases [10,11]. Diet composition can also vary substantially across different habitat types and environmental gradients, driven both by differences in the prey availability and the community structure [12]. Therefore, characterizing the diet of non-native invaders across a range of conditions and fish sizes would provide fisheries managers with the tools and information needed to understand their potential ecological impacts.
Although endemic to the Mississippi River drainage, Yellow Bass (Morone mississippiensis) have established non-native populations widely across lentic and lotic systems [13]. In the Midwest, particularly in Iowa, Yellow Bass have recently expanded their range in both impoundments and glacial natural lakes [14,15]. In these introduced systems, Yellow Bass can establish abundant populations that are characterized by highly variable growth, condition, and mortality rates [14,15]. Despite their increasing prevalence and importance to recreational angling, information regarding the basic ecology of Yellow Bass in these natural lake systems remains scarce. While recent studies have documented their population dynamics in Iowa [15] and diet in reservoirs elsewhere [14,16], there is a lack of contemporary data regarding their trophic interactions in natural lakes of varying complexity.
Understanding the diet of Yellow Bass is particularly important given their potential to alter fish community structure, which may include resource competition caused by density related factors [16,17], piscivory [18,19], and/or egg predation [20,21]. Gaining a deeper understanding of Yellow Bass feeding ecology in natural lakes would enable managers to make a more accurate assessment of their potential interactions with native fishes and guide future management decisions related to Yellow Bass invasions within the upper Midwest. Therefore, the objectives of the study were to (1) evaluate seasonal and interannual trends in Yellow Bass diet composition and feeding intensity (vacuity and stomach fullness) to identify periods of peak consumption; (2) assess the influence of lake size and population history (established versus recent populations) on trophic niche; (3) determine the effect of spatiotemporal factors (lake identity, season, and year) on Yellow Bass diet composition; and (4) quantify the influence of intrinsic biological drivers (ontogeny, age, and sex) to identify size structured trophic breakpoints. We specifically hypothesized that Yellow Bass would exhibit high dietary plasticity driven by lake morphology and population history, but that the transition to piscivory would be strictly constrained by body size.

2. Materials and Methods

Yellow Bass diets were evaluated from six natural lakes (Center, Cornelia, Five Island, Lost Island, Pleasant, and Silver lakes) located across four counties in northwest Iowa from 2018 to 2020 (Table 1). Although Five Island Lake was not originally selected for the 2018 study, it was added in 2019 following the detection of high Yellow Bass densities. We separated the lakes by lake size and Yellow Bass population history. More specifically, Cornelia and Lost Island lakes were identified as having established Yellow Bass populations (pre-2008; hereafter referred to as “old”), and the remaining lakes were considered recently established (post-2012; hereafter referred to as “new”) populations [22]. The lake size varied substantially (31-470 ha), and the mean water depth among lakes ranged from <1.5 m (Pleasant Lake) to 3.7 m (Center Lake; Table 1). Lakes with a total surface area <100 ha were designated as “small”, and lakes exceeding 390 ha in area were deemed as “large” (Table 1). Yellow Bass were collected from all study lakes on a bi-monthly schedule spanning April through November. Sampling periods were stratified seasonally as late spring (April–May), early summer (June–July), late summer (August–September), and fall (October-November). Most (99.1%) Yellow Bass were collected using a combination of pulsed-DC electrofishing (conducted at day and night) and short-duration (1–2 hr) gill netting during daylight hours. Twelve Yellow Bass were collected from either a combination of angling and daytime gill netting (n = 7; Center Lake) or hoop nets (n = 5; Pleasant Lake). Attempts were made to collect at least 15 Yellow Bass of variable length classes during each bi-monthly interval from each lake. Following capture, the fish were immediately preserved on ice and transported to the laboratory for dissection.
In the laboratory, the Yellow Bass were measured (total length [TL], mm), weighed (Wt; g), and assigned sex, and the sagittal otoliths were removed. Sex was determined by visually inspecting gonads, and only individuals that had confirmed sex designations were included in sex-based analysis (n = 1222). The sagittal otoliths were cleaned and placed in a numbered vial. Age estimation was performed by cracking the sagittal otoliths centrally along the transverse plane [23]. To enhance the optical resolution, the otoliths were slightly burned and coated in mineral oil prior to viewing. Cross sections were examined under a dissecting microscope using side illumination from a 150 W halogen source transmitted to the proximal edge of the otolith via a 45° fiber optic guide. To ensure consistency, a single specialist with over 15 years of experience interpreted all structures.
The stomachs were removed from each fish and preserved in 125 mL plastic bottles using 99% isopropyl alcohol. The stomachs were later processed by making a longitudinal incision from the esophagus to the basal end of the stomach using surgical scissors, and the lining was then inverted to expose all contents. Food items were flushed into plastic beakers (50–250 mL) using a wash bottle. To estimate biomass, samples were passed through a 10 cm × 10 cm section of a 63 μm cloth–nitex mesh. Prior to filtration, the mesh was wetted, blotted dry to remove excess water, and tared on a Mettler Toledo AB204-SRS scale. Following filtration, the mesh containing the prey items was blotted again to minimize the water weight before recording the total wet mass (0.0001 g). Finally, the contents were transferred to a Ward Counting Wheel for enumeration and taxonomic identification to the lowest practical level under a dissecting microscope [24]. Stomachs containing no prey items or only unidentifiable digested matter, stomach lining, plant and/or rock material, or accumulated hard parts (e.g., loose bones, otoliths) without associated flesh were classified as empty. The initial identification of stomach contents yielded 25 distinct taxonomic groups. To improve the statistical robustness and reduce the influence of rare taxa via a multivariate analysis, we applied a frequency of occurrence threshold [25]. Specifically, prey taxa occurring in less than 3% of stomachs were aggregated into a composite “Insects/Other” category. Collectively, this process yielded ten prey groups for analysis: Amphipoda, Chironomidae larvae, Chironomidae pupae, Cladocera, Copepoda, Ephemeroptera, Fish, Hemiptera, Leptodora, and Insects/Other.
Diet composition was quantified for individuals using both percent numerical abundance ( N p r e y   g r o u p N s u m   a l l   p r e y   g r o u p s × 100 ) and percent biomass [26]. The percent biomass was estimated using a reconstructed method. Because prey groups were not individually weighed for each stomach sample, and direct gravimetric measurement of partially digested prey was not feasible, we estimated the total stomach biomass by multiplying the prey counts by the mean weight of each taxon. The mean taxon weight was estimated from subsamples of undigested prey collected for each lake. We applied lake- and season-specific mean weights whenever possible to account for spatiotemporal variation in prey size. In instances where local weight data were unavailable for a specific taxon, the study-wide mean weight was used as a proxy.
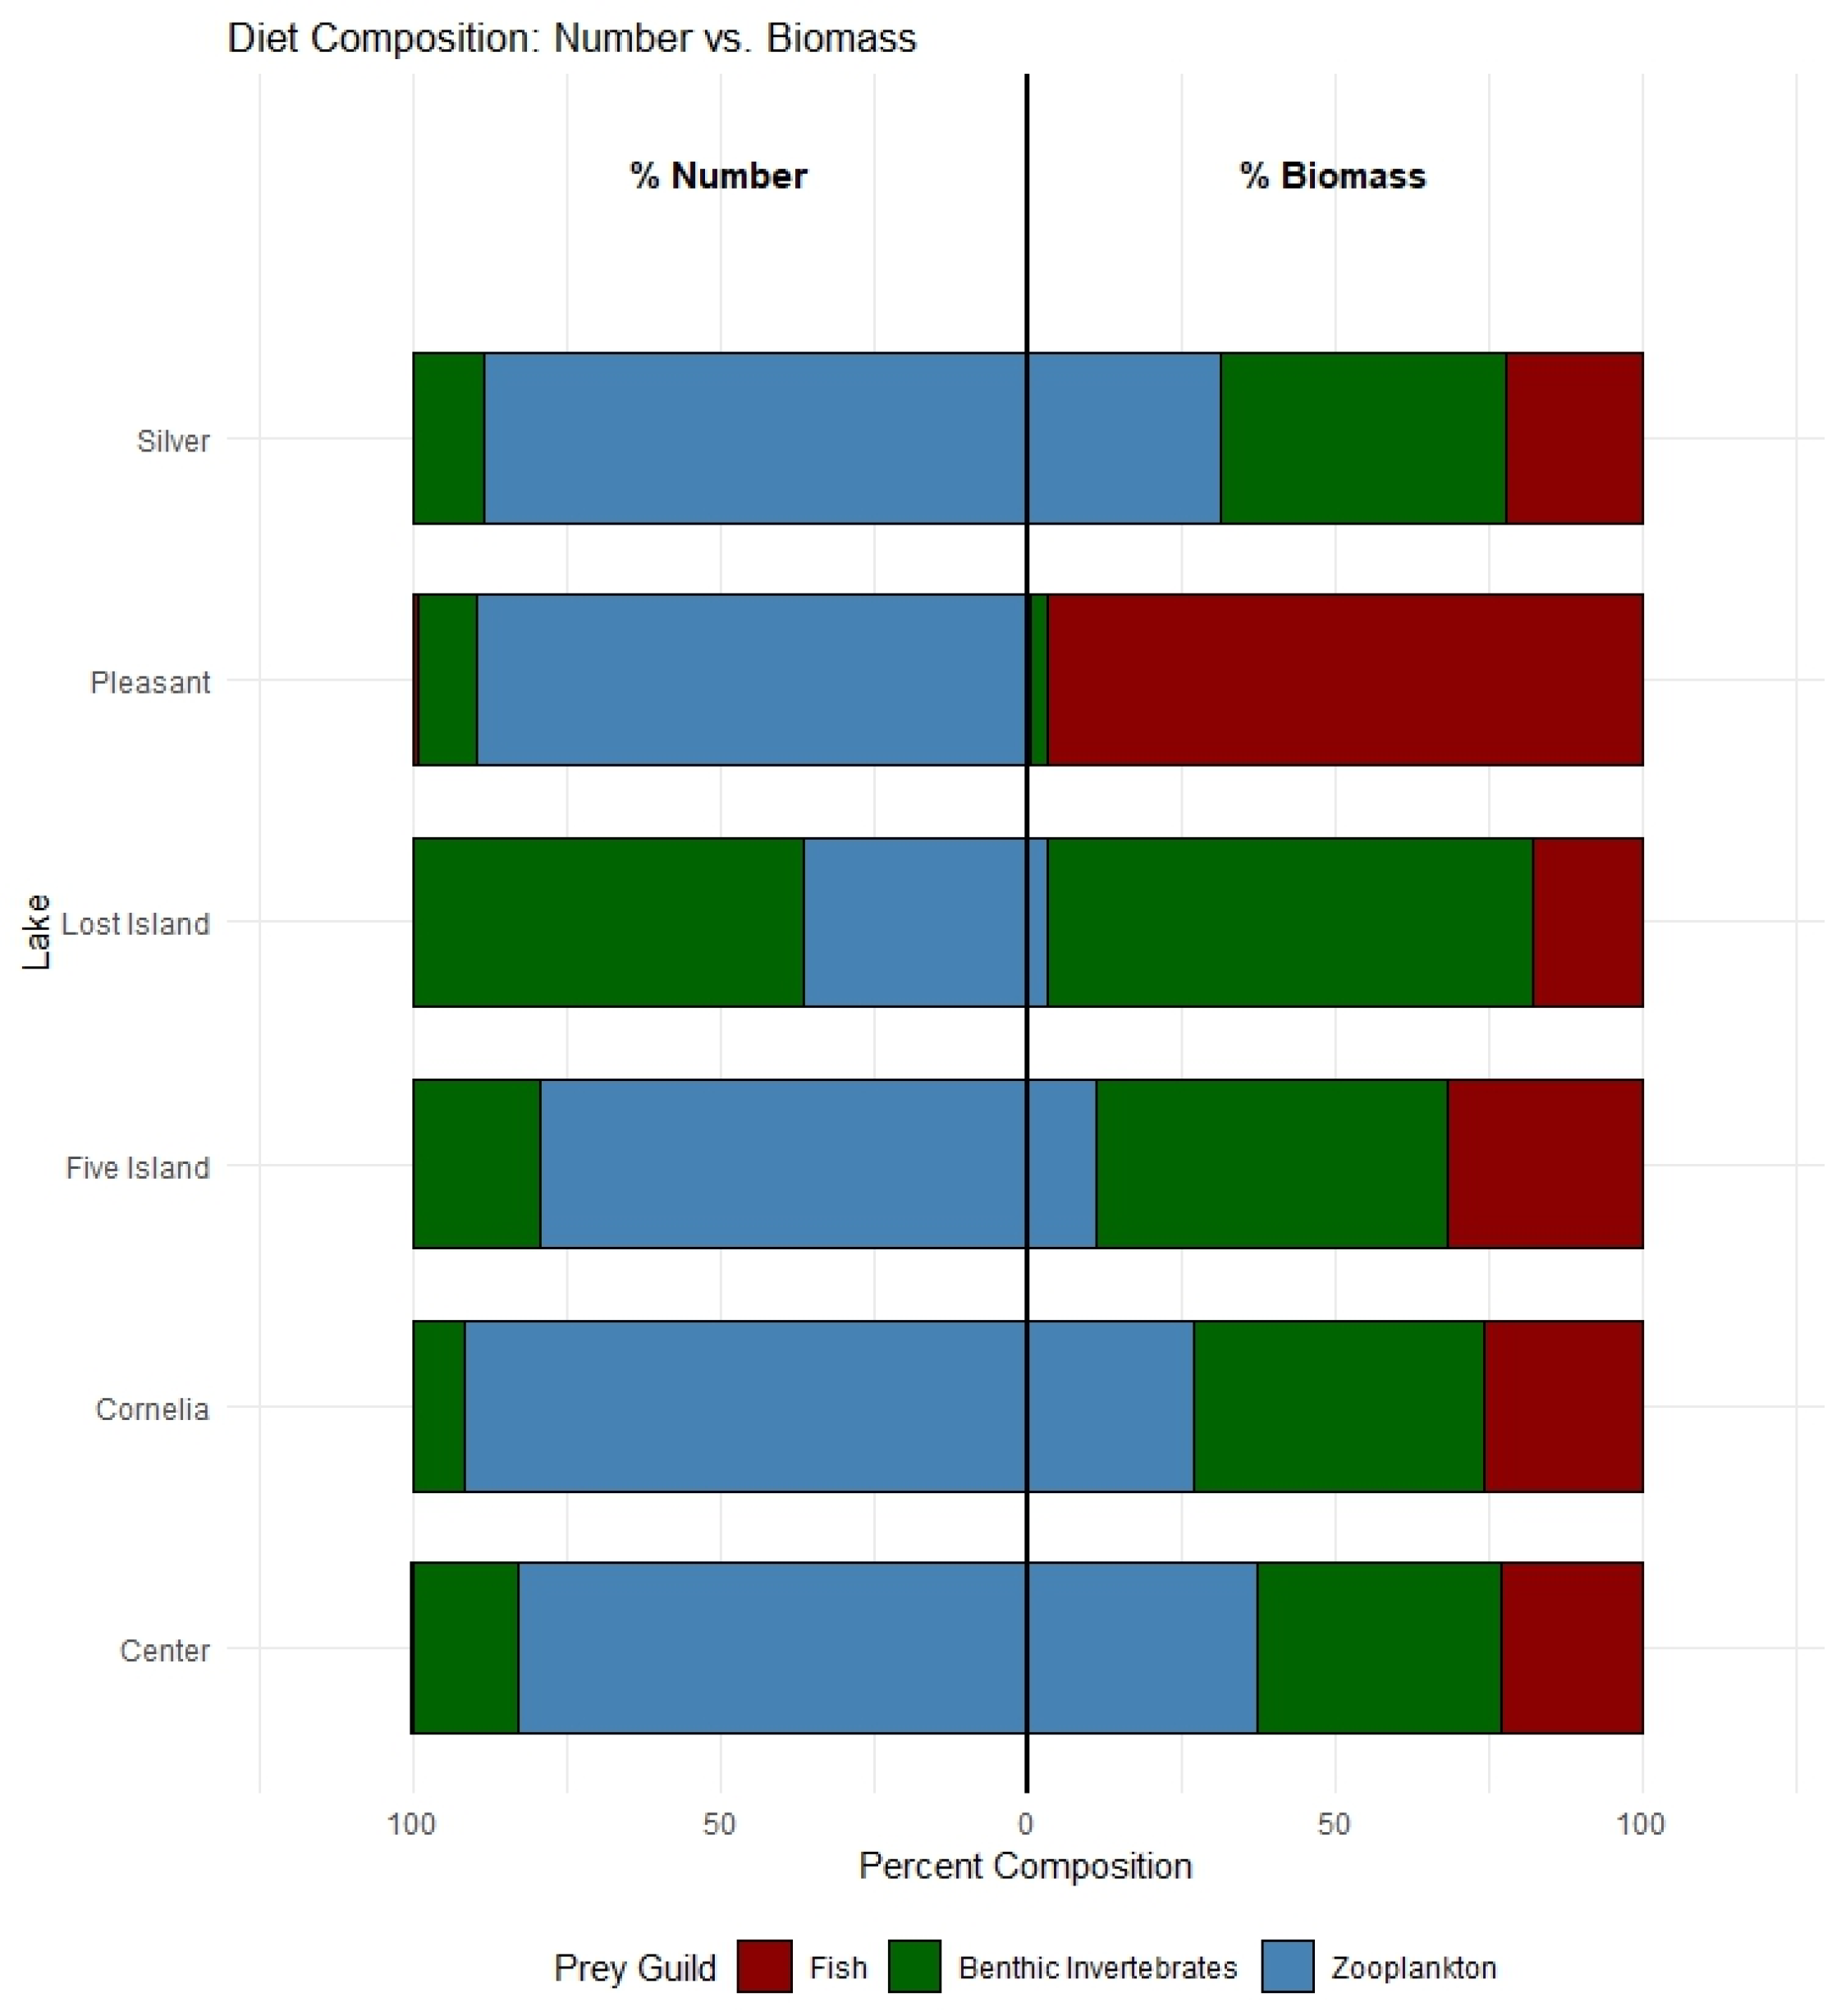
Foraging activity was assessed using two indices. The Vacuity Index (VI; [27]) was defined as the percentage of empty stomachs within a sample group ( V I = N e m p t y N t o t a l × 100 ) . Differences in vacuity rates across seasons and among lakes were tested using a Chi-square test of independence. For fish with measurable stomach contents, a Stomach Fullness Index (FI; [26]) was calculated as the ratio of the stomach weight to fish weight ( F I = W s t o m a c h W f i s h × 100 ) . A two-way analysis of variance (ANOVA) was used to test the effects of lake and season on FI, followed by Tukey’s HSD post hoc tests to identify seasonal peaks in consumption. To demonstrate the discrepancy between the foraging frequency and energetic gain, we compared the aggregate diet composition, calculated via numerical abundance, versus biomass. The results were visualized using a mirrored bar chart, allowing for the direct comparison of prey importance under each metric.
To evaluate the influence of lake size (small or large) and population history (new or old Yellow Bass populations) and their interaction on diet composition, we used Permutational Multivariate Analysis of Variance (PERMANOVA) [28]. However, prior to these analyses, diet count and biomass matrices were Hellinger-transformed to reduce the influence of highly abundant prey taxa (e.g., zooplankton) and allow for the use of Euclidean-based ordination methods [29]. In addition to transformation, fish with empty stomachs were excluded from multivariate ordinations to prevent skewing. A second PERMANOVA test was then performed to assess the spatiotemporal dynamics on diet composition, testing the interaction of lake, season, and year. Statistical significance was determined using 999 permutations of the raw data, and patterns in the diet community composition were visualized using Non-metric Multidimensional Scaling (NMDS) based on Bray–Curtis dissimilarity [30]. We then calculated and plotted the centroid of diet scores for both PERMANOVA models. Furthermore, we plotted the successional trajectories in ordination space to visualize the diet shifts for the lake-season combination.
To evaluate whether the fish size influenced feeding shifts, we performed a Constrained Incremental Sum of Squares (CONISS) [31] cluster analysis on the pooled Hellinger-transformed biomass data from the 10 taxa prey groups. The analysis was constrained by fish TL to enforce a sequential ordering of samples. Significant breakpoints in the resulting dendrogram were used to define distinct trophic ontogenetic stages. We visualized these shifts using a stacked area plot of aggregated prey taxa (zooplankton, benthic invertebrates, and fish) to examine broad trophic patterns.
We constructed a PERMANOVA using TL, age (years), and sex as predictors to determine the effects of biological traits on diet. To accurately assess sexual dimorphism, this analysis was restricted to adult individuals of known sex. We used Type III (marginal) sums of squares to determine the unique variance explained by each predictor. This approach allowed us to separate the effects of sex and age from body size to reduce the covariance between the two groups [28,32]. All statistical analyses were performed in R (Version 4.5.1; [33]) using the “vegan” [32] and “rioja” [34] packages. Alpha was set at p = 0.05.

3. Results

From 2018 to 2020, a total of 1,300 Yellow Bass diet samples (Center, n = 226; Cornelia, n = 259; Five Island, n = 131; Lost Island, n = 240; Pleasant, n = 231; Silver, n = 213; Table 2) were collected and analyzed. The target sample size of 15 diets from each system per bi-monthly interval was achieved for a majority of the periods evaluated (85%; Table 2). Nevertheless, achieving this target was occasionally hindered by low catch rates at recently established populations or where individuals were scarce. Zero Yellow Bass were collected from Silver Lake in late spring 2018, but 58 were collected during early summer from the same lake and year (Table 2). Out of all 1300 Yellow Bass stomachs analyzed, 200 (15%) contained no food items, and this was most frequently observed at Pleasant Lake (38%; n = 87). Yellow Bass collected from Lake Cornelia during each bimonthly interval were smaller (mean TL range = 167–191 mm) compared to other lakes except for Silver Lake in 2018. Yellow Bass mean TLs during each bimonthly interval for all other lakes and periods ranged from 193 (Center Lake) to 279 mm (Silver Lake; Table 2). The observed ages of Yellow Bass collected for diet analysis typically ranged from 0 to 7 (98% of ages), but some were determined to be as old as 10 years (Lake Cornelia). At Center, Five Island, and Silver lakes (i.e., new populations), between 89 and 99% of the fish collected for diet analysis were ≤ age 3; whereas only 15% of the Yellow Bass collected at Lake Cornelia were ≤ age 4. Both Lost Island and Pleasant lakes had more uniform age representation between age 1 and age 5 (n = 10 to 99 fish per age category).
Significant spatiotemporal variation was observed in the feeding intensity and activity of Yellow Bass. Significant main effects of lake ( F 5,1269 = 20.41 ,   p < 0.001 ) and season ( F 3 , 1269 = 6.21 ,   p < 0.001 ) , as well as the interaction term ( F 15 , 1269 = 9.5 ,   p < 0.001 ) were revealed via a two-way ANOVA on the Stomach Fullness Index. Post hoc analysis (Tukey’s HSD) identified a distinct seasonal peak in consumption from spring to summer, with early summer FI significantly higher than late spring ( d i f f = 0.13 ,   p < 0.001 ) . No other seasonal pairwise comparisons were statistically significant ( p > 0.05 ) . A similar pattern was observed in the feeding activity of Yellow Bass, as assessed via the VI. The proportion of empty stomachs was highest in late spring (26.0%) and lowest during early summer (10.4%) and fall (11.7%), representing a significant seasonal shift ( X 2 = 36.81 ,   d f = 3 ,   p < 0.001 ) . Different lakes also had substantially different vacuity rates ( X 2 = 119.92 ,   d f = 5 ,   p < 0.001 ) . For example, at Pleasant Lake, where piscivory was more prevalent, Yellow Bass had the highest rate of empty stomachs (38.1%); whereas Yellow Bass at Center and Five Island lakes consumed zooplankton more frequently and had substantially lower vacuity rates (6.6% and 6.9%, respectively). The choice and availability of prey taxon influenced the trophic position of Yellow Bass at each lake (Figure 1; Table A1; Table A2). Numerically, the diets in all lakes were overwhelmingly dominated by zooplankton (>80% of total prey items), but the importance of zooplankton diminished substantially (<20%) in terms of the biomass. Instead, benthic invertebrates and fish comprised the majority of dietary biomass at each lake.
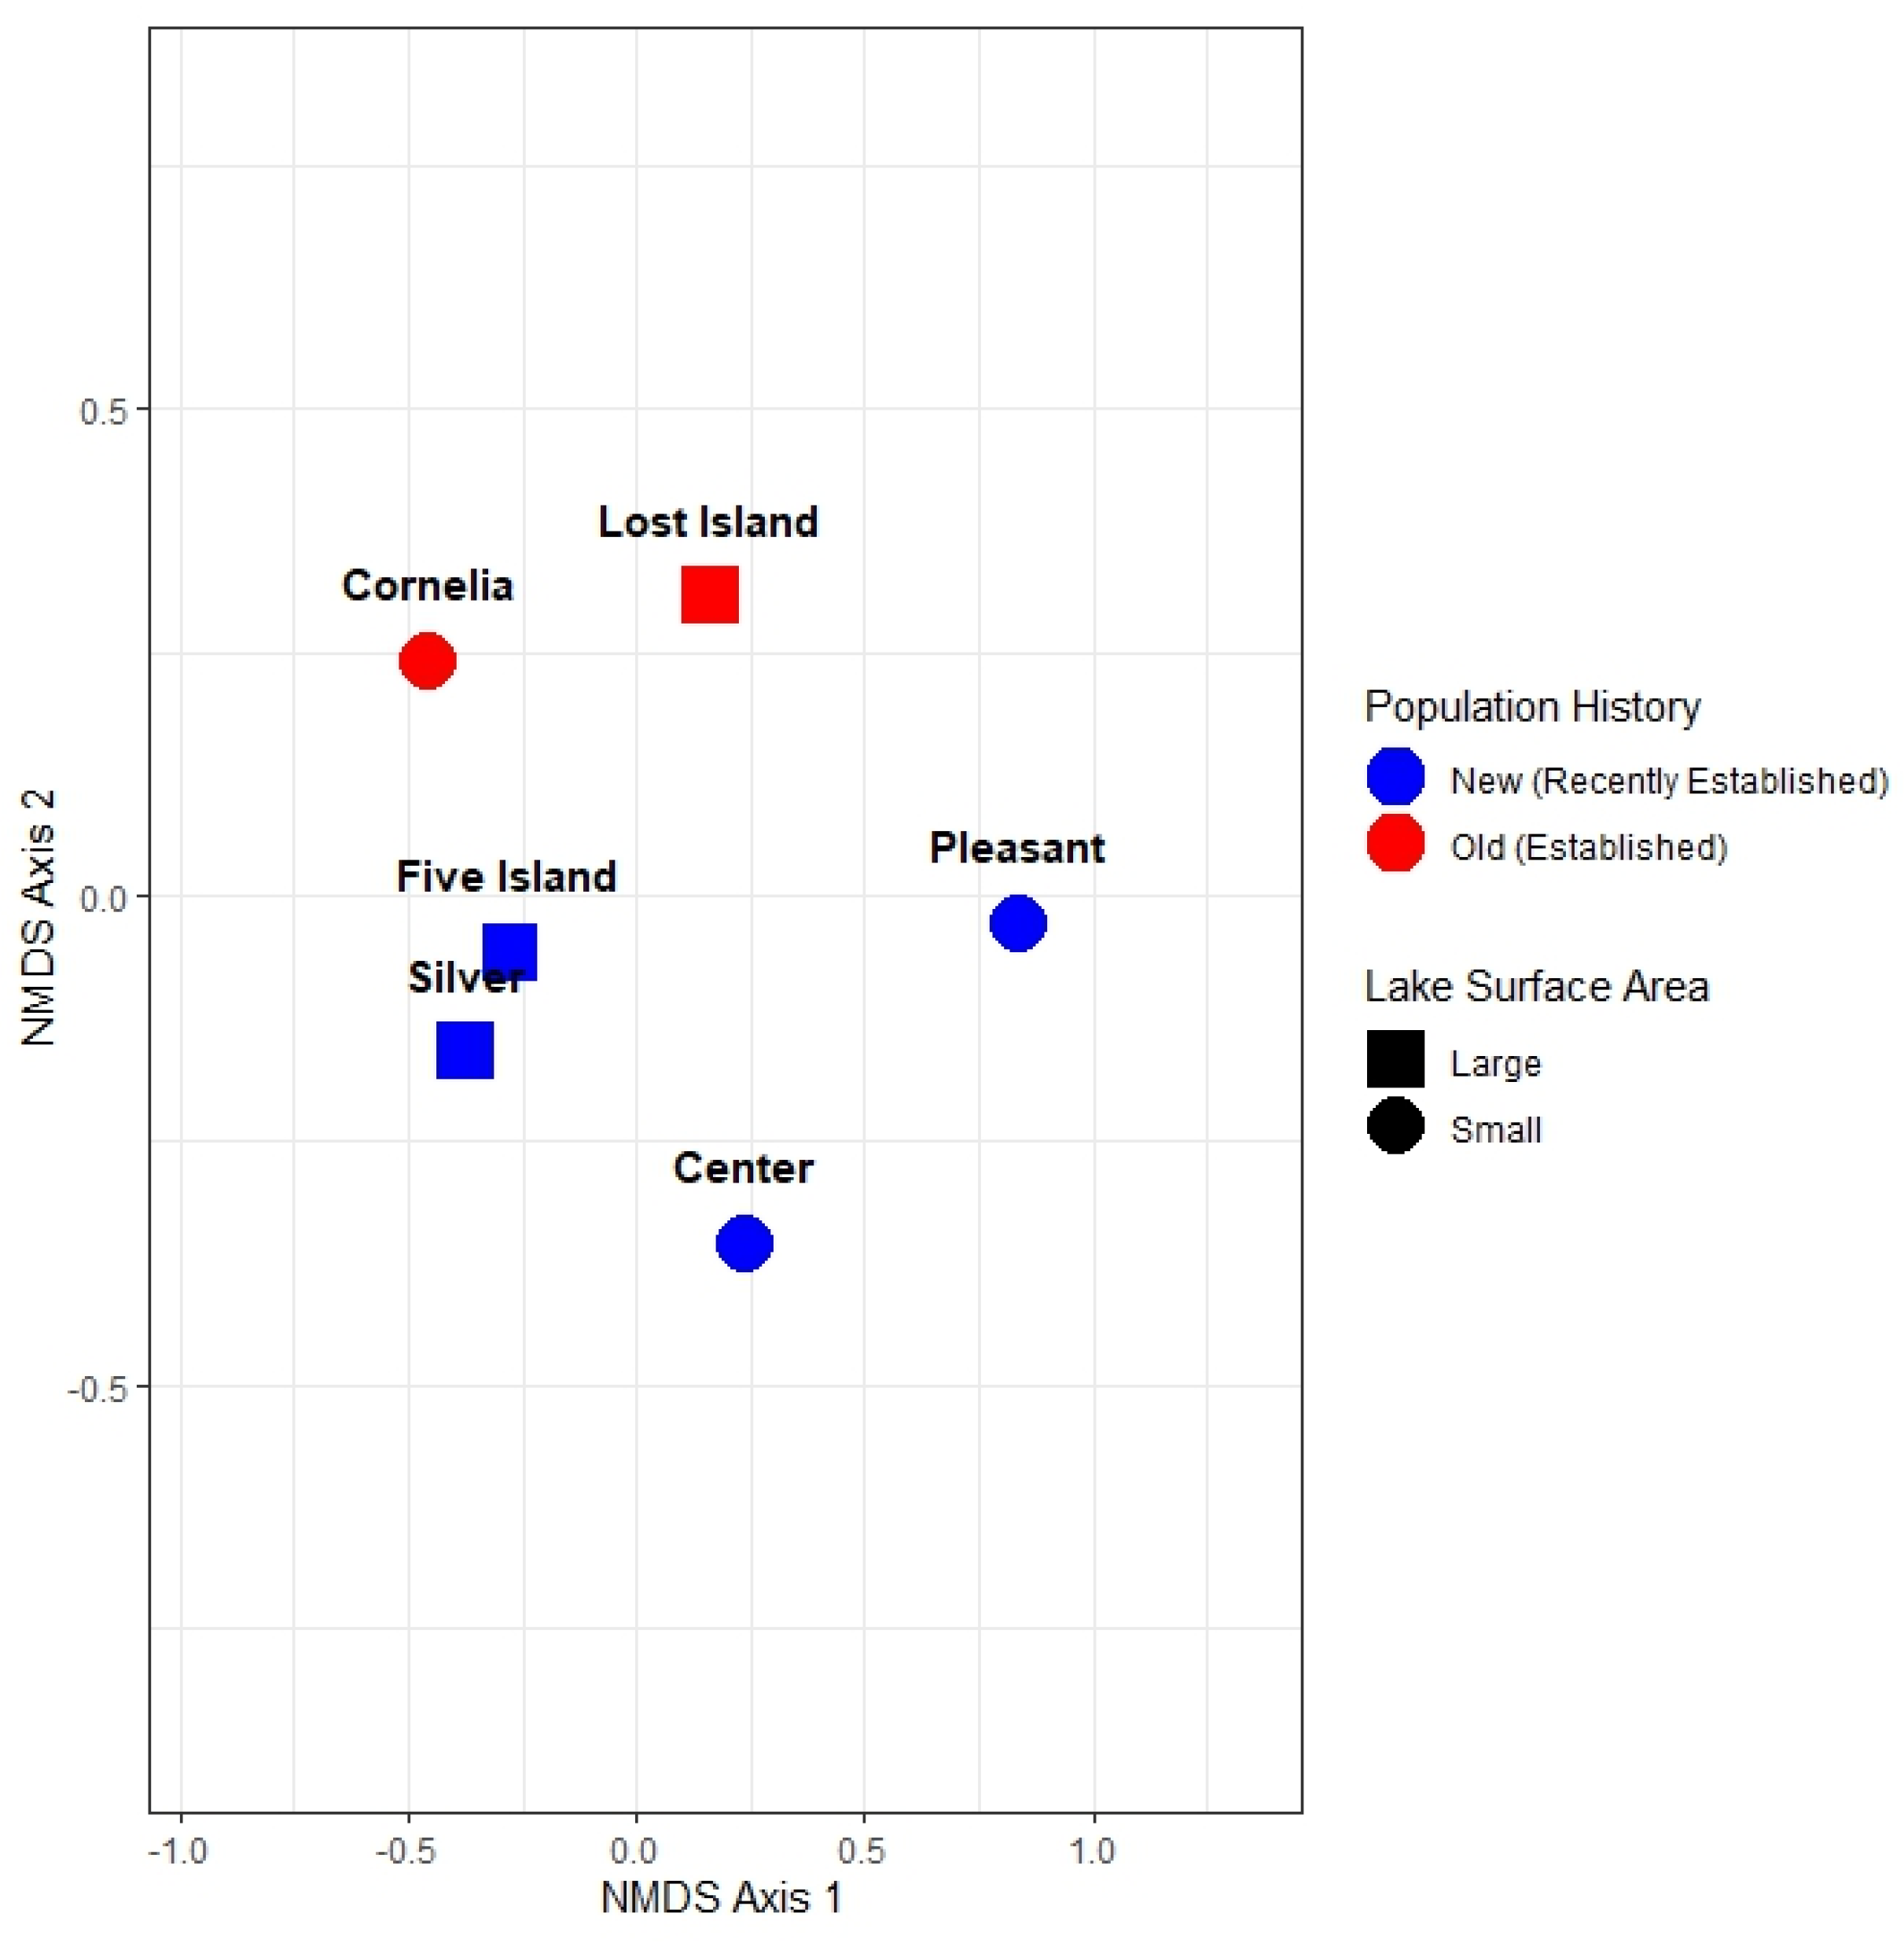
Approximately 10.2% of the total dietary variation was explained when evaluating the effect of Yellow Bass population history ( F 1 , 1095 = 44.53 ,   p < 0.001 ) and lake size ( F 1 , 1095 = 13.66 ,   p < 0.001 ) and their interaction ( F 1 , 1095 = 65.77 ,   p < 0.001 ) on Yellow Bass diet composition (Table 3). The interaction term accounted for the largest proportion of variance ( R 2 = 0.054 ) and exceeded the combined explanatory power of the main effects. This indicates that the influence of population history on trophic position is highly dependent on lake size; specifically, the dietary divergence between “new” and “old” populations is distinct in large lakes from small lakes (NMDS stress value = 0.13; Figure 2; Figure A1).
A three-way PERMANOVA model including lake, season, and year explained 40.7% of the total dietary variation in Yellow Bass diet composition (Table 4). Individual lakes were the primary driver of diet composition ( F 5 , 1051 = 44.81 ,   p < 0.001 ) explaining 12.6% of the variance, followed by the l a k e × s e a s o n interaction ( F 15 , 1051 = 12.65 ,   p < 0.001 ,   R 2 = 0.107 ) . While the main effects of season ( R 2 = 0.035 ) and year ( R 2 = 0.014 ) were also statistically significant, their independent explanatory power was marginal compared to other main effects and interactions. The substantial variation explained by the l a k e × s e a s o n interaction indicates that seasonal diet shifts do not occur simultaneously across lakes. Lastly, a tertiary interaction between l a k e × s e a s o n × y e a r was also significant, indicating that slight diet shifts exist between years, yet the primary spatial signal remains robust.
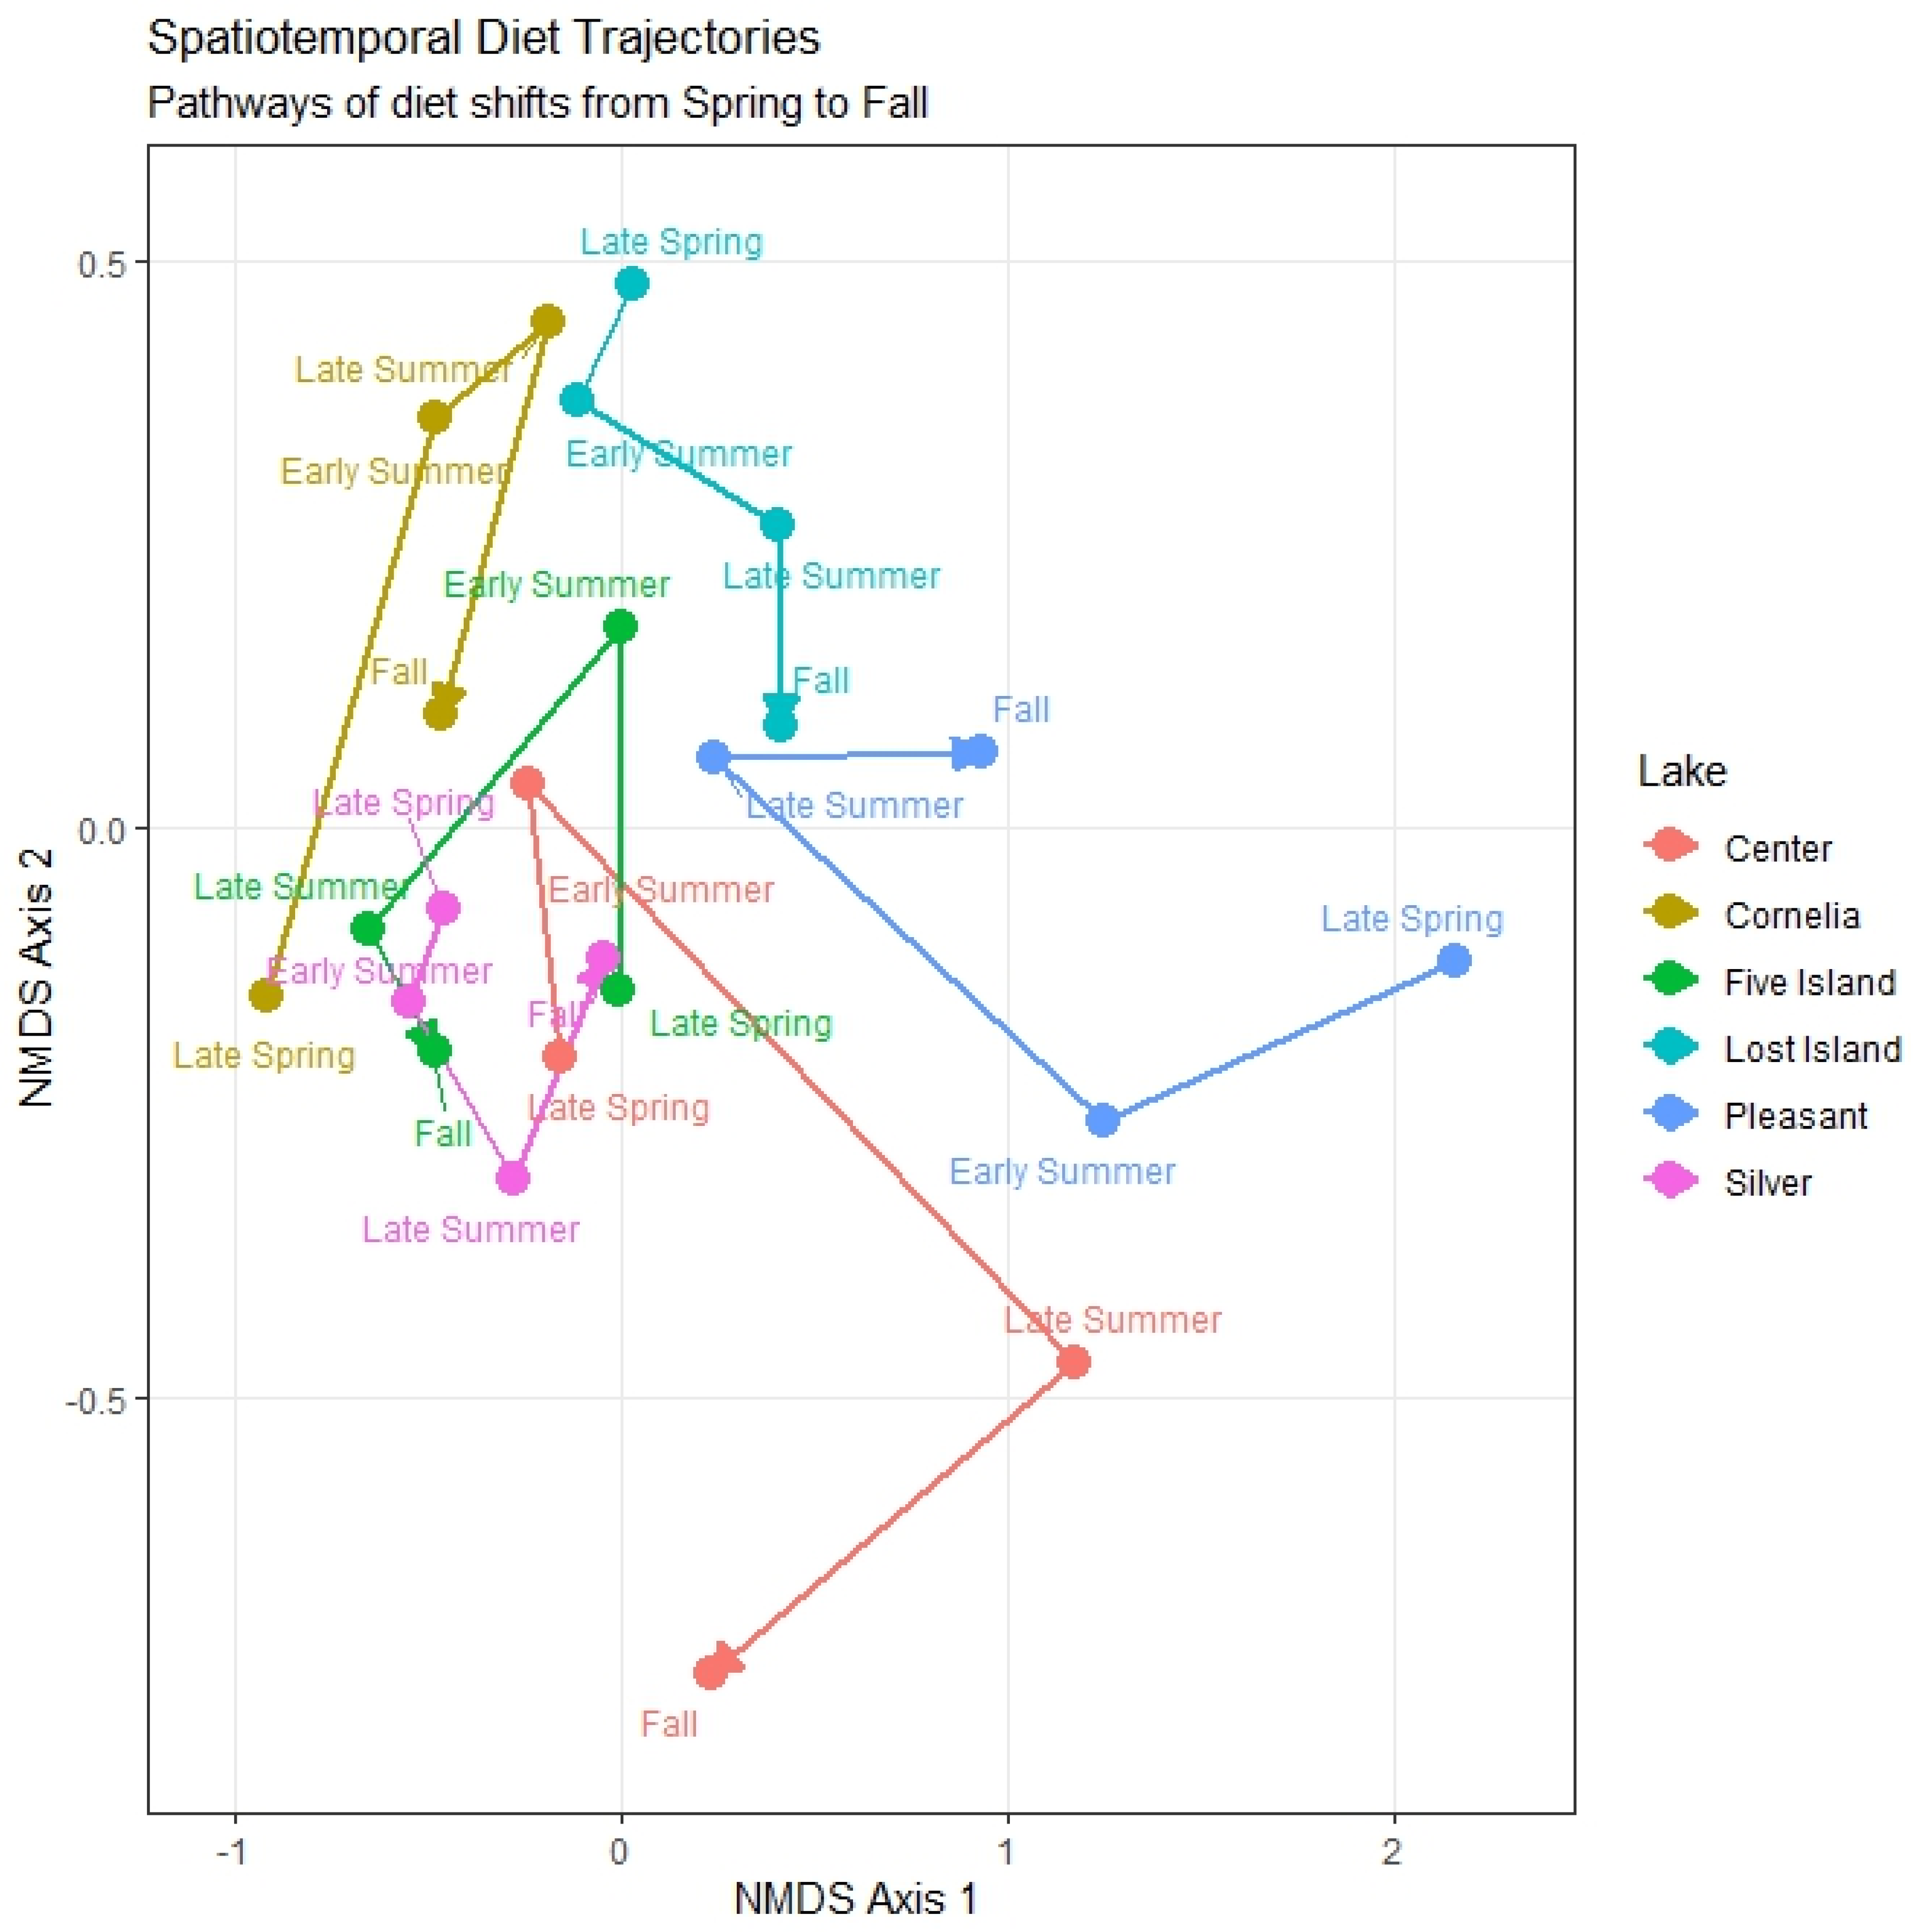
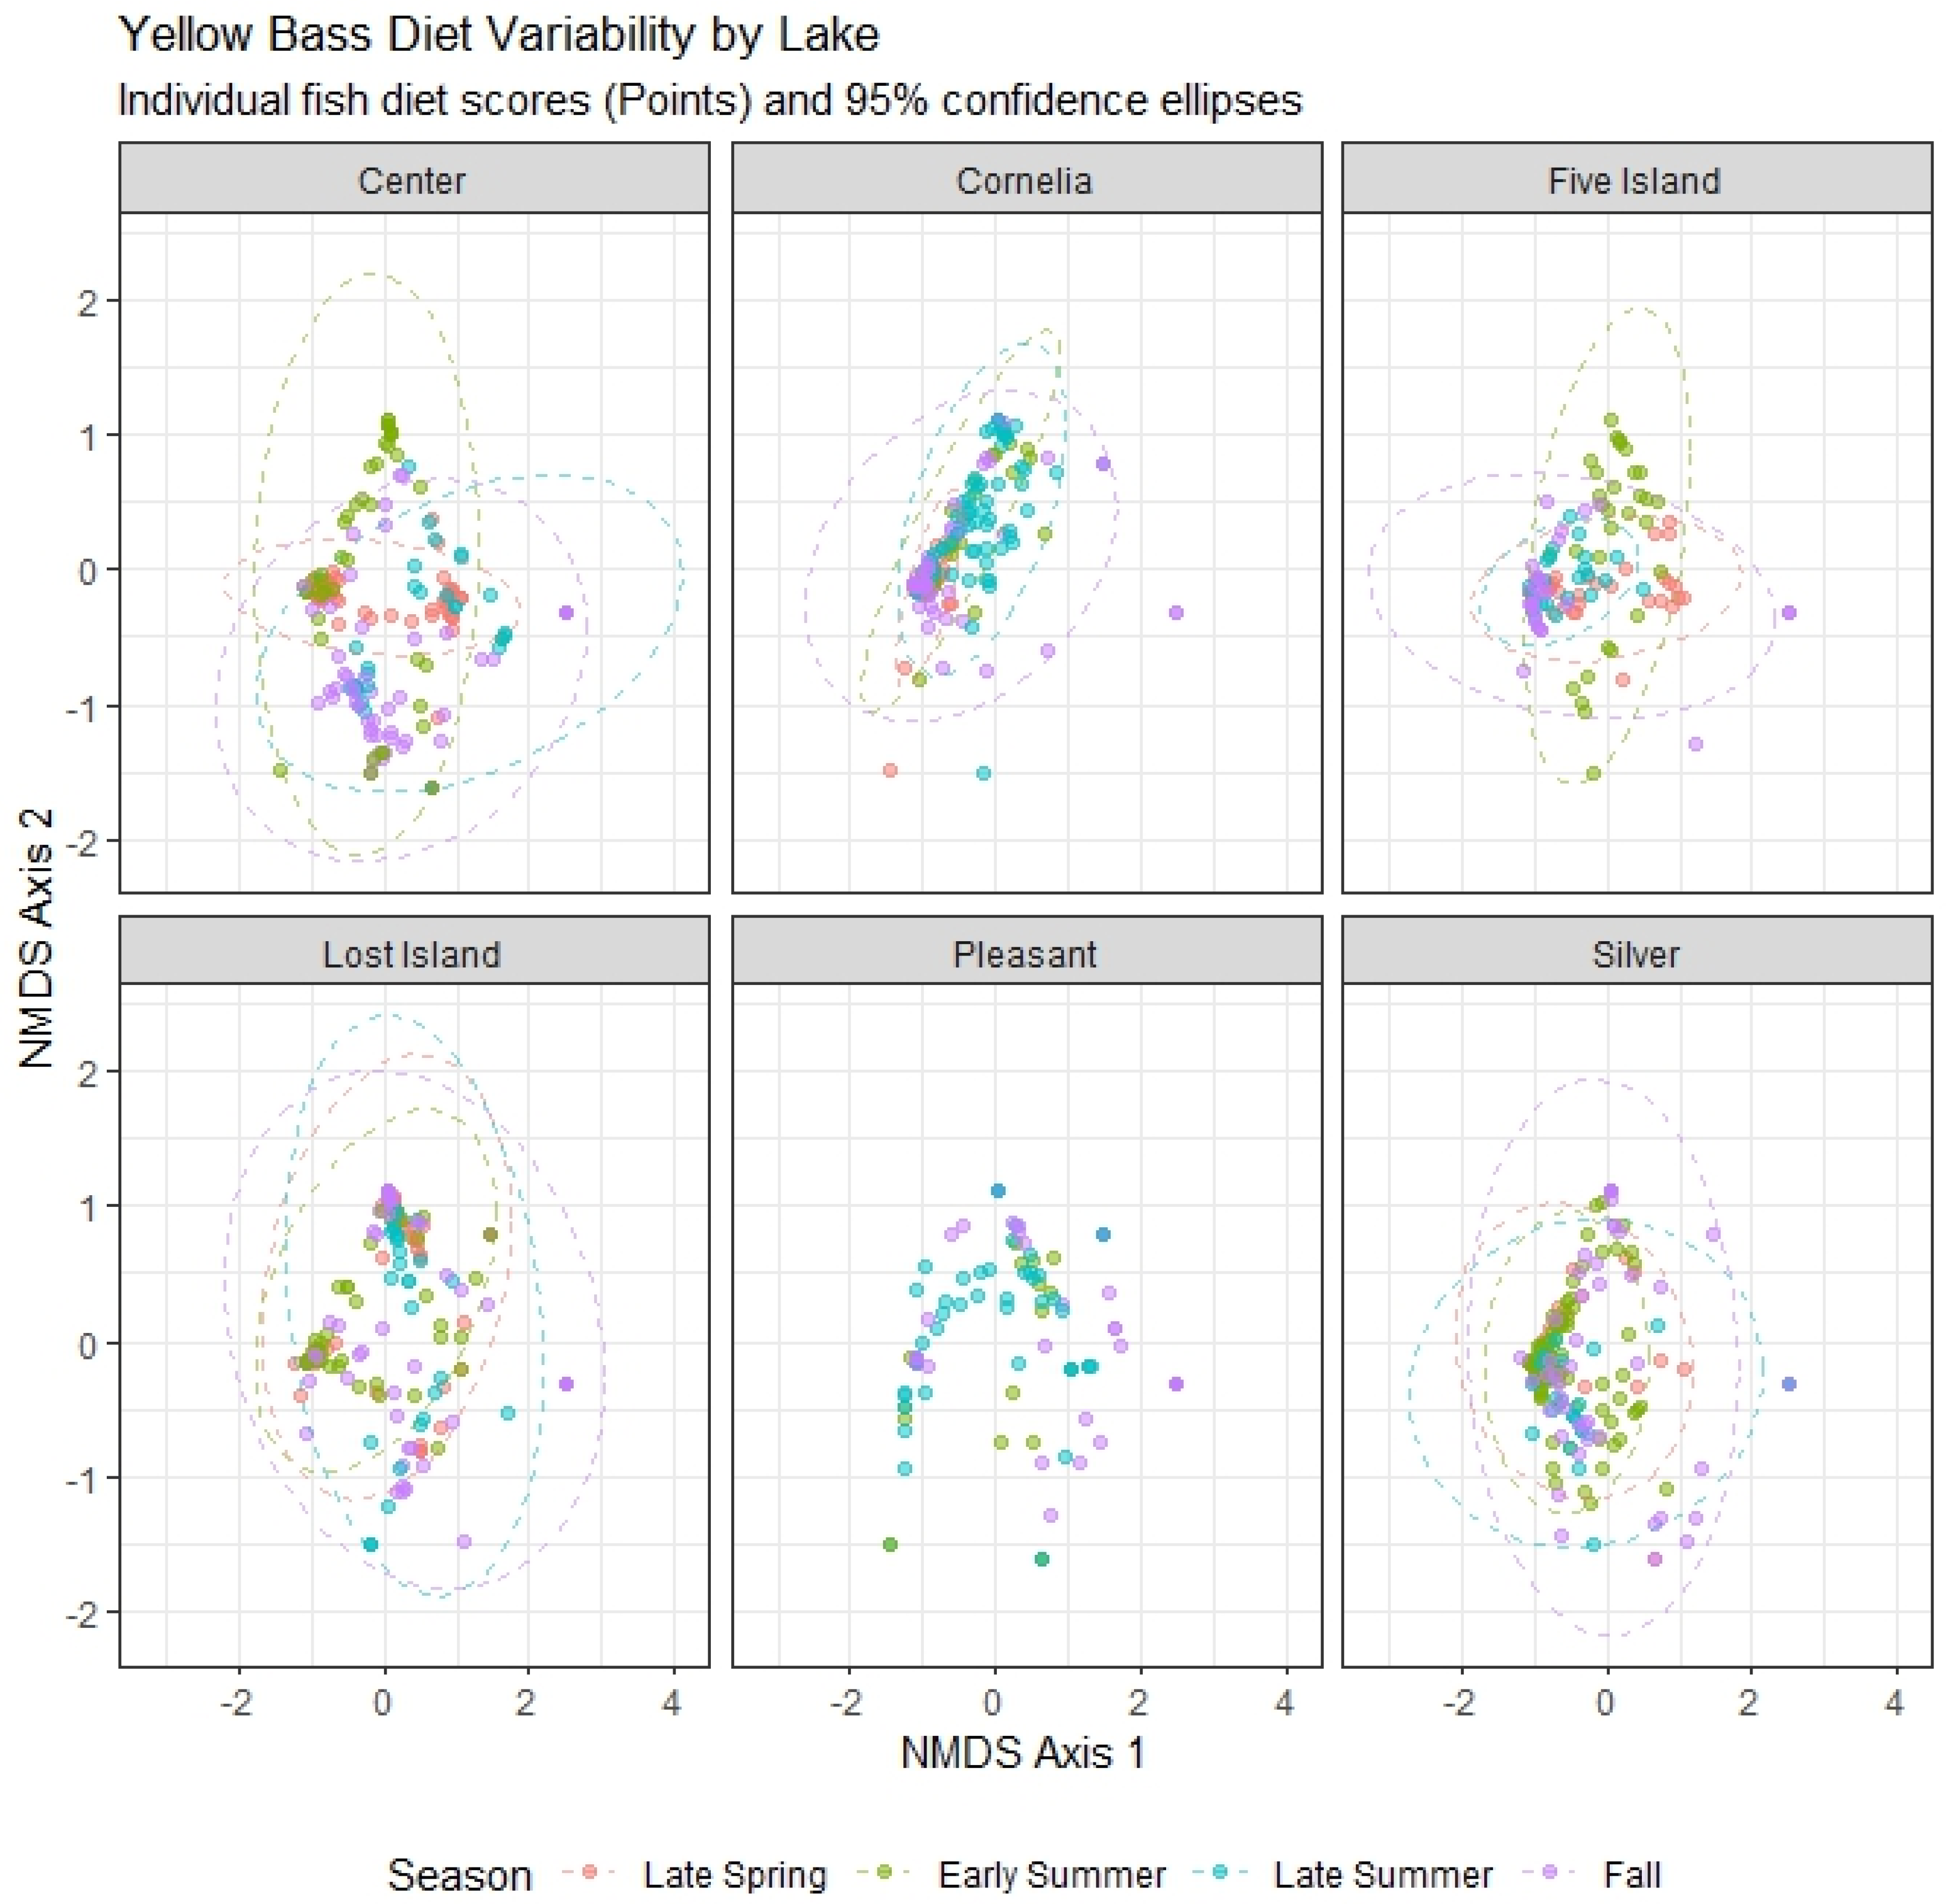
The NMDS ordination provided a good representation of the spatiotemporal dynamics on diet composition (stress = 0.13), and visualization of the seasonal trajectories via NMDS revealed that temporal shifts were highly system-specific (Figure 3; Figure A1). While all Yellow Bass populations exhibited directional turnover from spring to fall, the magnitude and trajectory of these shifts varied considerably among lakes. For example, Yellow Bass at Center Lake had the highest seasonal variation with dramatic shifts in prey between early summer and late summer, as well as late summer and fall. Pleasant Lake occupied a distinct region of the ordination space, indicating the high reliance of fish as prey. In contrast, Yellow Bass populations in Silver and Five Island lakes occupied a more central position in the ordination space, indicating more stable diet composition throughout the open-water period (Figure 3; Figure A1).
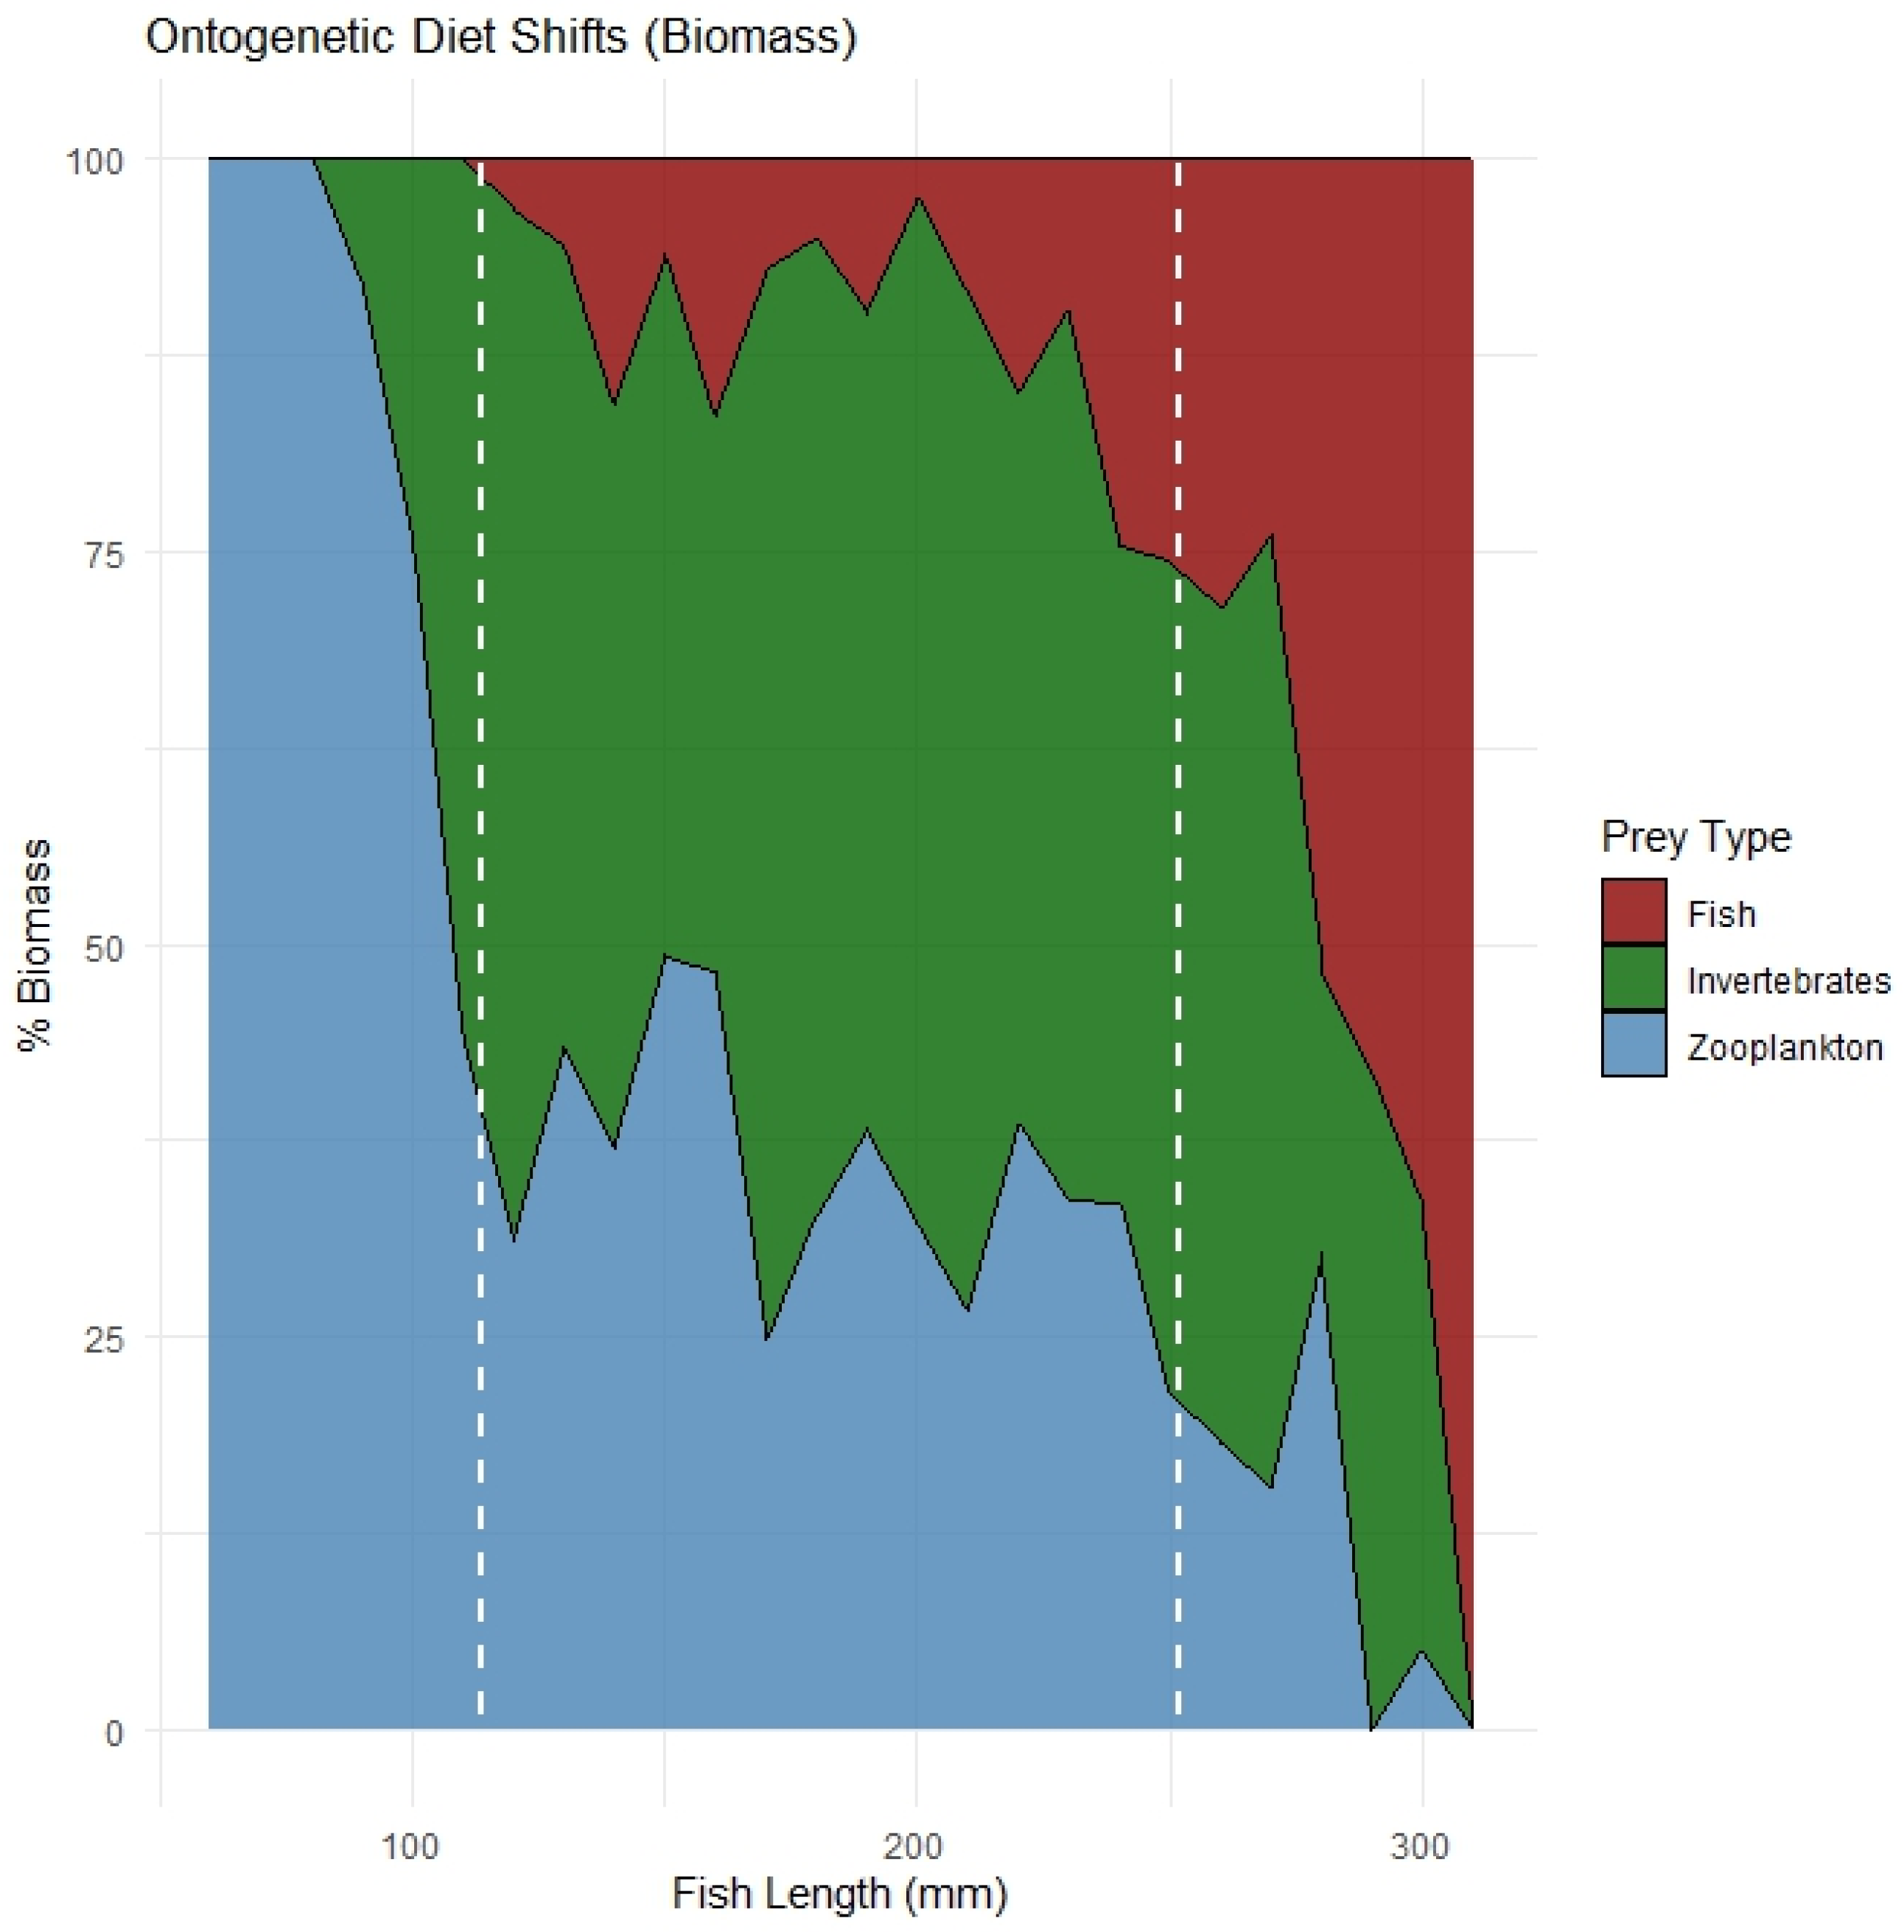
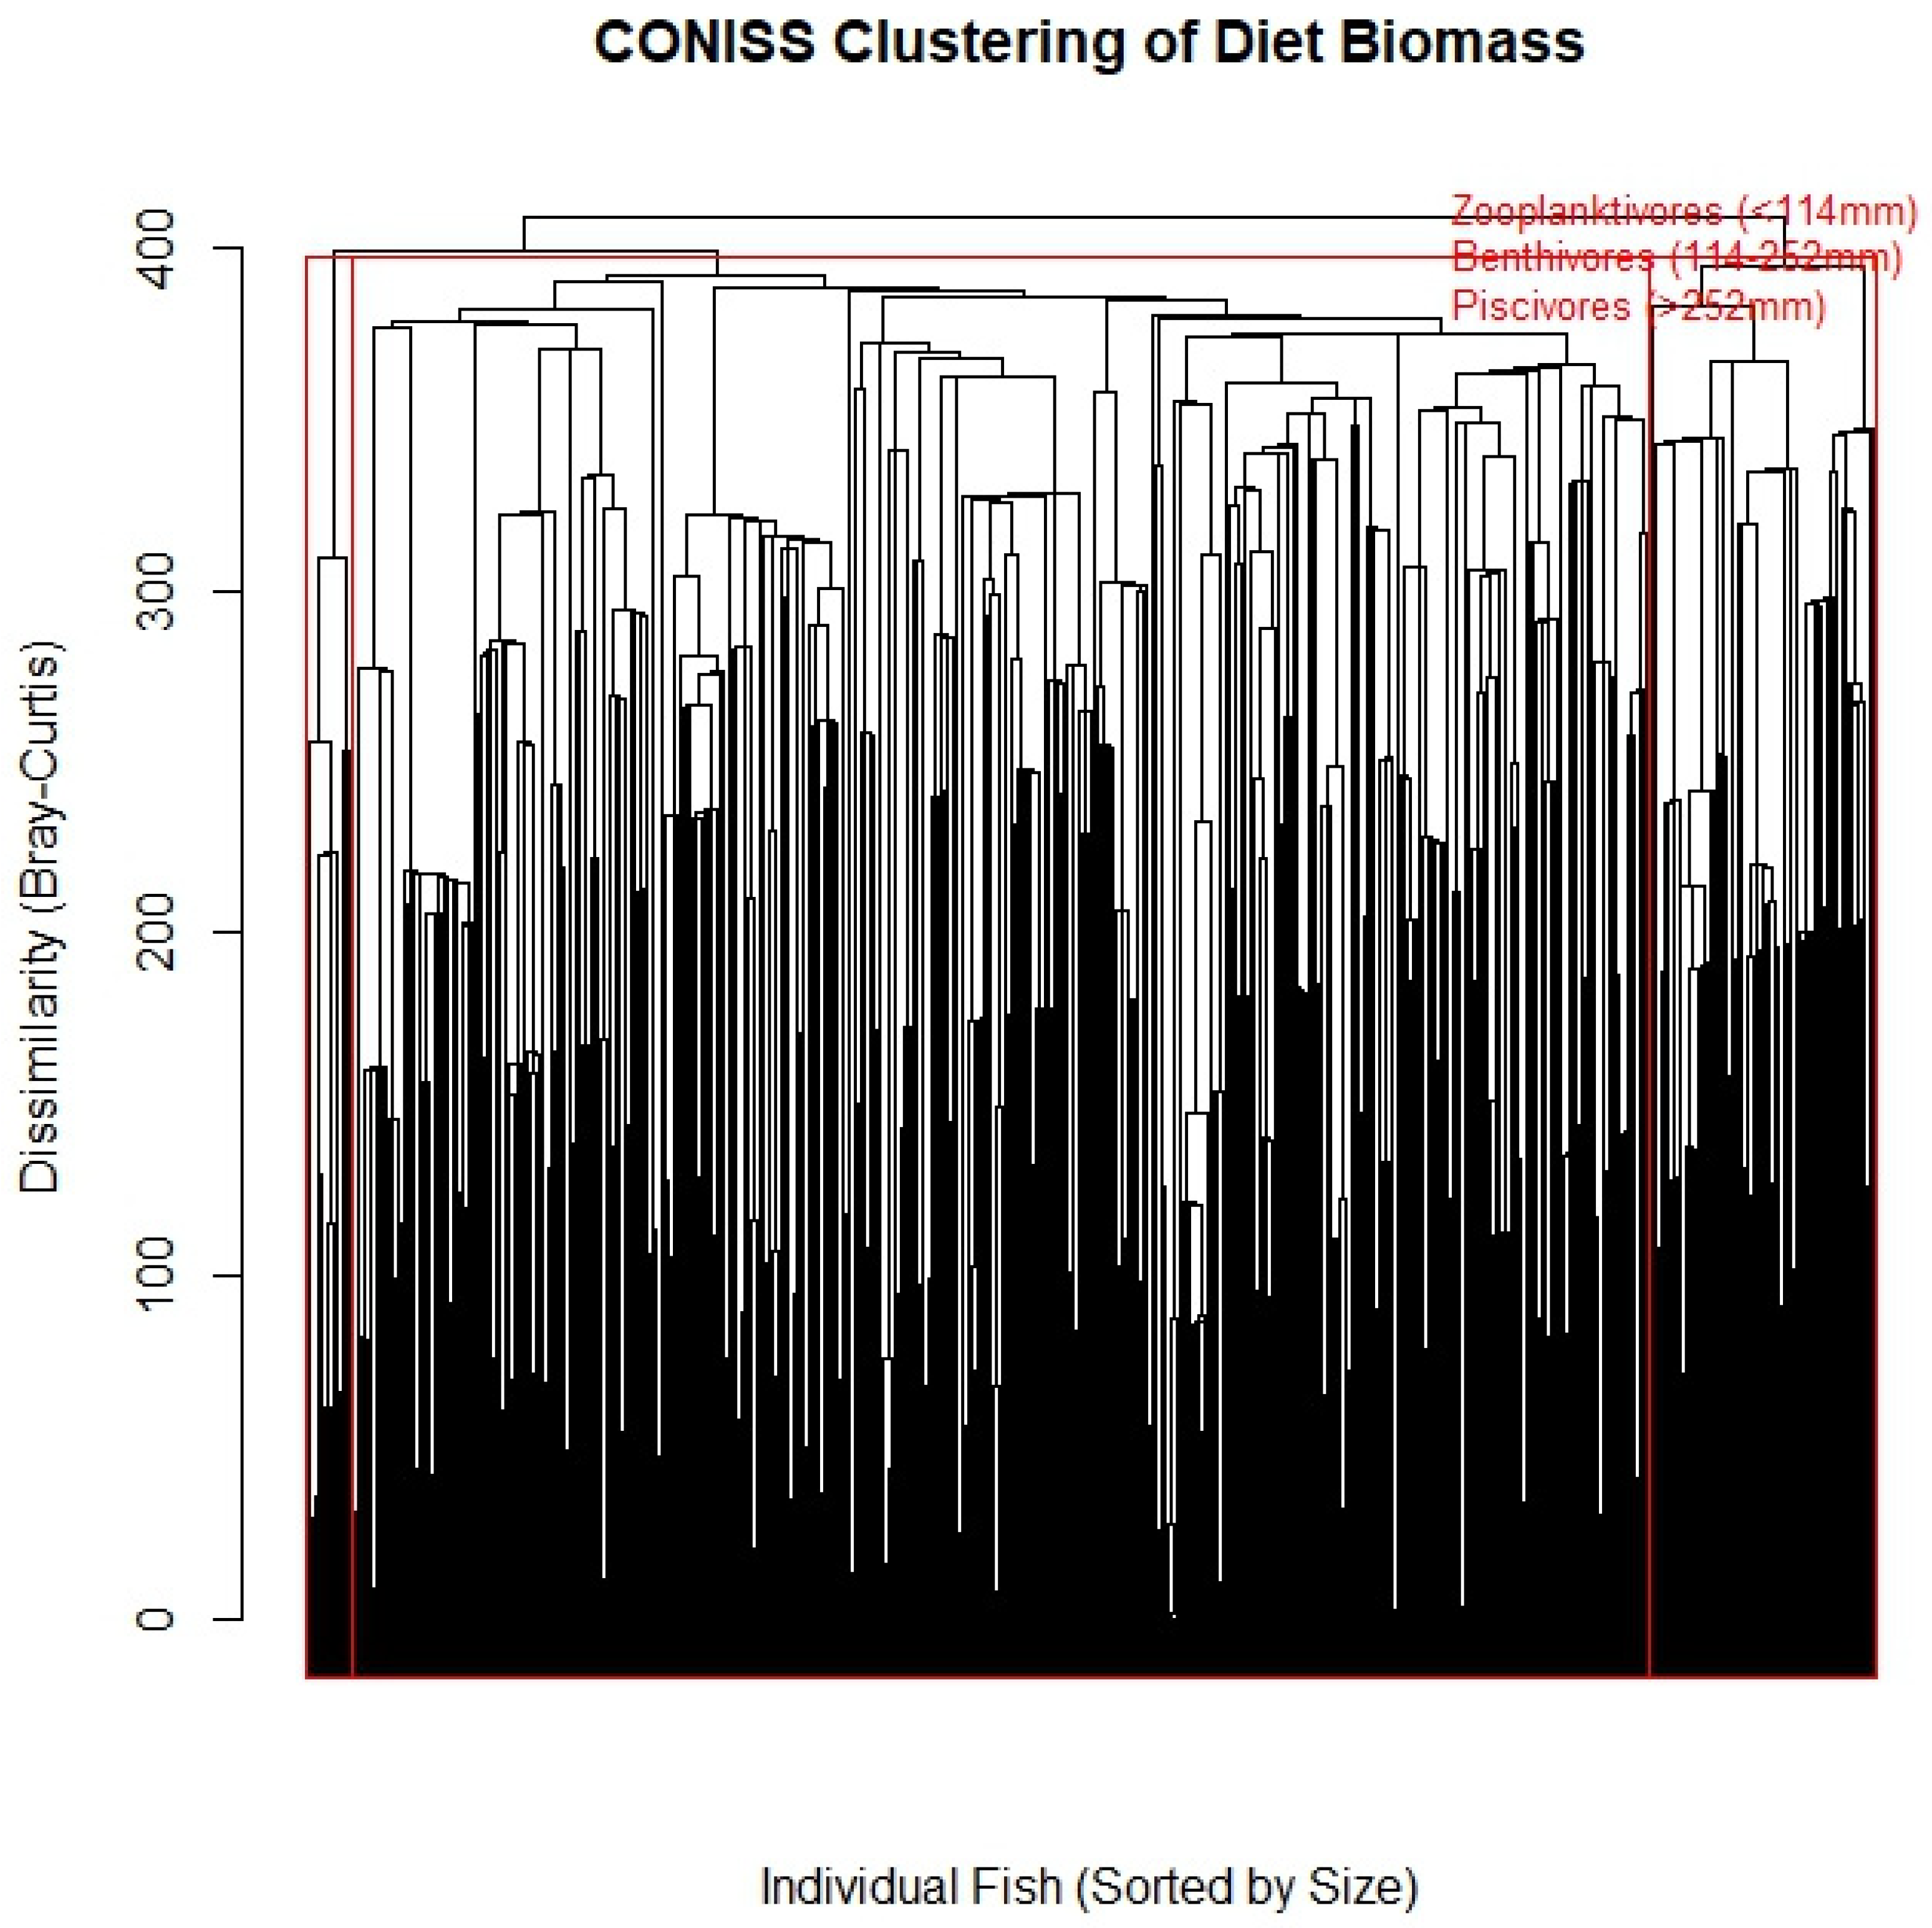
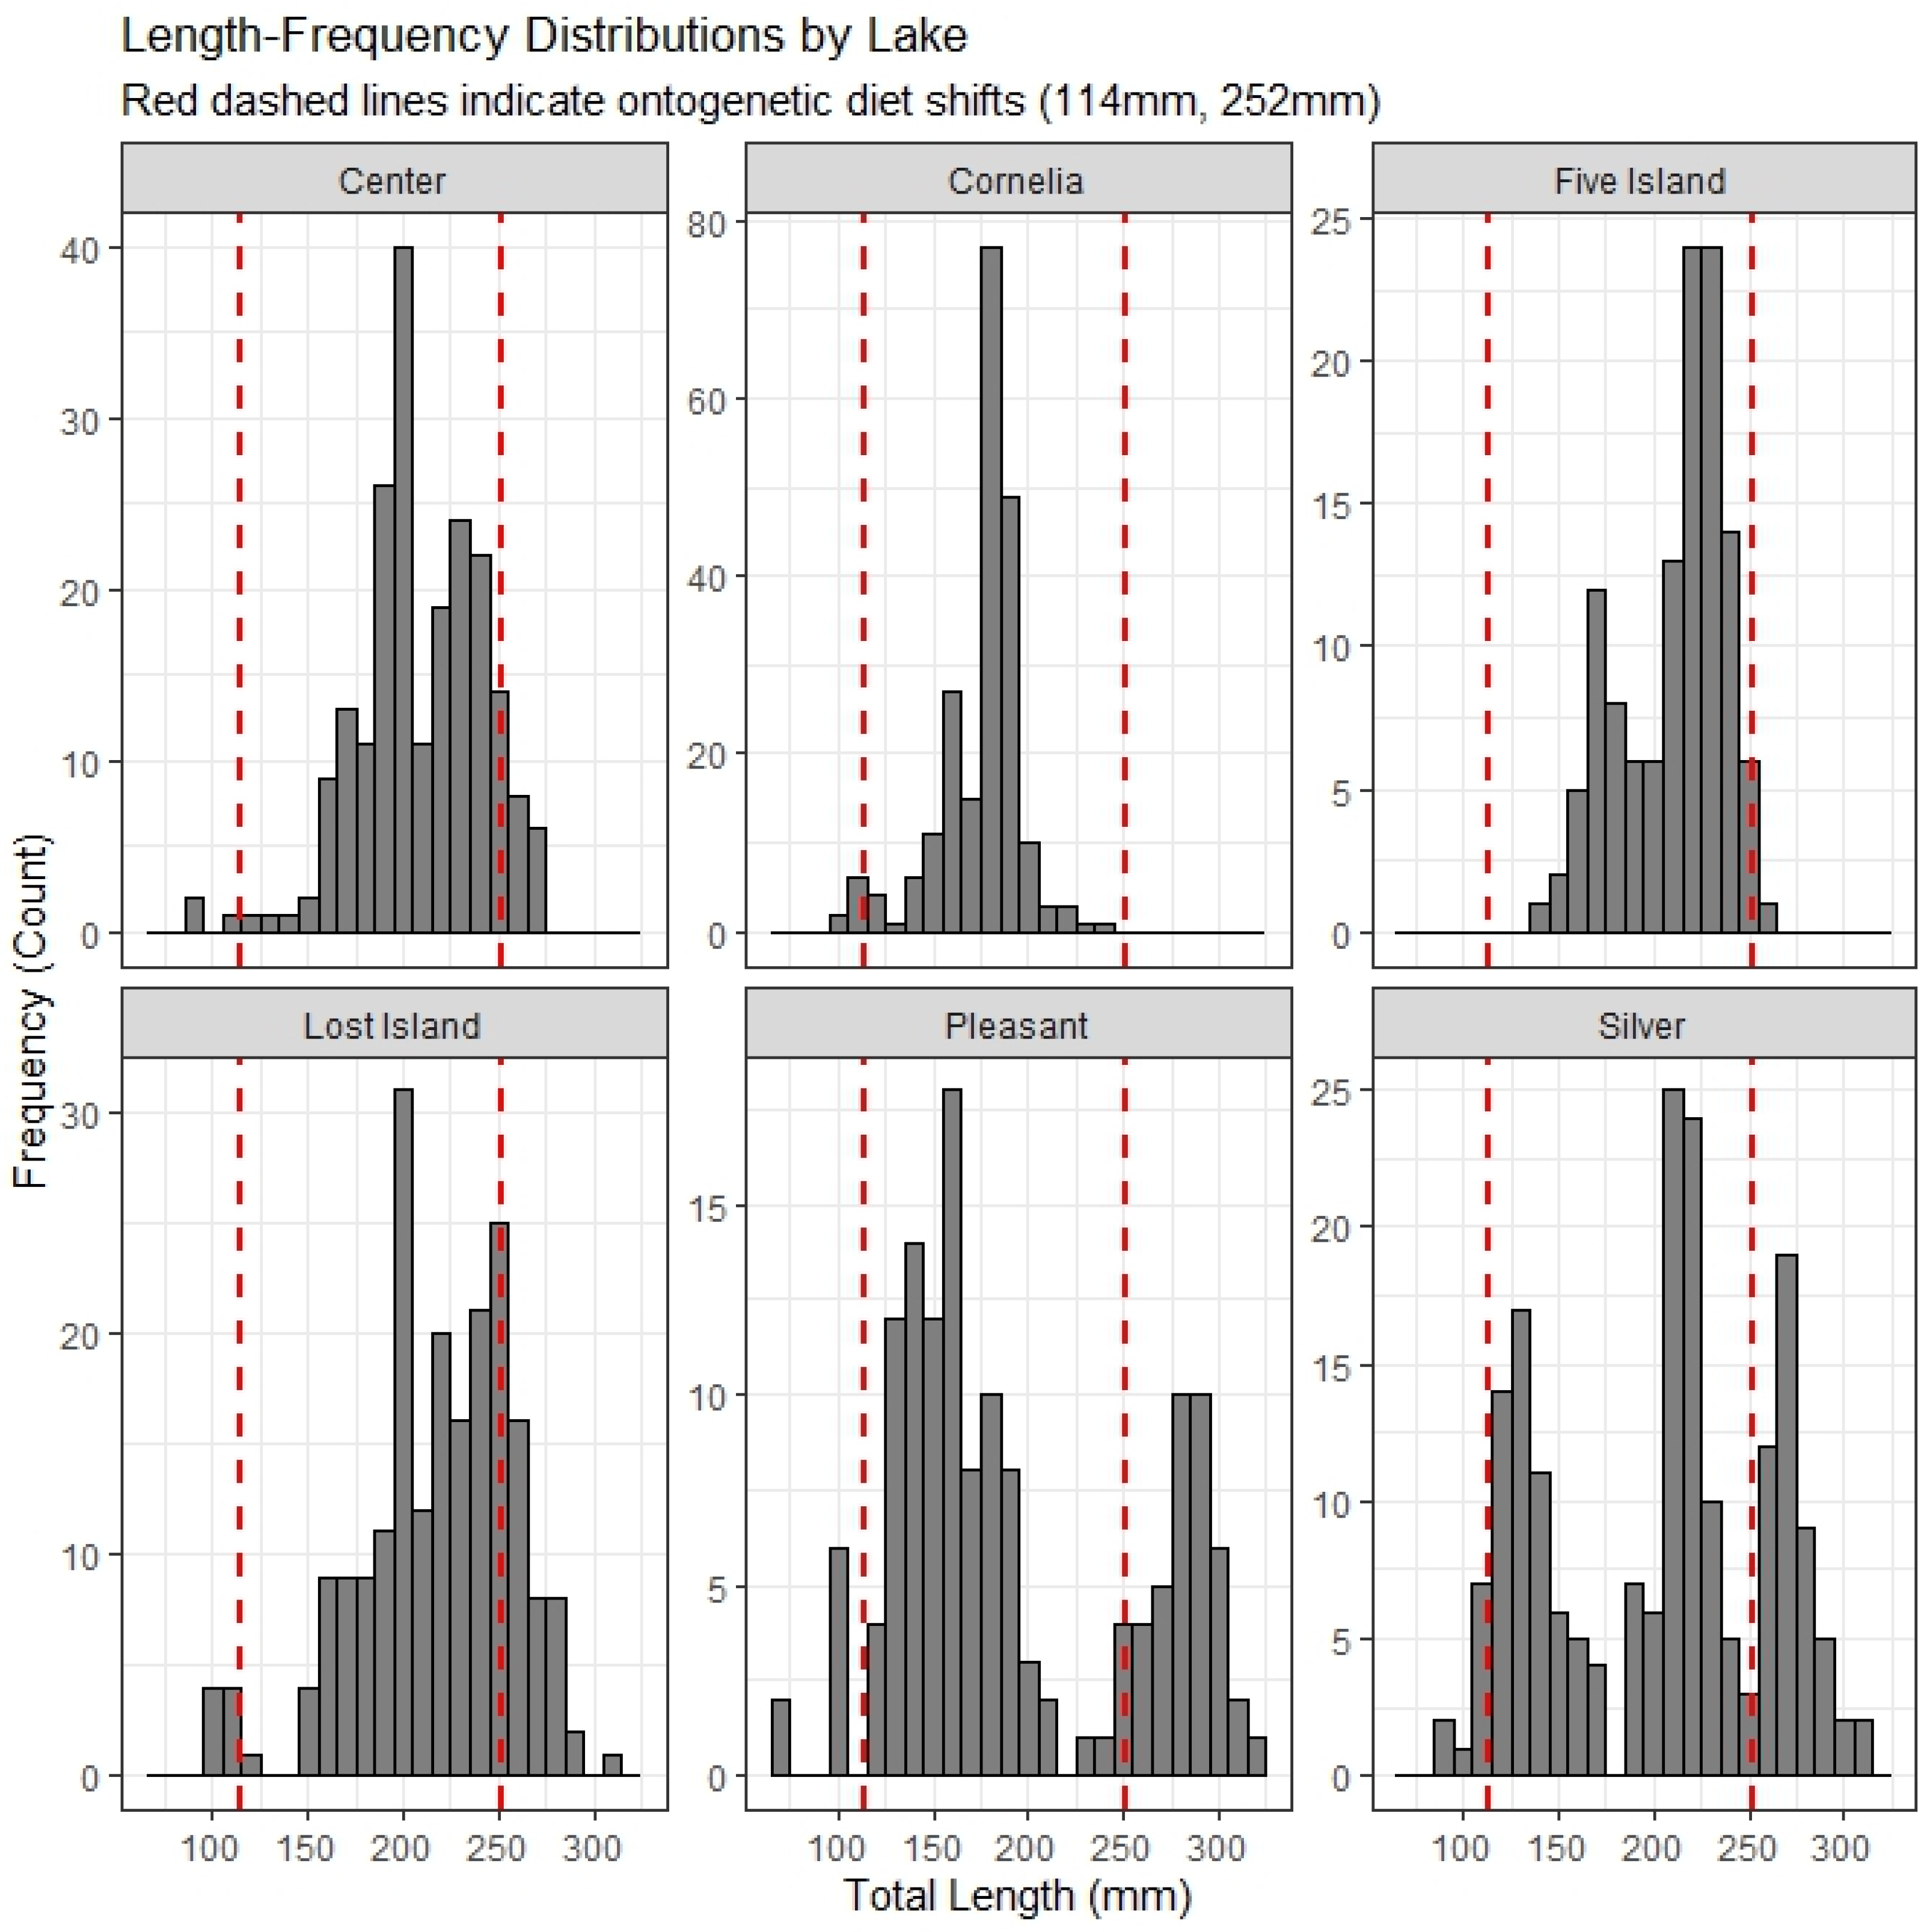
Constrained clustering (CONISS) of Yellow Bass diet biomass identified two significant ontogenetic breakpoints at 114 mm and 252 mm, representing three distinct functional trophic stages (Figure 4; Figure A2; Figure A3). Small individuals (<114 mm) occupied a zooplantivorous niche, consuming mostly Cladocera and Copepods. A shift to benthivory was observed at TLs between 114 and 252 mm, as fish consumed a variety of prey but primarily macroinvertebrates such as chironomids, amphipods, and ephemeropterans. A shift to piscivory occurred at sizes beyond 252 mm (Figure 4; Figure A2; Figure A3). This delayed onset of piscivory suggests that Yellow Bass are primarily secondary consumers for the majority of their life history, occupying the top predator niche only at large adult sizes.
The independent effects of biological variable (TL, age, and sex) on diet composition via a PERMANOVA model were all found to be significant predictors of trophic position (p < 0.001). As expected, the total length was the strongest intrinsic driver ( F 1 , 1093 = 37.49 ,   R 2 = 0.032 ) ; however, age also explained a unique portion of dietary variation ( F 1 , 1093 = 22.41 , R 2 = 0.019 ) . Sex also was significant but had a weaker effect ( F 1 , 1093 = 4.95 , R 2 = 0.013 ) .

4. Discussion

Our study provides the first comprehensive assessment of the trophic ecology of Yellow Bass in their introduced range in Iowa. By evaluating the diets of 1300 Yellow Bass across six natural lakes, we demonstrate that while Yellow Bass are fundamentally opportunistic feeders, their realized niche is constrained by prey availability (dictated by lake and population history) and resource access (mediated by temporal drivers and ontogeny). These results expand significantly upon earlier single-system studies in Iowa (e.g., Clear Lake [18,35,36,37,38], North Twin Lake [39,40]), revealing broader seasonal plasticity at lakes of various morphology. This dietary plasticity resembles strategies observed in other successful invasive fish. For example, invasive Round Goby (Neogobius melanostomus) in the Great Lakes exhibit broad flexible niches that allow them to exploit locally abundant food sources, a trait absent from the less successful Tubenose Goby (Proterorhinus semilunaris) [9]. Similarly, invasive Pumpkinseed (Lepomis gibbosus) diverge their trophic niche during periods of food scarcity to avoid competition in Iberian streams [41]. This opportunistic flexibility is a common trait among successful invaders, including non-native Northern Pike (Esox lucius) in Alaska, which can switch between piscivory and invertivory to survive in periods of low prey availability [42]. For Yellow Bass, the ability to toggle feeding strategies dependent on the lake they colonize facilitates successful expansion in Iowa’s natural lakes region.
However, regardless of their feeding strategy, our analysis of stomach vacuity and fullness found that Yellow Bass foraging is not uniform among lakes and seasons. Instead, we documented a distinct reduction in feeding during the late spring followed by a rapid increase in stomach fullness by early summer. This phenomenon is not unique to Yellow Bass, as several fish species experience early-season suppression of feeding intensity during reproductive activities followed by periods of compensatory feeding [43,44,45,46]. Although this trend was documented in every lake, the vacuity rates varied substantially among systems. For example, Yellow Bass vacuity rates in lakes where zooplankton were abundant remained similar among seasons, whereas Yellow Bass in piscivore-dominated systems (i.e., Pleasant Lake) experienced high vacuity rates, especially during spring. This functional disparity further underscores the plasticity of Yellow Bass diets, demonstrating their ability to modify foraging behavior to match local prey density.
Our results also confirm that both lake size and population history (i.e., old or new populations) significantly influence the seasonal diet composition of Yellow Bass in Iowa’s natural lakes. More importantly, we noted that the inclusion of the interaction term ( l a k e   s i z e × p o p u l a t i o n   h i s t o r y ) explained more variation then either factor alone, indicating that the ecological impact of establishment duration is mediated by the physical size of the ecosystem. These results provide insight into the trophic niche Yellow Bass may occupy upon and beyond population establishment. For example, new populations (e.g., Pleasant Lake) may exist at lower densities, allowing individuals to exploit high-quality benthic and fish prey. Conversely, established populations (e.g., Cornelia) may persist at higher densities, which can suppress benthic macroinvertebrate communities through top-down control, forcing a dietary shift toward smaller prey items, due to intraspecific competition [47]. Lake size may further constrain the diet composition, likely through habitat heterogeneity. In our study, larger lakes consistently supported a more diverse diet including a variety of benthic taxa, whereas small lakes often showed simplified food webs. This aligns with island biogeography theory applied to aquatic systems, where larger ecosystems support more complex food webs and diverse prey refugia [48,49,50].
Our results further indicate that spatial heterogeneity is the primary filter of Yellow Bass trophic dynamics in Iowa’s natural lakes. The dominance of lake identity in the PERMANOVA model clearly indicates that local environmental conditions, likely driven by lake specific biotic and abiotic interactions, provide unique prey communities. While seasonality within the model was also significant, the L a k e × S e a s o n interaction explained more variation, which indicates that diet shifts are highly situational. For example, the seasonal trajectories of diet composition at Center Lake exhibited high plasticity, shifting from zooplankton to benthic invertebrates as the season progressed. In contrast, Silver Lake displayed high stability, exploiting a consistent prey resource throughout the year. Inter-lake factors such as turbidity, productivity, and habitat characteristics could relate to these differences in Yellow Bass feeding habits. Gardner [51] found that the feeding efficiency of Bluegill (Lepomis macrochirus) decreased substantially in turbid water, and prey selection of Largemouth Bass (Micropterus salmoides) has been shown to differ with changing turbidity levels [52]. Hayward and Margraf [53] suggested that lake productivity may also influence the foraging ecology of Yellow Perch (Perca flavenscens) in Lake Erie. Yet others have found little evidence to support the theory that links morphometric and limnological variables to food webs [54,55]. Although incorporating these metrics into our diet analyses was not an objective of this study, they should be considered as potential factor(s) influencing the feeding habits of Yellow Bass in natural lake systems and continued to be explored. Nevertheless, the results from our study support the hypothesis that Yellow Bass are highly adaptable to a wide variety of physical environments.
Beyond the structural and physiological attributes of the aquatic ecosystems evaluated, the spatiotemporal differences we observed in Yellow Bass diet in Iowa’s natural lakes could simply be a condition of inter-lake prey availability, as many others have documented similar changes in Yellow Bass feeding ecology, as prey availability fluctuates throughout the year (i.e., opportunistic generalist feeding strategy; [14,20,21]). Our findings at Pleasant Lake and Lake Cornelia support these findings (see also [22]). Yellow Bass at Pleasant Lake relied heavily on fish in their diets, relative to other natural lakes across each season and year. Likewise, the dietary niche breadth was notably constricted in Lake Cornelia during the spring months, where foraging was directed almost entirely toward Cladocera. The diet composition of other fish species sampled concurrently in these two lakes were also restricted to fish or Cladocera diets [22], implying that prey availability may be limited spatiotemporally in some eutrophic natural lakes. This was especially apparent in Pleasant Lake, as 38% of Yellow Bass stomachs were observed as empty (range of 6.6% to 12% in other study lakes). Potential signs of prey availability affecting Yellow Bass diets has also been reported by Collier [40], who found individuals in North Twin Lake, Iowa, foraged heavily on fish prior to a lake drawdown and dredge cut and switched to consuming immature insects and small crustacea in years following these events. Collectively, these observations support the theory that prey availability, a common factor known to structure the diet composition of certain fishes [56,57,58], may have contributed to our findings. The ability of Yellow Bass to maintain flexible dietary patterns in systems with diverse and fluctuating prey assemblages likely contributes to their success as biological invaders.
Our results suggested multiple noteworthy differences in the effect of individual fish demographics on the dietary ecology of non-native Yellow Bass inhabiting shallow natural lakes in Iowa. First, we found that young (age–0) Yellow Bass exhibit high selectivity towards zooplankton until at least 114 mm TL, which further supports findings from other diet studies evaluating age–0 Yellow Bass diet composition [16,18,36,37]. Next, we documented a shift to piscivory at Yellow Bass sizes beyond 252 mm TL. Many studies have reported ontogenetic shifts in feeding habits across different life-history stages of fishes (see [59]), and these shifts have been particularly of interest for ecosystem invaders. Although Yellow Bass piscivory has been widely documented [14,16,35,37], few studies have reported the body size of fish, where ontogenetic diet shifts to piscivory may occur, and those that have reported TL sizes from a single lake during a period when other prey sources were scarce (>125 mm; [39]). Our study evaluated multiple lakes over a three-year period and found that piscivory mainly occurred at TLs > 200 mm and nearly exclusively at sizes >252 mm. These findings may be particularly important to managers, as Yellow Bass further expand their range into ecosystems where recruitment of more desirable native fishes could be impacted by increased predation [60]. In addition, we noted that fish piscivory was more pronounced in lakes with more recent Yellow Bass infestations, yielding important information on the feeding ecology of a recently introduced predator. However, it is also important to note that even though piscivory occurred at all lakes examined in this study, most of the piscivory we observed occurred at three lakes (Center, Pleasant, and Lost Island); thus, the expectations of Yellow Bass piscivory are not ubiquitous among lakes or infestation durations. Lastly, most Yellow Bass populations in Iowa and elsewhere do not exhibit population characteristics where densities of large (>225 mm) individuals are abundant [14,15,16], thus reducing the chance that Yellow Bass could negatively impact native populations via piscivory.
Contrary to expectations, sex was a statistically significant but biologically negligible driver of diet ( R 2 < 0.01 ) . This suggests that male and female Yellow Bass function as a unified ecological guild. Unlike centrarchids such as Bluegill, where nesting males may exhibit distinct foraging behaviors or habitat segregation (breeding males remaining littoral while females forage pelagically), Yellow Bass appear to share habitat and prey resources indiscriminately outside of the immediate spawning window. The significance of age independent of length, however, implies that older stunted fish may learn to exploit specific microhabitats or prey types that younger fish of the same size do not, a behavioral plasticity that warrants further investigation.

5. Conclusions

To our knowledge, this study provides the most comprehensive seasonal diet composition of non-native Yellow Bass in shallow midwestern natural lakes to date, offering critical insights for fisheries management. We demonstrate that while Yellow Bass primarily subsist on zooplankton and benthic invertebrates throughout the open-water period, they function as opportunistic generalists, capable of exploiting available prey as assemblages fluctuate. This feeding plasticity is a hallmark of successful biological invaders, allowing Yellow Bass to maintain high fitness across varying lake morphologies and productivities. The documented ontogenetic shift to piscivory at sizes > 252 mm, particularly in recently infested systems, suggests that expanding populations may exert significant predatory pressure on native fish communities during early establishment phases. Furthermore, the heavy reliance of small Yellow Bass (<150 mm) on the same invertebrate resources required by native juveniles suggests a potential for a competitive juvenile bottleneck, where the invader limits the recruitment of native predators even if those predators eventually utilize adult Yellow Bass as a forage base [61,62]. These findings underscore the need for resource and ecosystem managers to move beyond simple occurrence records and routinely monitor population dynamics and trophic interactions [15]. Management strategies should prioritize early detection in high-risk habitats and consider the long-term biological effects of resource competition, which may prove more detrimental to the native community structure than direct predation alone.

Author Contributions

J.R.M. conceived the study design, performed historic data mining, and collected field data. J.R.M. led the manuscript writing, with assistance from S.M.R. Both authors contributed to data interpretation, cited literature context, and manuscript editing. All authors have read and agreed to the published version of the manuscript.

Funding

This study was funded by Iowa fishing license sales and the Federal Aid in Sport Fish Restoration Program.

Institutional Review Board Statement

This study followed the American Fisheries Society’s Guidelines for the Use of Fishes in Research and all applicable state and federal animal welfare laws. State of Iowa Code 481A.39 authorizes the Department of Natural Resources to conduct this type of study for the purpose of ensuring biological balance is maintained, and the Iowa DNR is not required to seek an external ethical review or approval.

Informed Consent Statement

This study did not involve humans.

Data Availability Statement

Data are contained within the article.

Acknowledgments

We appreciate the assistance with sample collection provided by the personnel at the Spirit Lake Fish Hatchery (Iowa DNR). Significant contributions to sampling and fish processing were made by D.J. Vogeler, D. Foley, and V. Wassink. G. Griffin volunteered for both field and laboratory work, and his assistance was appreciated. We thank Iowa Lakeside Laboratory for providing dedicated staffing resources to assist with this research. Comments on earlier version of this manuscript by Rebecca Krogman and three anonymous reviewers improved the manuscript.

Conflicts of Interest

The authors declare no conflicts of interest.

Abbreviations

The following abbreviations are used in this manuscript:
PERMANOVAPermutational Multivariate Analysis of Variance
CONISSConstrained clustering
NMDSNon-metric Multidimensional Scaling
ANOVAAnalysis of Variance
TLTotal length

Appendix A

Table A1. Mean percent biomass of prey taxa found in Yellow Bass diets across six Iowa lakes from April to November 2018–2020. Values represent the reconstructed energetic contribution of each prey guild to the total stomach content weight. Chiro = Chironomidae.
LakeAmphipodaChiro. LarvaeChiro. PupaeCladoceranCopepodaEphemeropteranFishHemipteraLeptodoraInsects/Other
Center0.1112.9123.0216.590.080.1822.743.5120.660.21
Cornelia1.5629.996.8725.450.130.1825.770.051.48.58
Five Island0.0014.1529.968.940.027.1631.70.642.245.19
Lost Island0.5167.049.641.080.080.3417.770.012.221.31
Pleasant0.010.710.850.320.110.0896.580.910.000.43
Silver0.4131.456.2113.830.042.0722.035.5717.580.79
Table A2. Mean percent numerical abundance of prey taxa found in Yellow Bass diets across six Iowa lakes from April to November 2018–2020. Values represent the proportion of total prey items counted. Chiro = Chironomidae.
LakeAmphipodaChiro. LarvaeChiro. PupaeCladoceranCopepodaEphemeropteranFishHemipteraLeptodoraInsects/Other
Center0.127.168.2766.940.420.310.201.2515.280.03
Cornelia0.476.670.5390.210.970.010.020.000.370.75
Five Island0.006.1311.4775.230.721.700.050.223.291.16
Lost Island1.3352.298.7622.377.030.180.140.016.920.97
Pleasant0.115.361.8965.8723.820.110.861.670.010.30
Silver0.427.671.6371.601.050.330.121.2015.880.11
Figure A1. Non-metric Multidimensional Scaling (NMDS) ordination of individual Yellow Bass diets from six naturals lakes in Iowa collected during late spring (April–May; red), early summer (June–July; green), late summer (August–September; blue) and fall (October–November; purple) between 2018 and 2020. Points represent individual fish colored by season, with 95% confidence ellipses, illustrating high intra-population variability.
Fishes 11 00124 g0a1
Figure A2. Dendrogram resulting from Constrained Incremental Sum of Squares (CONISS) cluster analysis of Yellow Bass diet biomass, identifying three distinct trophic ontogenetic stages (Zooplanktivore, Benthivore, Piscivore).
Fishes 11 00124 g0a2
Figure A3. Length–frequency distributions of Yellow Bass populations in the six study lakes. Vertical dashed lines indicate the ontogenetic thresholds (114 mm, 252 mm) identified in Figure A2.
Fishes 11 00124 g0a3

References

  1. Courtenay, W.R., Jr.; Kohler, C.C. Exotic fishes in North American fisheries management. In Fish Culture in Fisheries Management; Stroud, R.H., Ed.; American Fisheries Society: Bethesda, Maryland, 1986; Volume 3, pp. 154–196. [Google Scholar]
  2. Krueger, C.C.; May, B. Ecological and genetic effects of salmonid introductions in North America. Can. J. Fish. Aquat. Sci. 1991, 48, 66–77. [Google Scholar] [CrossRef]
  3. Gozlan, R.E.; Britton, J.R.; Cowx, I.; Copp, G.H. Current knowledge on non-native freshwater fish introductions. J. Fish Biol. 2010, 76, 751–786. [Google Scholar] [CrossRef]
  4. Cucheroussett, J.; Olden, J.D. Ecological impacts of non-native freshwater fishes. Fisheries 2011, 36, 215–230. [Google Scholar] [CrossRef]
  5. Mata, T.M.; Haddad, N.M.; Holyoak, M. How invader traits interact with resident communities and resource availability to determine invasion success. Oikos 2013, 122, 149–160. [Google Scholar] [CrossRef]
  6. Bissattini, A.M.; Haubrock, P.J.; Buono, V.; Balzani, P.; Borgianni, N.; Stellati, L.; Inghilesi, A.F.; Tancioni, L.; Martinoli, M.; Tricarico, E.; et al. Trophic structure of a pond community dominated by an invasive alien species: Insights from stomach content and stable isotope analyses. Aquat. Conserv. Mar. Freshw. Ecosyst. 2020, 31, 948–963. [Google Scholar] [CrossRef]
  7. Vidal, N.; Trochine, C.; Amsinck, S.L.; Barmuta, L.A.; Christoffersen, K.S.; Ventura, M.; Jeppesen, E. Interactions between non-native predatory fishes and native galaxiids (Pisces: Balaxiidae) shapes food web structure in Tasmanian lakes. Inland Waters 2020, 10, 212–226. [Google Scholar] [CrossRef]
  8. Peterson, A.T.; Vieglais, D.A. Predicting species invasions using ecological niche modeling: New approaches from bioinformatics attack a pressing problem: A new approach to ecological niche modeling, based on new tools drawn from biodiversity informatics, is applied to the challenge of predicting potential species invasions. BioScience 2001, 51, 363–371. [Google Scholar] [CrossRef]
  9. Pettitt-Wade, H.; Wellband, K.W.; Heath, D.D.; Fisk, A.T. Niche plasticity in invasive fishes in the Great Lakes. Biol. Invasions 2015, 17, 2565–2580. [Google Scholar] [CrossRef]
  10. Keast, A. Diet overlap and feeding relationships between the year classes in the Yellow Perch (Perca flavescens). Environ. Biol. Fishes 1977, 2, 53–70. [Google Scholar] [CrossRef]
  11. Hrabik, T.R.; Carey, M.P.; Webster, M.S. Interactions between young-of-the-year exotic Rainbow Smelt and native Yellow Perch in a northern temperate lake. Trans. Am. Fish. Soc. 2001, 130, 568–582. [Google Scholar] [CrossRef]
  12. Garcia, D.A.Z.; Vidotto-Magnoni, A.P.; Orsi, M.L. Diet and feeding ecology of non-native fishes in lentic and lotic freshwater habitats. Aquat. Invasions 2018, 13, 565–573. [Google Scholar] [CrossRef]
  13. Page, L.M.; Burr, B.M. A Field Guide to Freshwater Fishes of North America North of Mexico; The Peterson Field Guide Series; Houghton Mifflin: Boston, MA, USA, 1991; Volume 42. [Google Scholar]
  14. Snow, R.A.; Porta, M.J. Population dynamics and diets of Yellow Bass in New Spiro Reservoir, Oklahoma. Proc. Okla. Acad. Sci. 2020, 100, 54–61. [Google Scholar]
  15. Meerbeek, J.R.; Renner, S.M. Population dynamics of non-native Yellow Bass in Iowa’s natural lake region. J. Freshw. Ecol. 2025, 40, 2488018. [Google Scholar] [CrossRef]
  16. Stein, J.E. Biology of nonindigenous White Perch and Yellow Bass in an oxbow of the Missouri River. Master’s Thesis, Emporia State University, Emporia, KS, USA, 2001. [Google Scholar]
  17. Chizinski, C.J.; Pope, K.L.; Wilde, G.R.; Strauss, R.E. Implications of stunting on morphology of freshwater fishes. J. Fish Biol. 2010, 76, 564–579. [Google Scholar] [CrossRef]
  18. Bulkley, R.V. Feeding interaction between adult bass and their offspring. Trans. Am. Fish. Soc. 1970, 99, 732–738. [Google Scholar] [CrossRef]
  19. Fose, J.F. Interference in White Bass reproduction by two introduced predators in Baren River Lake, Kentucky. Master’s Theses and Specialist Projects, Western Kentucky University, Bowling Green, KY, USA, 2013. [Google Scholar]
  20. Driscoll, M.P.; Miranda, L.E. Diet ecology of Yellow Bass, Morone mississippiensis, in an oxbow of the Mississippi River. J. Freshw. Ecol. 1999, 14, 477–486. [Google Scholar] [CrossRef]
  21. Montgomery, M.L. Dietary overlap of native White Bass and introduced Yellow Bass in Barren River. Honors College Capstone Experience Thesis Project, Western Kentucky University, Bowling Green, KY, USA, 2015. [Google Scholar]
  22. Meerbeek, J.R. Distribution, Population Dynamics, and Interspecific Competition of Yellow Bass in Iowa’s Shallow Natural Lakes; Federal Aid in Sport Fish Restoration; Completion Report; Iowa Department of Natural Resources: Des Moines, IA, USA, 2022.
  23. Soupir, C.A.; Blackwell, B.B.; Brown, M.L. Relative precision among calcified structures for White Bass age and growth assessment. J. Freshw. Ecol. 1997, 12, 531–538. [Google Scholar] [CrossRef]
  24. Merritt, R.W.; Cummins, K.W. (Eds.) An Introduction to the Aquatic Insects of North America; Kendall Hunt Publishing Company: Dubuque, IA, USA, 1996. [Google Scholar]
  25. McCune, B.; Grace, J.B. Analysis of Ecological Communities; MjM Software Design: Gleneden Beach, OR, USA, 2002; 300p, ISBN 0-09721290-0-6. [Google Scholar]
  26. Hyslop, E.J. Stomach contents analysis—A review of methods and their application. J. Fish Biol. 1980, 17, 411–429. [Google Scholar] [CrossRef]
  27. Euzen, O. Food habits and diet composition of some fish of Kuwait. Kuwait Bull. Mar. Sci. 1987, 9, 65–85. [Google Scholar]
  28. Anderson, M.J. A new method for non-parametric multivariate analysis of variance. Austral Ecol. 2001, 26, 32–46. [Google Scholar]
  29. Legendre, P.; Gallagher, E.D. Ecologically meaningful transformations for ordination of species data. Oecologia 2001, 129, 271–280. [Google Scholar] [CrossRef] [PubMed]
  30. Bray, J.R.; Curtis, J.T. An ordination of the upland forest communities of southern Wisconsin. Ecol. Monogr. 1957, 27, 325–349. [Google Scholar] [CrossRef]
  31. Grimm, E.C. CONISS: A FORTRAN 77 program for stratigraphically constrained cluster analysis by the method of incremental sum of squares. Comput. Geosci. 1987, 13, 13–35. [Google Scholar] [CrossRef]
  32. Oksanen, J.; Simpson, G.; Blanchet, F.; Kindt, R.; Legendre, P.; Minchin, P.; O’Hara, R.; Solymos, P.; Stevens, M.; Szoecs, E.; et al. Vegan: Community Ecology Package, version 2.6-4; R Foundation for Statistical Computing: Vienna, Austria, 2022; Available online: https://CRAN.R-project.org/package=vegan (accessed on 2 February 2026).
  33. R Core Team. R: A Language and Environment for Statistical Computing; R Foundation for Statistical Computing: Vienna, Austria, 2024; Available online: https://www.R-project.org/ (accessed on 2 February 2026).
  34. Juggins, S. Rioja: Analysis of Quaternary Science Data, version 0.9-26; R Foundation for Statistical Computing: Vienna, Austria, 2020; Available online: https://CRAN.R-project.org/package=rioja (accessed on 2 February 2026).
  35. Buchholz, M.M. Ecological relationships associated with decreasing growth rate of Clear Lake Yellow Bass. Ph.D. Dissertation, Iowa State University, Ames, IA, USA, 1960. [Google Scholar]
  36. Ridenhour, R.L. Abundance, growth and food of young game fish in Clear Lake, Iowa, 1949 to 1957. Iowa State Coll. J. Sci. 1960, 35, 1–23. [Google Scholar]
  37. Kraus, R. Food habits of the Yellow Bass, Roccus mississippiensis, Clear Lake, Iowa, summer 1962. Iowa Acad. Sci. 1963, 70, 209–215. [Google Scholar]
  38. Welker, B.D. Summer food habits of Yellow Bass and Black Bullhead in Clear Lake. Iowa Acad. Sci. 1963, 69, 286–295. [Google Scholar]
  39. Kutkuhn, J.H. Food and feeding habits of some fishes in a dredge Iowa lake. Iowa Acad. Sci. 1955, 62, 576–588. [Google Scholar]
  40. Collier, J.E. Changes in fish populations and food habits of Yellow Bass in North Twin Lake, 1956–1958. Proc. Iowa Acad. Sci. 1959, 66, 518–522. [Google Scholar]
  41. Gkenas, C.; Magalhaes, M.F.; Cucherousset, J.; Orjuela, R.L.; Ribeiro, F. Dietary niche divergence between two invasive fish in Mediterranean streams. Knowl. Manag. Aquat. Ecosyst. 2019, 420, 24. [Google Scholar] [CrossRef]
  42. Cathcart, C.N.; Dunker, K.J.; Quinn, T.P.; Sepulveda, A.J.; von Hippel, F.A.; Wizik, A.; Young, D.B.; Westley, P.A. Trophic plasticity and the invasion of a renowned piscivore: A diet synthesis of Northern Pike (Esox lucius) from the native and introduced ranges in Alaska, U.S.A. Biol. Invasions 2019, 21, 1379–1392. [Google Scholar] [CrossRef]
  43. Mittlebach, G.G. Foraging efficiency and body size: A study of optimal diet and habitat use by Bluegills. Ecology 1981, 62, 1370–1386. [Google Scholar] [CrossRef]
  44. Diana, J.S. Growth, maturation, and production of Northern Pike in three Michigan lakes. Trans. Am. Fish. Soc. 1983, 112, 38–46. [Google Scholar] [CrossRef]
  45. Gillooly, J.F.; Baylis, J.R. Reproductive success and the energetic cost of parental care in male Smallmouth Bass. J. Fish Biol. 1999, 54, 573–584. [Google Scholar] [CrossRef]
  46. Cooke, S.J.; Philipp, D.P.; Weatherhead, P.J. Parental care patterns and energetics of Smallmouth Bass (Micropterus dolomieu) and Largemouth Bass (Micropterus salmoides) monitored with activity transmitters. Can. J. Zool. 2002, 80, 756–770. [Google Scholar] [CrossRef]
  47. Mittelbach, G.G. Competition among refuging sunfishes and effects of fish density on littoral zone invertebrates. Ecology 1988, 69, 614–623. [Google Scholar] [CrossRef]
  48. Post, D.M.; Pace, M.L.; Hairston, N.G., Jr. Ecosystem size determines food-chain length in lakes. Nature 2000, 405, 1047–1049. [Google Scholar] [CrossRef]
  49. Takimoto, G.; Post, D.M. Environmental determinants of food-chain length: A meta-analysis. Ecol. Res. 2013, 28, 675–681. [Google Scholar] [CrossRef]
  50. Eloranta, A.P.; Kahilainen, K.K.; Amundsen, P.; Knudsen, R.; Harrod, C.; Jones, R.I. Lake size and fish diversity determine resource use and trophic position of a top predator in high-altitude lakes. Ecol. Evol. 2015, 5, 1664–1675. [Google Scholar] [CrossRef]
  51. Gardner, M.B. Effects of turbidity on feeding rates and selectivity of Bluegills. Trans. Am. Fish. Soc. 1981, 110, 446–450. [Google Scholar] [CrossRef]
  52. Shoup, D.E.; Lane, W.D. Effects of turbidity on prey selection and foraging return of adult Largemouth Bass in reservoirs. North Am. J. Fish. Manag. 2015, 35, 913–924. [Google Scholar] [CrossRef]
  53. Hayward, R.S.; Margraf, F.J. Eutrophication effects on prey size and food available to Yellow Perch in Lake Erie. Trans. Am. Fish. Soc. 1987, 116, 210–223. [Google Scholar] [CrossRef]
  54. Vander Zanden, M.J.; Vadeboncoeur, Y.; Chandra, S. Fish reliance on littoral-benthic resources and the distribution of primary production in lakes. Ecosystems 2011, 14, 894–903. [Google Scholar] [CrossRef]
  55. Warfe, D.M.; Jardine, T.D.; Pettit, N.E.; Hamilton, S.K.; Pusey, B.J.; Bunn, S.E.; Davies, P.M.; Douglas, M.M. Productivity, disturbance and ecosystem size have no influence on food chain length in seasonally connected rivers. PLoS ONE 2013, 8, e66240. [Google Scholar] [CrossRef] [PubMed]
  56. Knight, R.L.; Margraf, F.J.; Carline, R.F. Piscivory by Walleyes and Yellow Perch in Western Lake Erie. Trans. Am. Fish. Soc. 1984, 113, 677–693. [Google Scholar] [CrossRef]
  57. Parrish, D.L.; Margraf, F.J. Spatial and temporal patterns of food use by White Perch and Yellow Perch in Lake Erie. J. Freshw. Ecol. 1994, 9, 29–35. [Google Scholar] [CrossRef]
  58. Herbst, S.J.; Roth, B.M.; Hayes, D.B.; Stockwell, J.D. Walleye foraging ecology in an interconnected chain of lakes influenced by nonnative species. Trans. Am. Fish. Soc. 2016, 145, 319–333. [Google Scholar] [CrossRef]
  59. Mittelbach, G.G.; Persson, L. The ontogeny of piscivory and its ecological consequences. Can. J. Fish. Aquat. Sci. 1998, 55, 1454–1465. [Google Scholar] [CrossRef]
  60. Madenjian, C.P.; Knight, R.L.; Bur, M.T.; Forney, J.L. Reduction in recruitment of White Bass in Lake Erie after invasion of White Perch. Trans. Am. Fish. Soc. 2000, 129, 1340–1353. [Google Scholar] [CrossRef]
  61. Welch, C.A. Seasonal and age-based aspects of diet of the introduced Redside Shiner (Richardsonius balteatus) in Ross Lake, Washington. Master’s Thesis, Faculty of Western Washington University, Bellingham, WA, USA, 2012. Available online: https://mabel.wwu.edu/do/6721eae9-bf69-4bab-b74c-0994f95dac9e (accessed on 2 February 2026).
  62. Frawley, S.E.; Corsi, M.P.; Dux, A.M.; Hardy, R.S.; Quist, M.C. Food habits of nonnative Walleyes in Lake Pend Oreille, Idaho. North Am. J. Fish. Manag. 2024, 44, 1294–1324. [Google Scholar] [CrossRef]
Figure 1. Mirrored bar chart contrasting the mean percent numerical abundance (% Number; left) and mean percent biomass (% Biomass; right) of fish (red), benthic invertebrates (green), and zooplankton (blue) found in 1,300 Yellow Bass stomachs at six natural lakes in Iowa during the open-water season (April–November) between 2018 and 2020.
Fishes 11 00124 g001
Figure 2. Non-metric Multidimensional Scaling (NMDS) ordination of diet composition (numerical abundance) comparing lake centroids. Lakes are categorized by Yellow Bass population history (new = blue; old = red) and lake surface area (small = circle; large = square).
Fishes 11 00124 g002
Figure 3. Non-metric Multidimensional Scaling (NMDS) ordination of diet composition (numerical abundance) and spatiotemporal trajectories of Yellow Bass foraging ecology collected from six Iowa natural lakes 2018–2020. The length of the trajectory indicates the magnitude of dietary turnover.
Fishes 11 00124 g003
Figure 4. Stacked area plot illustrating the contribution of zooplankton (blue), benthic invertebrates (green), and fish (red) to total dietary biomass across Yellow Bass total length (mm). Vertical dashed lines at 114 mm and 252 mm indicate significant breakpoints identified by Constrained Incremental Sum of Squares (CONISS) cluster analysis (p < 0.05).
Fishes 11 00124 g004
Table 1. Size (ha), maximum and mean depth (m), watershed-to-area ratio (WS:Area), mean Secchi (m), mean chlorophyll-a (CHL-a; µg/L), mean total phosphorous (TP; mg/L), morphoedaphic index (MEI) and year of Yellow Bass detection (determined via agency surveys) in six natural lakes located in four counties in northcentral and northwestern Iowa. Water quality parameters were collected by Iowa Department of Natural Resources (DNR) Fisheries staff, Iowa DNR Lake Restoration Program, Cooperative Lakes Area Monitoring Program, and the Iowa DNR Water Quality Monitoring and Assessment section during the open water period from 1999 to 2022. NA = not available.
LakeCountyhaMaximum Depth (m)Mean Depth (m)WS:AreaMean Secchi (m)Mean CHL-a (µg/L) Mean TP (mg/L)MEIYear
Detected
CenterDickinson895.53.72.21.160930.92014
CorneliaWright996.32.92.00.624662.22006
Five IslandPalo Alto3947.61.78.00.6451004.42012
Lost IslandPalo Alto4704.83.44.00.925741.62008
Pleasant * Dickinson31<2.0<1.5NA0.3251327.32012
Silver Dickinson4213.22.314.20.8721602.72013
* Depth data not available; depth approximated.
Table 2. Total number (N) of Yellow Bass, mean total length (TL, mm), and TL range (minimum and maximum) collected for diet analysis from six natural lake systems in Iowa at bi-monthly time intervals during 2018, 2019, and 2020. The number of fish with empty stomachs for each sample period is provided in parentheses.
CenterCorneliaFive IslandLost IslandPleasantSilver Total N
2018
April–May2833(29)045(15)17(9)0123(53)
June–July732027(2)22(4)58146(6)
August–Sept1544014(1)49(13)18140(14)
October–Nov27(5)26026(1)15(5)34128(11)
Mean TL193167-201209167185
Range TL90–268104–204-105–27968–322104–28268–322
2019
April–May19151515(1)15(11)17(1)96(13)
June–July21(2)15(3)2020(1)21(17)17114(23)
August–Sept20(1)1515(2)15(1)18(5)1295(9)
October–Nov2020(3)20(1)19(4)20(8)3102(16)
Mean TL209178211218229227212
Range TL156–275124–222165–244101–28572–31486–30872–314
2020
April–May15(1)1516(1)15(2)8(6)12(2)81(12)
June–July1915(1)15(2)1516(4)1595(7)
August–Sept20(4)15(5)1514(1)15(5)15(11)94(26)
October–Nov15(2)14(2)15(3)151512(3)86(10)
Mean TL229191210243206279226
Range TL131–273155–239143–265169–306102–310255–310102–310
Total N2262591312402312131300
Table 3. Results of Permutational Analysis of Variance (PERMANOVA) testing the effects of Yellow Bass population history (new and old) and lake size (small and large) to spatiotemporal factors (lake, season, year) on Yellow Bass diet composition collected from six natural lakes in Iowa during open water seasons between 2018 and 2020.
Source of VariationdfSum of SquaresMean SquareF-ModelR2p-Value
Lake History112.1812.1844.530.037<0.001
Lake Size13.743.7413.660.011<0.001
Lake History × Size117.9917.9965.770.054<0.001
Residuals1095299.570.270.898
Total1098333.481
Table 4. Results of Permutational Analysis of Variance (PERMANOVA) testing the effects of lake, season, year, and their interactions on the diet composition of Yellow Bass collected from six natural lakes in Iowa during open water seasons between 2018 and 2020.
Source of
Variation
dfSum of SquaresMean SquareF-ModelR2p-Value
Lake542.138.4344.810.126<0.001
Season311.83.9320.910.035<0.001
Year14.664.6624.760.014<0.001
Lake × Season1535.682.3812.650.107<0.001
Lake × Year512.852.5713.670.039<0.001
Season × Year310.883.6319.280.033<0.001
Lake × Season × Year1517.841.196.330.054<0.001
Residuals1051197.640.190.593
Total1098333.481
Disclaimer/Publisher’s Note: The statements, opinions and data contained in all publications are solely those of the individual author(s) and contributor(s) and not of MDPI and/or the editor(s). MDPI and/or the editor(s) disclaim responsibility for any injury to people or property resulting from any ideas, methods, instructions or products referred to in the content.