Article

Morphological Classification of the Sagittal Otoliths of Two Species of Sciaenidae Based on the Landmark Point Method

1
School of Fishery, Zhejiang Ocean University, Zhoushan 316022, China
2
Marine and Fishery Institute, Zhejiang Ocean University, Zhoushan 316021, China
*
Authors to whom correspondence should be addressed.
Fishes 2026, 11(1), 36; https://doi.org/10.3390/fishes11010036
Submission received: 26 November 2025 / Revised: 1 January 2026 / Accepted: 5 January 2026 / Published: 8 January 2026
(This article belongs to the Special Issue Application of Otoliths in Fish Ecology and Fisheries)

Abstract

Larimichthys crocea and Larimichthys polyactis, two commercially and ecologically important sciaenid species, are often morphologically confused (especially at the juvenile stage or for incomplete specimens), leading to limitations in traditional morphological taxonomic methods for accurate identification. Otoliths, as stable hard tissues with species-specific morphological characteristics, serve as an ideal tool for species discrimination. To investigate the efficacy of landmark-based methods in extracting morphological information from different surfaces of sagittal otoliths, this study analyzed six surfaces (medial, lateral, dorsal, ventral, anterior, and posterior) of left otoliths from two sciaenid species using geometric morphometrics. We collected 487 sagittal otolith samples from sciaenids in the Zhoushan Islands of the East China Sea (Larimichthys polyactis: 277 specimens; Larimichthys crocea: 210 specimens). Landmark coordinates were extracted using tps-series software, and morphological differences were quantified through principal component analysis (PCA), discriminant analysis, and thin-plate spline visualizations. Key results include: relative warp PCA showed cumulative contributions of PC1 + PC2 at 52.48% (medial), 52.87% (lateral), 71.29% (dorsal), 63.7% (ventral), 64.8% (anterior), and 67.85% (posterior), effectively discriminating species with Type I/III landmarks demonstrating highest contributions; centroid size analysis revealed significantly larger values in L. crocea across all surfaces (most pronounced on medial surface: F = 183.450, p < 0.05); discriminant analysis achieved peak cross-validated success on the medial surface (98.6% for L. polyactis, 95.2% for L. crocea), with other surfaces ranging from 79.6–83.6%. This confirms that multi-surface landmark analysis effectively captures morphological divergence, with the medial surface providing optimal species discrimination. The established method provides a reliable supplementary tool for the taxonomy of L. crocea and L. polyactis, and offers scientific support for fisheries resource survey, population dynamic monitoring, and conservation of these sciaenid species.
Key Contribution: This study develops a novel six-surface landmark framework for otolith morphology, overcoming single-plane limitations to provide discrimination of closely related fish species through integrated multi-planar analysis.

1. Introduction

Sciaenid fishes constitute vital economic resources in China, with extensive research encompassing environmental science [1], biological characteristics [2], ecology and distribution [3], genetics and breeding [4], as well as food science and nutrition [5]. China hosts a rich sciaenid diversity, notably represented by Larimichthys crocea (Richardson, 1846) (large yellow croaker) and Larimichthys polyactis (Bleeker, 1877) (small yellow croaker), which historically ranked among China’s “Four Major Marine Products” alongside hairtail and cuttlefish [6]. L. crocea primarily inhabits the southern Yellow Sea, East China Sea, and South China Sea [7], while L. polyactis occurs in the Bohai, Yellow, and East China Seas [8]. However, traditional morphological taxonomic methods for these two species face notable limitations: as congeneric species, they share overlapping morphological traits (e.g., body shape, scale count, and fin ray number), with juvenile individuals or incomplete specimens often leading to misidentification [9]. This “cryptic-like” taxonomic challenge—where morphological similarity obscures species boundaries—undermines the accuracy of resource surveys and population assessments, highlighting an urgent need for reliable, complementary species identification tools.
In this context, fish otoliths—calcium carbonate structures in the inner ear—serve as excellent taxonomic markers. Their species-specific shapes, which remain stable despite environmental influences, archive life-history information and provide a powerful basis for discrimination [10]. Traditional morphometric approaches to otolith analysis, however, can be subjective. To overcome this limitation, landmark-based geometric morphometrics has emerged as a robust method, quantifying biological form by digitizing homologous anatomical points for multivariate analysis of shape [11]. This objective framework has proven highly effective in Sciaenidae research, achieving exceptional discrimination between Argyrosomus species in the Beibu Gulf [12] and reliably separating morphologically similar species like Larimichthys polyactis and Collichthys lucidus [13]. For L. crocea and L. polyactis, otoliths offer a unique advantage; as hard tissues, their shape is minimally affected by individual growth stage or sample integrity, making them suitable for identifying both juvenile and damaged specimens that confound traditional methods.
While current research on L. crocea and L. polyactis has extensively covered population genetics [14,15], stock assessment [16,17], ecology [18,19], and aquaculture [20,21], otolith-based taxonomic studies are comparatively limited. Furthermore, existing applications of landmark methods in related studies often analyze only a single otolith surface [22]. This single-plane approach potentially overlooks critical morphological information from other aspects, as the three-dimensional complexity of an otolith may not be fully captured in one view.
To address this gap, our study pioneers a comprehensive application of landmark-based geometric morphometrics across all six surfaces (medial, lateral, dorsal, ventral, anterior, and posterior) of the sagittal otolith. We systematically selected biologically significant landmarks on each plane to capture the complete three-dimensional morphology, thereby mitigating the sampling bias inherent in single-plane analyses. The primary objectives were (1) to determine whether consistent species-specific shape differences exist between L. crocea and L. polyactis across multiple otolith surfaces; (2) to compare the effectiveness of different surfaces for discrimination and identify the optimal diagnostic planes; and (3) to establish a robust, multi-dimensional otolith-based classification system. This novel methodology aims to address the “cryptic-like” taxonomic challenge of L. crocea and L. polyactis, providing a more accurate and reliable tool for sciaenid taxonomy and supporting future conservation and sustainable resource utilization efforts.

2. Materials and Methods

2.1. Sample Collection

All fish specimens were collected in batches from the waters of the Zhoushan Archipelago, East China Sea, between November and December 2024, yielding a total of 487 individuals from two sciaenid species (Table 1). After thawing in the basic biology laboratory, specimens underwent biological measurements including body length (precision: 1 mm), body weight (precision: 1 g), and sex determination. Sagittal otoliths were extracted bilaterally and preserved in 75% ethanol-filled centrifuge tubes for subsequent analysis.

2.2. Otolith Photography and Image Processing

All analyses utilized left sagittal otoliths, with maximum length and height measured to a precision of ±0.02 mm using digital calipers. High-resolution images of medial, lateral, ventral, dorsal, anterior, and posterior surfaces were captured using a SuperEyes B013 digital microscope (Shenzhen Supereyes Technology Co., Ltd., Shenzhen, China). To facilitate subsequent landmark analysis, images underwent standardized preprocessing in Photoshop CS 6.0, including artifact removal and parameter optimization.

2.3. Otolith Morphology Landmarks

In biological morphometrics, landmarks are formally categorized into three types [23]:
  • Type I: Anatomical junctions at structural boundaries.
  • Type II: Maxima of curvature (e.g., apices of depressions/protrusions).
  • Type III: Extremum points defining morphological limits.
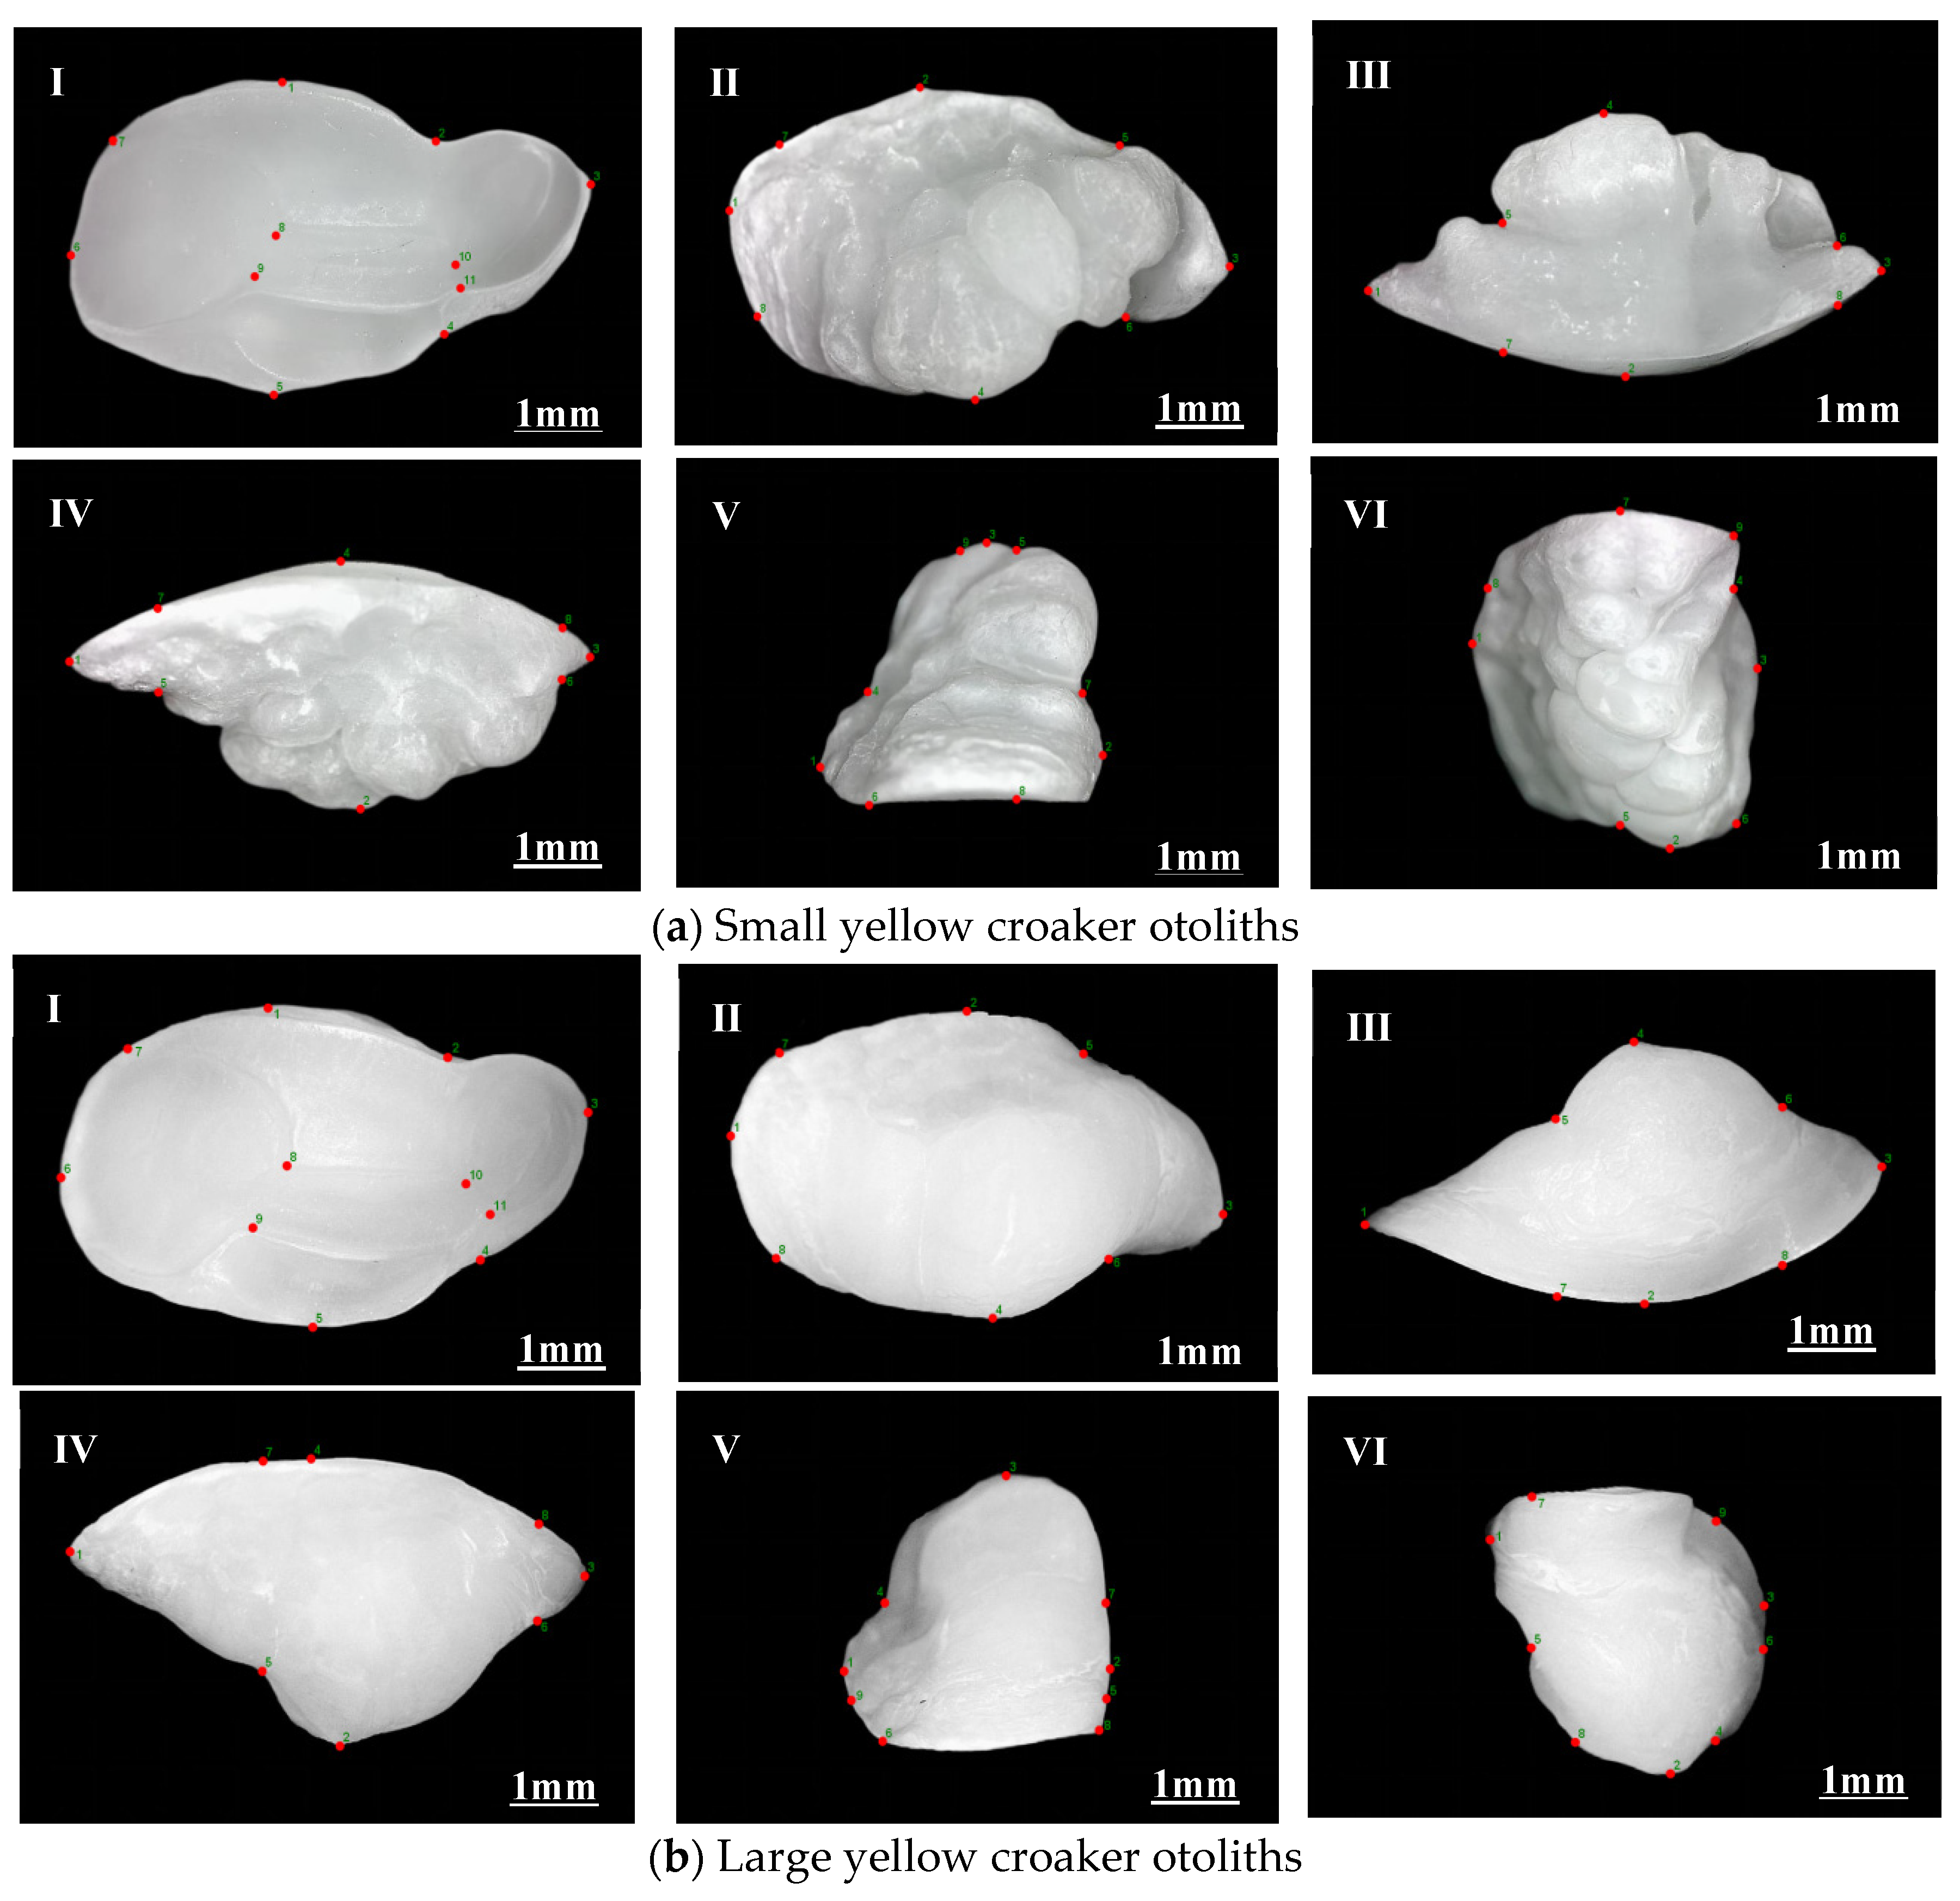
Referencing established methodologies [24,25] and otolith-specific morphology, we digitized landmarks on 2D otolith surface images via tpsDig 2 software (Figure 1). For Type II landmarks, we ensured accurate 2D localization by: ① Using tpsDig’s magnification function to clarify the apex/nadir of target depressions/protrusions; ② Calibrating positions against adjacent, unambiguous Type I/III landmarks (e.g., aligning medial landmark 2 with Type III landmark 3 to fix the dorsal-posterior depressed point). Consistent landmark sequences and counts were maintained across specimens. Table 2 details each landmark’s Type I/II/III classification, generating standardized coordinate datasets.

2.4. Data Analysis

The analysis followed three key steps: first, verifying the landmark points with tpsSmall 1.36; second, using tpsRelw 1.75 to perform Generalized Procrustes Analysis (GPA), calculate the mean otolith shape, and perform a relative warps analysis; and finally, conducting principal component and discriminant analyses on the resulting scores. The otolith morphology was visualized by thin-plate spline analysis with tpsRegr 1.45 and the centroid size values were calculated and log-transformed [26]. The normality of the log-transformed centroid size was confirmed by a Kolmogorov–Smirnov (K-S) test, and the homogeneity of variances was verified by Levene’s test. A one-way ANOVA was then performed to compare interspecies differences, along with box-and-line plots [25]. To account for the effect of body size (allometry) on shape, a Procrustes ANOVA was conducted using the R 4.5.2 software, with Species as a factor and Body Length as a covariate. All analyses were done with SPSS 26.0, Excel 2021, and R 4.5.2 software.

3. Results

3.1. Morphological Landmark Analysis of Sagittal Otoliths

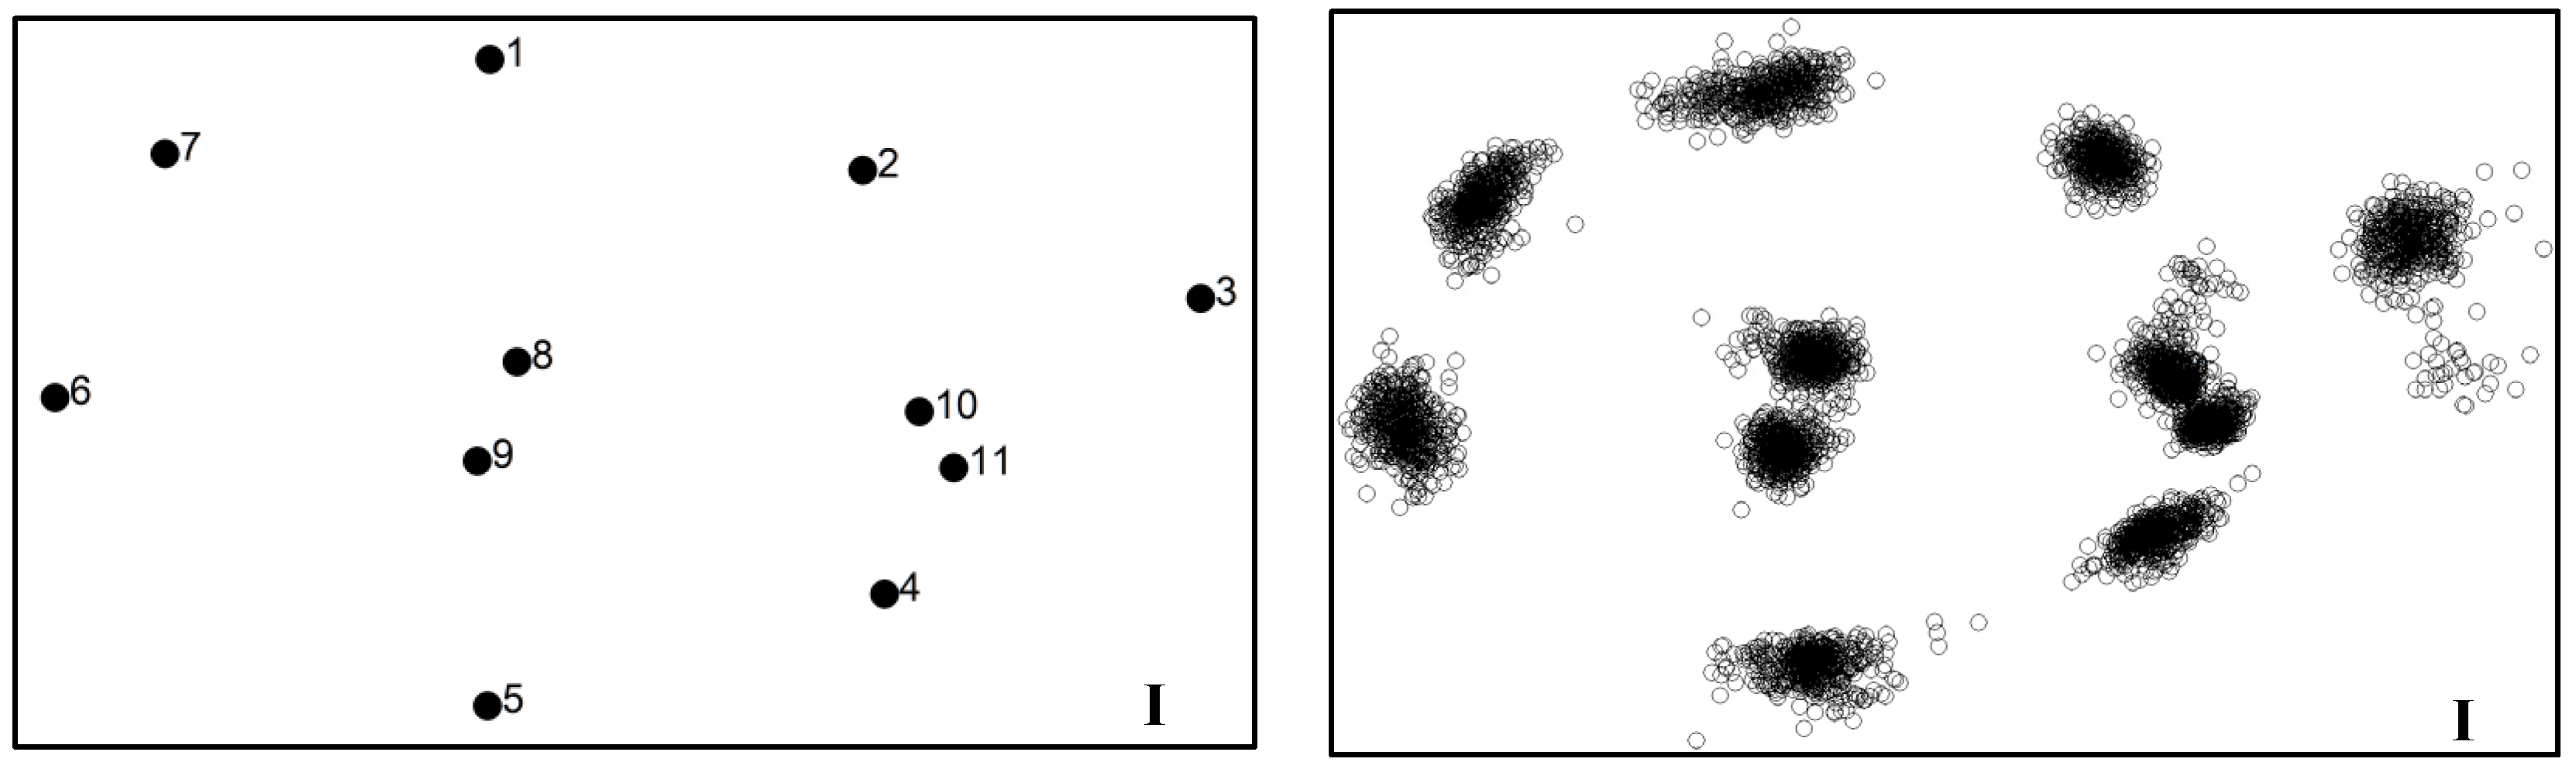
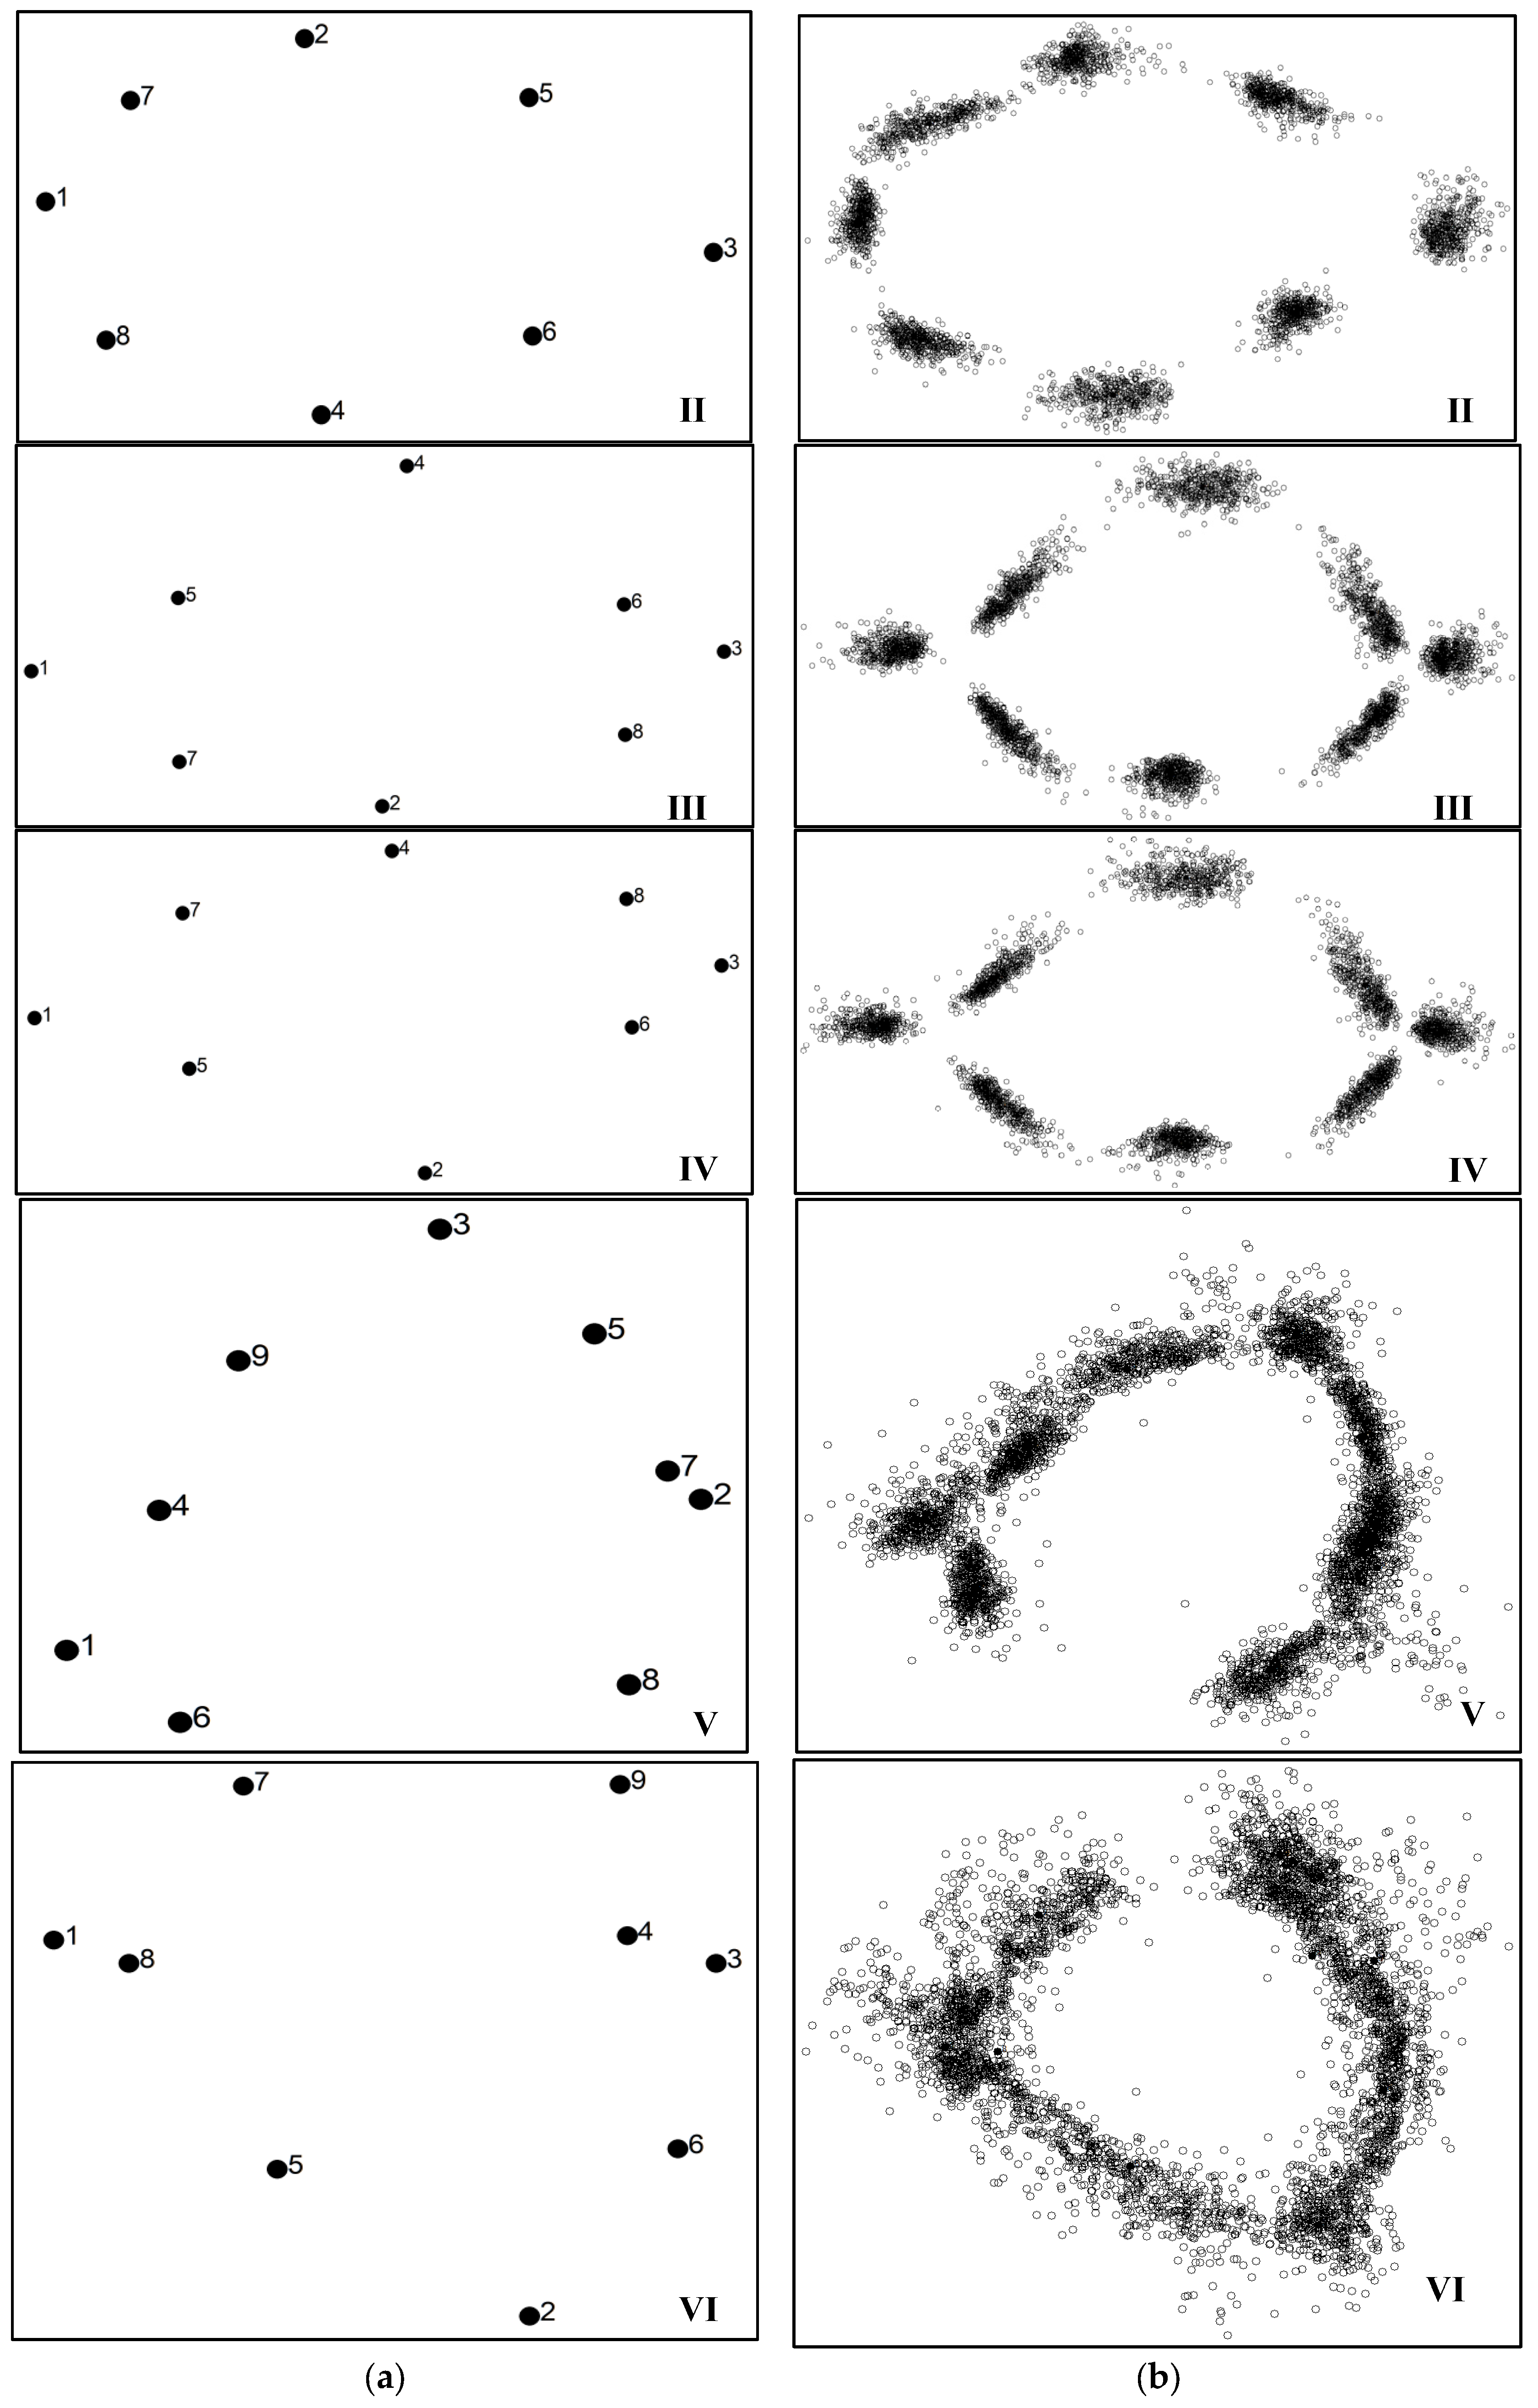
Least squares regression analysis of sagittal otolith landmark data across six surfaces revealed a regression coefficient of 0.99 between tangent space distances (y-axis) and Procrustes distances (x-axis), confirming the validity of selected landmarks. Using tpsRelw 1.75 to analyze landmark datasets from two sciaenid species, we computed the mean shapes of otolith landmarks for distinct surfaces (Figure 2a). Superimposition of all landmarks from 487 sagittal otolith specimens across both species (Figure 2b) clearly demonstrates the dispersion patterns of individual landmark sets.
Relative Warp Analysis revealed significant variations in landmark contributions to shape deformation across different otolith surfaces (Table 3). The medial surface (11 landmarks) was predominantly influenced by landmark 11 (42.595%), followed by landmark 10 (33.838%). On the lateral surface (8 landmarks), landmarks 7 and 1 were the primary contributors (26.748% and 26.259%, respectively). For the dorsal surface (8 landmarks), landmark 6 showed the highest contribution (24.992%), with landmark 8 secondary (16.927%). The ventral surface (8 landmarks) was mainly shaped by landmark 11 (22.760%) and landmark 10 (20.026%). The most pronounced dominance was observed on the anterior surface (9 landmarks), where landmarks 7 and 2 collectively accounted for 90.571% of the deformation influence. On the posterior surface (9 landmarks), landmark 8 contributed the most (33.599%), followed by landmark 4 (19.858%).
The dispersion of landmarks in Figure 2b may stem from minor inconsistencies in image orientation or landmark placement during digitization, which could introduce geometric noise into the dataset. However, all landmarks were defined based on strict homologous structures. Furthermore, subsequent Relative Warp and Principal Component Analyses incorporated Procrustes superimposition, which statistically accounts for such positional variation, thereby ensuring the robustness of the morphometric results.

3.2. Visualization and Analysis of Sagittal Otolith Morphology

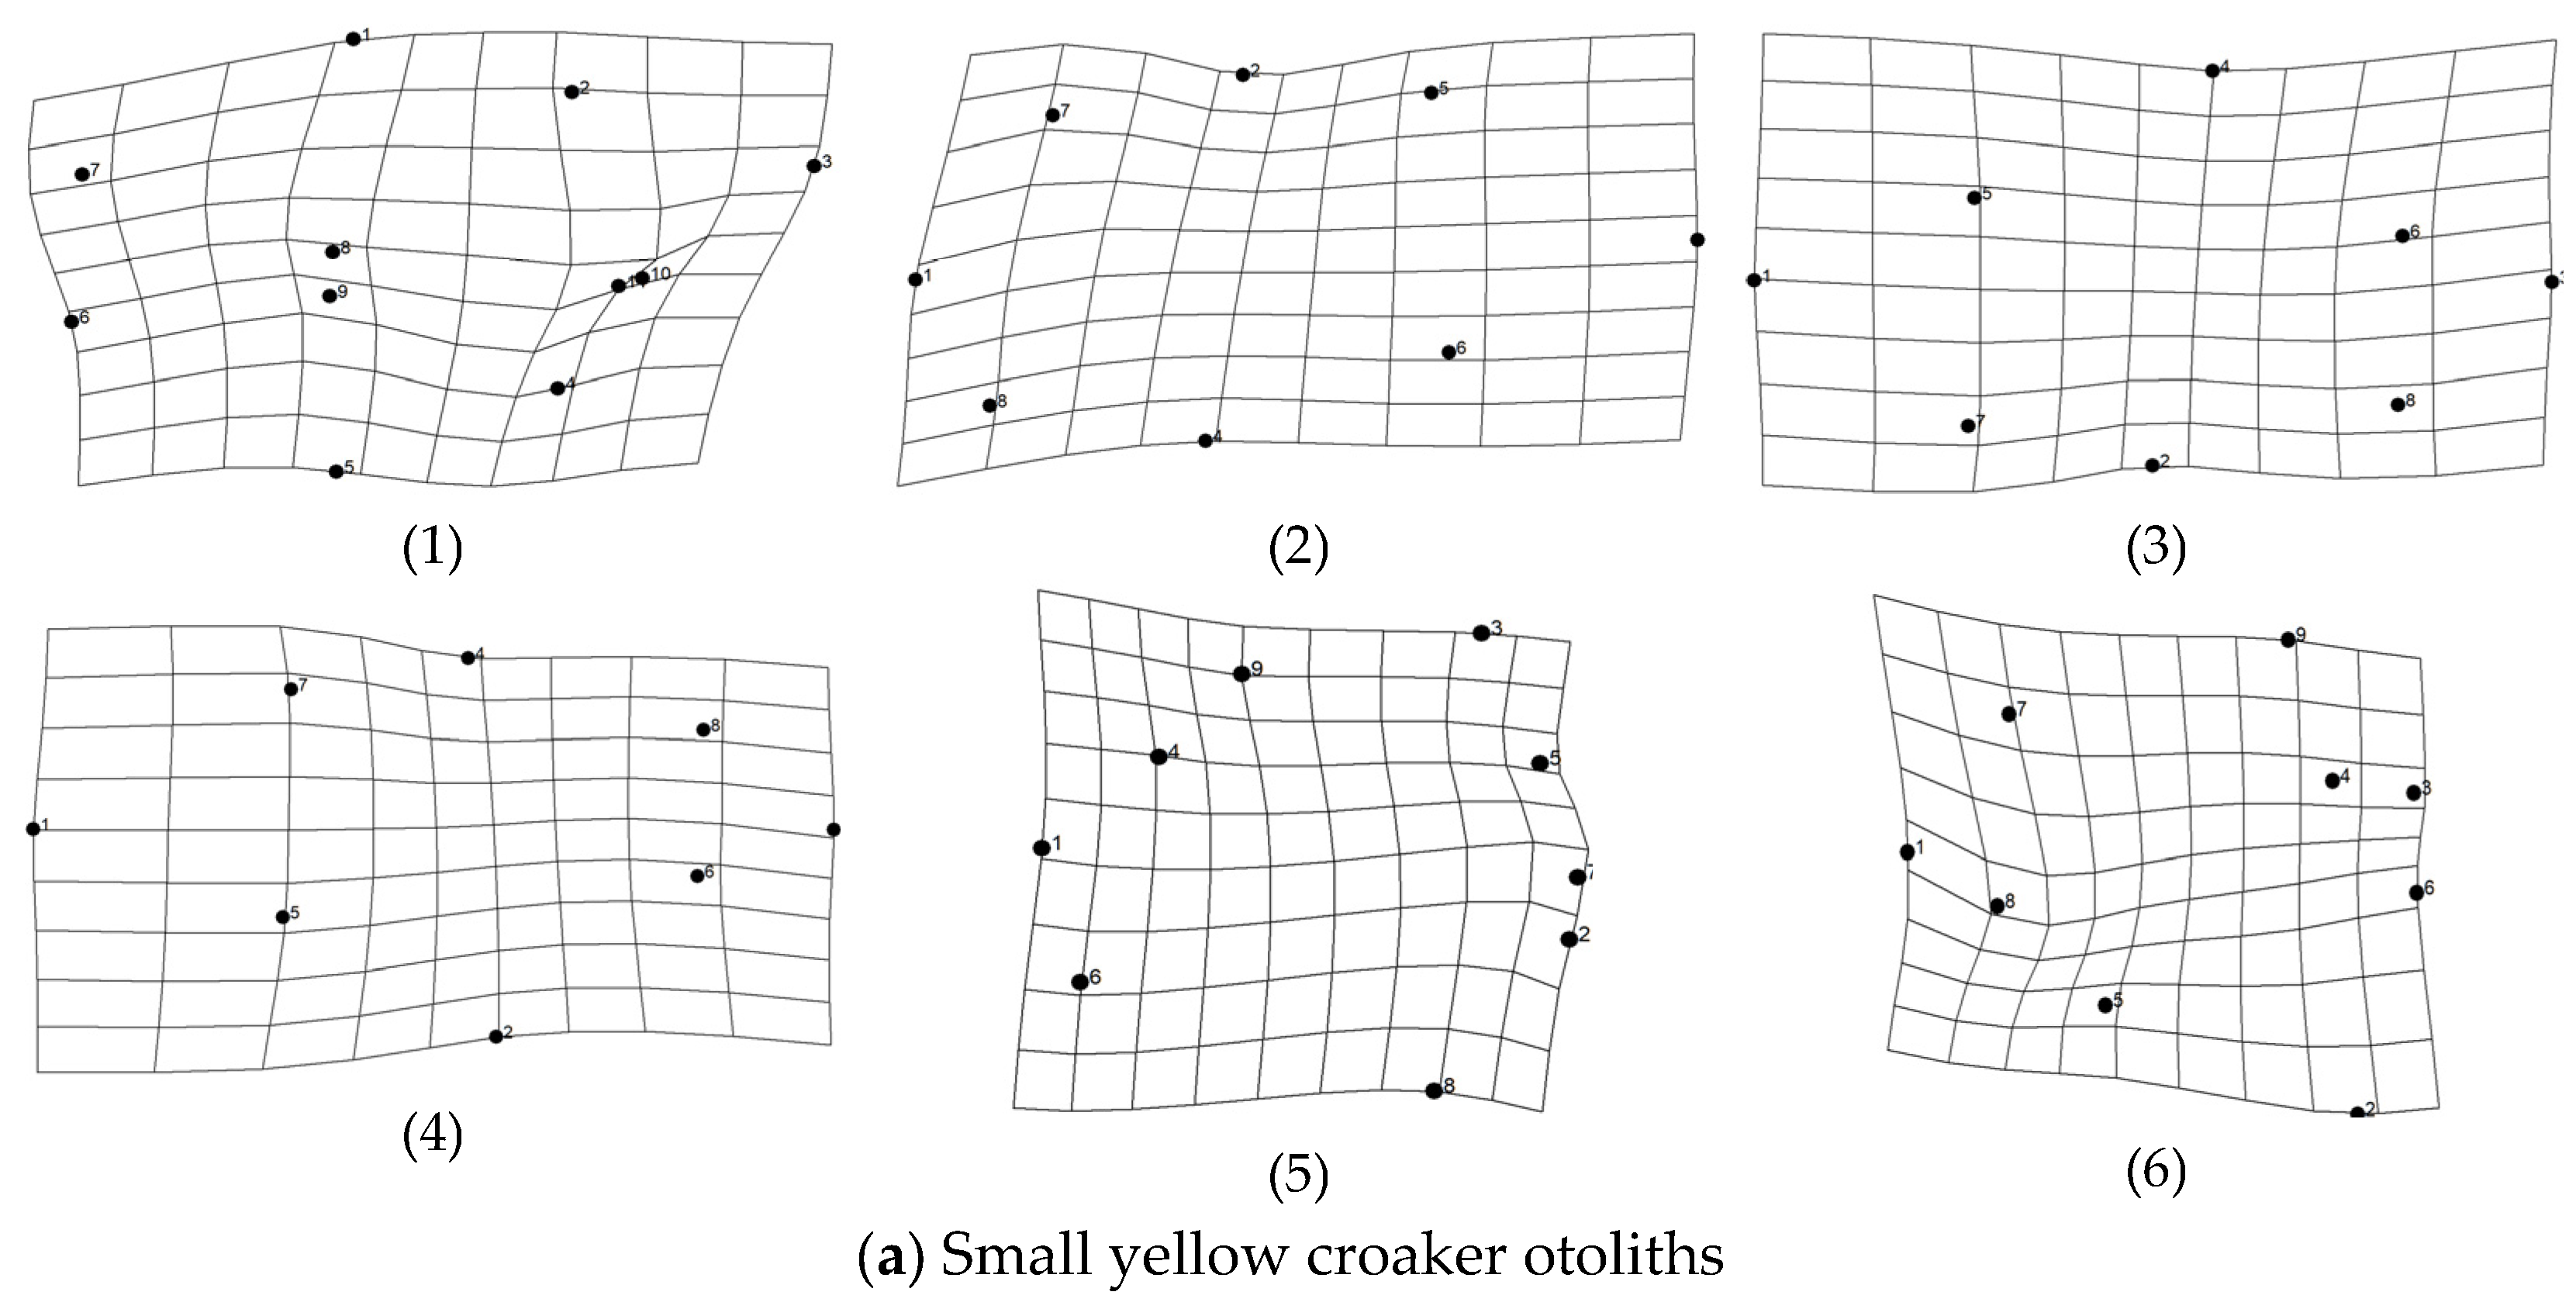
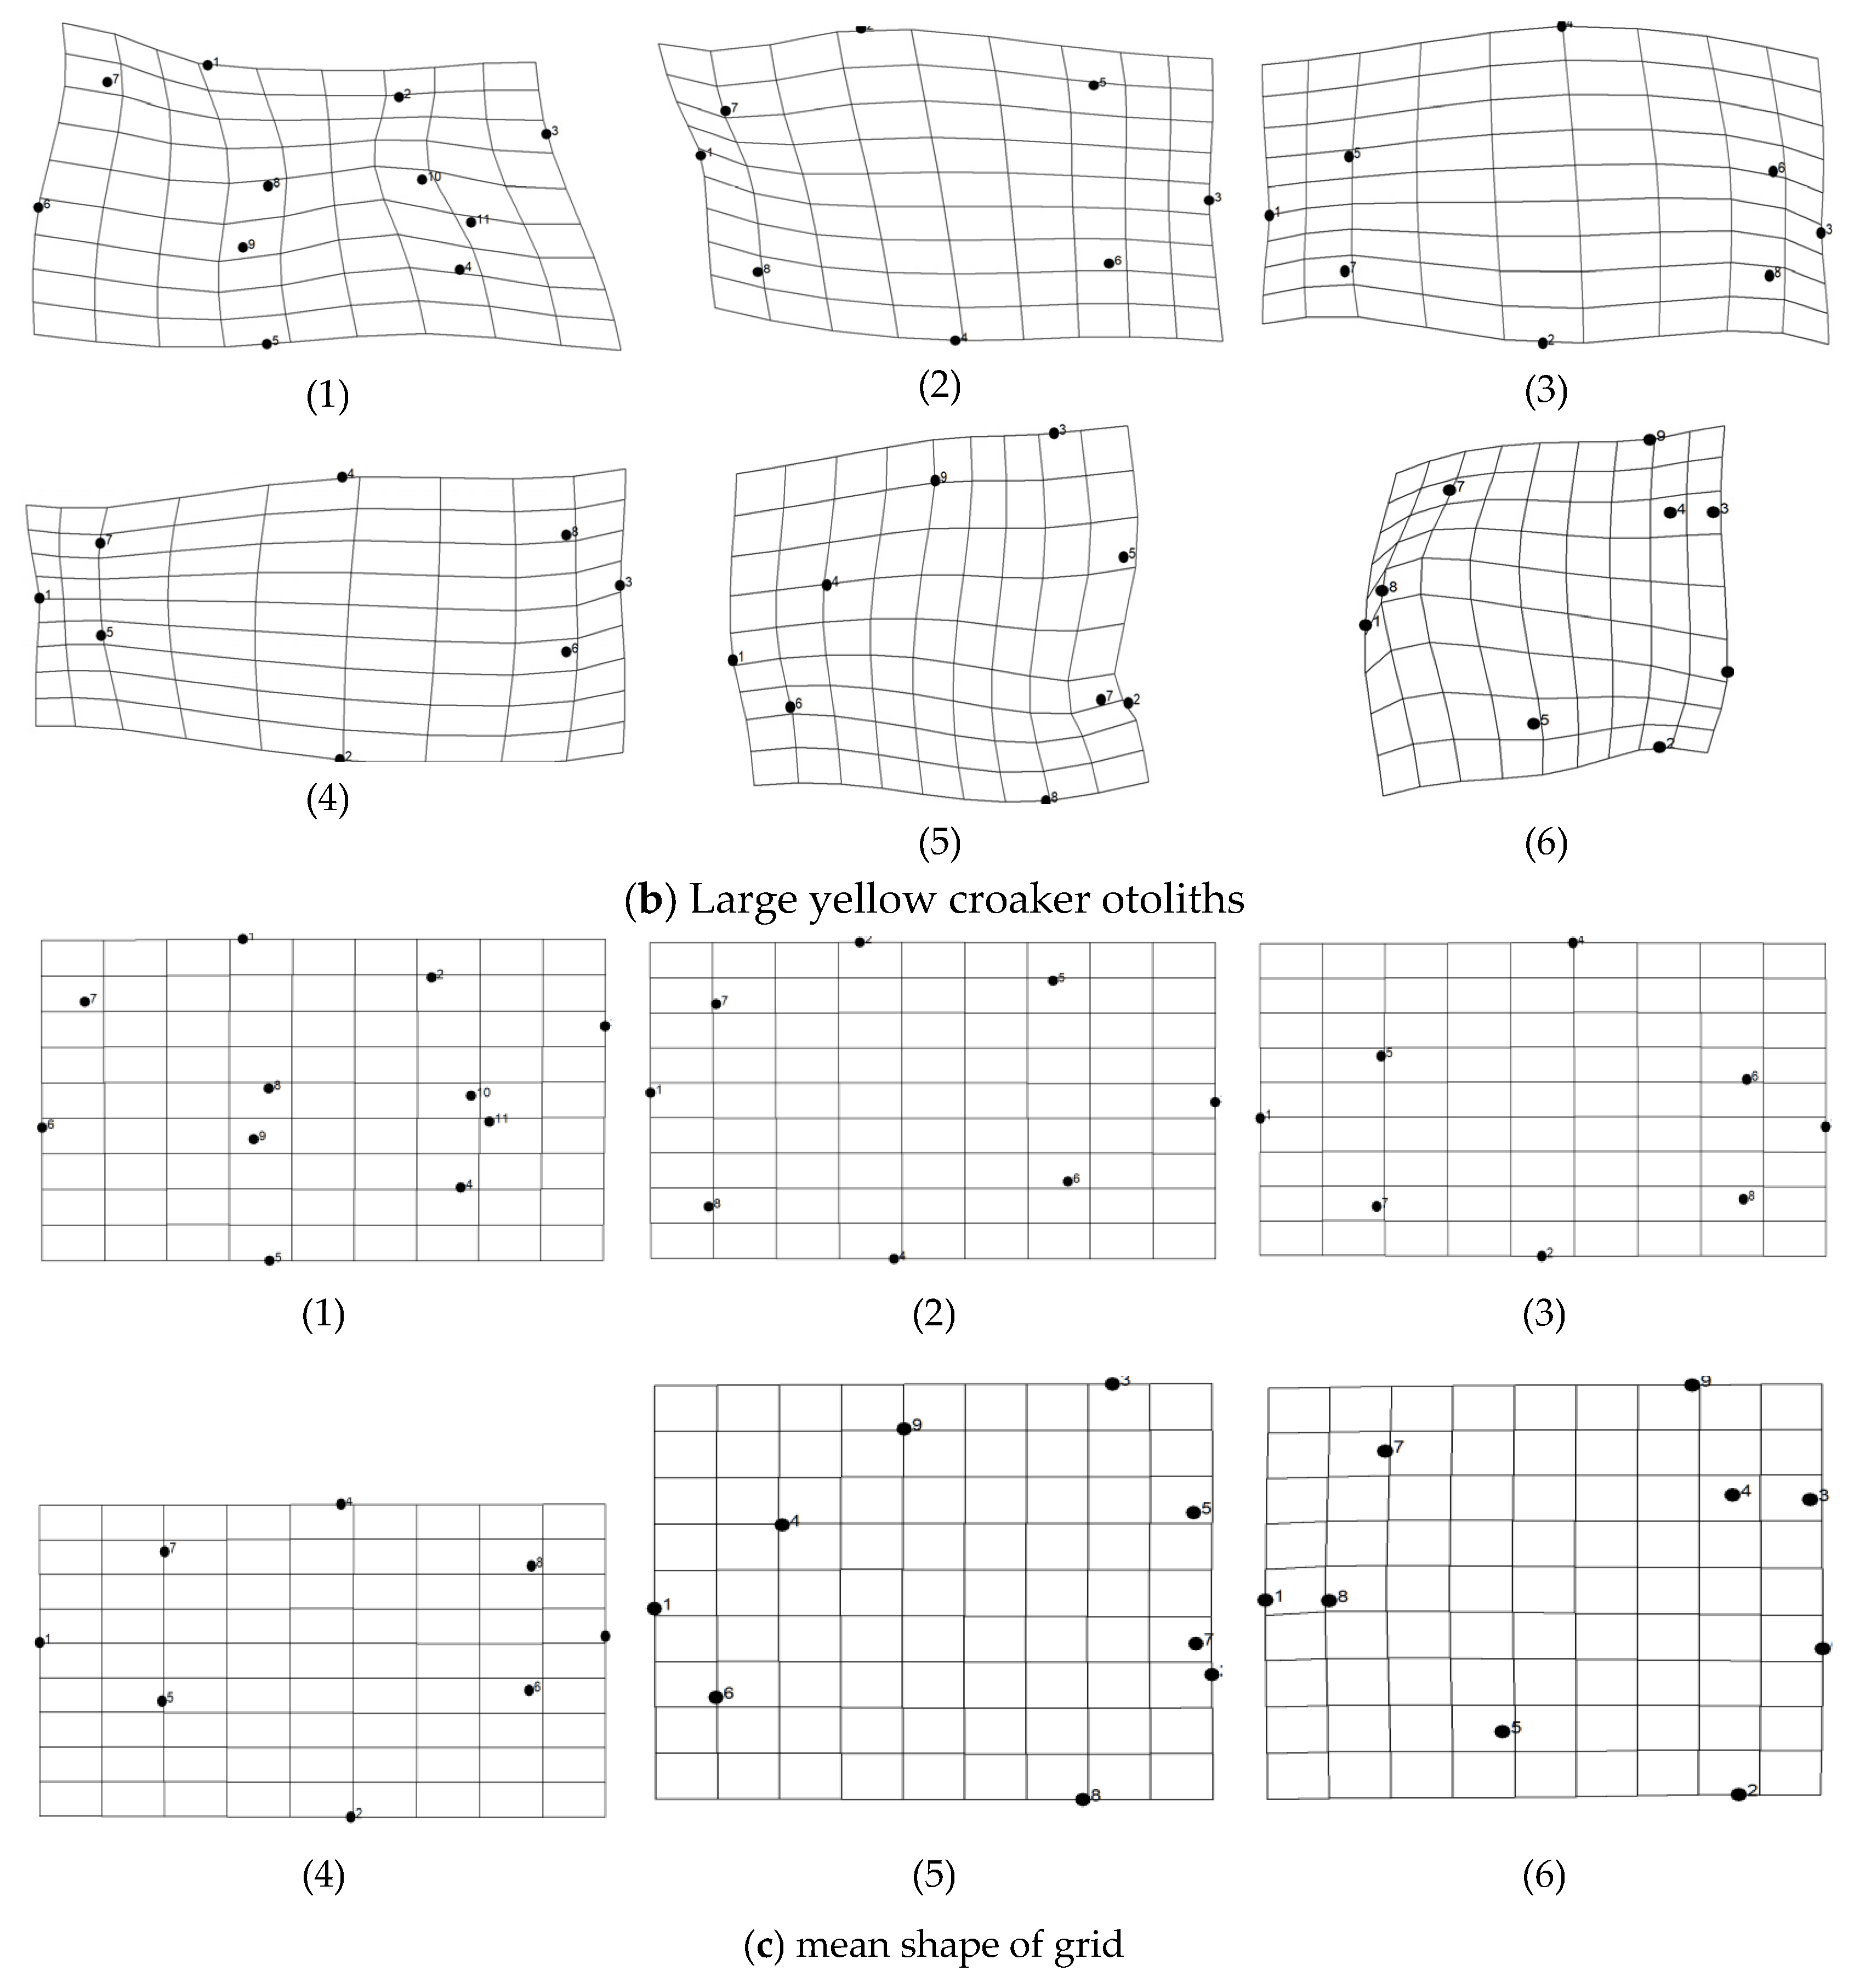
Visualization analysis via tpsRegr 1.45 software was performed on morphological landmarks of sagittal otoliths from two sciaenid species, with results magnified 3× to clarify landmark variation trends and magnitudes in deformation grids (Figure 3).
For the medial surface, (a1) shows gentle grid distortion with slightly stretched central lines (corresponding to its shallower sulcus acousticus), while (b1) exhibits sharp central grid convergence (reflecting a broader medial surface and deeper sulcus—key species-specific traits).
On the lateral surface, (a2) has relaxed posterior-edge grid contours, whereas (b2) displays distinct warping here (indicating a more prominent posterior lobe).
For the anterior surface, (a5) shows mild grid stretching, while (b5) has concentrated grid deformation at the margin (matching the anterior shape divergence quantified later).
These grids translate abstract landmark coordinate variations into intuitively interpretable shape differences, making subtle interspecific traits (e.g., sulcus depth, margin curvature) tangible—traits that are often indistinct in raw otolith images. This visualization validates that our selected landmarks capture biologically meaningful morphological variation, providing a visual and biological basis for the subsequent quantitative analyses (e.g., Relative Warp Analysis) of otolith shape divergence.

3.3. Analysis of Centroid Size of Otolith Morphology

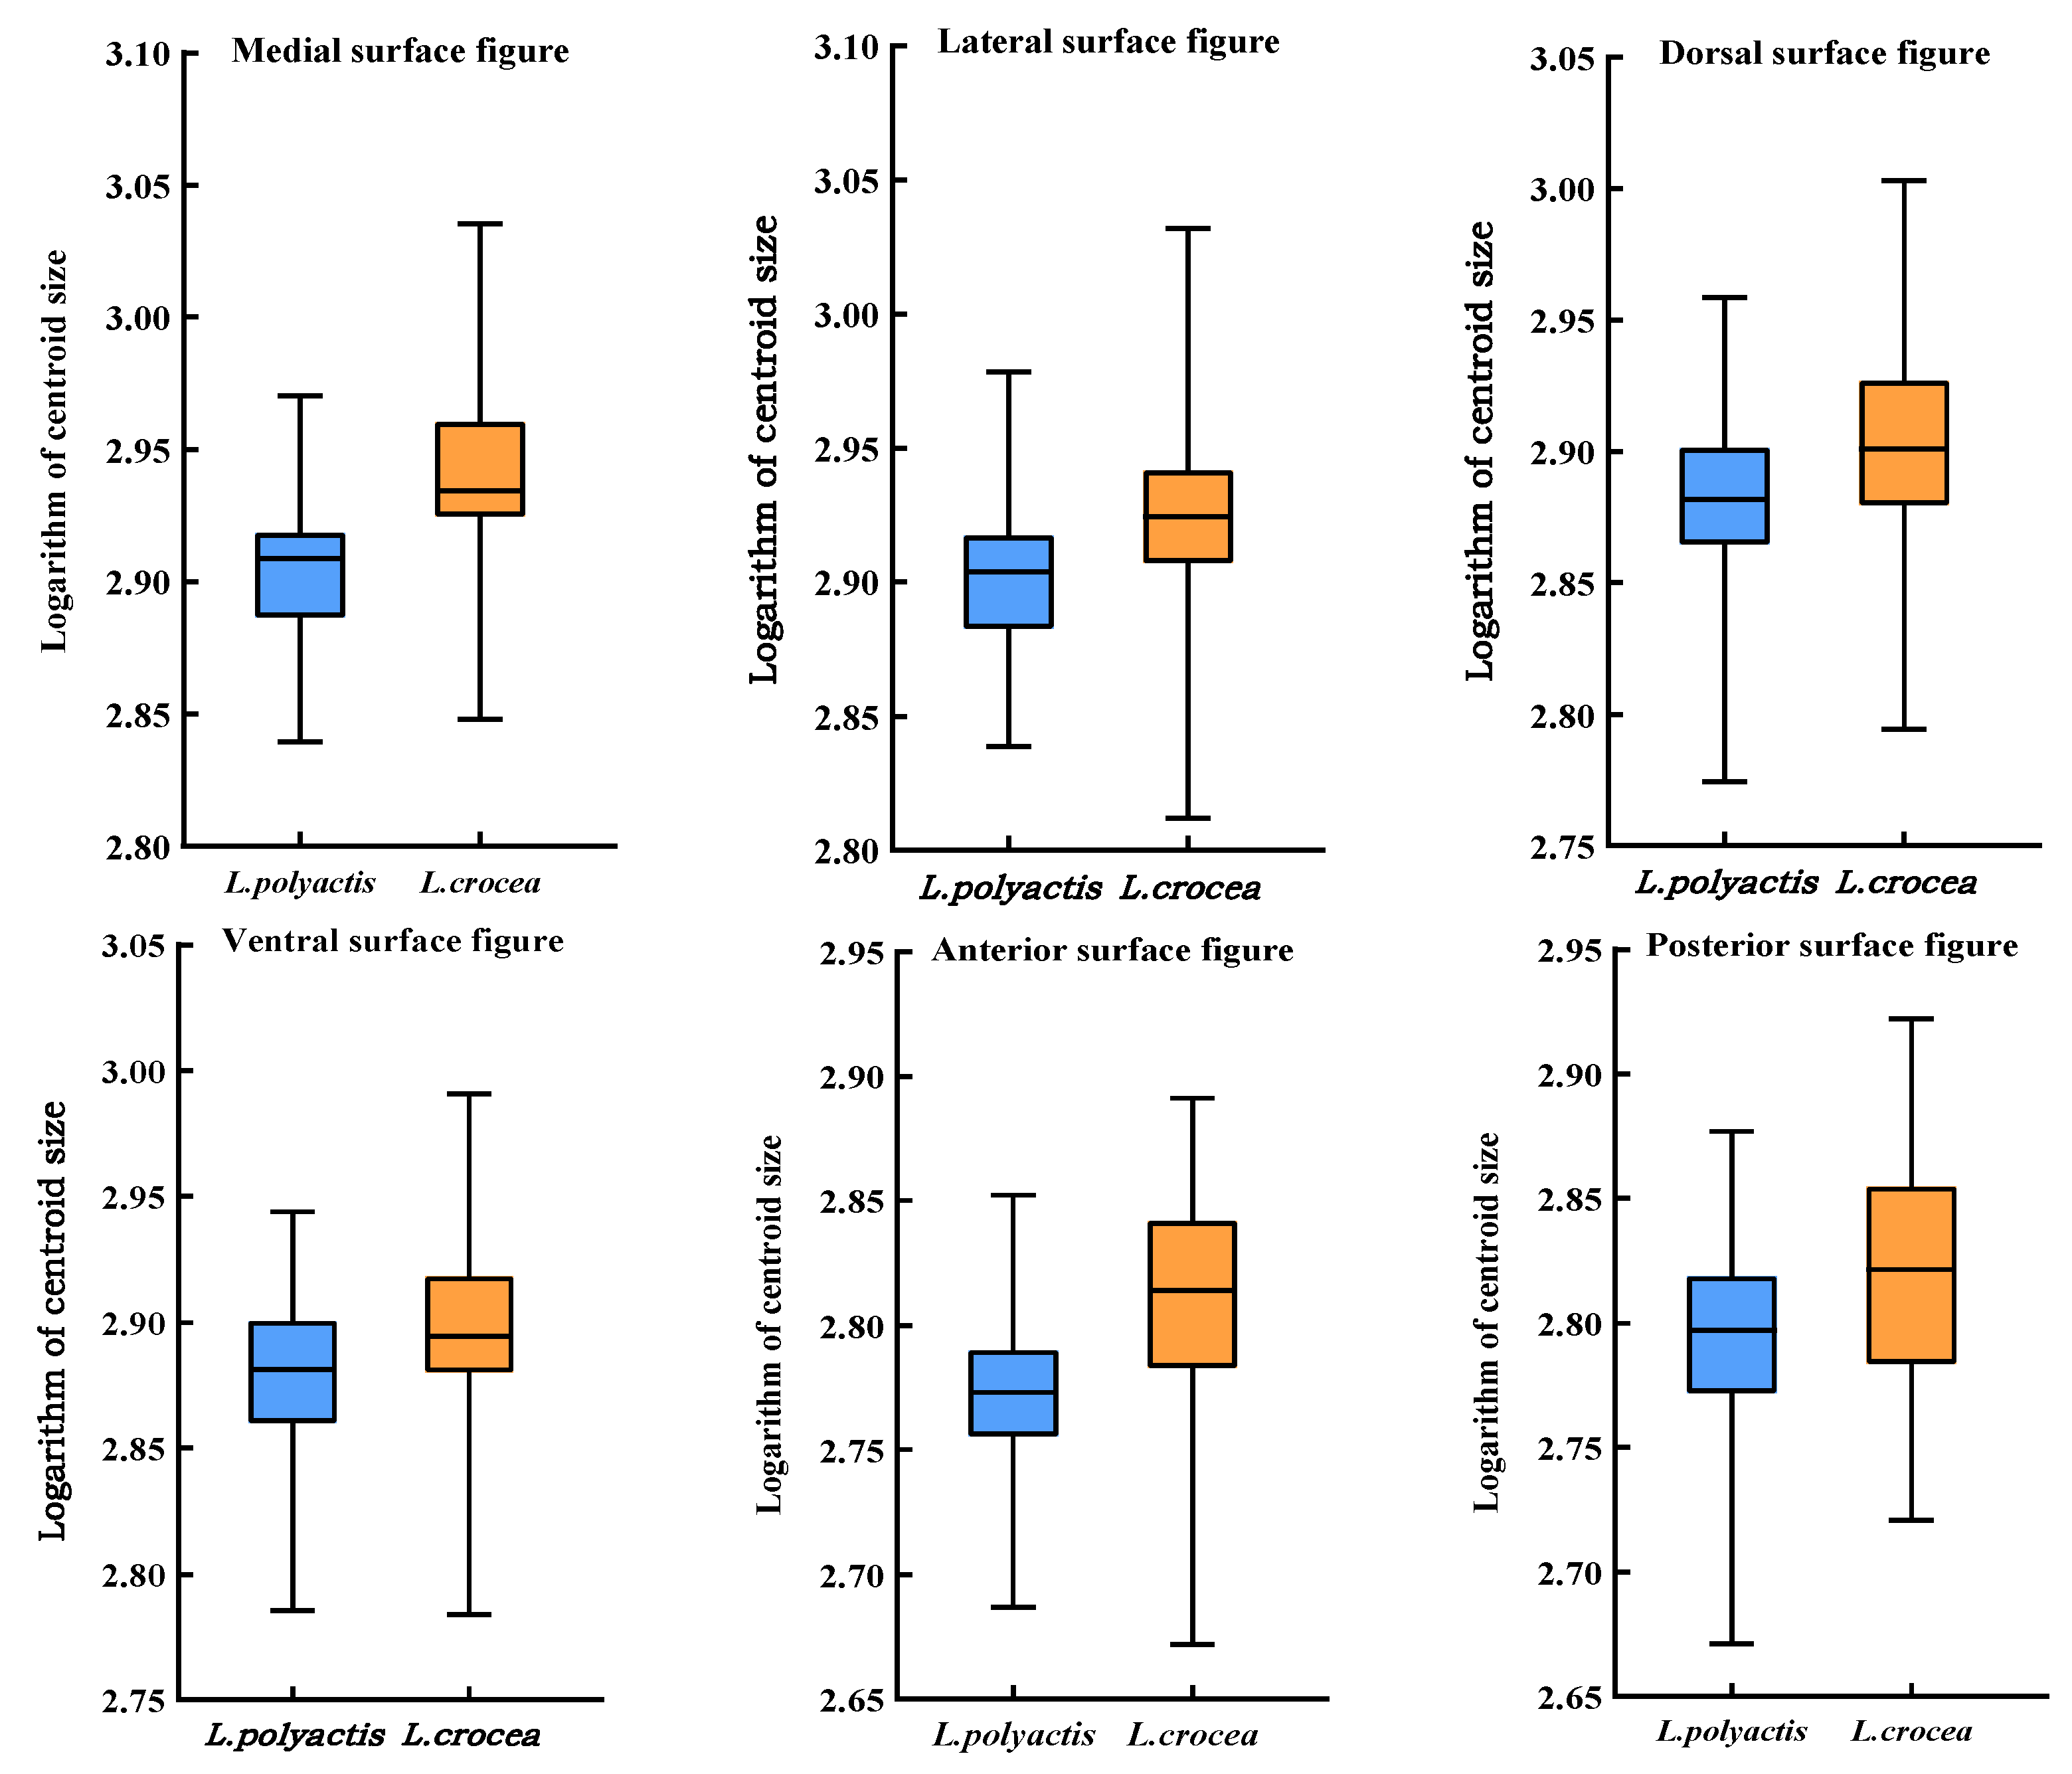
Following logarithmic transformation, only the ventral surface centroid size exhibited a normal distribution (p > 0.05) across both sciaenid species. The dorsal surface passed Levene’s test for homogeneity of variances (p = 0.397 > 0.05). One-way ANOVA demonstrated highly significant interspecific differences in centroid size: most pronounced on the medial surface (F = 183.450, p < 0.05); least significant on the dorsal surface (F = 45.071, p < 0.05). As illustrated in Figure 4, comparative analysis of the maximum centroid sizes across all surfaces demonstrated that Larimichthys crocea (large yellow croaker) consistently exhibited the largest values, whereas Larimichthys polyactis (small yellow croaker) showed the smallest.

3.4. Principal Component Analysis

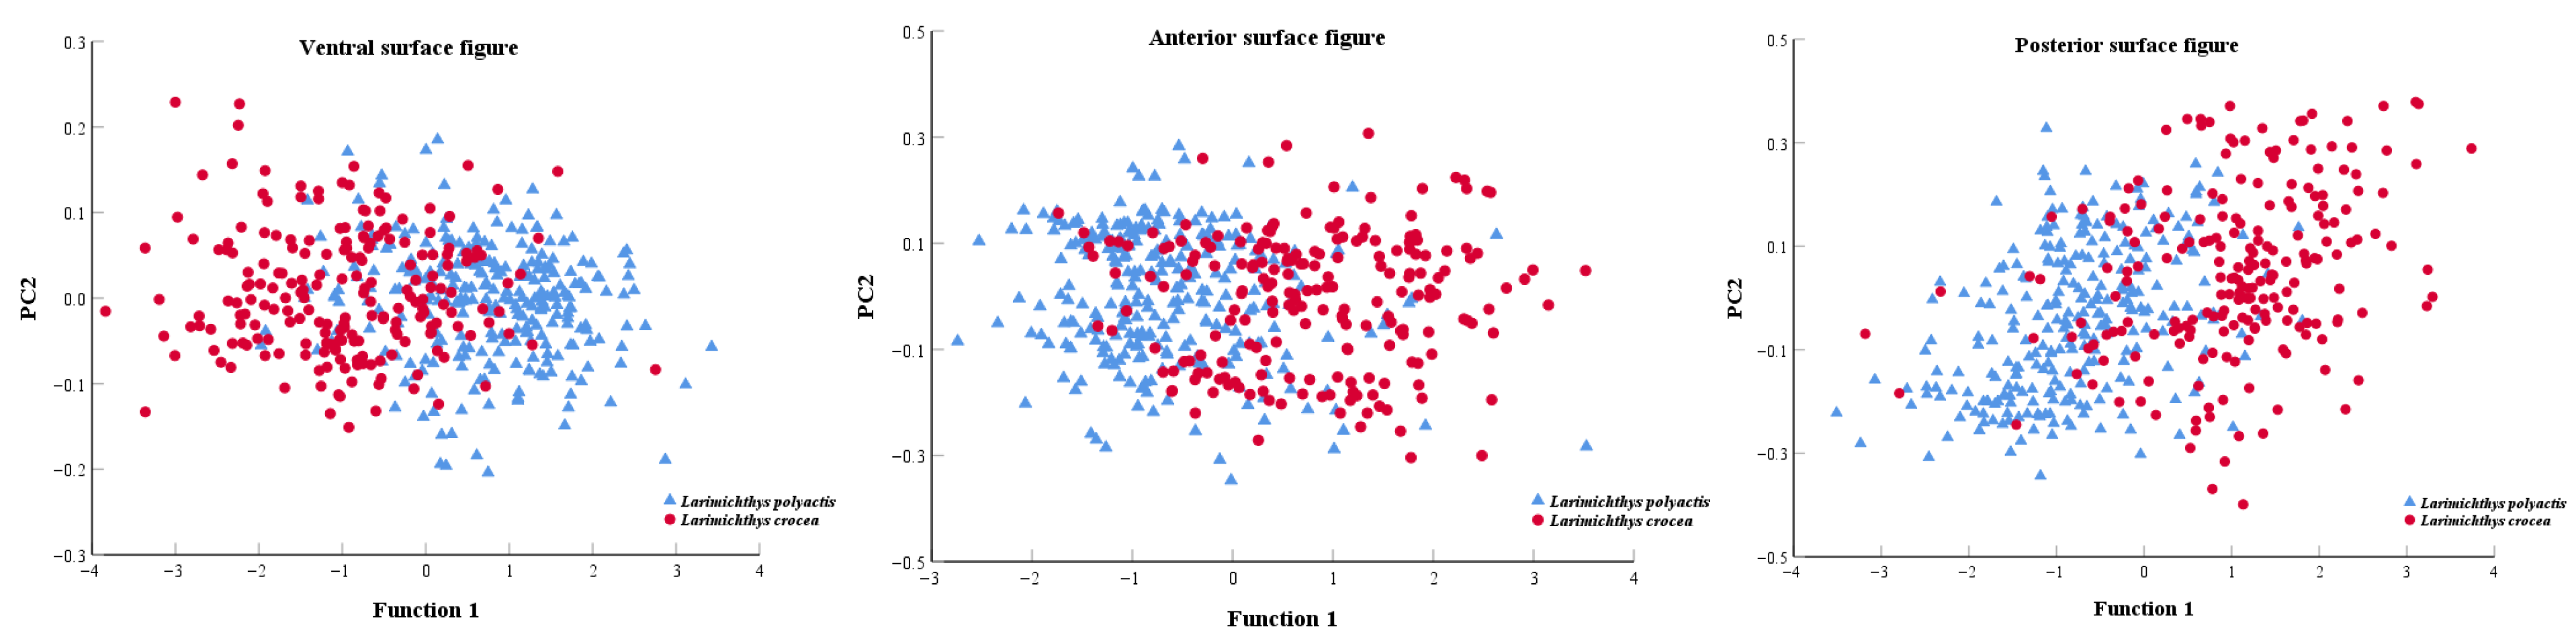
Principal component analysis based on relative warps was performed on otolith landmarks across six surfaces of two sciaenid species, extracting varying numbers of principal components (Table 4). The relative warp PCA revealed cumulative contribution rates of the first two principal components as follows: medial surface (52.48%), lateral surface (52.87%), dorsal surface (71.29%), ventral surface (63.7%), anterior surface (64.8%), and posterior surface (67.85%).
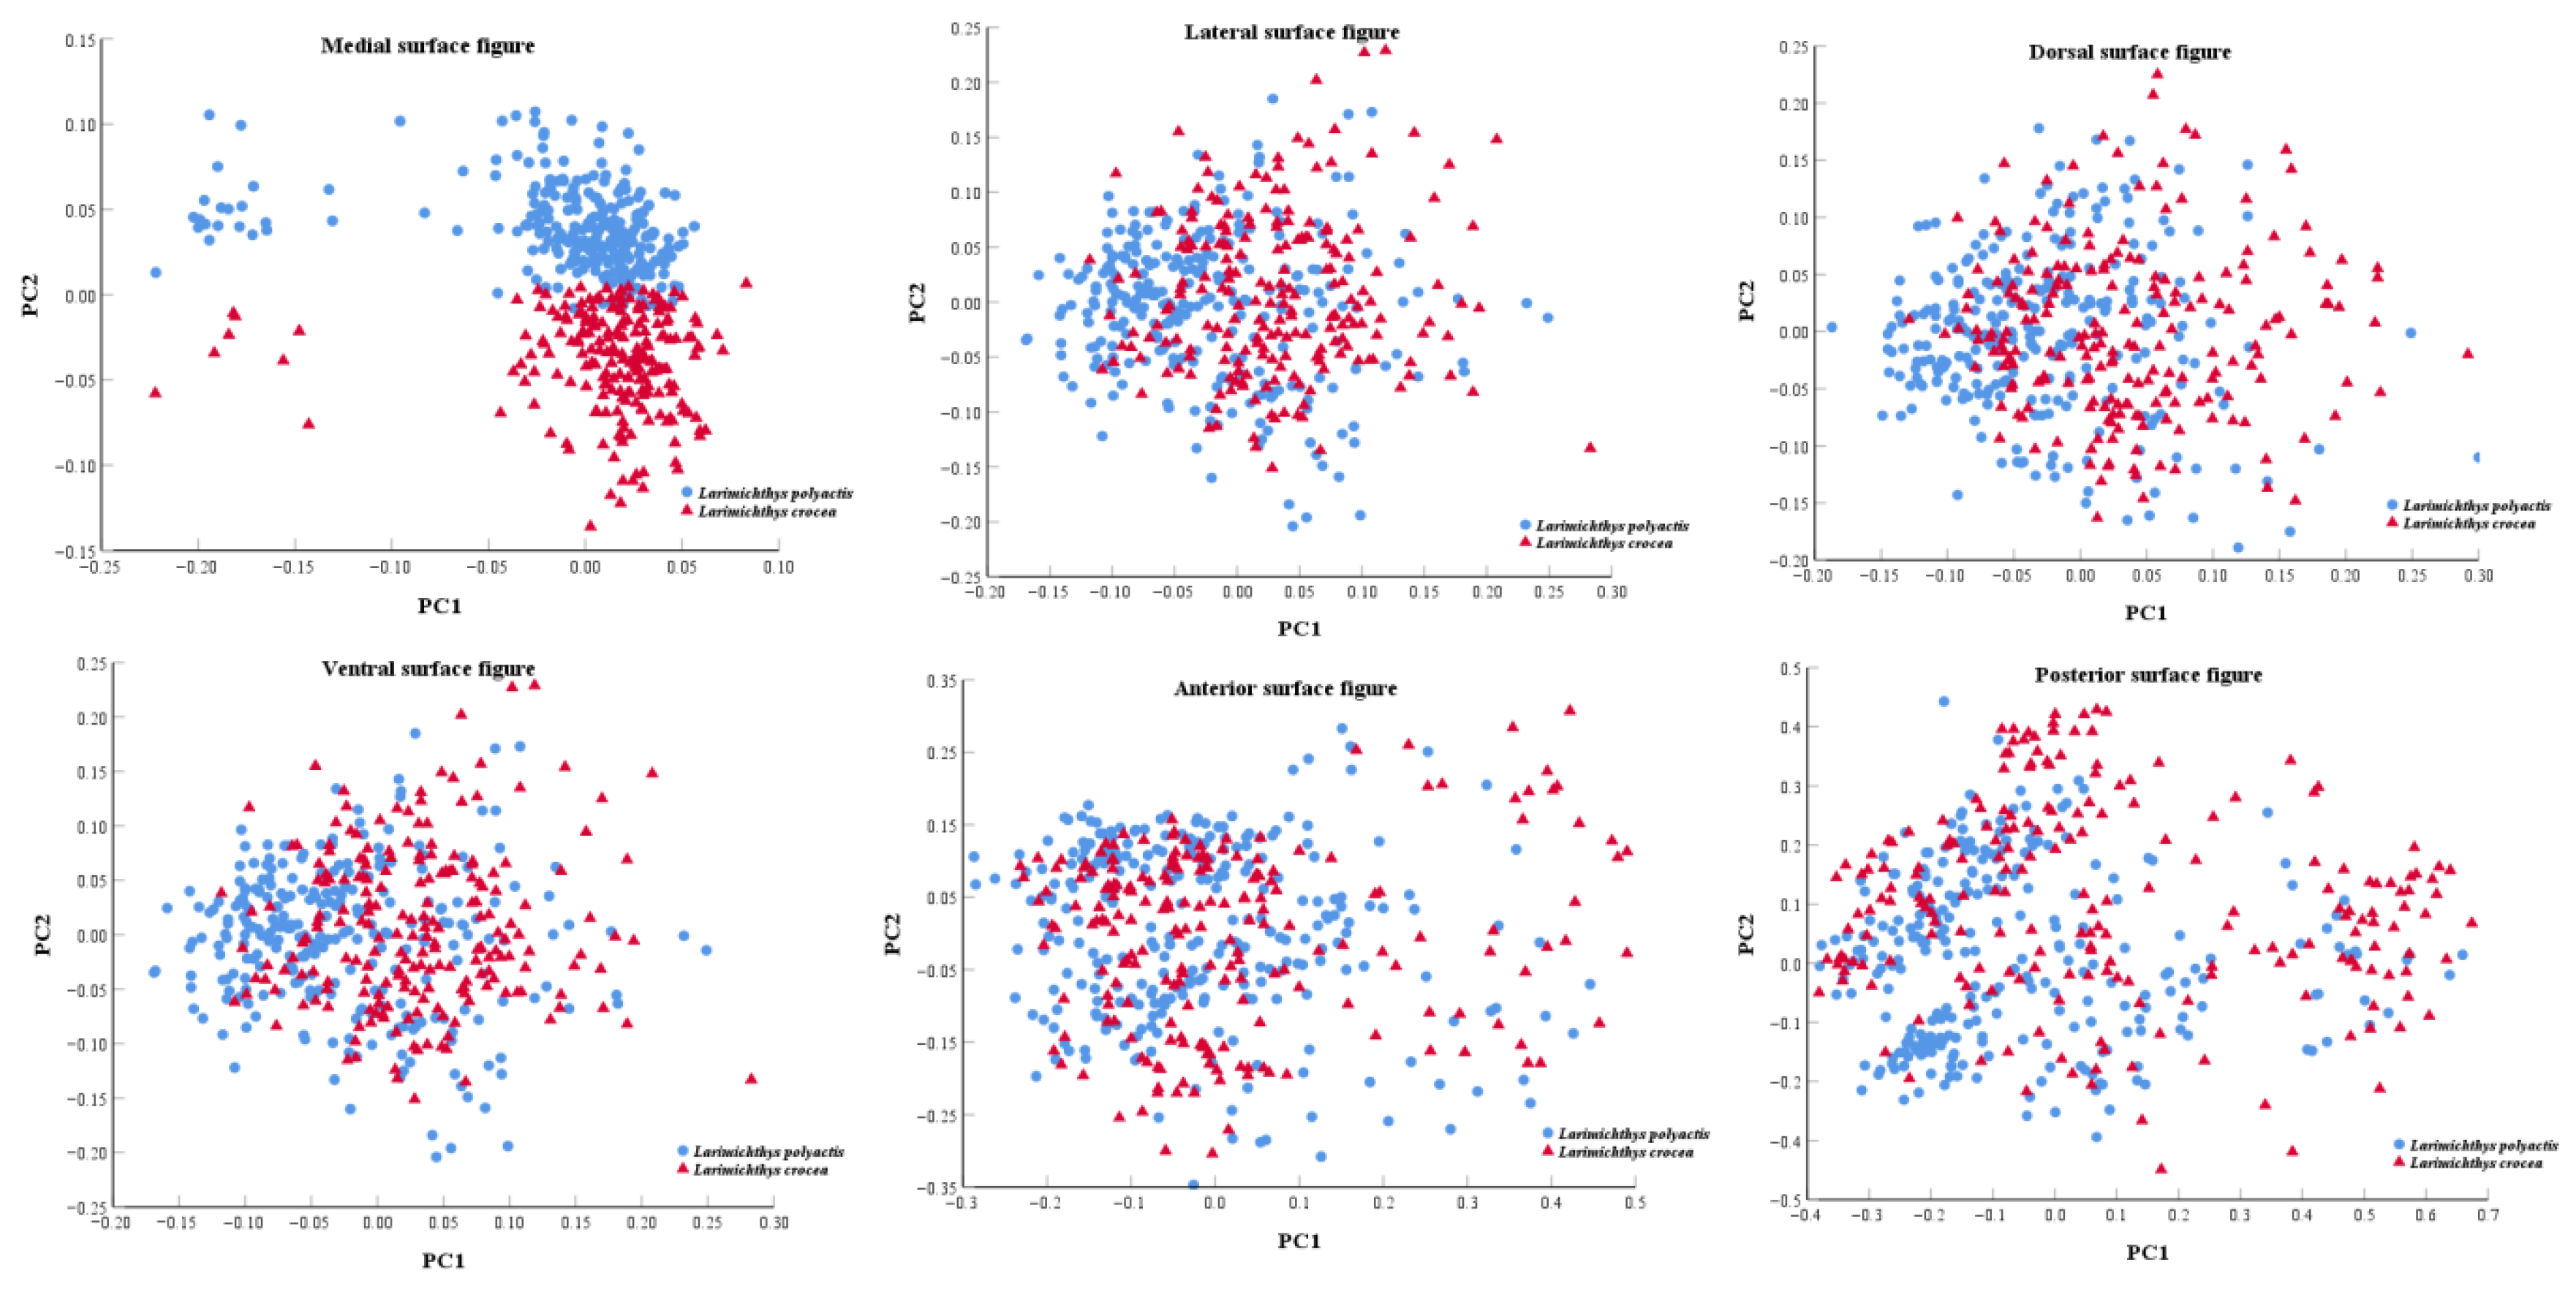
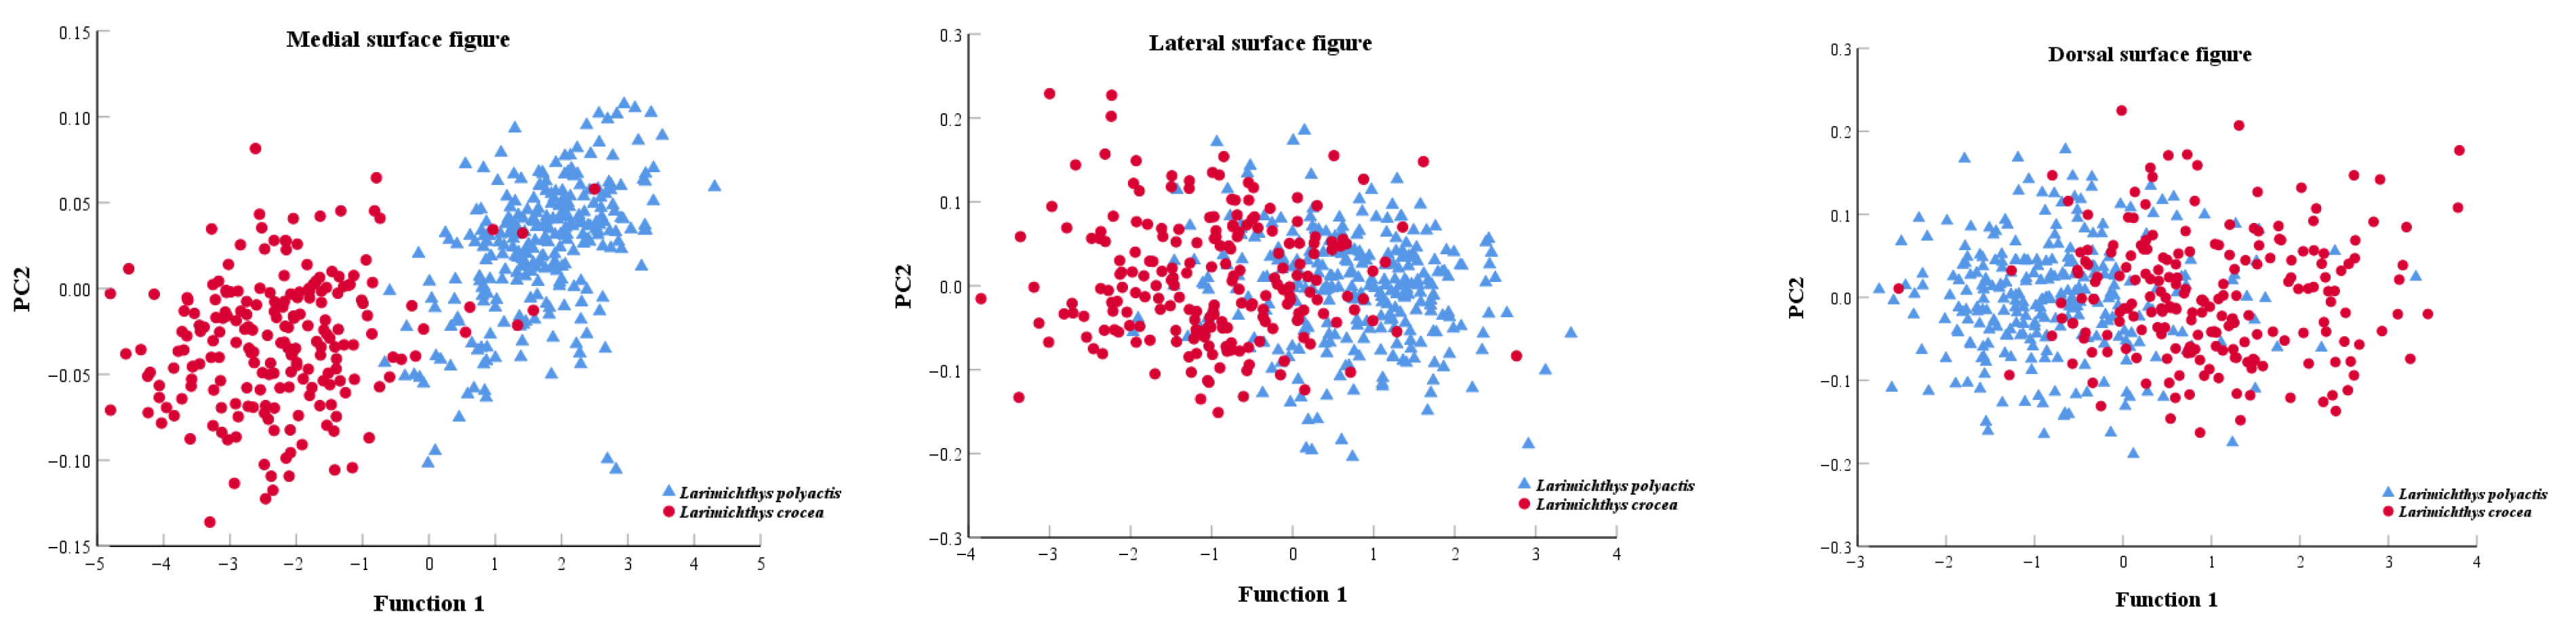
Principal component scatter plots across six otolith surfaces (Figure 5) revealed distinct interspecific discrimination patterns:
  • Medial surface: PC2 provided pronounced separation between Larimichthys polyactis (small yellow croaker) and Larimichthys crocea (large yellow croaker).
  • Lateral surface: PC1 enabled partial discrimination with suboptimal resolution.
  • Dorsal surface: PC1 showed limited discriminatory power.
  • Ventral surface: PC1 achieved species separation but exhibited substantial overlap in PC2.
  • Anterior surface: Significant overlap occurred along both PC1 and PC2 axes.
  • Posterior surface: Extensive overlap in PC1/PC2 space resulted in poor differentiation.
Collectively, these analyses demonstrate that only the medial surface achieved statistically significant species discrimination, with all other surfaces showing substantial overlap and limited diagnostic utility.

3.5. Discriminant Analysis

Stepwise discriminant analysis based on relative warp scores matrices revealed cross-validated classification success rates across otolith surfaces (Table 5):
  • Medial surface: 98.6% (L. polyactis), 95.2% (L. crocea).
  • Lateral surface: 81.6% (L. polyactis), 77.6% (L. crocea).
  • Dorsal surface: 85.9% (L. polyactis), 79.5% (L. crocea).
  • Ventral surface: 81.6% (L. polyactis), 78.1% (L. crocea).
  • Anterior surface: 83.0% (L. polyactis), 75.0% (L. crocea)
  • Posterior surface: 84.8% (L. polyactis), 81.9% (L. crocea).
The discriminant function plot demonstrated optimal species separation on the medial surface, where discriminant function 1 alone effectively distinguished L. polyactis from L. crocea. This primary function accounted for 100% of the total morphological variation in sagittal otoliths between the two sciaenid species (Figure 6).

4. Discussion

4.1. Morphological Analysis of Fish Sagittal Otoliths

A critical gap in existing otolith-based taxonomic research for morphologically similar Sciaenidae (e.g., L. crocea and L. polyactis) is the overreliance on single-surface analysis (typically the medial surface), which overlooks the polyhedral structure of otoliths and complementary morphological information across planes [22]. Notably, while there is no overlap in body length distribution between the two species (Table 1), size-based discrimination only applies to complete adult specimens—traditional methods fail for juveniles, processed samples, or fragmented remains, exacerbating their “cryptic-like” classification challenge [6,9]. Our sampling targeted dominant subadult-to-adult size classes in the Zhoushan Islands (East China Sea), the core group for regional fisheries monitoring; sufficient sample sizes meeting geometric morphometric requirements ensure representativeness for validating our framework, despite not covering the full size range. To address single-surface limitations and practical classification gaps, we innovatively analyzed six otolith surfaces (medial, lateral, dorsal, ventral, anterior, posterior) to establish a multi-dimensional taxonomic framework.
Our Relative Warp Analysis revealed distinct surface-specific landmark influence (Table 3); two landmarks (7 and 2) accounted for over 90% of shape deformation on the anterior surface, while contributions were more evenly distributed on dorsal/ventral surfaces. This highlights that single-plane analyses risk omitting critical diagnostic features, especially for species with subtle otolith shape differences. Integrating six-surface data converted otoliths’ 3D complexity into quantifiable metrics, enabling comprehensive reconstruction of interspecific divergence.
Discriminant analysis validated this approach, with cross-validated success rates ranging from 79.6% (anterior) to 97.1% (medial), identifying the medial surface as optimal due to its species-specific sulcus acousticus morphology [10,13]. It is important to clarify that otolith shape undergoes ontogenetic shifts; thus, our results are constrained to the sampled size classes and cannot be directly extended to out-of-range individuals. Future studies covering full life cycles are needed to enhance generalizability.
Practically, this multi-surface framework reliably distinguishes the two species in scenarios where traditional methods (including size-based discrimination) fail, addressing the critical need for accurate identification in fisheries surveys and population monitoring. For conserving these depleted species, this advancement ensures precise population structure data, supporting evidence-based management and sustainable resource utilization.

4.2. Influence of Selected Landmarks on Morphological Information of Otoliths

The selection of biologically meaningful, homologous landmarks is foundational to geometric morphometrics, as it directly determines the quality of shape quantification and taxonomic resolution [27,28]. Our results highlight that a subset of key landmarks dominates shape definition on high-information surfaces; on the medial surface of Larimichthys crocea and Larimichthys polyactis otoliths, landmarks 10 and 11 (closely associated with the sulcus acousticus—a taxonomically diagnostic structure in Sciaenidae [10,13]) contributed 76.433% of total shape variation, while landmarks 7 and 2 accounted for 90.571% of deformation on the anterior surface. This pattern aligns with previous studies on Carangidae and L. polyactis, where a small number of species-specific landmarks drove most morphological discrimination [29,30].
Notably, Type I (anatomical landmarks with clear, homologous anatomical positions, e.g., the anterior and posterior ends of the sulcus acousticus) and Type III (landmarks at extreme points of linear dimensions, e.g., the dorsalmost or ventralmost edges of the otolith) consistently showed higher contributions across all six surfaces—for example, Type I landmarks accounted for 93.233% of total variation on the lateral surface. In stark contrast, Type II landmarks (defined as maxima of curvature, such as the apices of depressions or protrusions on the otolith surface) contributed minimally to interspecific discrimination between the two Larimichthys species. As hypothesized, this phenomenon is closely linked to both the structural characteristics of the two species’ sagittal otoliths and our 2D imaging approach. The sagittal otoliths of L. crocea and L. polyactis exhibit subtle but complex three-dimensional curvature features—for instance, the depressions adjacent to the sulcus acousticus and the protrusions on the dorsal/ventral margins, where Type II landmarks were selected, possess distinct depth and spatial contour variations that are intrinsic to their 3D structure. However, our study relied on 2D planar imaging to capture otolith surfaces, which inevitably compresses the 3D curvature information into a 2D projection. This compression leads to two critical issues: (1) the true apex of curvature (e.g., the deepest point of a depression or the highest point of a protrusion) cannot be accurately localized in 2D space, as the depth dimension is lost, resulting in biased digitization of Type II landmark coordinates; (2) the interspecific differences in curvature magnitude (e.g., whether a depression is shallower in L. polyactis or deeper in L. crocea) are obscured in 2D images, reducing the ability of these landmarks to distinguish between species. For Type I/III landmarks, by contrast, their anatomical homology or linear extreme positions are readily identifiable in 2D projections, ensuring consistent and accurate digitization that retains interspecific differences.
This limitation underscores the value of future research adopting Three-dimensional scanning technology to capture the full spatial structure of L. crocea and L. polyactis otoliths. 3D imaging would preserve the true curvature and depth information of Type II landmarks, allowing for precise localization of curvature apices and quantification of interspecific differences in 3D space—potentially enhancing the contribution of Type II landmarks and further improving classification accuracy for these morphologically similar species.
For L. crocea and L. polyactis, the dominance of Type I/III landmarks reinforces the importance of strategic landmark selection tied to functionally or taxonomically relevant structures (e.g., the sulcus acousticus on the medial surface). This targeted approach ensures that the quantified shape variation directly reflects interspecific differences, rather than random noise—explaining why the medial surface, which integrates such high-impact landmarks, achieved the highest discrimination success.

4.3. Visualization Effect of the Landmark-Based Method on Otolith Morphology

Thin-plate spline deformation grids (Figure 3a,b), species-specific mean shape reconstructions (Figure 3c), and centroid size boxplots serve as critical visual bridges between raw landmark data and statistical discrimination, providing mechanistic insights into interspecific morphological divergence that complements quantitative analyses [31]. These visualizations do not directly enable species identification on their own, but they play an indispensable role in interpreting how and where otolith shape differs between Larimichthys crocea and Larimichthys polyactis—laying the biological foundation for the discriminant analyses that ultimately achieve accurate classification.
For the deformation grids (Figure 3a,b), we anchored the visualization to a common reference to highlight species-specific shape deviations; L. polyactis shows subtle anterior–posterior axis compression (grid lines stretched along dorsal–ventral direction) and reduced sulcus acousticus margin curvature, while L. crocea exhibits pronounced sulcus acousticus region expansion (grid line convergence in the central medial area) and enhanced lateral edge curvature. These grid patterns make imperceptible shape differences (e.g., sulcus depth, posterior margin angle) explicit, directly explaining why the medial surface (where these differences are most distinct) achieved 97.1% discriminant success—they validate that our landmark coordinates capture biologically meaningful traits, ensuring the discriminant analysis results are rooted in real morphological divergence rather than statistical noise.
The mean shape reconstructions (Figure 3c) further support species identification by defining a “morphological baseline” for each species; L. crocea’s mean shape presents a broader medial surface, distinct sulcus lobes, and a rounded posterior margin, while L. polyactis’ mean shape shows a narrower medial surface, a shallow, elongated sulcus, and a pointed posterior margin. For unknown specimens, aligning their otolith shape with these mean shapes enables rapid preliminary screening (e.g., a specimen matching L. crocea’s mean shape can be prioritized for targeted discriminant analysis), which greatly improves the efficiency of large-scale species identification in fisheries surveys.
Centroid size boxplots, paired with these shape visualizations, enhance classification robustness by reflecting species-specific, growth-stage-insensitive size differences; L. crocea exhibits consistently larger centroid sizes across all surfaces, a trait tied to the species’ inherent otolith growth pattern rather than individual development. As otoliths are stable hard tissues, this size distinction is retained across juvenile to adult stages and is unaffected by sample damage—addressing the core limitation of traditional morphological identification (which fails for juveniles or incomplete specimens).
Crucially, the grids and mean shapes do not constitute a standalone identification tool; instead, they translate qualitative shape differences into quantifiable spatial metrics (e.g., relative warp scores) that serve as input variables for discriminant analysis. The discriminant model then objectifies these visual traits into taxonomic decisions, minimizing subjectivity. For instance, the grid-captured sulcus depth difference is quantified as a relative warp score, which the discriminant analysis weights to achieve high classification accuracy—this synergy ensures our framework is both intuitively interpretable and statistically rigorous.

4.4. Classification and Identification Effect of the Landmark-Based Method on Otolith Morphology

The classification performance of our landmark-based approach was rigorously evaluated. Principal component analysis (PCA) confirmed that the first two principal components for all six surfaces cumulatively explained over 50% of the morphological variance. However, scatter plots revealed that effective visual species separation in the PCA space was only achieved on the medial surface, while other surfaces showed significant overlap. This observation—that PCA separation does not always align with successful discrimination—is consistent with findings in other species [25,32].
In contrast, discriminant analysis provided a more robust assessment of classification power, yielding high cross-validated success rates across all surfaces, with the medial surface performing exceptionally well (97.1%). The rates for other surfaces were lateral (79.9%), dorsal (83.2%), ventral (80.1%), anterior (79.6%), and posterior (83.6%). The superior performance of the medial surface is likely attributable to the distinct morphology of the sulcus acousticus and the clear delineation provided by its landmarks. The lower discrimination on other surfaces can be explained by our observations; (1) the dorsal and ventral surfaces exhibited morphological similarity and may have had suboptimal landmark selection, and (2) variations in photographic angles potentially affected the precision of landmark data for the anterior and posterior surfaces.
While traditional morphometrics relies on linear parameters correlated with fish size, our six-surface landmark approach synthesized the key features of the medial sulcus with morphological data from five additional planes. This holistic framework achieved superior discrimination, advancing otolith-based taxonomic resolution and providing a more powerful tool for Sciaenidae conservation and fisheries monitoring.

5. Conclusions

This study implemented landmark-based geometric morphometrics across six surfaces (medial, lateral, dorsal, ventral, anterior, posterior) of sagittal otoliths from two species in Sciaenidae, demonstrating effective interspecies discrimination with high cross-validated success rates; all surfaces achieved >79.6% accuracy, while the medial surface yielded optimal classification (L. polyactis: 98.6%, L. crocea: 95.2%) due to its distinct sulcus-associated landmarks and unambiguous morphological delineation. When species exhibit similar morphology on a single surface, complementary analysis of alternative planes can significantly enhance identification accuracy. With the ongoing advancement of geometric morphometric frameworks and artificial intelligence [33,34,35], the integration of machine learning with landmark-based methods [36,37] offers transformative potential. This synergy enables the automated extraction of landmark patterns for ecological diagnostics, mitigates the subjectivity inherent in manual landmark selection, improves analytical efficiency, and ultimately supports rapid and accurate identification of fish species and populations. This frontier warrants urgent scholarly exploration to revolutionize otolith-based taxonomy and resource management.

Author Contributions

X.H.: data curation, writing—original draft. L.O.: data curation, investigation, conceptualization, methodology, software, writing—review and editing, resources, project administration. W.Q.: supervision, investigation, project administration. R.J.: supervision, investigation. All authors have read and agreed to the published version of the manuscript.

Funding

This work was supported by the National Key R&D Program of China (2024YFD2400404), the National Key R&D Program of China (2024YFD2400605), the General Scientific Research Project of the Education Department of Zhejiang Province (Y202353969), the Zhejiang Ocean University Talent Introduction Scientific Research Fund Project (JX6311033624), and the Research Project of Shanghai Ocean University (SF202400175).

Institutional Review Board Statement

The animal experiments described in this study were conducted in compliance with ethical standards and have been approved by the name of the ethics committee: Animal Experimental Ethical Inspection, Institutional Animals Care and Use Committee of Zhejiang Ocean University (Approval No. 2025112, Approval Date: 3 November 2025).

Informed Consent Statement

Not applicable.

Data Availability Statement

The original contributions presented in this study are included in the article. Further inquiries can be directed to the corresponding authors.

Acknowledgments

The authors extend their appreciation to Shanghai Ocean University and Zhejiang Ocean University.

Conflicts of Interest

The authors declare no conflicts of interest.

References

  1. Gao, S.; Zhang, S.; Feng, Z.; Lu, J.; Fu, G.; Yu, W. The bio-accumulation and magnification of microplastics under predator-prey isotopic relationships. J. Hazard. Mater. 2024, 480, 135896. [Google Scholar] [CrossRef]
  2. Shan, X.; Li, X.; Yang, T.; Sharifuzzaman, S.M.; Zhang, G.; Jin, X.; Dai, F. Biological responses of small yellow croaker (Larimichthys polyactis) to multiple stressors: A case study in the Yellow Sea, China. Acta Oceanol. Sin. 2017, 36, 39–47. [Google Scholar] [CrossRef]
  3. Xuan, W.; Zhang, H.; Zhang, H.; Wu, T.; Zhou, Y.; Zhu, W. Distribution Characteristics and Driving Factors ofCollichthys lucidusSpecies in Offshore Waters of Zhejiang Province, China. Fishes 2024, 9, 83. [Google Scholar] [CrossRef]
  4. Liu, Q.H.; Lin, H.D.; Chen, J.; Ma, J.K.; Liu, R.Q.; Ding, S.X. Genetic variation and population genetic structure of the large yellow croaker (Larimichthys crocea) based on genome-wide single nucleotide polymorphisms in farmed and wild populations. Fish. Res. 2020, 232, 7. [Google Scholar] [CrossRef]
  5. Ma, B.; Wang, L.; Lou, B.; Tan, P.; Xu, D.; Chen, R. Dietary protein and lipid levels affect the growth performance, intestinal digestive enzyme activities and related genes expression of juvenile small yellow croaker (Larimichthys polyactis). Aquac. Rep. 2020, 17, 100403. [Google Scholar] [CrossRef]
  6. Linlong, W.; Li, L.; Yang, L.; Lu, Z.; Shen, Y. Fishery Dynamics, Status, and Rebuilding Based on Catch-Only Data in Coastal Waters of China. Front. Mar. Sci. 2022, 8, 757503. [Google Scholar] [CrossRef]
  7. Ma, Q.; Tian, S.; Han, D.; Richard, K.; Gao, C.; Liu, W. Growth and maturity heterogeneity of three croaker species in the East China Sea. Reg. Stud. Mar. Sci. 2020, 41, 101483. [Google Scholar] [CrossRef]
  8. Rui, Z.; Yang, L.; Hao, T.; Shuhao, L.; Kaiwei, Z.; Xinmei, X. Impact of climate change on long-term variations of small yellow croaker (Larimichthys polyactis) winter fishing grounds. Front. Mar. Sci. 2022, 9, 915765. [Google Scholar] [CrossRef]
  9. Yin, Z.; Xia, Y.; Zhang, C.; Zhang, R.; Liu, D.; Liu, Y. Combined Effects of Fishing and Environment on the Growth of Larimichthys polyactis in Coastal Regions of China. Fishes 2024, 9, 367. [Google Scholar] [CrossRef]
  10. Thomas, O.R.B.; Swearer, S.E. Otolith Biochemistry—A Review. Rev. Fish. Sci. Aquac. 2019, 27, 458–489. [Google Scholar] [CrossRef]
  11. Afanasyev, P.K.; Orlov, A.M.; Rolsky, A.Y. Otolith Shape Analysis as a Tool for Species Identification and Studying the Population Structure of Different Fish Species. Biol. Bull. 2017, 44, 952–959. [Google Scholar] [CrossRef]
  12. Gang, H.; Dandan, L.; FENG, B.; Huosheng, L. Identification of sagittal otolith morphology of four species of white gourami in the Beibu Gulf based on geometric morphometry of landmark points. J. Fish. Sci. China 2013, 20, 1293–1302. [Google Scholar] [CrossRef]
  13. Shuo, Z.; Xiao, Z.; Shike, G.; Wen, S. Morphology and growth characteristics of otoliths of two species of Sciaenidae in the marine ranching area of Haizhou Bay. J. Biol. 2023, 40, 62–69. [Google Scholar] [CrossRef]
  14. Fengying, Z.; Yazhou, J.; Chunyan, M.; Wei, C.; Jiahua, C.; Lingbo, M. Spatial Genetic Structure and Diversity of Large Yellow Croaker (Larimichthys crocea) from the Southern Yellow Sea and North-Central East China Sea: Implications for Conservation and Stock Enhancement. Water 2023, 15, 338. [Google Scholar] [CrossRef]
  15. Jian, Z.; Tianxiang, G.; Yunrong, Y.; Na, S. Genetic variation of the small yellow croaker (Larimichthys polyactis) inferred from mitochondrial DNA provides novel insight into the fluctuation of resources. Acta Oceanol. Sin. 2022, 41, 88–95. [Google Scholar] [CrossRef]
  16. Yuan, J.G.; Lin, H.D.; Wu, L.S.; Zhuang, X.; Ma, J.K.; Kang, B.; Ding, S.X. Resource Status and Effect of Long-Term Stock Enhancement of Large Yellow Croaker in China. Front. Mar. Sci. 2021, 8, 12. [Google Scholar] [CrossRef]
  17. Xiaoyan, W.; Guoqing, L.; Linlin, Z.; Qiao, Y.; Tianxiang, G. Assessment of fishery resources using environmental DNA: Small yellow croaker (Larimichthys polyactis) in East China Sea. PLoS ONE 2020, 15, e0244495. [Google Scholar] [CrossRef]
  18. Ting, Y.L.; Yan, J.; Qing, X.; Mao, D.G.; Yi, C.X.; Min, L. Reproductive Dynamics of the Large Yellow Croaker Larimichthys crocea (Sciaenidae), A Commercially Important Fishery Species in China. Front. Mar. Sci. 2022, 9, 868580. [Google Scholar] [CrossRef]
  19. Song, X.; Hu, F.; Xu, M.; Zhang, Y.; Jin, Y.; Gao, X.; Liu, Z.; Ling, J.; Li, S.; Cheng, J. Spatiotemporal Distribution and Dispersal Pattern of Early Life Stages of the Small Yellow Croaker (Larimichthys Polyactis) in the Southern Yellow Sea. Diversity 2024, 16, 521. [Google Scholar] [CrossRef]
  20. Yang, Z.; Lu, N.; Zhai, L. Study on production strategies for marine aquaculture in China at different scales: A case study of large yellow croaker (Larimichthys crocea). Aquac. Int. 2025, 33, 172. [Google Scholar] [CrossRef]
  21. Chen, L.H.; Zeng, W.H.; Rong, Y.Z.; Lou, B. Compositions, nutritional and texture quality of wild-caught andcage-cultured small yellow croaker. J. Food Compos. Anal. 2022, 107, 8. [Google Scholar] [CrossRef]
  22. Yaşar, D.M.; Yasin, D.; İsmail, D. Geometric analysis of otoliths in Cyprinion kais and Cyprinion macrostomus. Anat. Histol. Embryol. 2022, 51, 696–702. [Google Scholar] [CrossRef] [PubMed]
  23. Marcus, L.F.; Corti, M.; Loy, A.; Naylor, G.J.P.; Slice, D.E. Introduction to landmark methods. In Advances in Morphometrics; Springer: Boston, MA, USA, 1996; Volume 10, pp. 113–115. [Google Scholar] [CrossRef]
  24. Villalpando, J.G.C.; García-Rodríguez, J.F.; Luna, D.E.; Agüero, J.D.L.C. Geometric morphometrics for the analysis of character variation in size and shape of the sulcus acusticus of sagittae otolith in species of gerreidae (teleostei: Perciformes). Mar. Biodivers. 2019, 49, 2323–2332. [Google Scholar] [CrossRef]
  25. Guo, Z.; Yang, T.; Wang, Y.; Zhong, J.; Deng, Q.; Sun, W. Morphological analysis of otoliths of China’s bombay duck (Harpadon nehereus) from different geographic groups. J. Zhejiang Univ. (Agric. Life Sci.) 2021, 47, 380–388. [Google Scholar] [CrossRef]
  26. Du, L. Quantitative Analysis of Fish Morphology Through Landmark and Outline-based Geometric Morphometrics with Free Software. Bio-Protocol 2024, 14, e5087. [Google Scholar] [CrossRef]
  27. Rohlf, F.J.; Slice, D. Extensions of the Procrustes Method for the Optimal Superimposition of Landmarks. Syst. Biol. 1990, 39, 40–59. [Google Scholar] [CrossRef]
  28. Xiang, M.; Li, X.; Meng, Z.; Wei, N.; Wu, Z.; Wang, Q.; Gao, S. Fluctuation asymmetry of otoliths from Coilia brachygnathus in Changhu Lake: A first study in inland waters of China. Mar. Pollut. Bull. 2024, 209, 117240. [Google Scholar] [CrossRef]
  29. Liguo, O.; Bilin, L. Morphological classification of sagittal otoliths of four trevally fishes based on the landmark point method. J. Dalian Ocean Univ. 2020, 35, 114–120. [Google Scholar] [CrossRef]
  30. Long, L.; Dade, D.; Zhongjie, T.; Hushun, Z.; Guodong, L. A study on the population relationship between the small yellow croaker (Larimichthys polyactis) in the south Yellow Sea and East China Sea based on the otolith landmark method. South. Aquat. Sci. 2023, 19, 21–29. [Google Scholar] [CrossRef]
  31. Bookstein, F.L. Principal warps: Thin-plate splines and the decomposition of deformations. IEEE Trans. Pattern Anal. Mach. Intell. 1989, 11, 567–585. [Google Scholar] [CrossRef]
  32. Singh, M.; Kashyap, A.; Ansari, J.A.; Serajuddin, M. Spatial Variations in the Shape and Chemistry of Sagittal Otoliths in Channa punctatus (Channidae) Populations of Ganga Basin, India. Inland Water Biol. 2022, 15, 249–261. [Google Scholar] [CrossRef]
  33. Ou, L.; Liu, B.; Chen, X.; He, Q.; Qian, W.; Li, W.; Zou, L.; Shi, Y.; Hou, Q. Automatic classification of the phenotype textures of three Thunnus species based on the machine learning SVM algorithm. Can. J. Fish. Aquat. Sci. 2023, 80, 1221–1236. [Google Scholar] [CrossRef]
  34. Ou, L.; Lu, L.; Qian, W.; Liu, B. Interpretability and identification of dimorphism in morphological indexes of Larimichthys crocea based on machine learning models. Fish. Res. 2025, 288, 107475. [Google Scholar] [CrossRef]
  35. Ou, L.; Liu, B.; Chen, X.; He, Q.; Qian, W.; Zou, L. Automated identification of morphological characteristics of three Thunnus species based on different machine learning algorithms. Fishes 2023, 8, 182. [Google Scholar] [CrossRef]
  36. Courtenay, L.A.; Yravedra, J.; Huguet, R.; Aramendi, J.; Maté-González, M.Á.; González-Aguilera, D.; Arriaza, M.C. Combining machine learning algorithms and geometric morphometrics: A study of carnivore tooth marks. Palaeogeography 2019, 522, 28–39. [Google Scholar] [CrossRef]
  37. Ou, L.; Lu, L.; Qian, W.; Liu, B. Application of artificial intelligence in fish information identification: A scientometric perspective. Front. Mar. Sci. 2025, 12, 1575523. [Google Scholar] [CrossRef]
Figure 1. The morphology of left otoliths and the location of landmarks on each of the six surfaces of two species of Sciaenidae. (a) Otolith of Larimichthys polyactis. (b) Otolith of Larimichthys crocea. The number I–VI represents the otolith of the inner side, outer side, back, belly, front, and rear. The numbers 1–11 represent landmarks.
Fishes 11 00036 g001
Figure 2. Mean shape and superimposed landmarks of sagitta otolith of two species in Sciaenidae. (a) Mean shape. (b) Superimposed landmarks. The numbers I–VI denote the otolith of the medial surface, lateral surface, dorsal surface, ventral surface, anterior surface, and posterior surface.
Fishes 11 00036 g002aFishes 11 00036 g002b
Figure 3. Grid deformation of otolith shapes of two species in Sciaenidae (variations are enlarged 3 times). (a) Otolith of Larimichthys polyactis. (b) Otolith of Larimichthys crocea. (c) mean shape of grid. The numbers 1–6 denote the otolith of the medial surface, lateral surface, dorsal surface, ventral surface, anterior surface, and posterior surface.
Fishes 11 00036 g003aFishes 11 00036 g003b
Figure 4. Box plot of centroid size of otolith shapes of two species in Sciaenidae.
Fishes 11 00036 g004
Figure 5. Scatter plots of relative warp scores of the PC1 and PC2 of two species in Sciaenidae.
Fishes 11 00036 g005
Figure 6. Scatter plots of canonical discriminant principle functions of different faces for two species in Sciaenidae.
Fishes 11 00036 g006aFishes 11 00036 g006b
Table 1. Sampling information of two species in Sciaenidae.
SpeciesBody Length/mmBody Height/mmSample Size/ind.
Larimichthys polyactis124–17230–53277
Larimichthys crocea232–37664–112210
Table 2. Landmark types and definition.
Medial SurfaceDefinition
TypeLandmark
I8Intersection of rostral sulcus opening rim and collum, positioned near dorsal surface
9Junction between rostral sulcus margin and collum with ventral positioning
10Intersection point of posterior sulcus terminus and collum on dorsal side
11Convergence of caudal sulcus end and collum, located ventrally
II2Depressed landmark at dorsal–posterior junction
4Concave point between ventral surface and posterior margin
7Protruding point at dorsal sulcus wall-anterior margin interface
III1Widest point on dorsal surface
3Longest point on posterior margin
5Widest point on ventral surface
6Longest point on anterior margin
Lateral surface
I7Intersection of horizontal line from landmark 5 with anterior contour
8Intersection of horizontal line from landmark 6 with anterior outline
II5Depressed point at ventral–posterior junction
6Concave landmark between dorsal surface and posterior margin
III1Longest point on anterior margin
2Widest point on ventral surface
3Longest point on posterior margin
4Widest point on dorsal surface
Dorsal surface
I7Intersection of vertical line from landmark 5 with medial contour
8Intersection of vertical line from landmark 6 with medial outline
II5Depressed point between anterior margin and lateral surface
6Concave landmark at posterior–lateral junction
III1Longest point on anterior margin
2Widest point on medial surface
3Longest point on posterior margin
4Widest point on lateral surface
Ventral surface
I7Intersection of vertical line from landmark 5 with medial contour
8Intersection of vertical line from landmark 6 with medial outline
II5Depressed point at anterior–lateral junction
6Concave landmark between posterior margin and lateral surface
III1Longest point on anterior margin
2Widest point on lateral surface
3Longest point on posterior margin
4Widest point on medial surface
Anterior surface
I6Intersection of vertical line from landmark 4 with medial contour
7Intersection of horizontal line from landmark 4 with dorsal contour
8Intersection of vertical line from landmark 5 with medial outline
9Intersection of horizontal line from landmark 5 with ventral contour
II4Depressed point at ventral–lateral junction
5Concave landmark between dorsal and lateral surfaces
III1Longest point on ventral margin
2Widest point on dorsal surface
3Longest point on lateral surface
Posterior surface
I6Intersection of horizontal line from landmark 5 with dorsal contour
7Intersection of vertical line from landmark 5 with medial outline
8Intersection of horizontal line from landmark 4 with ventral contour
9Intersection of vertical line from landmark 4 with medial contour
II4Depressed point between dorsal and lateral surfaces
5Concave landmark at ventral–lateral junction
III1Longest point on ventral margin
2Widest point on lateral surface
3Longest point on dorsal margin
Table 3. Relative contribution of distortion of different landmark points on six faces of otoliths of two species in Sciaenidae.
LandmarkContribution Rate/%
Medial SurfaceLateral SurfaceDorsal
Surface
Ventral SurfaceAnterior SurfacePosterior Surface
10.55226.2594.2763.2081.14817.128
21.33511.68210.6745.99638.8081.688
30.2721.95014.06816.9370.87916.155
43.3687.6445.8459.8631.71319.858
50.6044.98110.07510.5313.0972.789
60.2157.28924.99222.7600.8544.898
70.42026.74813.14410.68051.7631.472
88.10013.44716.92720.0260.48333.599
98.700 1.2552.413
1033.838
1142.595
Table 4. Eigenvalues and contributions of the principal components of relative warps scores.
Principal ComponentEigenvalueContribution
Rate/%
Cumulative Contribution Rate/%Principal ComponentEigenvalueContribution
Rate/%
Cumulative Contribution Rate/%
11.1538927.0027.0011.6572835.2335.23
21.0294121.4848.4821.1728717.6452.87
30.8213813.6862.1631.0288813.5866.45
40.669029.0771.2340.9087510.5977.04
50.600757.3278.5550.678855.9182.95
60.519255.4784.0260.637055.2088.15
70.412773.4587.4770.555763.9692.11
80.364992.7090.1780.454512.6594.76
90.350832.5092.6790.398122.0396.80
100.316482.0394.70100.354151.6198.40
110.267521.4596.15110.282181.0299.43
120.230071.0797.22120.211530.57100.00
130.180260.6697.88
140.170000.5998.47
150.158290.5198.98
160.137780.3899.36
170.127810.3399.69
180.123350.31100.00
total variance0.00245 total variance0.00317
Principal ComponentEigenvalueContribution
Rate/%
Cumulative Contribution Rate/%Principal ComponentEigenvalueContribution
Rate/%
Cumulative Contribution Rate/%
11.855781.8557841.6911.7488135.9735.97
21.5635629.6071.2921.5354427.7363.70
31.0356912.9984.2831.2633618.7782.47
40.624924.7389.0040.734846.3588.82
50.553263.7192.7150.568703.8092.62
60.492012.9395.6460.498612.9295.54
70.403851.9797.6170.454132.4397.97
80.325571.2898.9080.268720.8598.82
90.229980.6499.5490.256050.7799.59
100.135520.2299.76100.137620.2299.81
110.134590.2299.98110.119400.1799.98
120.041260.02100.00120.040190.02100.00
total variance0.00274 total variance0.00264
Principal ComponentEigenvalueContribution
Rate/%
Cumulative Contribution Rate/%Principal ComponentEigenvalueContribution
Rate/%
Cumulative Contribution Rate/%
13.5193840.5140.5115.7609049.4649.46
22.7252024.2964.8023.5124518.3967.85
32.0084713.1977.9932.7720711.4579.30
41.535767.7185.7041.913105.4584.75
51.202484.7390.4351.756814.6089.35
60.891892.6093.0461.539413.5392.89
70.769081.9394.9771.084501.7594.64
80.702801.6296.5981.011281.5296.16
90.658161.4298.0090.863971.1197.28
100.524940.9098.90100.811370.9898.26
110.433530.6199.52110.729320.7999.05
120.310840.3299.83120.588220.5299.56
130.195070.1299.96130.471880.3399.90
140.112850.04100.00140.263620.10100.00
total variance0.01120 total variance0.01966
Table 5. Discriminant analysis results of otolith of two species in Sciaenidae ( stepwise discriminant analysis and cross validation analysis).
ItemLarimichthys polyactisLarimichthys crocea
Discriminated FishTotalAccuracy/%Discriminated FishTotalAccuracy/%
Medial surface27327798.620021095.2
Lateral surface22681.616377.6
Dorsal surface23885.916779.5
Ventral surface22681.616478.1
Anterior surface2308315675
Posterior surface23584.817281.9
Disclaimer/Publisher’s Note: The statements, opinions and data contained in all publications are solely those of the individual author(s) and contributor(s) and not of MDPI and/or the editor(s). MDPI and/or the editor(s) disclaim responsibility for any injury to people or property resulting from any ideas, methods, instructions or products referred to in the content.