Article

Rearing Time–Salinity Synergy in Osmoregulation: Ionic Homeostasis and Textural Enhancement in Adult Freshwater Drums (Aplodinotus grunniens)

by
Sharifa Mohamed Miraji
1,2,
Wanwen Chen
1,3,4,*,
Haibo Wen
1,3,4,*,
Liufu Wang
1,3,4,
Wu Jin
1,3,4,
Xueyan Ma
1,3,4,
Pao Xu
1,3,4 and
Hao Cheng
5,6
1
Wuxi Fisheries College, Nanjing Agricultural University, Wuxi 214081, China
2
Department of Fisheries Development and Marine Resources, Ministry of Blue Economy and Fisheries, Zanzibar P.O. Box 774, Tanzania
3
Key Laboratory of Integrated Rice-Fish Farming Ecology, Ministry of Agriculture and Rural Affairs, Freshwater Fisheries Research Center, Chinese Academy of Fishery Sciences, Wuxi 214081, China
4
Sino-US Cooperative International Laboratory for Germplasm Conservation and Utilization of Freshwater Mollusks, Freshwater Fisheries Research Center, Chinese Academy of Fishery Sciences, Wuxi 214081, China
5
State Key Laboratory of Food Science and Resources, Jiangnan University, Wuxi 214122, China
6
School of Food Science and Technology, Jiangnan University, Wuxi 214122, China
*
Authors to whom correspondence should be addressed.
Fishes 2025, 10(9), 437; https://doi.org/10.3390/fishes10090437
Submission received: 15 July 2025 / Revised: 25 August 2025 / Accepted: 28 August 2025 / Published: 2 September 2025

Abstract

This study demonstrates that rearing duration (14 and 30 days) and environmental salinity (0, 4, 8, and 12 parts per thousand (ppt) of NaCl) synergistically modulate osmoregulation and muscle texture in adult freshwater drums (Aplodinotus grunniens). Salinity significantly reduced the hepatosomatic index at 30 days (p < 0.05). Furthermore, serum biochemical indices were markedly affected. Higher salinity and prolonged rearing time decreased triglycerides, total cholesterol, and low-density lipoprotein (LDL), while high-density lipoprotein (HDL) levels increased at 14 days (p < 0.05), indicating improved lipid metabolism efficiency. Crucially, osmotic pressure remained stable across salinities at 14 days but exhibited a dose-dependent increase at 30 days (p < 0.05), driven primarily by elevated Na+ and Cl concentrations. Salinity (8–12 ppt) markedly enhanced water-holding capacity, reducing cooking loss (~58%), centrifugal loss (~74%), drip loss (~83%), and thaw loss (~84%) versus 0 ppt controls (p < 0.05). Concurrently, key texture parameters also significantly improved, as reflected by hardness, chewiness, resilience, and gumminess. These enhancements might be attributed to hyperosmotic stress-induced cellular dehydration and ionic strength-mediated protein cross-linking.
Key Contribution: This study offers theoretical evidence that salinity can improve meat quality in reared adult freshwater drums.

1. Introduction

Environmental salinity constitutes a critical abiotic factor in aquaculture systems, profoundly influencing physiological homeostasis in cultured fish species. As a key environmental determinant, salinity modulates osmoregulatory mechanisms, energy allocation patterns, and immunological competence, thereby affecting essential production metrics including survival rates, growth performance, and reproductive success [1]. The physiological challenges posed by salinity variations are exemplified in grass carp (Ctenopharyngodon idella), where specimens averaging 10 ± 1 g showed significantly higher mortality rates (40%) when exposed to 3‰ salinity compared to those acclimated to 6‰ salinity (16.67% mortality) [2]. Fish maintain osmotic homeostasis through active osmoregulatory mechanisms, dynamically adjusting Na+ and Cl fluxes to counteract either internal dilution in hypotonic environments or ionic accumulation in hypertonic conditions [3]. Ionoregulatory capacity exhibits significant interspecific variation among aquatic organisms [4].
Emerging evidence indicates salinity also significantly modulates flesh quality parameters. Recent studies further demonstrate salinity’s significant influence on muscle textural properties across aquatic taxa. In largemouth bass (Micropterus salmoides) fry (mean initial weight: 48.57 ± 0.11 g), textural characteristics were markedly affected by salinity gradients [5]. Similarly, juvenile mud crabs (Scylla paramamosain) cultured at 4–12 ppt exhibited enhanced textural profiles without compromising nutritional composition [6]. Collectively, these studies substantiate salinity’s multifaceted impacts on growth performance, osmoregulatory function, and textural attributes in juvenile aquatic species. A recent study demonstrated enhanced muscle quality in common carp (Cyprinus carpio) reared in saline inland aquaculture systems compared to freshwater-reared counterparts [7]. However, surprisingly few investigations have addressed rearing duration and salinity effects on adult fish physiology or product quality.
Understanding the combined effects of rearing duration and environmental salinity is critical for optimizing the culture of adult freshwater fish. The freshwater drum (Aplodinotus grunniens), a native species in North America with strong economic potential, has been successfully introduced to China and exhibits notable adaptability and high-quality flesh [8]. Our previous study reveals that Aplodinotus grunniens can tolerate moderate salinity levels of up to 15‰ in acute exposure trials without adverse effects [9]. However, the physiological and quality responses of adult individuals to varying salinity and acclimation durations remain poorly understood. This study aims to bridge that knowledge gap by evaluating the interactive effects of salinity (4, 8, and 12 ppt) and rearing duration (14 and 30 days) on osmoregulatory physiology and muscle textural properties in adult Aplodinotus grunniens.

2. Materials and Methods

2.1. Experimental Fish and Rearing Conditions

Approximately 144 healthy freshwater drums (1.5  ±  0.25 kg) were sourced from the Freshwater Fisheries Research Centre of the Chinese Academy of Fishery Science. Four salinity levels (0, 4, 8, and 12 ppt) were established. The fish were randomly allocated into 12 tanks (3 tanks per salinity group, 12 fish per tank). At 14 and 30 days of rearing, four fish were collected from each tank, resulting in twelve fish per treatment that were used for subsequent analyses. The rearing durations and salinity levels were selected based on a previous study [5]. All tanks were maintained under controlled aquatic conditions (temperature: 25  ±  1 °C; dissolved oxygen >5 mg/L; pH = 7.5  ±  0.5), and the fish were kept under fasting conditions throughout the experiment. All analyses, including morphological indices, osmotic pressure, serum biochemical parameters, inorganic ion concentrations, water-holding capacity, and texture profile analysis, were performed.

2.2. Determination of Growth Performance

After 14 days and 30 days of exposure, respectively, twelve fish in each salinity group were collected for measurements of body weight, viscerosomatic weight, hepatosomatic weight, and body length. Indices including the viscerosomatic index (VSI), hepatosomatic index (HSI), and condition factor (CF) were calculated according to the formulae described by Mustafa. et al. [10] as follows:
Viscerosomatic   index   VSI = Viscera   weight   g Body   weight   g × 100
Hepatosomatic   index   ( HSI ) = Liver   weight   ( g ) Body   weight   g × 100
Condition   factor   ( CF ) = Body   weight   ( g ) Body   length 3   ( cm 3 ) × 100

2.3. Determination of Osmotic Pressure Analysis

At the end of the experiment, twelve fish were anesthetized using MS-222 (ethyl 3-aminobenzoate methanesulfonic acid salt). Blood samples were then collected from the caudal vein using heparinized syringes and divided into aliquots. For osmotic pressure analysis, blood samples were centrifuged at 5000 rpm for 10 min at 4 °C and subsequently analyzed using a cryoscopic osmometer (Osmomat 030, Gonotec GmbH, Berlin, Germany).

2.4. Determination of Serum Biochemical Indices

Additionally, serum biochemical characteristics were analyzed using a BC1800 automatic blood cell analyzer (Mindray, Shengzhen, China). The parameters such as triglyceride (TG), cholesterol (CHO), total protein, albumin, globulin, low-density lipoprotein (LDL), and high-density lipoprotein (HDL), as well as the inorganic ions potassium (K+), sodium (Na+), calcium (Ca2+), magnesium (Mg2+), phosphates (PO43−), and chlorides (Cl) were measured.

2.5. Determination of Water-Holding Capacity Analysis

Freshwater drums’ dorsal muscle tissue was sampled and immediately used for water-holding capacity assessment. Drip loss, cooking loss, thaw loss, and centrifugal loss were determined according to the reference reported by Fruzsina et al. and Li et al. with minor modifications [11,12] and calculated based on the following equations:
Drip   loss   % = W 0 W 1 W 0 × 100
Cooking   loss   % = W 2 W 3 W 2 × 100
Thaw   loss   % = W 4 W 5 W 4 × 100
Centrifugal   loss   % = W 6 W 7 W 6 × 100
where W0, W2, W4, and W6 represent the initial weights of each muscle sample prior to experimentation. W1 denotes the muscle weight after 24-h storage at 4 °C. W3 indicates the weight following cooking in boiling water for 5 min. W5 corresponds to the weight after storage at −20 °C for 24 h. W7 signifies the weight after centrifugation at 4000 rpm and 4 °C for 30 min. Before each room temperature weighing, surface moisture was removed by blotting the muscle with filter paper.

2.6. Determination of Texture Profile Analysis

Texture profile analysis (TPA) of freshwater drums samples (2 × 2 × 1.5 cm3) was performed using a TA.XT Plus texture analyzer (Stable Micro Systems Ltd., London, UK) equipped with a P/5 cylindrical probe [13]. The experiment was carried out under the conditions of 5 g trigger force, 2 mm/s pre-test speed, 1 mm/s test speed, 2 mm/s post-test speed, and 60% test deformation. Key TPA parameters were quantified, including hardness, springiness, cohesiveness, gumminess, chewiness, and resilience.

2.7. Statistical Analysis

Statistical analyses were conducted using SPSS Statistics 20 (IBM, Armonk, New York, NY, USA). Data were analyzed as independent biological replicates (n = 12 per treatment group). All data were presented as mean ± standard deviation. Statistical analyses were performed separately for each rearing duration (14 and 30 days) to determine the effects of salinity at each time point. Additionally, pairwise comparisons were conducted between the 14-day and 30-day groups at the same salinity level to assess time-dependent differences. Significant differences were determined through one-way ANOVA followed by Duncan’s multiple comparison test, with p < 0.05 considered statistically significant. Before analysis, all datasets were tested for normality and homogeneity of variances, and the assumptions were met in all cases.

3. Results and Discussion

3.1. Morphological Index Analysis

The hepatosomatic index (HSI), viscerosomatic index (VSI), and condition factor (CF) of freshwater drums exposed to different salinity levels (0, 4, 8, 12 ppt) for 14 and 30 days are presented in Figure 1. A decrease in HSI occurred with increasing salinity. At 14 days, HSI declined from 1.08  ±  0.15% (0 ppt) to 0.98  ±  0.11% (4 ppt), 0.92  ±  0.19% (8 ppt), and 0.87  ±  0.09% (12 ppt), while differences among salinity groups were not statistically significant at this time point. Following 30 days of exposure, HSI value showed a slight increase compared to 14 days, but a similar decreasing trend with salinity was evident. Notably, HSI at 30 days was significantly lower in the 4 ppt (1.02 ± 0.10%), 8 ppt (0.95 ± 0.06%) and 12 ppt (0.95 ± 0.04%) groups compared to the 0 ppt control (1.22 ± 0.10%) (p < 0.05). In contrast, neither VSI nor CF differed significantly between the control (0 ppt) group and salinity-exposed groups at either 14 or 30 days. These results indicate that 30 days of salinity exposure significantly reduced HSI compared to freshwater, particularly at higher salinities (8 and 12 ppt), while no detectable effect on VSI or CF was observed. Additionally, rearing duration itself (14 vs. 30 days) did not significantly influence HSI, VSI, or CF.
The observed decline in HSI may be attributed to decreased liver weight. This change is likely due to the increased energy demand required to maintain osmotic balance under salinity stress. To counteract elevated salinity, fish expend more energy on osmoregulation [14]. Consequently, enhanced glucose breakdown during glycolysis may lead to lipid excretion from the liver, thereby lowering liver weight [15,16].

3.2. Osmotic Pressure Analysis

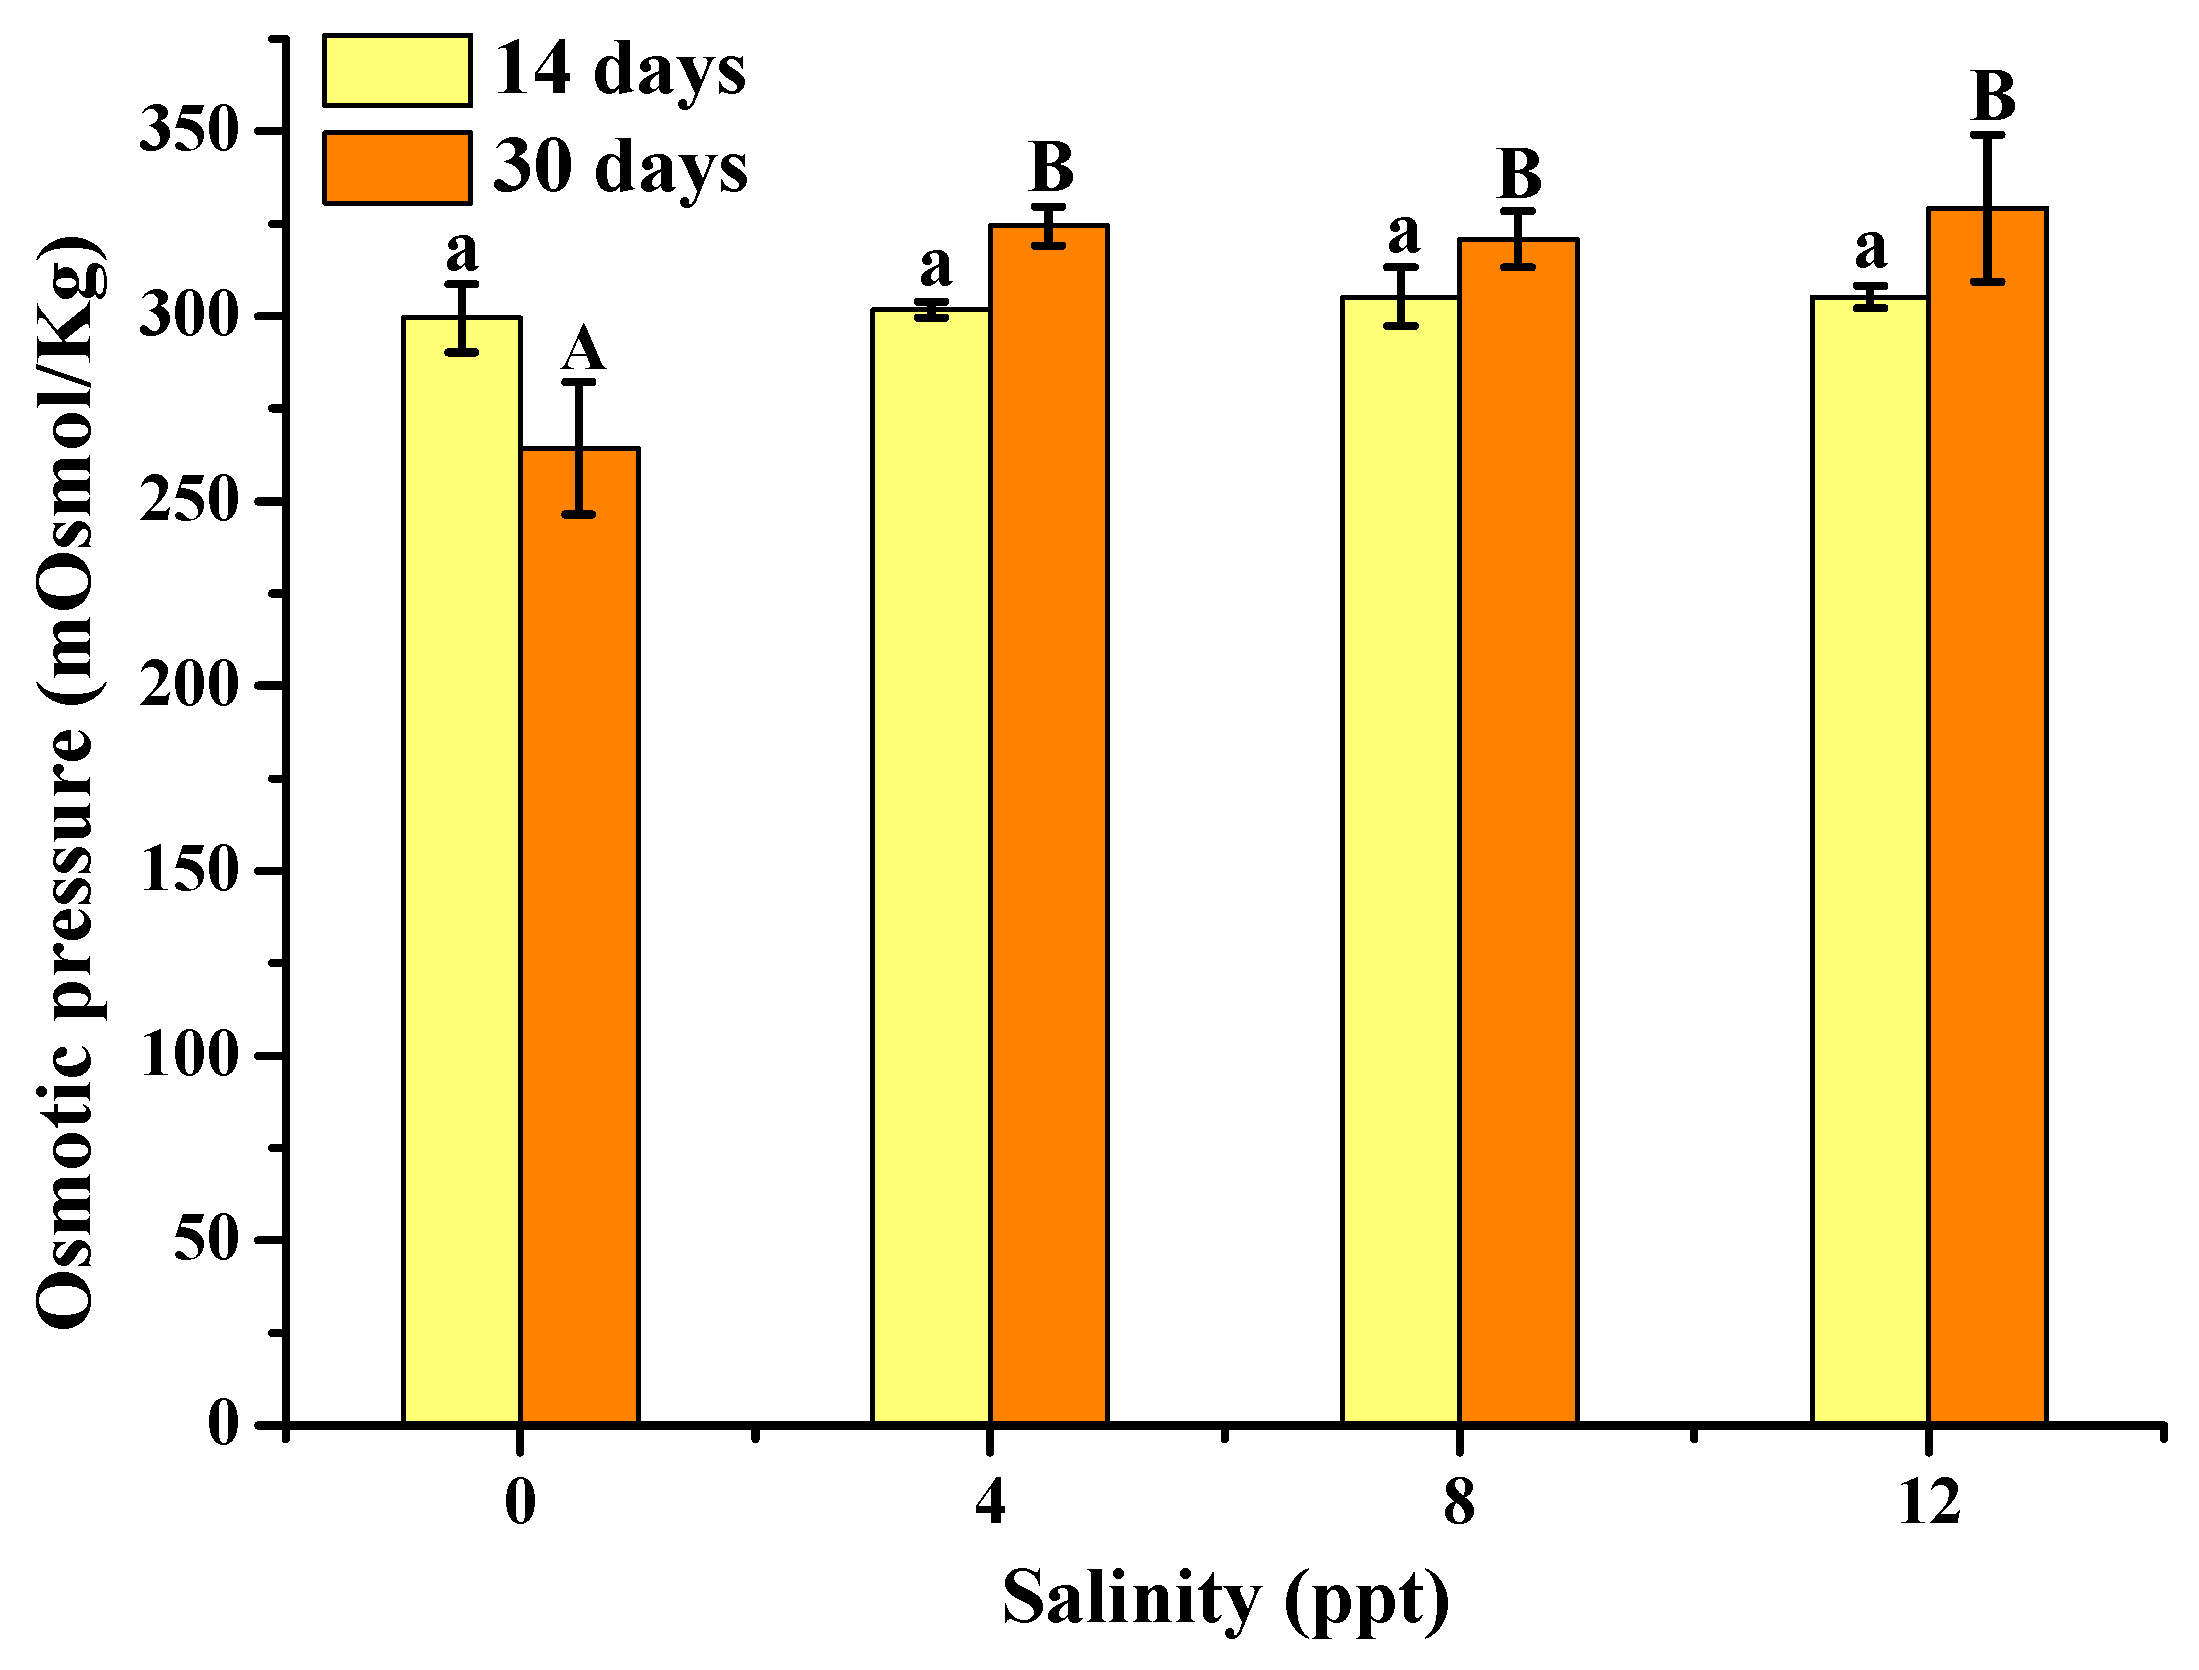
Changes in the osmotic pressure of freshwater drums exposed to salinities of 0, 4, 8, and 12 ppt for 14 and 30 days are displayed in Figure 2. After 14 days, osmotic pressure values were 299.50 ± 9.26, 301.75 ± 2.22, 305.25 ± 7.93, and 305.25 ± 2.98 mOsmol/kg at 0, 4, 8, and 12 ppt, respectively. No significant differences were observed between the control (0 ppt) and salinity-exposed groups at this time point. However, after 30 days, osmotic pressure increased significantly from 264.33 ± 17.92 mOsmol/kg (0 ppt) to 324.40 ± 5.27 (4 ppt), 320.80 ± 7.66 (8 ppt) and 329.17 ± 19.93 mOsmol/kg (12 ppt) (p < 0.05), exhibiting a positive correlation with salinity elevation.
Freshwater fish typically maintain plasma osmolality within a range of 281–310 mOsmol/kg [17,18]. Previous research found that serum osmolalities increased marginally but were not significantly different in Oreochromis niloticus subjected to the salinity levels of 0, 5, 10, and 15 ppt, respectively. It indicated that Oreochromis niloticus may be acclimated to ambient water salinities ranging from 0 to 15 ppt [3]. It was also revealed that Mozambique tilapia maintained consistent plasma osmolality in freshwater and 10 ppt seawater over four months [19]. Similarly, grass carp (Ctenopharyngodon idella) stabilized serum osmotic pressure under varying salinities [15]. Our results found that freshwater drums maintained serum osmolality unaffected by salinity (0–12 ppt), demonstrating effective osmotic homeostasis. However, osmotic pressure increased significantly with rising salinity, indicating that they underwent significant adjustment in 30 days. This temporal divergence aligns with the solute-dependent nature of osmotic regulation. Serum osmolality is predominantly governed by Na+ and Cl concentrations, which constitute >90% of extracellular osmotic activity. The observed 30-day increase might be ascribed to Na+/Cl dynamics.

3.3. Serum Biochemical Indices Analysis

Table 1 presents serum biochemical responses of freshwater drums to 14-day salinity exposure (0–12 ppt). It was found that total protein decreased significantly from 52.6  ±  4.47 g/L (0 ppt) to 36.80  ±  0.17 g/L (8 ppt) (p < 0.05), followed by a non-significant increase to 41.2 ± 2.95 g/L at 12 ppt. The intergroup differences were non-significant in total protein. Albumin showed the highest value at 0 ppt (15.96  ±  0.92 g/L), and a downward trend was observed at the salinity of 4 ppt (11.13  ±  3.82 g/L) and 8 ppt (10.83  ±  0.15 g/L), then increased to 12.43  ±  0.47 g/L at a salinity level of 12 ppt. Globulin exhibited similar trends as albumin, which declined from 36.66 ± 3.74 g/L (0 ppt) to 26.83 ± 7.95 g/L (4 ppt) and 25.96 ± 0.25 g/L (8 ppt), rising to 28.76 ± 2.63 g/L at 12 ppt. However, the ratio of albumin/globulin was stable at different salinity groups. Lipid profiles exhibited salinity-dependent modulation. Triglycerides, total cholesterol, low-density lipoprotein (LDL), and arteriosclerosis index decreased significantly in all salinity groups as compared to the control group (0 ppt) (p < 0.05), while no significant variations occurred among salinity-treated groups. High-density lipoprotein (HDL) increased significantly at 12 ppt (2.15 ± 0.28 mmol/L) as compared to 0 ppt (1.68 ± 0.18 mmol/L) (p < 0.05).
As shown in Table 2, following 30-day salinity exposure, protein profiles (total protein, albumin, globulin, and albumin/globulin ratio) showed no significant variations among salinity groups (0–12 ppt) and controls. However, lipid metabolism exhibited marked changes. Triglycerides significantly decreased from 4.62 ± 1.53 mmol/L (0 ppt) to 3.45 ± 1.73 mmol/L (4 ppt), 2.48 ± 1.02 mmol/L (8 ppt), and 2.14 ± 0.83 mmol/L (12 ppt), while HDL increased from 0.74 ± 0.24 mmol/L (0 ppt) to 1.73 ± 0.17 mmol/L (4 ppt), 1.54 ± 0.44 mmol/L (8 ppt), and 2.08 ± 0.17 mmol/L (12 ppt) (p < 0.05). The arteriosclerosis index declined from 9.83 ± 2.02 (0 ppt) to 3.23 ± 1.23 (4 ppt), 2.76 ± 0.92 (8 ppt), and 2.96 ± 0.55 (12 ppt) (p < 0.05). Notably, total cholesterol and LDH remained unaffected by salinity. At equivalent salinities, all measured parameters (protein fractions, lipids, and arteriosclerosis index) were consistently lower after 30 days compared to 14-day exposures.
Salinity has been demonstrated to significantly influence serum total protein levels in freshwater fish, though the observed effects vary across species and experimental conditions. In Notopterus notopterus, serum protein levels increased from 6.23 ± 0.6 mg/dL in the control group to 8.43 ± 0.7 mg/dL when exposed to 0.16% salinity, suggesting that this species undergoes substantial physiological adaptations to cope with saline stress [20]. Conversely, contrasting findings have been reported in other species. For instance, Gibelion catla exhibited significantly higher plasma protein levels in freshwater (0 ppt) compared to those exposed to 3 and 6 ppt salinities [21]. Additionally, the changes in the serum albumin and globulin were also in accordance with the study reported by Abdel-Rahim et al., which showed that the serum albumin and globulin were significantly higher at 24‰ and 32‰ salinity than those at 8‰ and 16‰ salinity groups [22]. The observed decrease in serum protein levels under certain salinity conditions may result from multiple physiological mechanisms, including suppressed or altered protein synthesis, enhanced proteolytic activity, and potential utilization of protein degradation products for metabolic processes during stress adaptation [23].
The impact of salinity on triglyceride levels has been documented in multiple studies. In goldfish (Carassius auratus), serum triglyceride levels presented a decrease from 306.67 mg/dL at the salinity of 0 ppt to 294 (6 ppt salinity) and 257.67 mg/dL (12 ppt salinity) [24]. Conversely, in the shi drum (Umbrina cirrosa), triglycerides increased at moderate salinities (4–10‰), rising from 3.1 ± 0.3 mmol/L to 7.1 ± 1.1 mmol/L, but decreased at a high salinity of 40‰ (4.7 ± 0.5 mmol/L) [25]. These findings suggest that triglycerides may serve as an energy reserve, with their depletion potentially supporting osmoregulatory adaptations under salinity stress.
Similarly, cholesterol levels also exhibit species-specific responses to salinity. In the mud crab (Scylla paramamosain), cholesterol concentrations were significantly lower at 25‰ compared to 4‰ and 12‰ during indoor overwintering [26]. In contrast, Notopterus notopterus exposed to 0.16% salinity exhibited a twofold increase in cholesterol compared to freshwater controls [20]. Given cholesterol’s critical role in energy metabolism, membrane stability, and lipoprotein synthesis, these variations may reflect differential metabolic demands under osmotic stress. The decrease in cholesterol at higher salinities could result from its utilization for energy production, whereas its increase may indicate enhanced lipid mobilization to sustain physiological adaptation.
The lipoprotein profile, particularly the balance between low-density lipoprotein (LDL) and high-density lipoprotein (HDL), serves as a critical indicator of cardiovascular health. LDL, often termed “bad cholesterol”, constitutes the majority of circulating cholesterol and is strongly associated with an increased risk of atherosclerosis, coronary artery disease, and stroke. In contrast, HDL (“good cholesterol”) functions to remove excess cholesterol from peripheral tissues and arterial walls, thereby reducing cardiovascular risk [27]. Our findings demonstrate that salinity exposure induces favorable changes in the lipoprotein profile of freshwater drums, characterized by a significant increase in HDL levels in 30 days and a concurrent decrease in LDL content in 14 days. This shift suggests that controlled salinity exposure may confer cardiovascular benefits in this species. Furthermore, a lower arteriosclerosis index was observed in the salinity-exposed groups compared to freshwater controls. Arteriosclerosis, a progressive vascular condition marked by arterial stiffening and lumen narrowing, develops through complex mechanisms involving chronic inflammation, lipid deposition, and hemodynamic stress [28]. The improved lipoprotein profile and lower arteriosclerosis index observed under saline conditions imply that salinity may mitigate these pathological processes. These findings position salinity modulation as a potential management strategy for enhancing cardiovascular health in cultured freshwater fish species.

3.4. Inorganic Ion Analysis

As shown in Table 3 and Table 4, inorganic ion concentrations in the blood of freshwater drums exhibited distinct responses to salinity gradients (0, 4, 8, 12 ppt) and rearing duration. Sodium (Na+) and chloride (Cl) ions dominated the ionic profile due to their substantially higher concentrations, while potassium (K+), calcium (Ca2+), phosphate (PO43−), and magnesium (Mg2+) ions were present in minor quantities. After 14 days of exposure (Table 3), Na+, K+, and Cl concentrations remained stable across all salinity levels. However, Ca2+, PO43−, and Mg2+ exhibited significant inverse relationships with salinity, decreasing progressively as salinity increased. Specifically, Ca2+ decreased progressively from 4.19 ± 0.22 mmol/L (0 ppt) to 2.83 ± 0.39 (4 ppt), 2.60 ± 0.30 (8 ppt), and 2.82 ± 0.29 mmol/L (12 ppt). PO43− declined from 3.07 ± 0.7 to 2.46 ± 0.39 (4 ppt), 1.94 ± 0.07 (8 ppt), and 1.89 ± 0.19 mmol/L (12 ppt). Mg2+ exhibited similar reductions from 2.03 ± 0.15 to 1.43 ± 0.19 (4 ppt), 1.19 ± 0.12 (8 ppt), and 1.32 ± 0.14 mmol/L (12 ppt).
Following prolonged exposure of 30 days (Table 4), a significant 2.4-fold increase in Cl concentrations from 53.10 ± 13.58 mmol/L (0 ppt) to 127.76 ± 12.80 mmol/L (12 ppt) (p < 0.05) was observed. Na+ showed a non-significant upward trend with increasing salinity. K+, Ca2+, PO43−, and Mg2+ maintained stable concentrations regardless of salinity. The accumulation of Na+ and Cl after prolonged exposure aligns with observed increases in plasma osmotic pressure, indicating that these ions drive osmotic compensation during long-term salinity adaptation. This pattern reflects the species’ capacity for ionoregulatory plasticity, wherein major electrolytes (Na+, Cl) respond dynamically to salinity stress over extended periods.
Our results demonstrate the ionic regulation under salinity stress. The observed stability of Na+, Ca2+, K+, and Mg2+ concentrations in freshwater drums aligns with findings in European sea bass (Dicentrarchus labrax), which maintained constant plasma ion levels across 5–33‰ salinity [29]. This suggests a common osmoregulatory strategy among diverse euryhaline species. The increase in Na+ and Cl concentrations also corresponded with the reported studies. East Java strain tilapia (Oreochromis niloticus) exhibited significant elevation in Na+ and Cl concentrations at 10–15 ppt but not at 0–5 ppt [3]. Similar results were also reported in hybrid yellow catfish, demonstrating progressive Na+ and Cl concentrations increase as the salinities ranging from 0 to 18‰ [30]. However, contrasting results also emerged in other species. For example, rainbow trout (Oncorhynchus mykiss) exhibit acute Na+/Cl spikes during short-term salinity stress but achieve lower steady-state concentrations during long-term adaptation [31]. Also, other studies revealed that potassium dynamics vary significantly by species under salinity conditions. East Java strain tilapia (Oreochromis niloticus) exposed to hypertonic environments (10 and 15 g/L salinity) exhibited reduced K+ than in the hypotonic environment (0 and 5 g/L salinity), suggesting their osmotic adaptation in hyperosmotic environments [3]. The opposite result was obtained in grass carp (Ctenopharyngodon idella) with a rise in K+ at 2 ppt followed by reduction at 6 ppt, attributed to Na+/K+-ATPase activation to control the balance of serum osmotic pressure in response to the increased salinity fluctuations [15]. Fish adaptability to salinity is mostly dependent on their capacity for ion absorption and excretion regulation. The increase in the concentration of chlorine and sodium ions indicated the osmotic efflux of water from the fish and the diffusional ion influx of electrolytes from the hyperosmotic environment. In our present study, the changes in the inorganic ion contents were mainly due to the osmoregulation of freshwater drums to adapt to salinity water.

3.5. Water-Holding Capacity Analysis

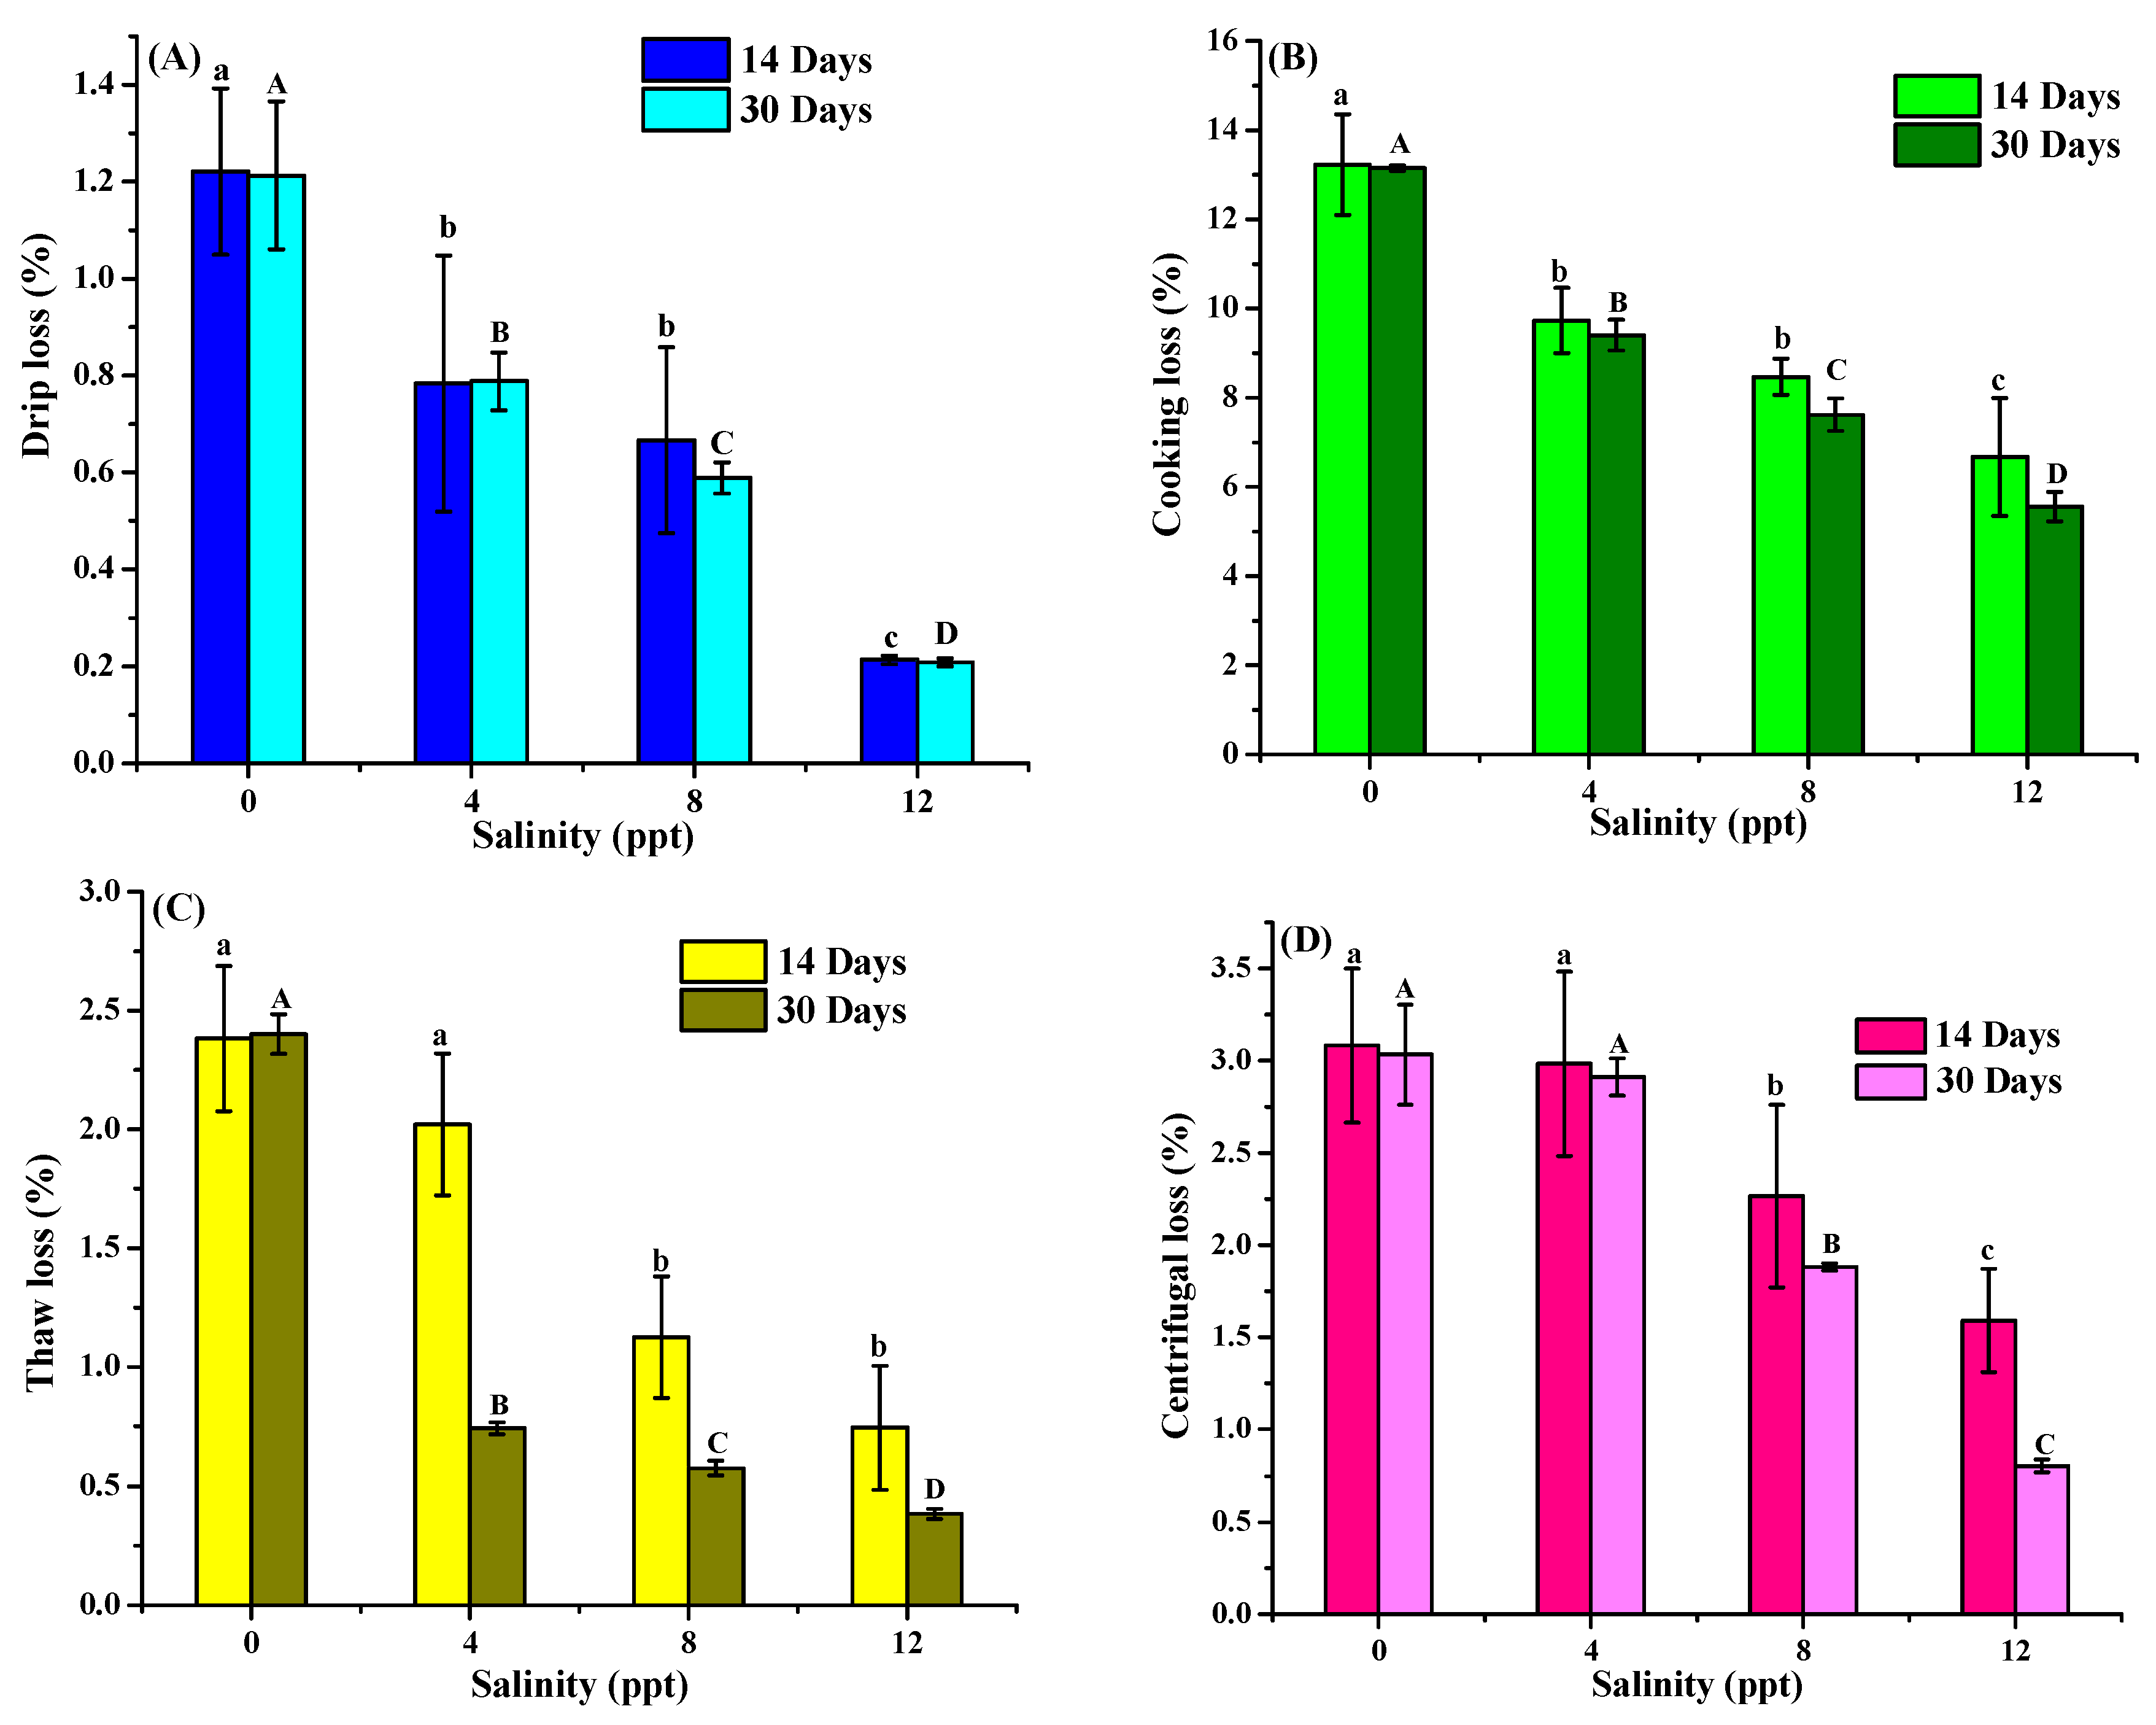
The effects of rearing duration and salinity treatment on water-holding capacity (WHC), including drip loss, cooking loss, thaw loss, and centrifugal loss, are displayed in Figure 3. After 14 days of rearing, drip loss values were 1.22 ± 0.17% (0 ppt), 0.82 ± 0.25% (4 ppt), 0.67 ± 0.19% (8 ppt), and 0.21 ± 0.01% (12 ppt), indicating a significant inverse relationship between salinity and drip loss (p < 0.05). This salinity-dependent reduction pattern was consistently observed in all WHC parameters (drip, cooking, thaw, and centrifugal losses) across both 14-day and 30-day rearing periods. It was also found that rearing duration specifically influenced thaw loss at identical salinities. The thaw loss was 2.02  ±  0.30%, 1.12  ±  0.25%, and 0.75  ±  0.26% at 4, 8, and 12 ppt salinity after 14 days of rearing, while it significantly decreased to 0.74  ±  0.03%, 0.58  ±  0.03%, and 0.39  ±  0.03% when the rearing time increased to 30 days at the same salinity. In contrast, no significant differences were detected in drip loss, cooking loss, or centrifugal loss between the two rearing durations at equivalent salinities.
These findings align with the previous reported studies that high water salinity resulted in high water-holding capacity. For example, grass carp (Ctenopharyngodon idellus) exhibited the highest water-holding capacity at 6‰ salinity as compared to 3‰ and 0‰ groups [32]. Similar salinity-dependent WHC enhancement was also observed in the blue tilapia (Oreochromis aureus) and largemouth bass (Micropterus salmoides) [5,33]. The observed WHC improvement in freshwater drums at higher salinities may be attributed to chloride ions interacting with muscle proteins, inducing protein swelling and subsequent water retention—a mechanism consistent with ion-protein interactions in saline environments [32].

3.6. Texture Profile Analysis

The effect of salinity and rearing duration on texture profile analysis (TPA) of freshwater drums is presented in Figure 4. It was shown that salinity significantly enhanced key textural properties of freshwater drums compared to the control group (0 ppt) after 14 and 30 days of rearing. Specifically, hardness increased from 453.11  ±  99.45 g (0 ppt) to 827.30  ±  72.50 g (12 ppt) at 14 days. The same trend was observed in 30 days as it enhanced from 588.45  ±  17.30 g (0 ppt) to 829.25  ±  169.40 g (12 ppt). Cohesiveness reached 0.37  ±  0.06, 0.48  ±  0.04, and 0.44  ±  0.02 in 14 days and 0.47, 0.37  ±  0.04, and 0.41  ±  0.02 in 30 days at the salinity of 4, 8, and 12 ppt, which was higher than the control group (0.32  ±  0.09 and 0.34  ±  0.09). Parallel enhancements occurred in gumminess, chewiness, and resilience across salinity treatments at both time points. Notably, cohesiveness, gumminess, chewiness, and resilience showed no significant differences between 14 days and 30 days of rearing at identical salinities. Springiness remained statistically unchanged across all groups. These findings were consistent with the report in largemouth bass (Micropterus salmoides), which exhibited enhanced muscle hardness, chewiness, gumminess, and adhesiveness at higher salinities for 10 weeks [5]. The salinity-induced textural improvements in freshwater drums might be attributed to water redistribution. Salinity promotes the transition of free water to immobilized states within muscle tissue, enhancing cohesion and reducing drip loss (as presented in Figure 3). Moreover, chloride ions (Cl) might bind to myofibrillar proteins, inducing electrostatic repulsion and protein matrix swelling, thereby increasing structural rigidity. Our present study demonstrates that moderate salinity (4–12 ppt) effectively optimizes the textural quality of freshwater drums muscle.

4. Conclusions

This study demonstrates that acclimation salinity significantly affects the physiological and flesh quality traits of freshwater drum (Aplodinotus grunniens). Elevated salinity levels influenced metabolic resource allocation, improved lipid metabolism, and enhanced osmotic regulation over time. Salinity also positively affected water-holding capacity and overall meat quality attributes. Based on the overall assessment, a 30-day acclimation period at 12 ppt salinity represents an optimal strategy for simultaneously improving fish health and product quality. Further studies are needed to assess the effects of higher salinity and prolonged rearing, as well as sensory quality traits, to better understand the role of salinity in improving freshwater drum production.

Author Contributions

Conceptualization, W.C. and H.W.; methodology, W.C., S.M.M. and H.C.; software, S.M.M.; validation, W.C. and S.M.M.; formal analysis, W.C. and S.M.M.; investigation, W.C., S.M.M. and H.C.; resources, W.C., X.M., W.J. and L.W.; data curation, W.C. and H.C.; writing—original draft preparation, W.C. and S.M.M.; writing—review and editing, W.C.; visualization, W.C.; supervision, H.W.; project administration, H.W. and P.X.; funding acquisition, W.C. and H.W. All authors have read and agreed to the published version of the manuscript.

Funding

This work was financially supported by the Central Public-interest Scientific Institution Basal Research Fund, Freshwater Fisheries Research Center, CAFS (Grant No. 2025JBFM03), the Innovation Project of Jiangsu Agricultural Science and Technology (Grant No. CX(20)2025), the Central Public-interest Scientific Institution Basal Research Fund, CAFS (Grant No. 2023TD64&2023TD66), the Seed Industry Research and Development of Taizhou (2023), and the Construction of Core Population and Conservation of Germplasm Resources of Freshwater Drum.

Institutional Review Board Statement

The study was approved by the Freshwater Fisheries Research Center of the Chinese Academy of Fishery Sciences (LAECFFRC-2023-12-01). All animal procedures were performed according to the Guideline for the Care and Use of Laboratory Animals in China.

Informed Consent Statement

Not applicable.

Data Availability Statement

The raw data supporting the conclusions of this article will be made available by the authors on request.

Conflicts of Interest

The authors declare no conflicts of interest.

References

  1. Abdel-Latif, H.M.R.; Ahmed, H.A.; Shukry, M.; Khafaga, A.F.; Elkhayat, B.K.; Abdel-Tawwab, M.; Abd-elaziz, R.A. Growth performance, physiological responses, and histoarchitectural changes in juvenile pangasianodon hypophthalmus under different environmental salinities. Fishes 2023, 8, 282. [Google Scholar] [CrossRef]
  2. Fang, H.; Yang, Y.Y.; Wu, X.M.; Zheng, S.Y.; Song, Y.J.; Zhang, J.; Chang, M.X. Effects and molecular regulation mechanisms of salinity stress on the health and disease resistance of grass carp. Front. Immunol. 2022, 13, 917497. [Google Scholar] [CrossRef]
  3. Soegianto, A.; Adhim, M.d.H.; Zainuddin, A.; Putranto, T.W.C.; Irawan, B. Effect of different salinity on serum osmolality, ion levels and hematological parameters of east java strain tilapia oreochromis niloticus. Mar. Freshw. Behav. Physiol. 2017, 50, 105–113. [Google Scholar] [CrossRef]
  4. Kissinger, B.C.; Enders, E.C.; Anderson, G.W. A salt on your senses: Influences of rearing environment on salinity preference and sensing in lake trout salvelinus namaycush. Environ. Biol. Fishes 2023, 106, 933–940. [Google Scholar] [CrossRef]
  5. Du, X.; Zhang, W.; He, J.; Zhao, M.; Wang, J.; Dong, X.; Fu, Y.; Xie, X.; Miao, S. The impact of rearing salinity on flesh texture, taste, and fatty acid composition in largemouth bass micropterus salmoides. Foods 2022, 11, 3261. [Google Scholar] [CrossRef] [PubMed]
  6. Luo, J.; Monroig, O.; Zhou, Q.; Tocher, D.R.; Yuan, Y.; Zhu, T.; Lu, J.; Song, D.; Jiao, L.; Jin, M. Environmental salinity and dietary lipid nutrition strategy: Effects on flesh quality of the marine euryhaline crab scylla paramamosain. Food Chem. 2021, 361, 130160. [Google Scholar] [CrossRef]
  7. Dharani, M.; Nayak, B.B.; Xavier, K.A.M.; Layana, P.; Balange, A.K. Meat quality assessment of common carp (Cyprinus carpio) reared in inland saline water. Indian J. Fish. 2024, 71, 109–114. [Google Scholar] [CrossRef]
  8. Song, C.; Wen, H.; Liu, G.; Ma, X.; Lv, G.; Wu, N.; Chen, J.; Xue, M.; Li, H.; Xu, P. Gut microbes reveal pseudomonas medicates ingestion preference via protein utilization and cellular homeostasis under feed domestication in freshwater drum, aplodinotus grunniens. Front. Microbiol. 2023, 14, 1259988. [Google Scholar] [CrossRef]
  9. Amankwah, J.F.; Jin, W.; Ma, X.; Xu, P.; Wen, H.; Amuneke, K.E.; Munganga, B.P.; Li, K.; Liu, J.; Li, H. Salinity tolerance in freshwater drum (Aplodinotus grunniens): Investigating biochemical, antioxidant, digestive enzyme, and gene expression responses to acute salinity stress. Animals 2025, 15, 1015. [Google Scholar] [CrossRef]
  10. Oz, M.; Inanan, B.E.; Karasahin, T.; Dikel, S. Effects of glutamine on growth performance, nutrient content, fatty acid profile, and blood parameters of rainbow trout (Oncorhynchus mykiss). J. Fish Biol. 2024, 104, 1213–1222. [Google Scholar] [CrossRef] [PubMed]
  11. Kim, H.; Hong, G.-P. Comparison of superchilling and supercooling on extending the fresh quality of beef loin. Foods 2022, 11, 2729. [Google Scholar] [CrossRef]
  12. Li, F.; Wang, B.; Kong, B.; Xia, X.; Bao, Y. Impact of ultrasound-assisted saline thawing on the technological properties of mirror carp (Cyprinus carpio L.). Ultrason. Sonochem. 2022, 86, 106014. [Google Scholar] [CrossRef]
  13. Song, D.; Yun, Y.; Mi, J.; Luo, J.; Jin, M.; Nie, G.; Zhou, Q. Effects of faba bean on growth performance and fillet texture of yellow river carp, cyprinus carpio haematopterus. Aquac. Rep. 2020, 17, 100379. [Google Scholar] [CrossRef]
  14. Ningsih, L.; Sulmartiwi, L.; Lutfiyah, L. The profile of carassius auratus growth and hepatosomatic index in different salinity. Earth Environ. Sci. 2020, 441, 012114. [Google Scholar] [CrossRef]
  15. Liu, D.; Zhang, Z.; Song, Y.; Yang, J.; Lu, Y.; Lai, W.; Wu, Z.; Zhao, D.; Lin, H.; Zhang, Y.; et al. Effects of salinity on growth, physiology, biochemistry and gut microbiota of juvenile grass carp (Ctenopharyngodon idella). Aquat. Toxicol. 2023, 258, 106482. [Google Scholar] [CrossRef]
  16. Mirghaed, A.T.; Ghelichpour, M. Effects of anesthesia and salt treatment on stress responses, and immunological and hydromineral characteristics of common carp (Cyprinus carpio, linnaeus, 1758) subjected to transportation. Aquaculture 2019, 501, 1–6. [Google Scholar] [CrossRef]
  17. Moorman, B.P.; Lerner, D.T.; Grau, E.G.; Seale, A.P. The effects of acute salinity challenges on osmoregulation in mozambique tilapia reared in a tidally changing salinity. J. Exp. Biol. 2015, 218, 731–739. [Google Scholar] [CrossRef]
  18. Urbina, M.A.; Glover, C.N. Effect of salinity on osmoregulation, metabolism and nitrogen excretion in the amphidromous fish, inanga (Galaxias maculatus). J. Exp. Mar. Biol. Ecol. 2015, 473, 7–15. [Google Scholar] [CrossRef]
  19. Nordlie, F.G. Environmental influences on regulation of blood plasma/serum components in teleost fishes: A review. Rev. Fish Biol. Fish. 2009, 19, 481–564. [Google Scholar] [CrossRef]
  20. Kavya, K.S.; Kulkarni, R.S.; Jadesh, M. Some blood biochemical changes in response to saline exposure in the fresh water fish, notopterus notopterus (Pallas). Int. Lett. Nat. Sci. 2015, 49, 19–23. [Google Scholar] [CrossRef]
  21. Ahirwal, S.K.; Das, P.C.; Sarma, K.; Kumar, T.; Singh, J.; Kamble, S.P. Effect of salinity changes on growth, survival and biochemical parameters of freshwater fish Gibelion catla (Hamilton, 1822). J. Environ. Biol. 2021, 42, 1519–1525. [Google Scholar] [CrossRef]
  22. Abdel-Rahim, M.M.; Lotfy, A.M.; Toutou, M.M.; Aly, H.A.; Sallam, G.R.; Abdelaty, B.S.; Helal, A.M. Effects of salinity level on the survival, growth, feed utilization, carcass composition, haematological and serum biochemical changes of juvenile meagre (Argyrosomus regius) (asso, 1801) grown in ground saltwater. Aquac. Res. 2020, 51, 1038–1050. [Google Scholar] [CrossRef]
  23. Martínez-Alvarez, R.M.; Hidalgo, M.C.; Domezain, A.; Morales, A.E.; García-Gallego, M.; Sanz, A. Physiological changes of sturgeon acipenser naccarii caused by increasing environmental salinity. J. Exp. Biol. 2002, 205, 3699–3706. [Google Scholar] [CrossRef] [PubMed]
  24. Imanpoor, M.R.; Najafi, E.; Kahir, M. Effect of different salinity and temperatures on the growth, survival, hematocrit, and serum biochemistry of goldfish (Carassius auratus). Aquac. Res. 2012, 43, 332–338. [Google Scholar] [CrossRef]
  25. Mylonas, C.C.; Pavlidis, M.; Papandroulakis, N.; Zaiss, M.M.; Tsafarakis, D.; Papadakis, I.E.; Varsamos, S. Growth performance and osmoregulation in the shi drum (Umbrina cirrosa) adapted to different environmental salinities. Aquaculture 2009, 287, 203–210. [Google Scholar] [CrossRef]
  26. Li, N.; Zhou, J.; Wang, H.; Wang, C.; Mu, C.; Shi, C.; Liu, L. Effects of light intensity on growth performance, biochemical composition, fatty acid composition and energy metabolism of scylla paramamosain during indoor overwintering. Aquac. Rep. 2020, 18, 100443. [Google Scholar] [CrossRef]
  27. Chang, K.-H.; Cheng, M.-L.; Lo, C.-J.; Fan, C.-M.; Wu, Y.-R.; Chen, C.-M. Alternations of lipoprotein profiles in the plasma as biomarkers of huntington’s disease. Cells 2023, 12, 385. [Google Scholar] [CrossRef]
  28. Naito, Y.; Tsujino, T.; Masuyama, T.; Ishihara, M. Crosstalk between iron and arteriosclerosis. J. Atheroscler. Thromb. 2022, 29, 308–314. [Google Scholar] [CrossRef] [PubMed]
  29. Eroldogan, O.T.; Kumlu, M. Growth performance, body traits and fillet composition of the european sea bass (Dicentrarchus labrax) reared in various salinities and fresh water. Turk. J. Vet. Anim. Sci. 2002, 26, 993–1001. [Google Scholar]
  30. Nam, P.T.; Huon, D.T.T. The osmoregulation and growth of hybrid yellow catfish juvenile (Clarias macrocephalus gunther x Clarias gariepinus) exposed to the different salinities. Can Tho Univ. J. Sci. 2011, 20, 39–47. [Google Scholar]
  31. Huang, M.; Yang, X.; Zhou, Y.; Ge, J.; Davis, D.A.; Dong, Y.; Gao, Q.; Dong, S. Growth, serum biochemical parameters, salinity tolerance and antioxidant enzyme activity of rainbow trout (Oncorhynchus mykiss) in response to dietary taurine levels. Mar. Life Sci. Technol. 2021, 3, 449–462. [Google Scholar] [CrossRef] [PubMed]
  32. Zhang, X.; Shen, Z.; Qi, T.; Xi, R.; Li, L.; Tang, R.; Li, D. Slight increases in salinity improve muscle quality of grass carp (Ctenopharyngodon idellus). Fishes 2012, 6, 7. [Google Scholar] [CrossRef]
  33. Zhou, K.; Chen, Z.; Qin, J.; Huang, Y.; Du, X.; Zhang, C.; Pan, X.; Lin, Y. Effects of salinity on muscle nutrition, fatty acid composition, and substance anabolic metabolism of blue tilapia oreochromis aureus. J. Appl. Ichthyol. 2024, 2024, 5549406. [Google Scholar] [CrossRef]
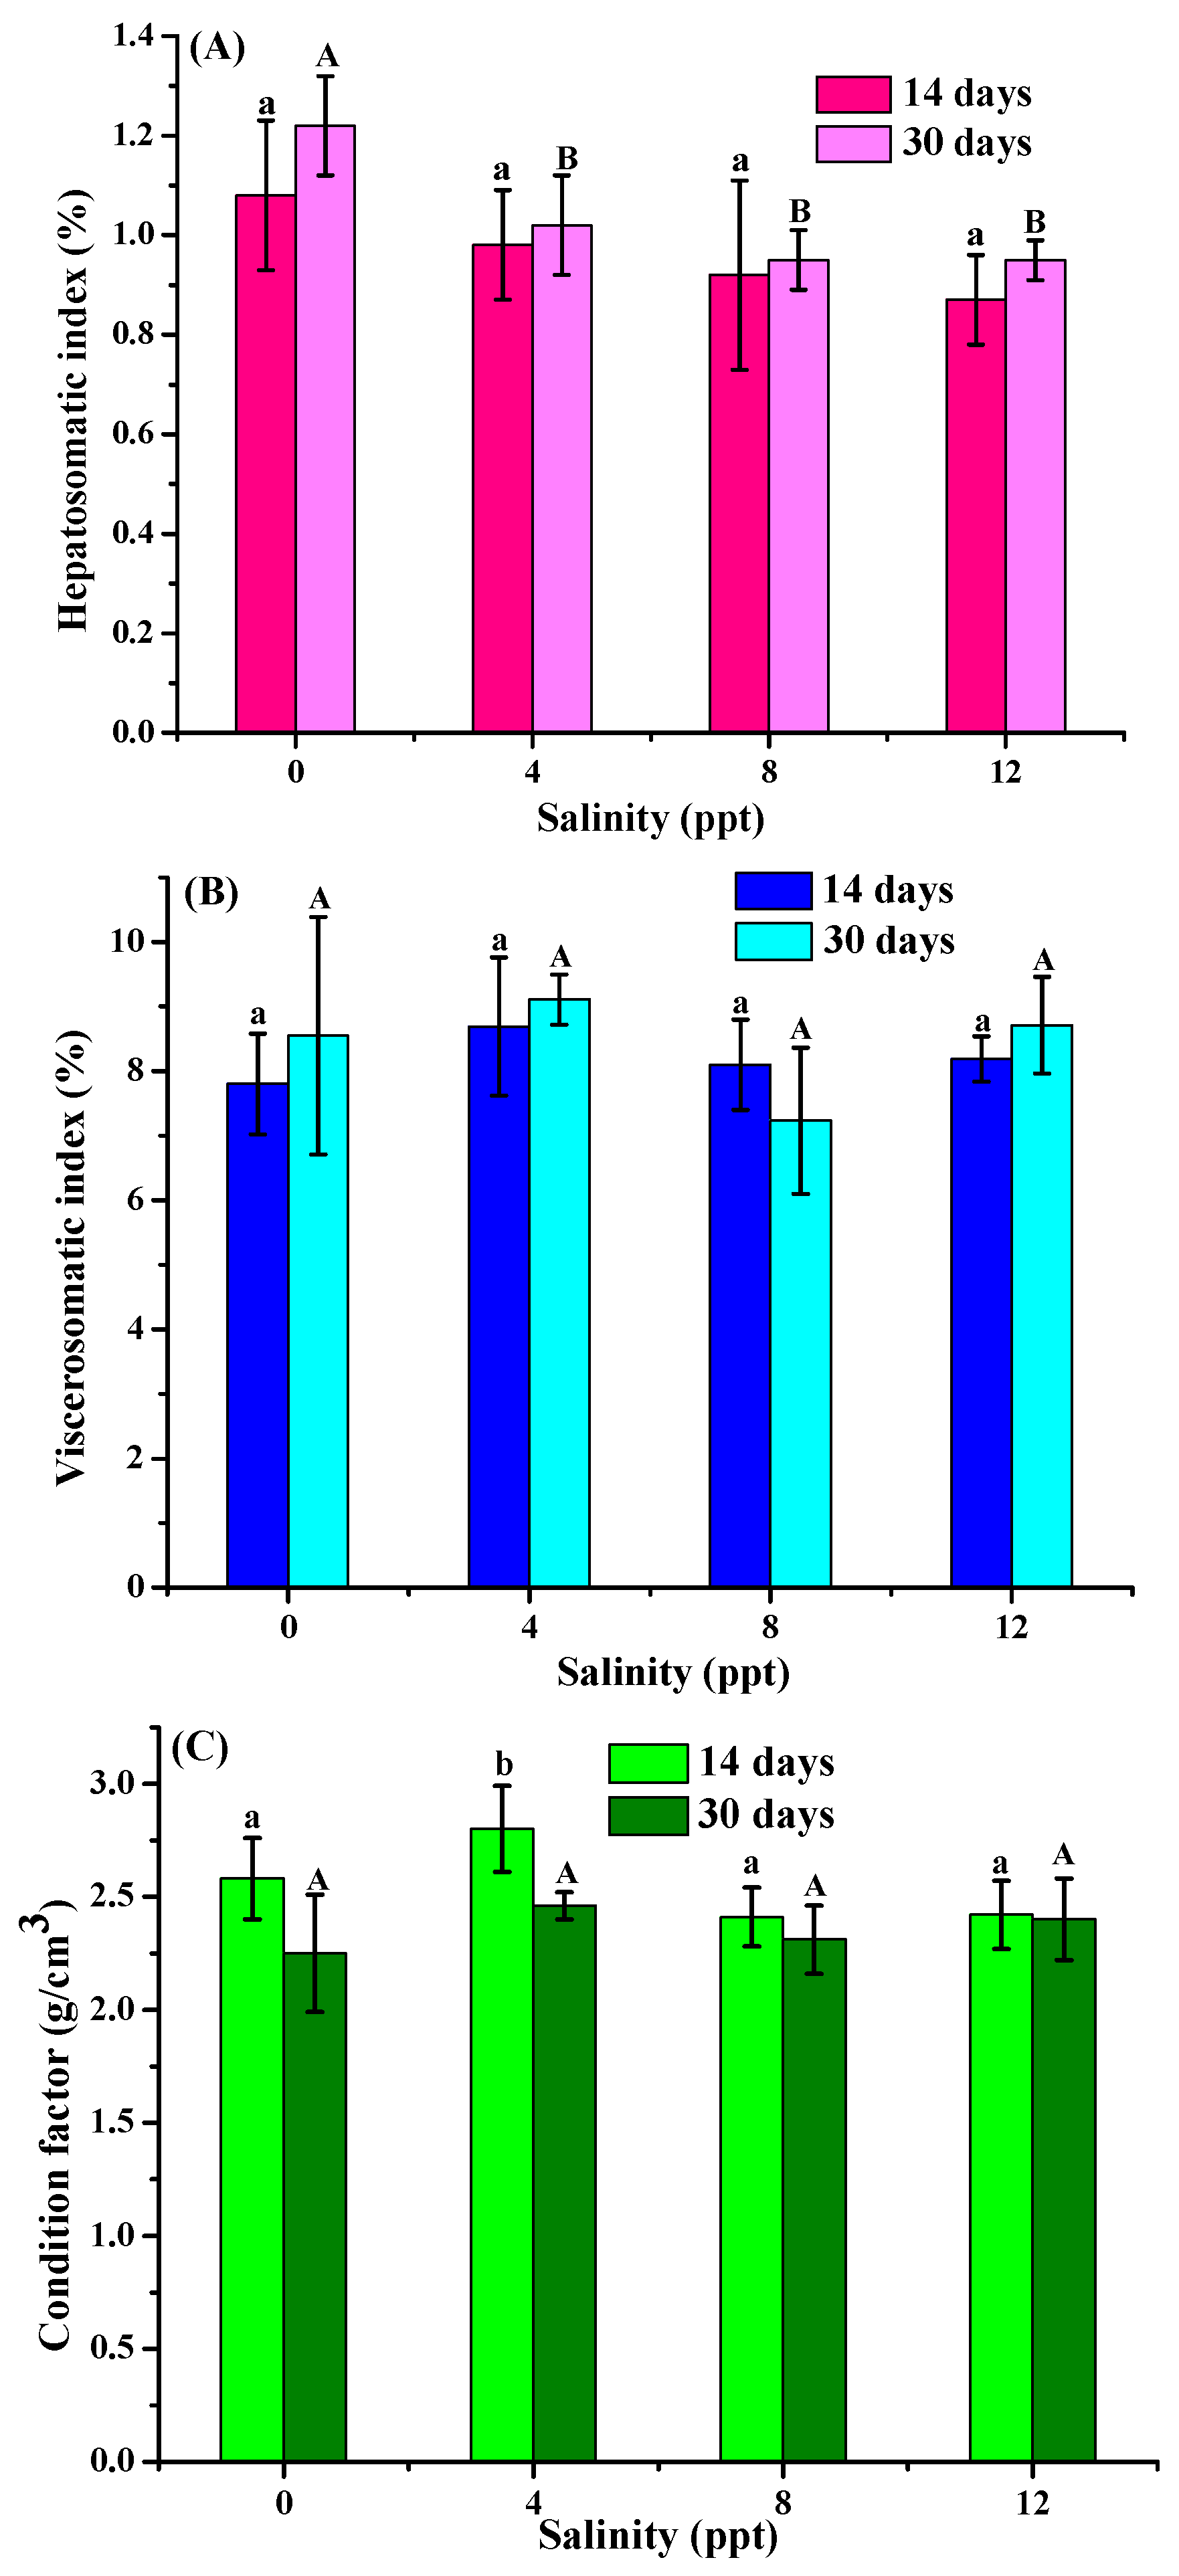
Figure 1. The hepatosomatic index (A), viscerosomatic index (B), and condition factor (C) of freshwater drums (Aplodinotus grunnien) reared in different salinity levels for 14 and 30 days. Values are expressed as mean ± standard deviation (n = 12). Lowercase and uppercase letters indicate differences among various salinity treatments within 14 and 30 days, respectively. Different letters represent significant differences at p < 0.05.
Fishes 10 00437 g001
Figure 2. Effect of different salinity levels on the osmotic pressure of freshwater drums (Aplodinotus grunnien). Values are expressed as mean ± standard deviation (n = 12). Values are expressed as mean ± standard deviation (n = 12). Lowercase and uppercase letters indicate differences among various salinity treatments within 14 and 30 days, respectively. Different letters represent significant differences at p < 0.05.
Fishes 10 00437 g002
Figure 3. Effects of rearing duration (14 vs. 30 days) and salinity treatment (0, 4, 8, 12 ppt) on water-holding capacity parameters of freshwater drums (Aplodinotus grunniens): (A) drip loss, (B) cooking loss, (C) thaw loss, and (D) centrifugal loss. Values are expressed as mean ± standard deviation (n = 6). Values are expressed as mean ± standard deviation (n = 12). Lowercase and uppercase letters indicate differences among various salinity treatments within 14 and 30 days, respectively. Different letters represent significant differences at p < 0.05.
Fishes 10 00437 g003
Figure 4. Effects of rearing duration and salinity on hardness (A), springiness (B), cohesiveness (C), gumminess (D), chewiness (E), and resilience (F). in freshwater drums (Aplodinotus grunniens). Values are expressed as mean ± standard deviation (n = 6). Values are expressed as mean ± standard deviation (n = 12). Lowercase and uppercase letters indicate differences among various salinity treatments within 14 and 30 days, respectively. Different letters represent significant differences at p < 0.05.
Fishes 10 00437 g004
Table 1. Effect of salinity gradient (0, 4, 8, 12 ppt) on serum biochemical indices in freshwater drums (Aplodinotus grunniens) after 14 days. Values are expressed as mean ± standard deviation (n = 12).
Serum Biochemical Indices Salinity (ppt)
14 Days04812
Total protein (g/L)52.6 ± 4.47 a37.96 ± 11.75 b36.80 ± 0.17 b41.2 ± 2.95 ab
Albumin (g/L)15.96 ± 0.92 a11.13 ± 3.82 b10.83 ± 0.15 b12.43 ± 0.47 ab
Globulin (g/L)36.66 ± 3.74 a26.83 ± 7.95 b25.96 ± 0.25 b28.76 ± 2.63 ab
Albumin/Globulin0.43 ± 0.02 a0.41 ± 0.03 a0.41 ± 0.01 a0.43 ± 0.02 a
Triglyceride (mmol/L)7.89 ± 1.86 a3.09 ± 1.02 b3.35 ± 0.63 b1.72 ± 0.23 b
Total cholesterol (mmol/L)11.93 ± 1.36 a8.11 ± 1.36 b6.89 ± 0.67 b8.96 ± 1.05 b
High-density lipoprotein (mmol/L)1.68 ± 0.18 a1.67± 0.02 a1.51 ± 0.06 a2.15 ± 0.28 b
Low-density lipoprotein (mmol/L)1.76 ± 0.41 a1.00 ± 0.30 b0.79 ± 0.26 b1.06 ± 0.18 b
Arteriosclerosis index6.16 ± 1.45 a3.86 ± 0.90 b3.56 ± 0.28 b3.16 ± 0.15 b
Note: Different letters represent significant differences between different salinity groups at p < 0.05.
Table 2. Effect of salinity gradient (0, 4, 8, 12 ppt) on serum biochemical indices in freshwater drums (Aplodinotus grunniens) after 30 days. Values are expressed as mean ± standard deviation (n = 12).
Serum Biochemical Indices Salinity (ppt)
30 Days04812
Total protein (g/L)40.60 ± 8.77 a33.23 ± 5.76 a35.80 ± 14.12 a40.26 ± 5.02 a
Albumin (g/L)12.40 ± 3.29 a9.60 ± 1.73 a10.53 ± 4.57 a12.00 ± 0.96 a
Globulin (g/L)28.20 ± 5.49 a23.63 ± 4.09 a25.26 ± 9.57 a28.26 ± 4.14 a
Albumin/Globulin0.43 ± 0.03 a0.40 ± 0.02 a0.41 ± 0.03 a0.42 ± 0.03 a
Triglyceride (mmol/L)4.62 ± 1.53 a3.45 ± 1.73 a2.48 ± 1.02 a2.14 ± 0.83 a
Total cholesterol (mmol/L)8.07 ± 3.50 a7.24 ± 1.58 a6.00 ± 3.26 a8.17 ± 0.61 a
High-density lipoprotein (mmol/L)0.74 ± 0.24 a1.73 ± 0.17 b1.54 ± 0.44 b2.08 ± 0.17 b
Low-density lipoprotein (mmol/L)0.90 ± 0.50 a0.85 ± 0.28 a0.90 ± 0.83 a1.01 ± 0.24 a
Arteriosclerosis index9.83 ± 2.02 a3.23 ± 1.23 b2.76 ± 0.92 b2.96 ± 0.55 b
Note: Different letters represent significant differences between different salinity groups at p < 0.05.
Table 3. Effect of salinity gradient (0, 4, 8, 12 ppt) on blood inorganic ion concentrations in freshwater drums (Aplodinotus grunniens) after 14 days. Values are expressed as mean ± standard deviation (n = 12).
Inorganic Ions (mmol/L)Salinity (ppt)
14 days04812
Potassium1.36 ± 0.43 a1.43 ± 0.66 a0.92 ± 0.30 a0.95 ± 0.50 a
Sodium167.20 ± 19.29 a151.56 ± 17.06 a148.83 ± 15.94 a164.20 ± 16.62 a
Chlorine119.63 ± 19.71 a122.00 ± 13.09 a125.03 ± 15.63 a135.36 ± 15.88 a
Calcium4.19 ± 0.22 a2.83 ± 0.39 b2.60 ± 0.30 b2.82 ± 0.29 b
Phosphate3.07 ± 0.75 a2.46 ± 0.39 ab1.94 ± 0.07 b1.89 ± 0.19 b
Magnesium2.03 ± 0.15 a1.43 ± 0.19 b1.19 ± 0.12 b1.32 ± 0.14 b
Note: Different letters represent significant differences between different salinity groups at p < 0.05.
Table 4. Effect of salinity gradient (0, 4, 8, 12 ppt) on blood inorganic ion concentrations in freshwater drums (Aplodinotus grunniens) after 30 days. Values are expressed as mean ± standard deviation (n = 12).
Inorganic Ions (mmol/L)Salinity (ppt)
30 days04812
Potassium1.09 ± 0.38 a0.86 ± 0.35 a1.00 ± 0.20 a1.46 ± 1.09 a
Sodium130.00 ± 19.96 a151.10 ± 21.77 a161.13 ± 38.48 a161.36 ± 12.87 a
Chlorine53.10 ± 13.58 a115.63 ± 18.36 b124.46 ± 30.83 b127.76 ± 12.80 b
Calcium3.45 ± 0.70 a2.55 ± 0.38 a2.88 ± 1.17 a3.16 ± 0.39 a
Phosphate2.85 ± 0.83 a2.11 ± 0.60 a2.92 ± 0.98 a2.36 ± 0.34 a
Magnesium1.83 ± 0.47 a1.55 ± 0.31 a1.57 ± 0.48 a1.64 ± 0.24 a
Note: Different letters represent significant differences between different salinity groups at p < 0.05.
Disclaimer/Publisher’s Note: The statements, opinions and data contained in all publications are solely those of the individual author(s) and contributor(s) and not of MDPI and/or the editor(s). MDPI and/or the editor(s) disclaim responsibility for any injury to people or property resulting from any ideas, methods, instructions or products referred to in the content.