Article

A Quantitative Approach to Prior Setting for Relative Biomass (B/k) in CMSY++: Application to Snow Crabs (Chionoecetes opilio) in Korean Waters

1
Distant Water Fisheries Resources Division, National Institute of Fisheries Science, Busan 46083, Republic of Korea
2
Division of Marine Production System Management, Pukyong National University, Busan 48513, Republic of Korea
3
Fisheries Resources Research Center, National Institute of Fisheries Science, Tongyeong 53064, Republic of Korea
*
Author to whom correspondence should be addressed.
Fishes 2025, 10(8), 400; https://doi.org/10.3390/fishes10080400
Submission received: 1 July 2025 / Revised: 30 July 2025 / Accepted: 5 August 2025 / Published: 11 August 2025
(This article belongs to the Special Issue Modeling Approach for Fish Stock Assessment)

Abstract

Snow crabs (Chionoecetes opilio), a commercially valuable species in Korean waters, have been managed under the Total Allowable Catch (TAC) system since 2002. However, stock assessment has been limited due to difficulties in estimating key ecological traits such as growth, maturity, and mortality. In this study, the Bayesian Schaefer Model (BSM), implemented within CMSY++ framework, was applied to assess the stock status of snow crabs in Korean waters. BSM requires catch and abundance index data, such as catch per unit effort (CPUE) or biomass, as well as prior information on species resilience and relative biomass (B/k). To improve the reliability of B/k priors, we developed a method to calculate them quantitatively using fishery data, sales amounts, and biological information, unlike the qualitative assumptions on stock and fishing conditions proposed in previous research. Two standardized CPUE indices with differing temporal trends in recent years were used as abundance indices. To address the structural uncertainty associated with these divergent trends, we applied a grid-based approach by treating each CPUE index as an independent model scenario and integrating the posterior distributions. A total of 12,000 posterior estimates (6000 per index) were generated through the BSM and used to construct a Kobe plot. Results indicate that the current biomass is slightly above the level supporting maximum sustainable yield, and fishing mortality slightly below the optimal level, suggesting that the stock is healthy and sustainably exploited. Future research should aim to establish a systematic framework for developing quantitative B/k priors to enhance stock assessment accuracy.
Key Contribution: Stock assessment of snow crabs in Korean waters was performed using BSM, enhanced by a quantitative prior specification method. The newly developed quantitative prior specification method can further improve the accuracy of BSM results.

1. Introduction

The snow crab (Chionoecetes opilio) inhabits the East Sea in Korea, the Sea of Okhotsk, the Bering Sea north of the Alaska Peninsula, and the eastern edge of the Arctic Ocean near Cape Perry. It inhabits depths ranging from shallow coastal areas to approximately 450 m [1]. Snow crabs are a commercially valuable fishery resource, primarily harvested in the East Sea of Korea using gillnets and pots. Since the implementation of the Total Allowable Catch (TAC) for snow crabs in offshore gillnets and pots in 2002, the average annual catch has been approximately 2.3 thousand tons for 2022–2023 [2].
Various ecological studies have been conducted on snow crabs, including temporal and spatial variability in size at maturity [3], and the estimation of maximum sustainable yield (MSY) using a state-space stock assessment model with time-varying natural mortality [4]. Additionally, a stock-specific management procedure for snow crab fisheries was developed using state-space surplus production models (SSPMs) [5]. However, studies in Korea have mainly focused on ecological aspects, such as the vertical distribution of larvae [6], molting and growth [7], and maturation and spawning of snow crabs [8], with very limited work on stock assessment. This is largely due to the biological nature of snow crabs: once they reach a carapace width of approximately 40 mm, they molt annually [7], resulting in irregular growth patterns. These characteristics make it difficult to quantitatively estimate population dynamics and accurately assess stock status. Nevertheless, because snow crabs are a commercially important species in Korean coastal and offshore fisheries, their stock status should be assessed using methods that reflect their biological characteristics and fishery dynamics for sustainable use under the TAC system.
In data limited fisheries, several Bayesian stock assessment models have been developed and widely applied, including CMSY++, JABBA, and SPiCT. These models commonly require prior information on key biological parameters such as the intrinsic growth rate (r), carrying capacity (k), and relative biomass (B/k), which significantly influence the reliability of assessment outcomes. JABBA (Just Another Bayesian Biomass Assessment) enhances robustness by incorporating multiple prior scenarios and conducting sensitivity analyses, in particular evaluating the influence of B/k priors relative to observed abundance trends [9]. SPiCT (Stochastic Production Model in Continuous Time) applies weakly informative priors for r and k, typically based on biological parameters from databases such as FishBase, and assesses the impact of prior assumptions, particularly on process errors, through model diagnostics and predictive performance [10]. However, prior setting in these models has predominantly relied on qualitative assumptions or heuristic classifications, which may limit objectivity and reproducibility of the assessment results.
Among them, CMSY++ is a state-space Bayesian method for stock assessment consisting of two models: CMSY (catch MSY), which deals with only catch, and the Bayesian Schaefer Model (BSM), which uses catch and abundance data (biomass or CPUE), along with prior information on species resilience (r) and relative biomass (B/k), to estimate MSY-based fisheries management points such as stock status ( B / B M S Y ) and fishing pressure ( F / F M S Y ) [11]. In CMSY++, the prior distribution of B/k can be specified for the start, intermediate, and end years of a time series. Froese et al. [11] proposed qualitative guidelines for assigning these prior distributions, considering stock levels, fishing pressure, catch size, economics, etc. However, the application of these qualitative B/k priors requires careful consideration, because they can directly influence the outcomes of stock assessments [12].
In this study, the Bayesian Schaefer Model (BSM) within the CMSY++ framework was applied to assess the stock status of snow crabs in Korean waters, a species with limited data for which age- or size-structured models are difficult to apply. To minimize the uncertainty caused by subjective judgment in the prior setting of the relative biomass ( B / k ), we developed a quantitative approach based on objective criteria using available fishery data and biological information.

2. Materials and Methods

2.1. Bayesian Schaefer Model (BSM)

To estimate MSY-based fishery reference points for snow crab stocks in Korean waters, the Bayesian Schaefer Model (BSM), which is based on the surplus production model, was applied.
B t + 1 = B t + r 1 B t k B t C t
B t + 1 = B t + 4 B t k r 1 B t k B t C t   |   B t k < 0.25
where B t is the biomass in year t , r is the intrinsic rate of population increase, k is the carrying capacity (unexploited biomass), and C t is the catch in year t .
The BSM, as implemented in the CMSY++ package, accounted for both process and observation errors. It estimates the posterior distributions of key parameters r , k , and the catchability coefficient q using prior information on species resilience, historical catch records, and CPUE or biomass data. Model fitting was performed via the Markov Chain Monte Carlo (MCMC) method implemented in JAGS [12].

2.2. Used Data

The BSM requires catch and abundance indices (CPUE or biomass) as input data. For snow crabs in Korean waters, annual catches from 1970 to 2023 were used [2], and standardized CPUEs from 2010 to 2023 were used as abundance indices. Standardized indices for the key snow crab fisheries, the coastal offshore gillnet fisheries, were provided by the National Institute of Fisheries Science (NIFS) [13]. We used these two types of standardized CPUEs: one is an index using fishing information, effort and catch data collected by observers from the Korea Fisheries Resources Agency (FIRA) on TAC-participating offshore gillnet vessels from 2012 to 2023 (hereafter referred to as “TAC data”), and the other is an index using fishing information, effort and catch data reported by offshore and coastal gillnet vessels to the Fishery Radio Station [14] from 2010 to 2023 (hereafter referred to as “RS data”). The CPUE standardizations were performed using Generalized Linear Models (GLMs), with year, month, location (30′ × 30′ grid cells), and vessel size (<20 tons, 20–40 tons, >40 tons) included as explanatory variables to account for spatio-temporal effects and differences in fishing power. The TAC dataset was obtained exclusively from offshore gillnet fisheries under TAC management, whereas the RS dataset encompassed a broader range of operations, including both coastal and offshore gillnet fisheries.

2.3. Prior Information

2.3.1. Resilience

Resilience refers to the ability of a fish population to recover to a stable state after being depleted or reduced by external factors such as fishing pressure or environmental changes [15]. Froese et al. [16] proposed prior ranges for the intrinsic rate of population increase ( r ) based on four categories of species resilience: high (0.6–1.5), medium (0.2–0.8), low (0.05–0.5), and very low (0.015–0.1). In this study, the prior range of r for snow crabs was determined with reference to the SeaLifeBase [17]. According to the database, the estimate of r was 0.58, with a 95% confidence interval of 0.38–0.87. Thus, the resilience level was classified as “medium” and accordingly, the prior for r was set within the range of 0.2–0.8.

2.3.2. Quantitative Prior Setting for Relative Biomass (B/k)

B/k represents the relative stock size, with values ranging from 0 to 1 (0 < B/k ≤ 1). A value close to one indicates a nearly unexploited stock, whereas a value close to zero suggests a highly depleted stock. In the BSM, the prior information for B/k can be specified for the start, intermediate, and final years of the time series. For snow crabs, the start and final years were set to 1970 and 2023, respectively, and the intermediate year was set to 2008 because the catch increased steadily after 2003, peaked in 2007, and then decreased significantly thereafter.
Froese et al. [11] classified the prior ranges of B/k into five categories based on the biological status of the stock, fishing pressures, economics, etc. However, because this classification is qualitative, the selection of B/k for each period can vary depending on the analyst’s interpretation. If the prior values are poorly defined, the model may converge to unrealistic combinations of r and k . Therefore, in this study, we developed a method to estimate the prior values of B/k more objectively by selecting indicators based on the qualitative criteria proposed by Froese et al. [11] and to calculate them quantitatively using available data related to the fishery and biology of snow crabs.
Five indicators were selected to evaluate the stock status and fishing pressure for snow crabs: annual total catch, sales amount, catch of fisheries subject to TAC, mean catch size, and vulnerability due to non-TAC fisheries (Table 1). A baseline is used to score the stock level for each indicator. Appendix A provides detailed data sources and time coverage for each indicator.
To determine the prior distribution of B/k for the start, intermediate, and final years, the indicator scores for each year were calculated as follows: first, for each indicator, the rate was computed by dividing the annual value by the baseline value. Then, the score of the indicators (IS), except for catch mean size, was calculated using Equations (3) and (4): Equation (3) was applied to indicators in which a lower value of the indicator than the baseline indicated a better stock level, and Equation (4) was applied to indicators in which a higher value of the indicator than the baseline indicated a better stock level. As in the approach proposed by Froese et al. [11], the closer the IS is to 1, the healthier the stock. Equation (5) was applied as an indicator of the mean catch size. Unlike the other indicators, this indicator uses the maximum value as a reference.
I S = 1 0.5 × V a l u e   f o r   t h e   y e a r B a s e l i n e
I S = 0.5 × V a l u e   f o r   t h e   y e a r B a s e l i n e
I S = V a l u e   f o r   t h e   y e a r B a s e l i n e
The indicator scores for the year calculated using Equations (3)–(5) were weighted according to the relative importance of each indicator and averaged, as in Equation (6).
B / k = i = 1 n w i I S i i = 1 n w i
where i is an indicator, n is the total number of indicators, w i is the weight based on the relative importance of indicator i , and I S i is the score for indicator i .
The weighted average was used as the B/k value for the year, and the upper and lower bounds of the B/k range were set by applying a ±0.2 interval to the calculated value as in Froese et al. [11].

2.4. Model Diagnostics

To evaluate the performance and robustness of the BSM implemented in this study, two diagnostic approaches, the posterior-prior variance ratio (PPVR) and retrospective analysis, were applied to two model scenarios using TAC data-based and RS data-based CPUE indices.
First, the PPVR was computed for key parameters, including r, k, MSY, and B/k. The PPVR was used to evaluate how much prior information influenced the model estimates and how effectively the data contributed to updating the assumptions based on prior information [18]. A PPVR value less than 1.0 indicates substantial learning from the data, whereas a value close to or greater than 1.0 suggests limited or uncertain updating of the prior information. For each parameter, prior and posterior distributions were also visualized to qualitatively assess directional shifts and reductions in uncertainty.
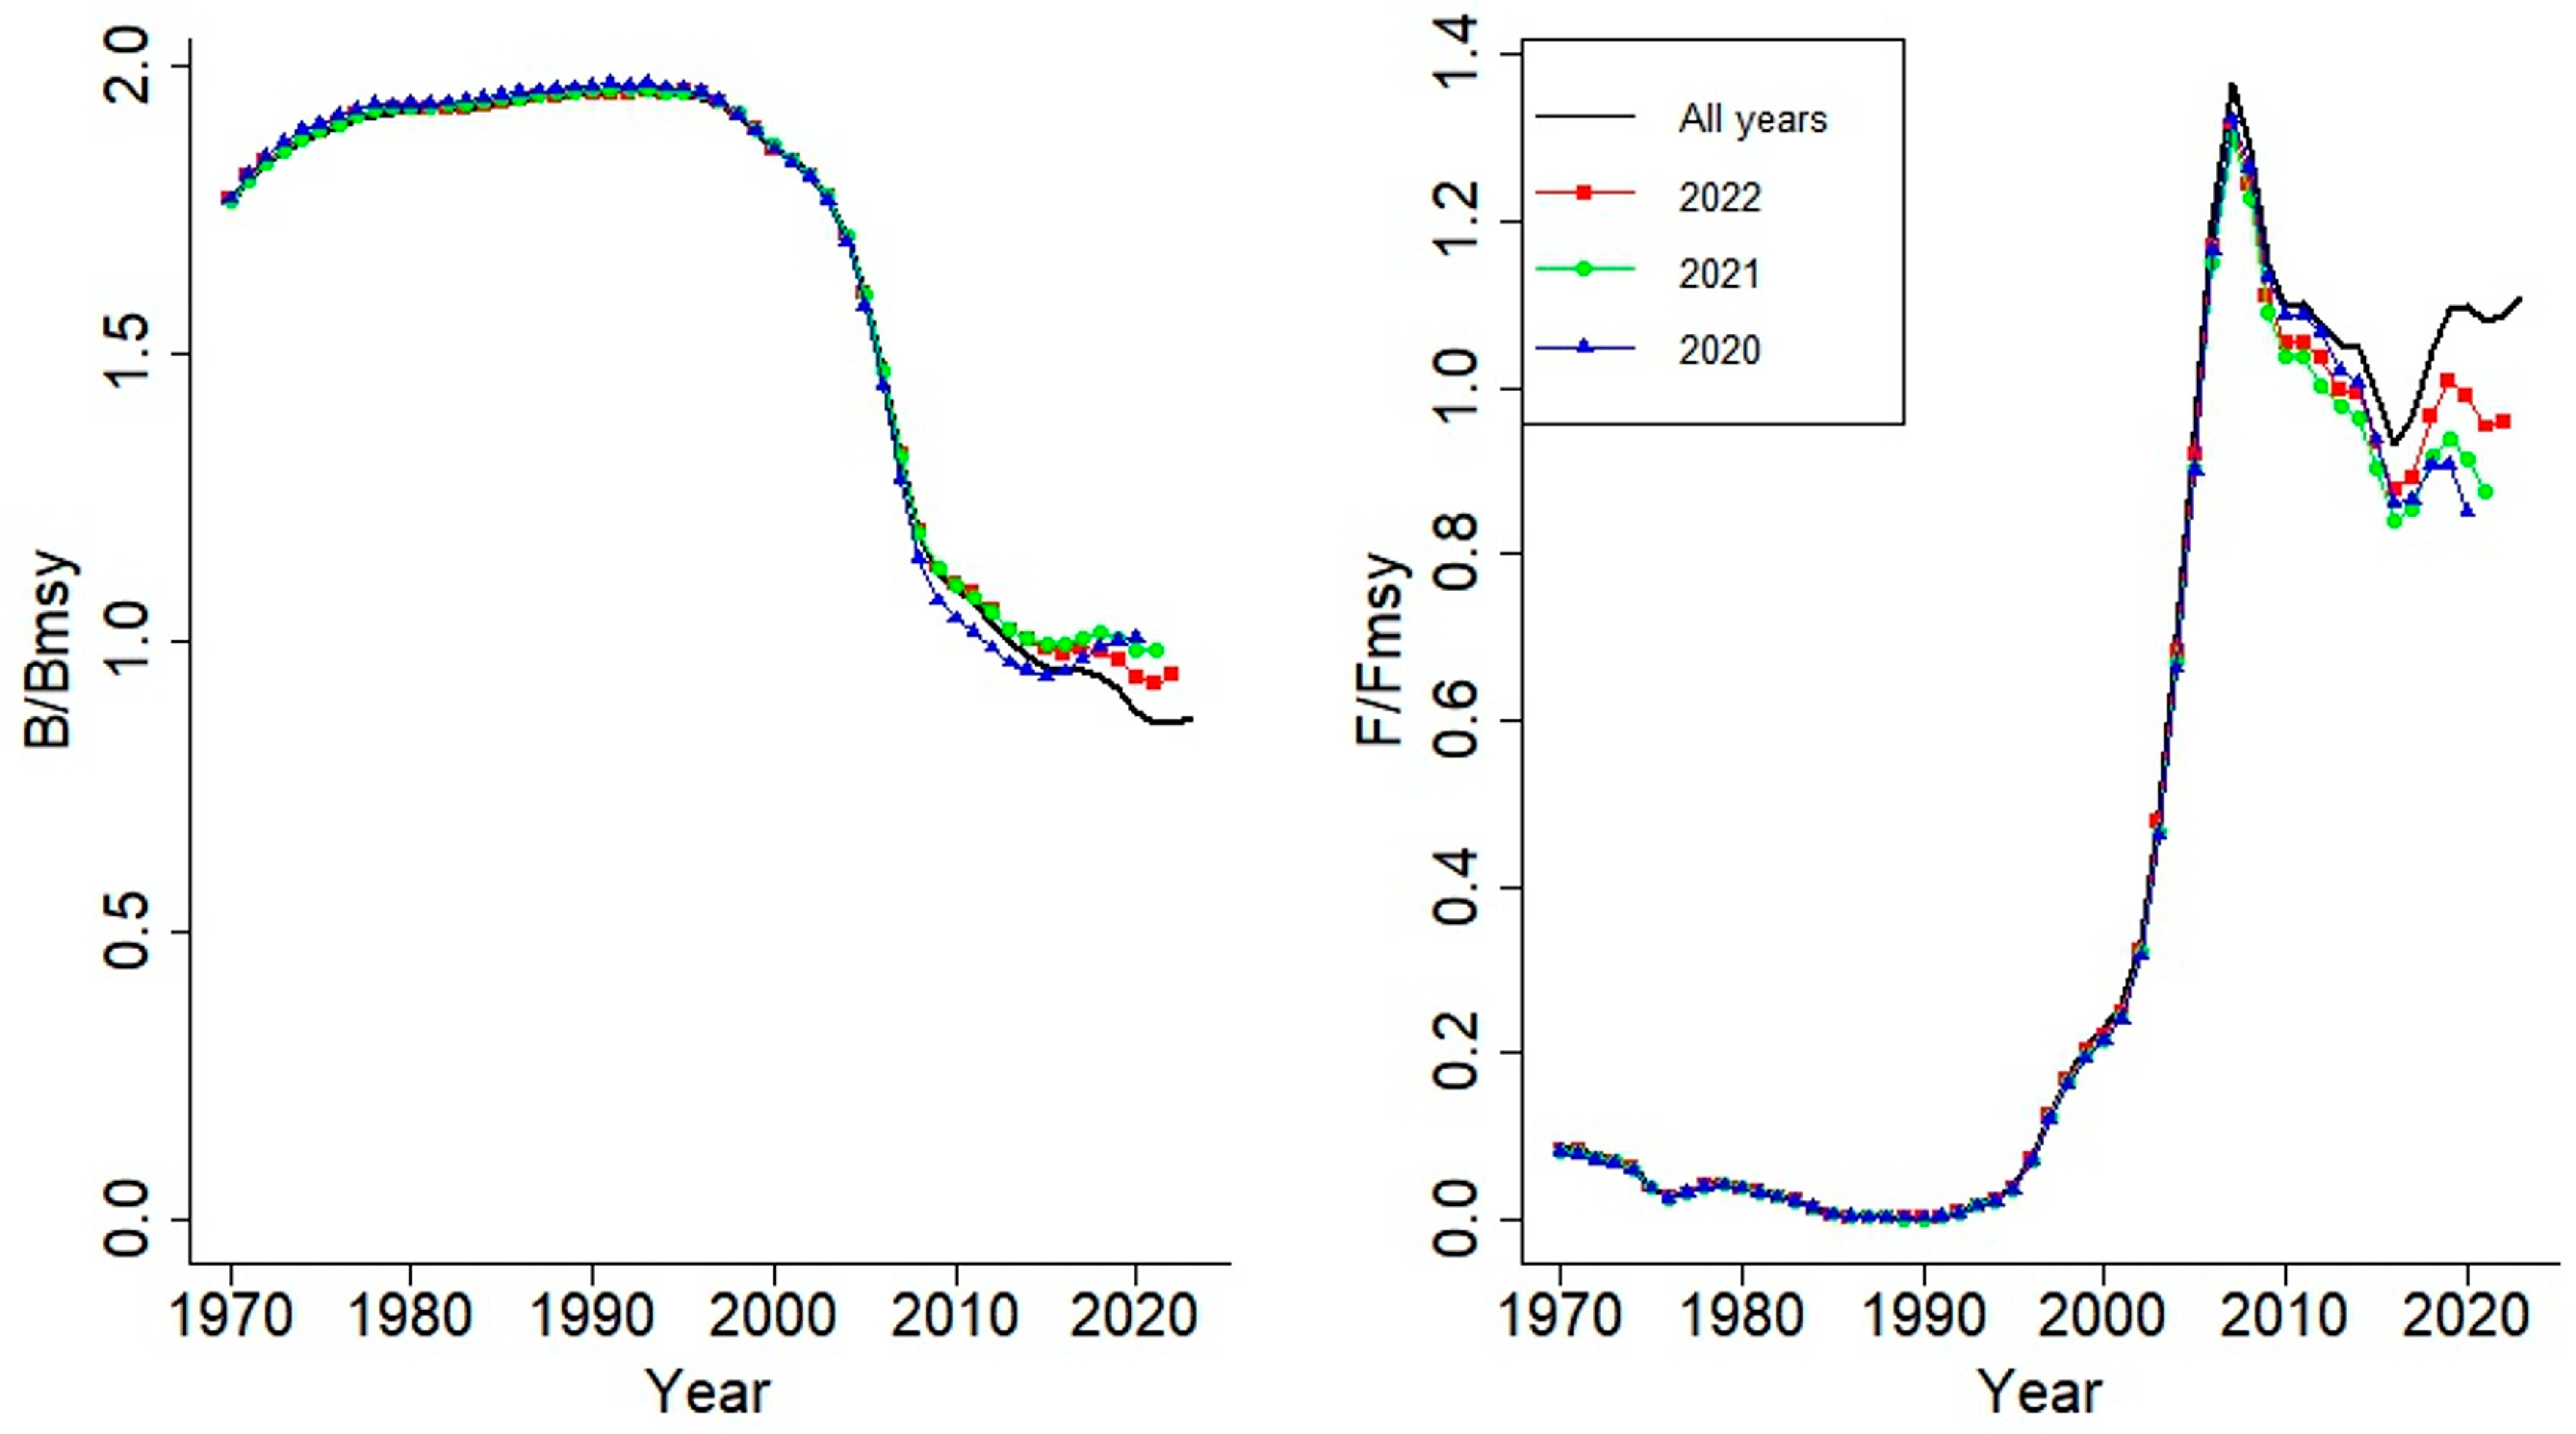
Second, the retrospective analysis was performed by sequentially removing the most recent years (2023 to 2021) from the time series to evaluate the temporal stability of the estimated stock status. The consistency of estimated relative biomass (B/BMSY) and fishing mortality (F/FMSY) across truncated datasets was evaluated to assess the sensitivity of the model to recent data.
These diagnostics were used to evaluate the robustness of the model, examine the influence of alternative abundance indices, and enhance the transparency and reliability of the stock assessment results.

3. Results

3.1. Trends in Catch and CPUE

The annual catch trend of snow crabs in Korean waters from 1970 to 2023 shows a marked change after the implementation of the TAC in 2002. Subsequently, the catch began to increase significantly, peaking at approximately 4.8 thousand tons in 2007. Since then, the catch has decreased gradually, and the average catch for the last five years (2019–2023) was approximately 2.0 thousand tons (Figure 1).
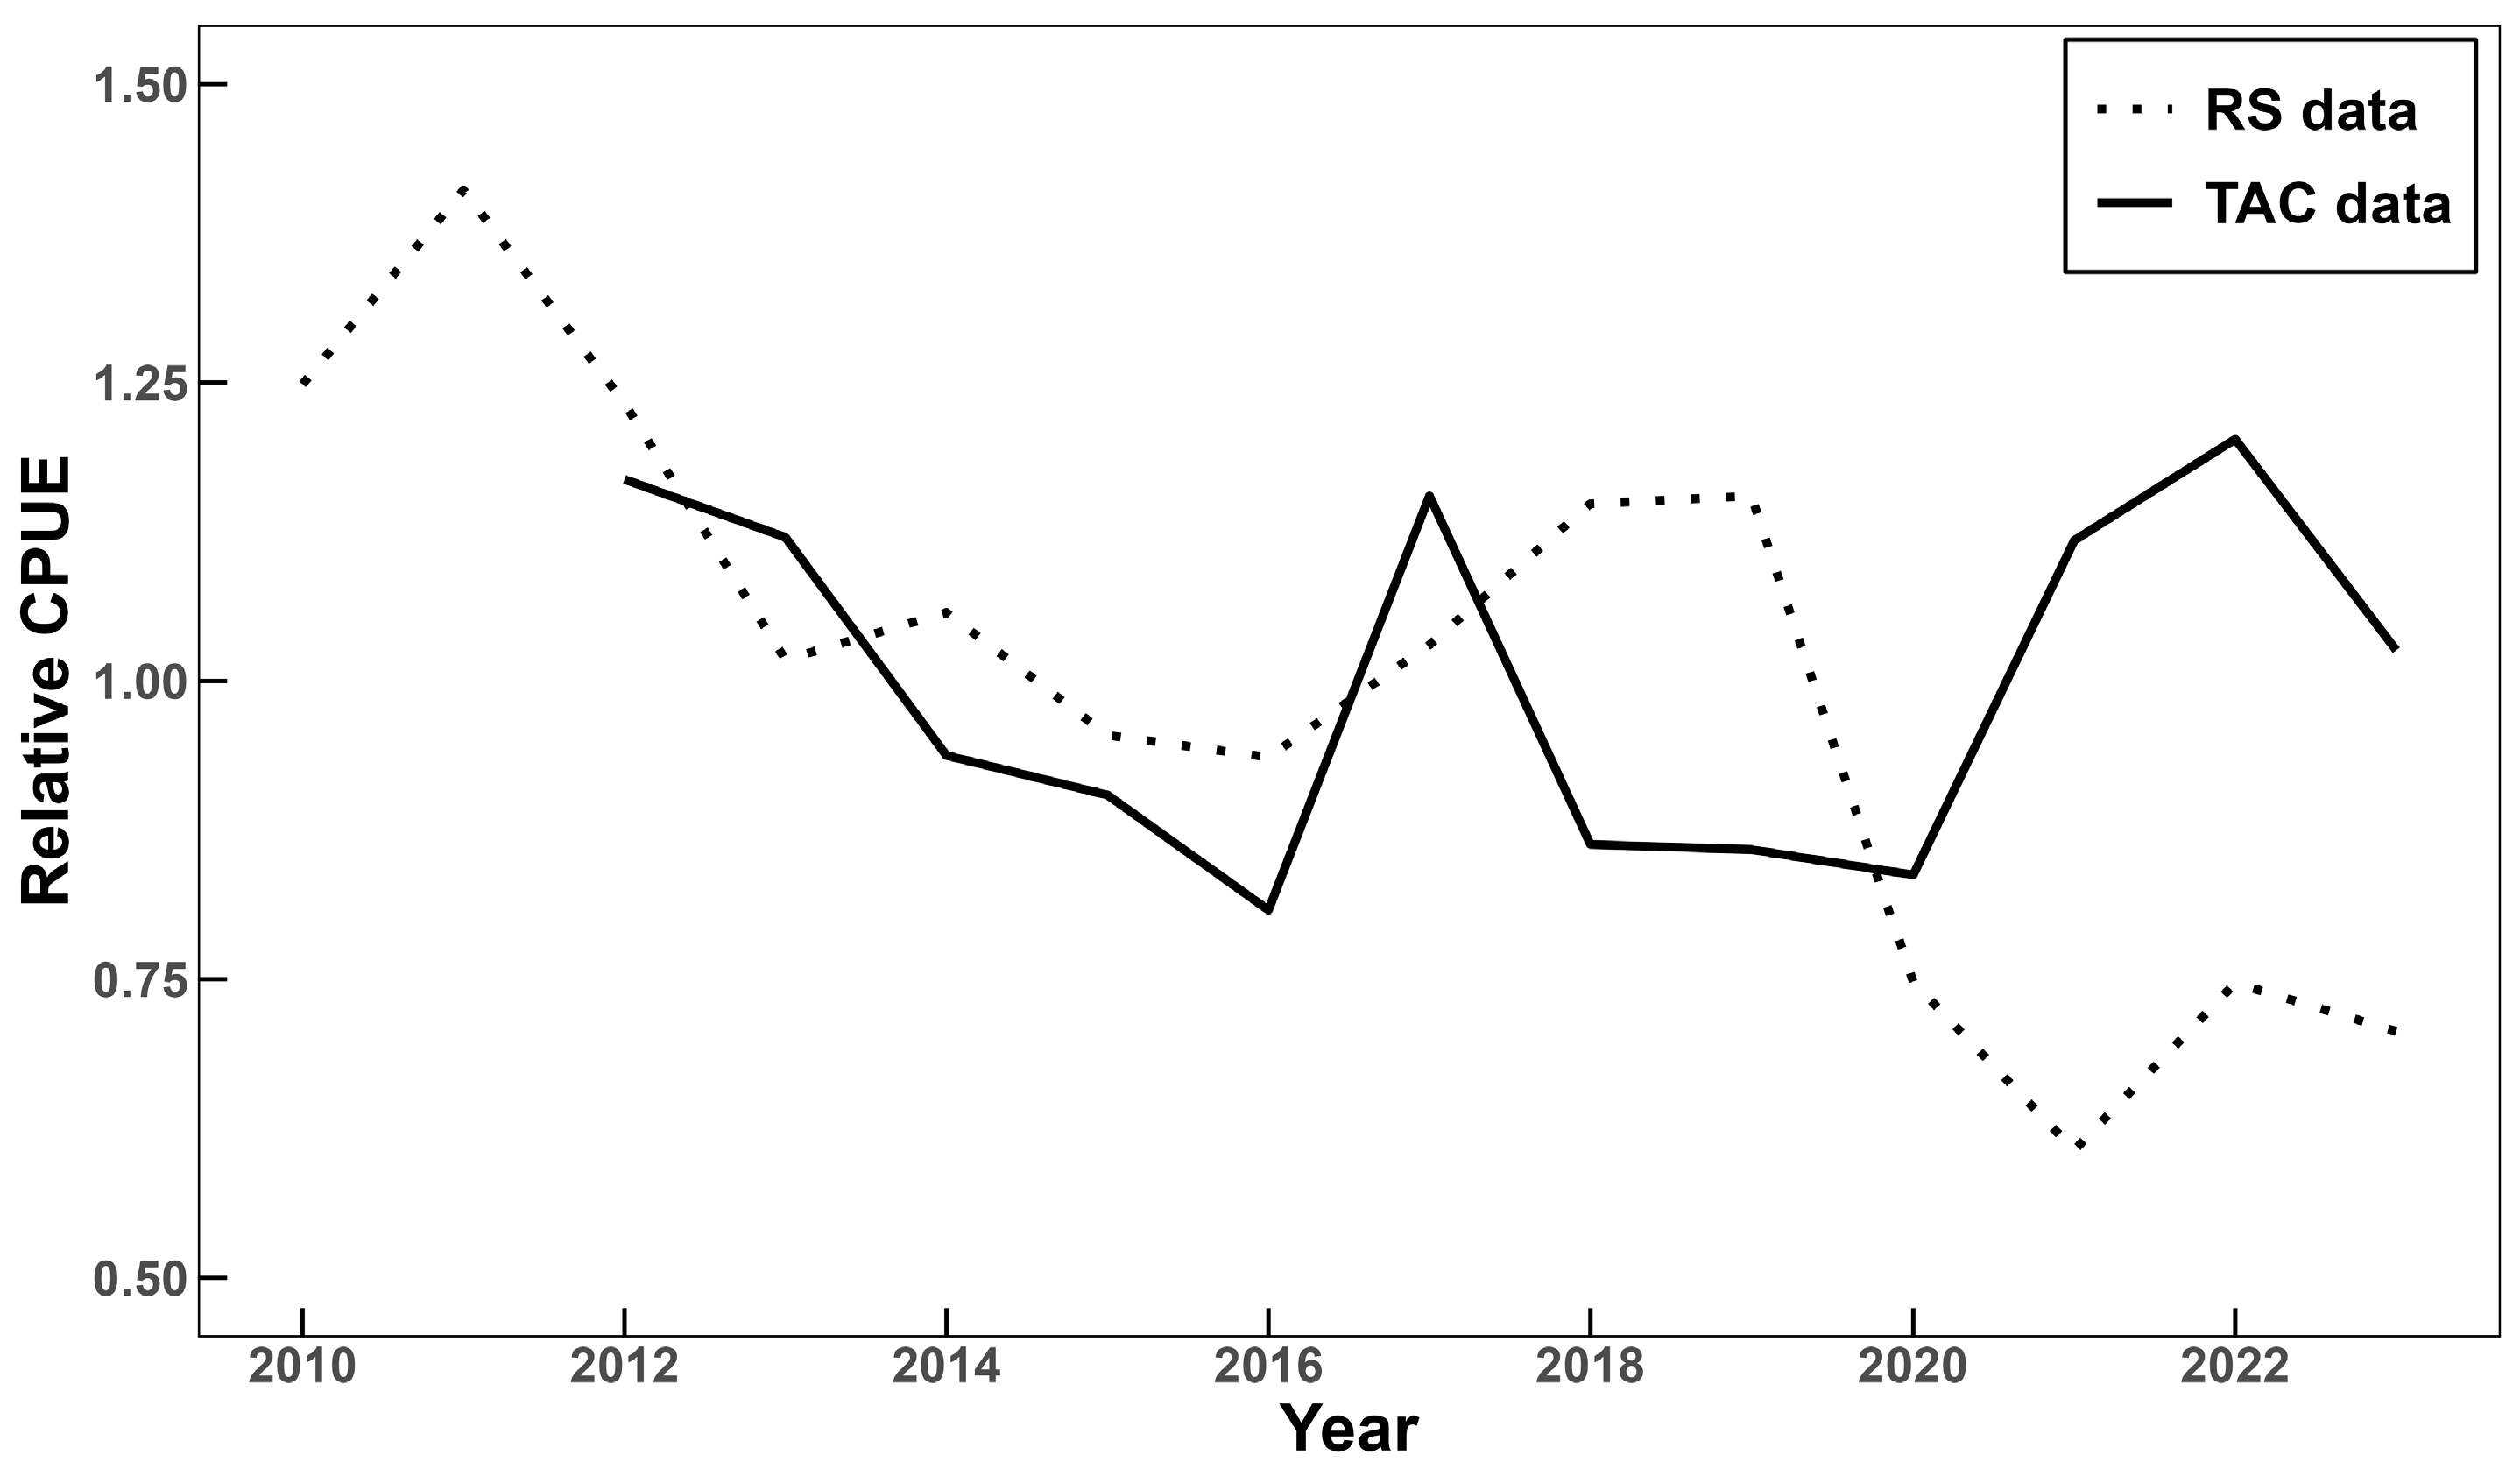
The standardized CPUEs used in this study exhibited different patterns between the TAC and RS data, which was one of the major differences reflected in the BSM results (Figure 2). While the TAC data-based CPUE fluctuated within a certain range from 2012 to 2023, the RS data-based CPUE showed an overall decreasing trend from 2010 to 2023 and decreased significantly after 2020.

3.2. B/k Prior Estimation Based on Quantitative Indicators

The baseline values for each indicator and the values for the start, intermediate, and end years for setting B/k for each year are listed in Table 2.
For the indicators of annual total catch and sales amount, the baselines were set to reflect long-term harvest trends, using average values calculated over the longest possible time series for each indicator. The average total catch was calculated for the period 2002–2023, when TAC was implemented, excluding the previous years because catches were too small. The average sales amount was calculated for the period 1990–2023, for which data are available. The baseline for the indicator of the catch of fisheries subject to TAC was defined as the TAC quota for the corresponding year, and the baseline for the start year when TAC was not implemented was set as the average quota from 2002 to 2023, when TAC was implemented. The indicator of mean catch size used the maximum annual average carapace width (CW) as the reference. The vulnerability indicator that represents the impacts of other fisheries not targeting snow crabs was created using the TAC quota as the baseline to allow the comparison of catches from non-TAC fisheries with those from TAC fisheries. Therefore, the baselines were set to be the same as those of the catches of fisheries subjected to the TAC.
Table 3 lists the actual values of these indicators for each year.
For the start year (1970), only data on total annual catch were available. The values for other indicators were assumed as follows: the sales amount was given the average value from 1990 to 2023 (baseline), and the catch of fisheries subject to TAC was assumed to be the total catch for the year, although TAC had not yet been implemented at that time. The catch size was considered the maximum size (baseline), considering that the snow crab stock was healthy at that time, and vulnerability to other fisheries was assumed to be 10% of the total catch for the year, because the catch was too small.
For the intermediate year (2008), data on total annual catch, catch by fishery, and sales amount were obtained from KOSIS [2]. Because CW data were available from 2012 onwards, the value for this year was based on the average CW from 2012 to 2014, which were the closest years. The catch of fisheries subject to the TAC was the sum of the catch by offshore gillnets and pots, and vulnerability was the catch, excluding the catch of fisheries subject to the TAC, from the total catch.
All values for the end year (2023) were available from KOSIS [2] and NIFS.
The rates calculated by dividing the actual value for each year by the baseline for each indicator are summarized in Table 4.
Table 5 presents the indicator scores calculated using Equations (3)–(5), and the weights assigned to each indicator. The indicator score (IS) of the total catch was close to 1 in the start year (depletion level: very low; based on Froese et al. [11]), but decreased significantly thereafter, reaching approximately half the value in the end year (medium), and the IS of sales amount gradually increased throughout the study period. The IS of catch of fisheries subject to TAC dropped below 0.5 in the intermediate year (medium) when the catch exceeded the allocated quota, and the IS of mean catch did not show a significant difference by year. Meanwhile, the IS of vulnerability showed the lowest value of 0.23 in the end year (medium) owing to an increase in recent catches from coastal fisheries that were not subject to TAC regulation.
A weighting scheme ranging from 1 to 3 was applied to the selected indicators to reflect the relative importance of each indicator as well as the availability and reliability of the data. This scheme was developed using a context-specific multi-criteria decision-making approach, which emphasizes indicator relevance and data quality rather than relying on arbitrary or uniform weighting methods [19]. Total catch was assigned the highest weight (3), as it serves as the most direct proxy of fishing pressure and is typically the most consistently recorded indicator across years [20]. Vulnerability to non-TAC fisheries was considered of moderate weight (2), given its secondary but notable influence on stock dynamics. The remaining indicators were assigned lower weights (1) due to greater uncertainty or limited direct linkage to biomass trends.
The B/k values (weighted mean) for each year were calculated by applying the values and weights of each indicator using Equation (6) and are listed in Table 6. And following Froese et al. [11], the upper and lower bounds of the B/k were set by ±20% from the weighted mean. Here, for the start year, B/k was estimated to be 0.9, so we followed the best stock condition suggested by Froese et al. [11], which was in the range of 0.75–1.0. Therefore, in this study, the priors of B/k for use in BSM were quantitatively calculated using a new method.

3.3. Stock Status

3.3.1. Biomass and Exploitation Estimates

Using the TAC data-based CPUE and B/k values derived from the quantitative approach as prior information, the stock status of snow crabs by the BSM showed that the relative biomass (B/BMSY) had a decreasing trend from 2004 to 2008, maintained a relatively constant level thereafter, and then increased slightly since 2016 (Figure 3a). The current biomass (B) is higher than the BMSY, indicating that the stock is not overfished (B/BMSY > 1). The exploitation rate gradually increased from 1996, peaked in 2007 (F/FMSY > 1), when the maximum catch was recorded, and then decreased, remaining below the MSY level from 2010 (Figure 3b). The current fishing pressure (F) is lower than that of the FMSY, indicating that overfishing is not occurring (F/FMSY < 1).
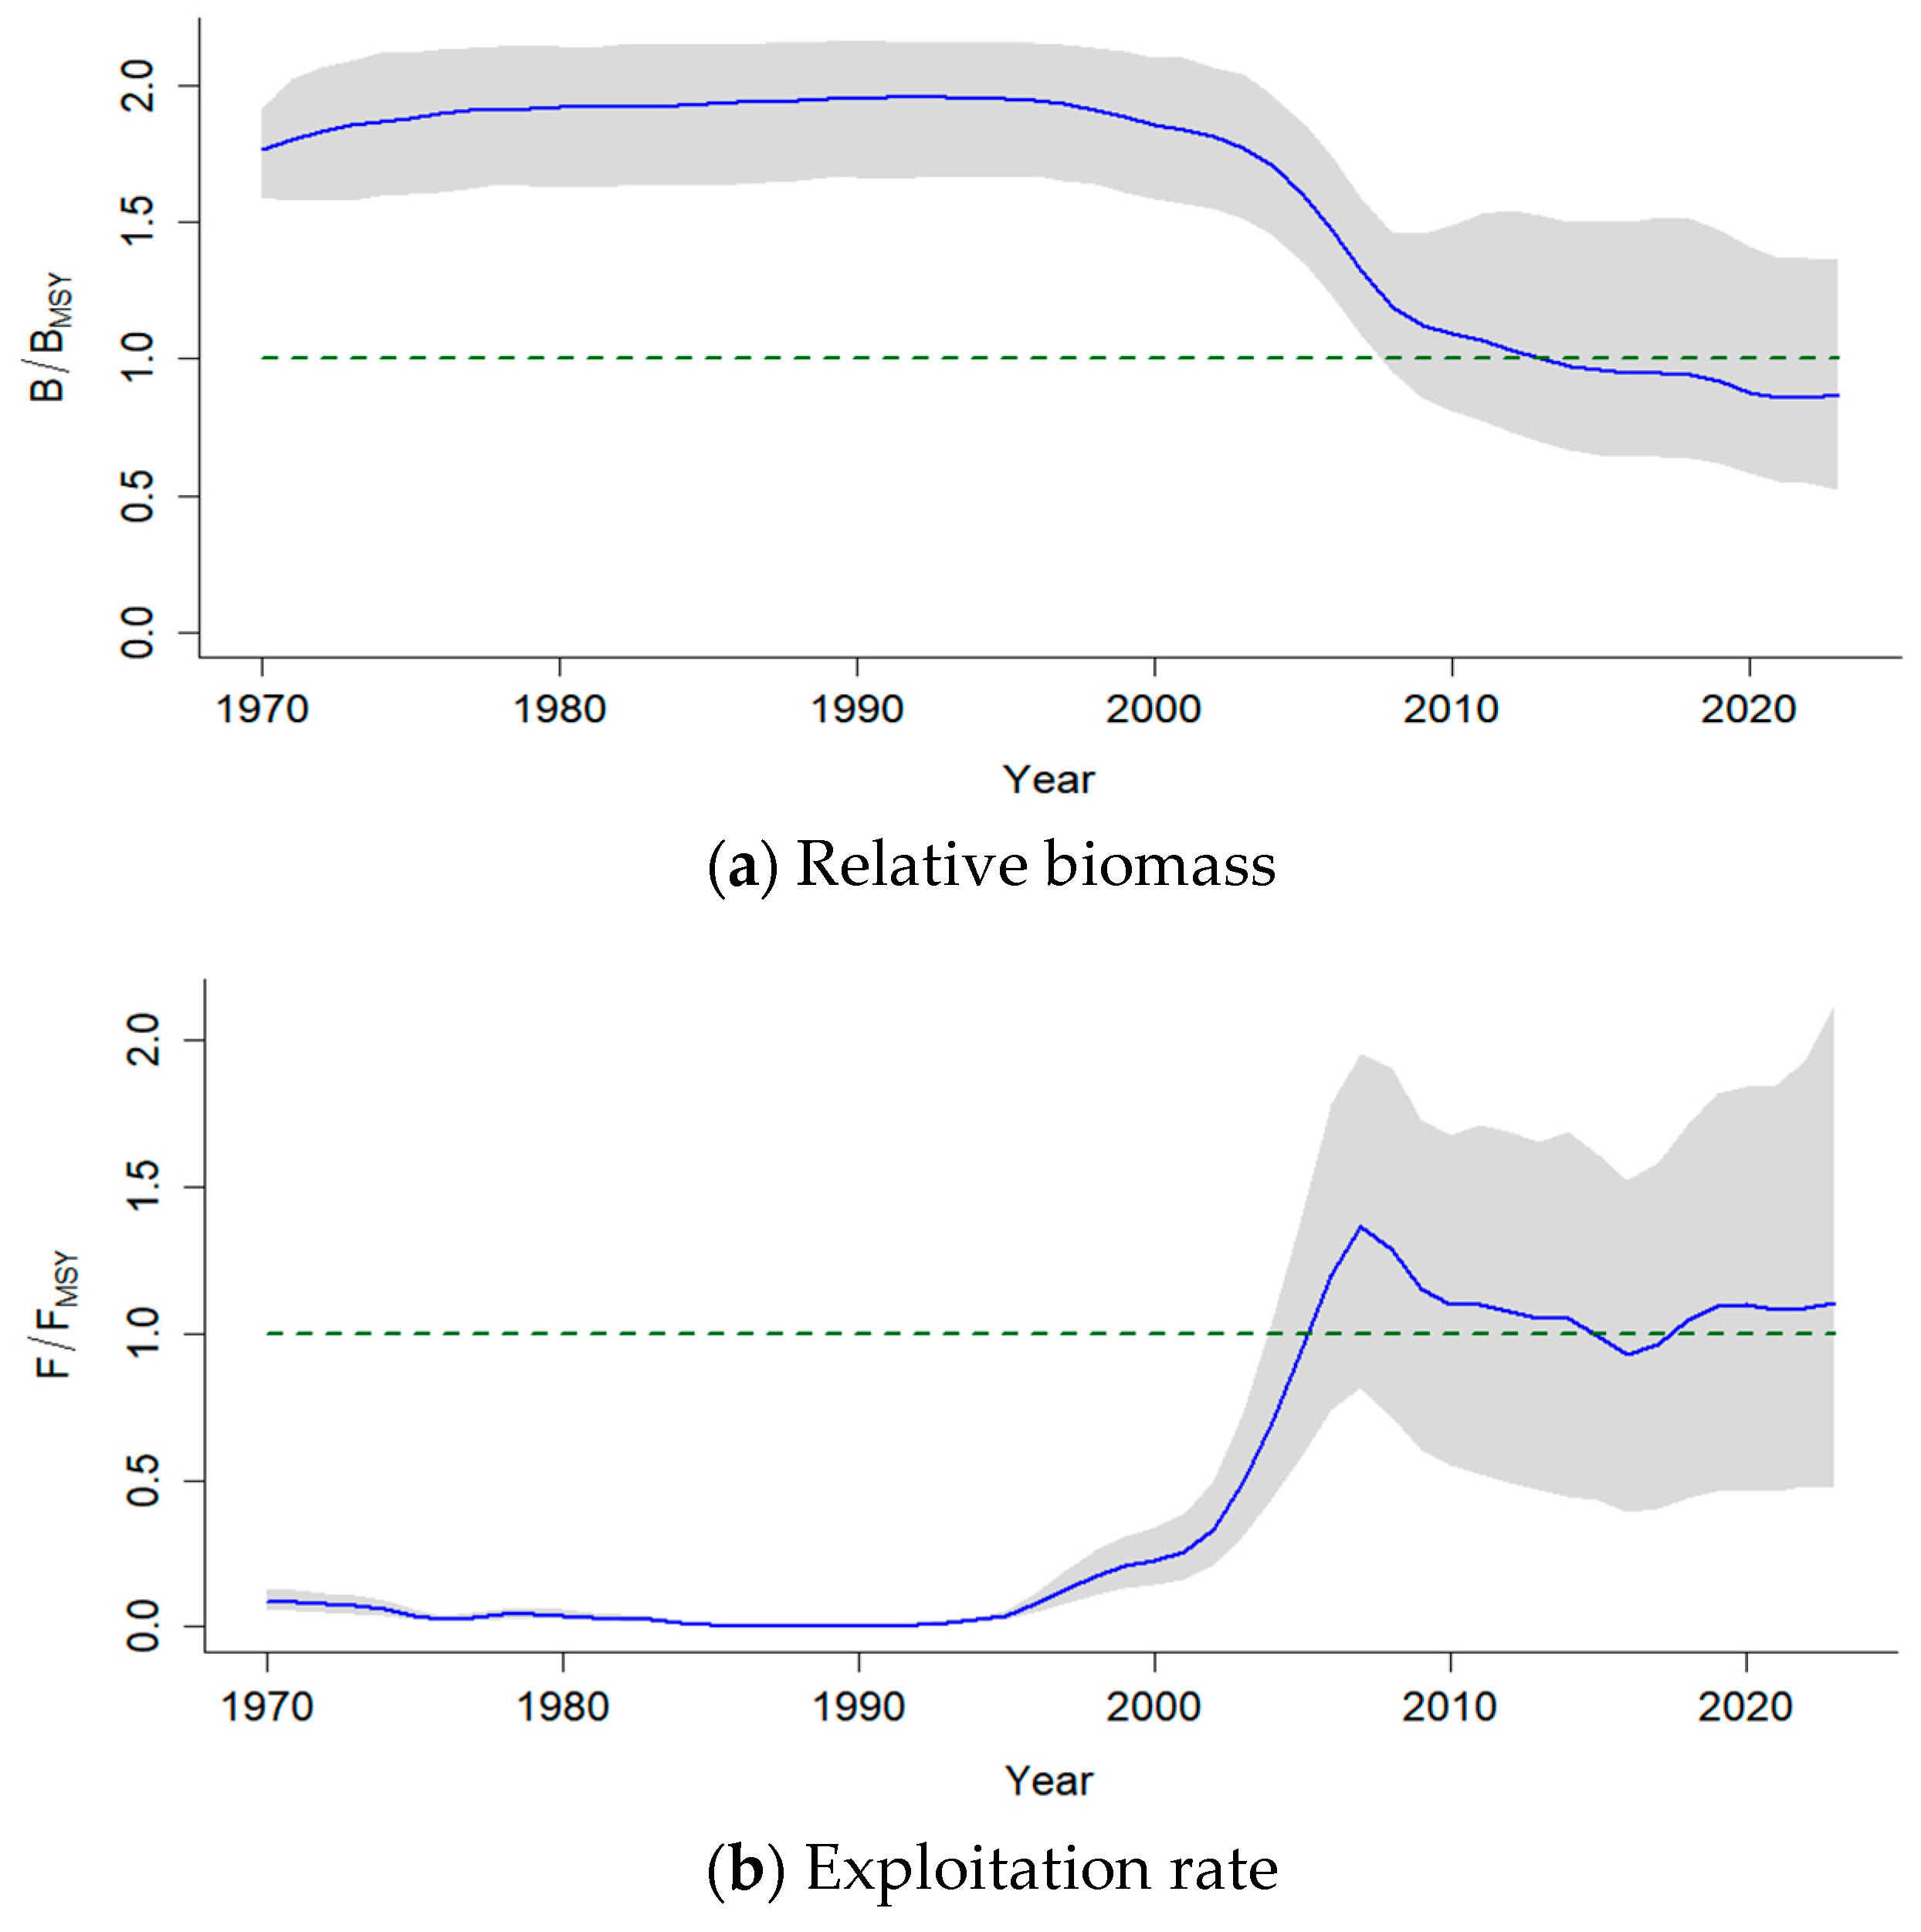
Using the RS data-based CPUE and B/k values derived from the quantitative approach as prior information, the stock status of snow crabs by the BSM is shown in Figure 4. These trends were similar to those of the model using the TAC data-based CPUE. However, unlike the TAC data-based CPUE results, the biomass showed a continuous declining trend after 2004 which fell below the MSY level from 2012. The current biomass (B) is slightly lower than that of the BMSY, indicating that the stock may have been overfished (B/BMSY < 1). The exploitation rate decreased after 2007 but was slightly above the FMSY level. The current fishing pressure is slightly higher than that of the FMSY, indicating that overfishing may be occurring.

3.3.2. Model Diagnostics

Prior distributions based on specified information, along with posterior distributions estimated from the model using catch and two abundance indices, TAC data-based CPUE and RS data-based CPUE, were plotted for comparison.
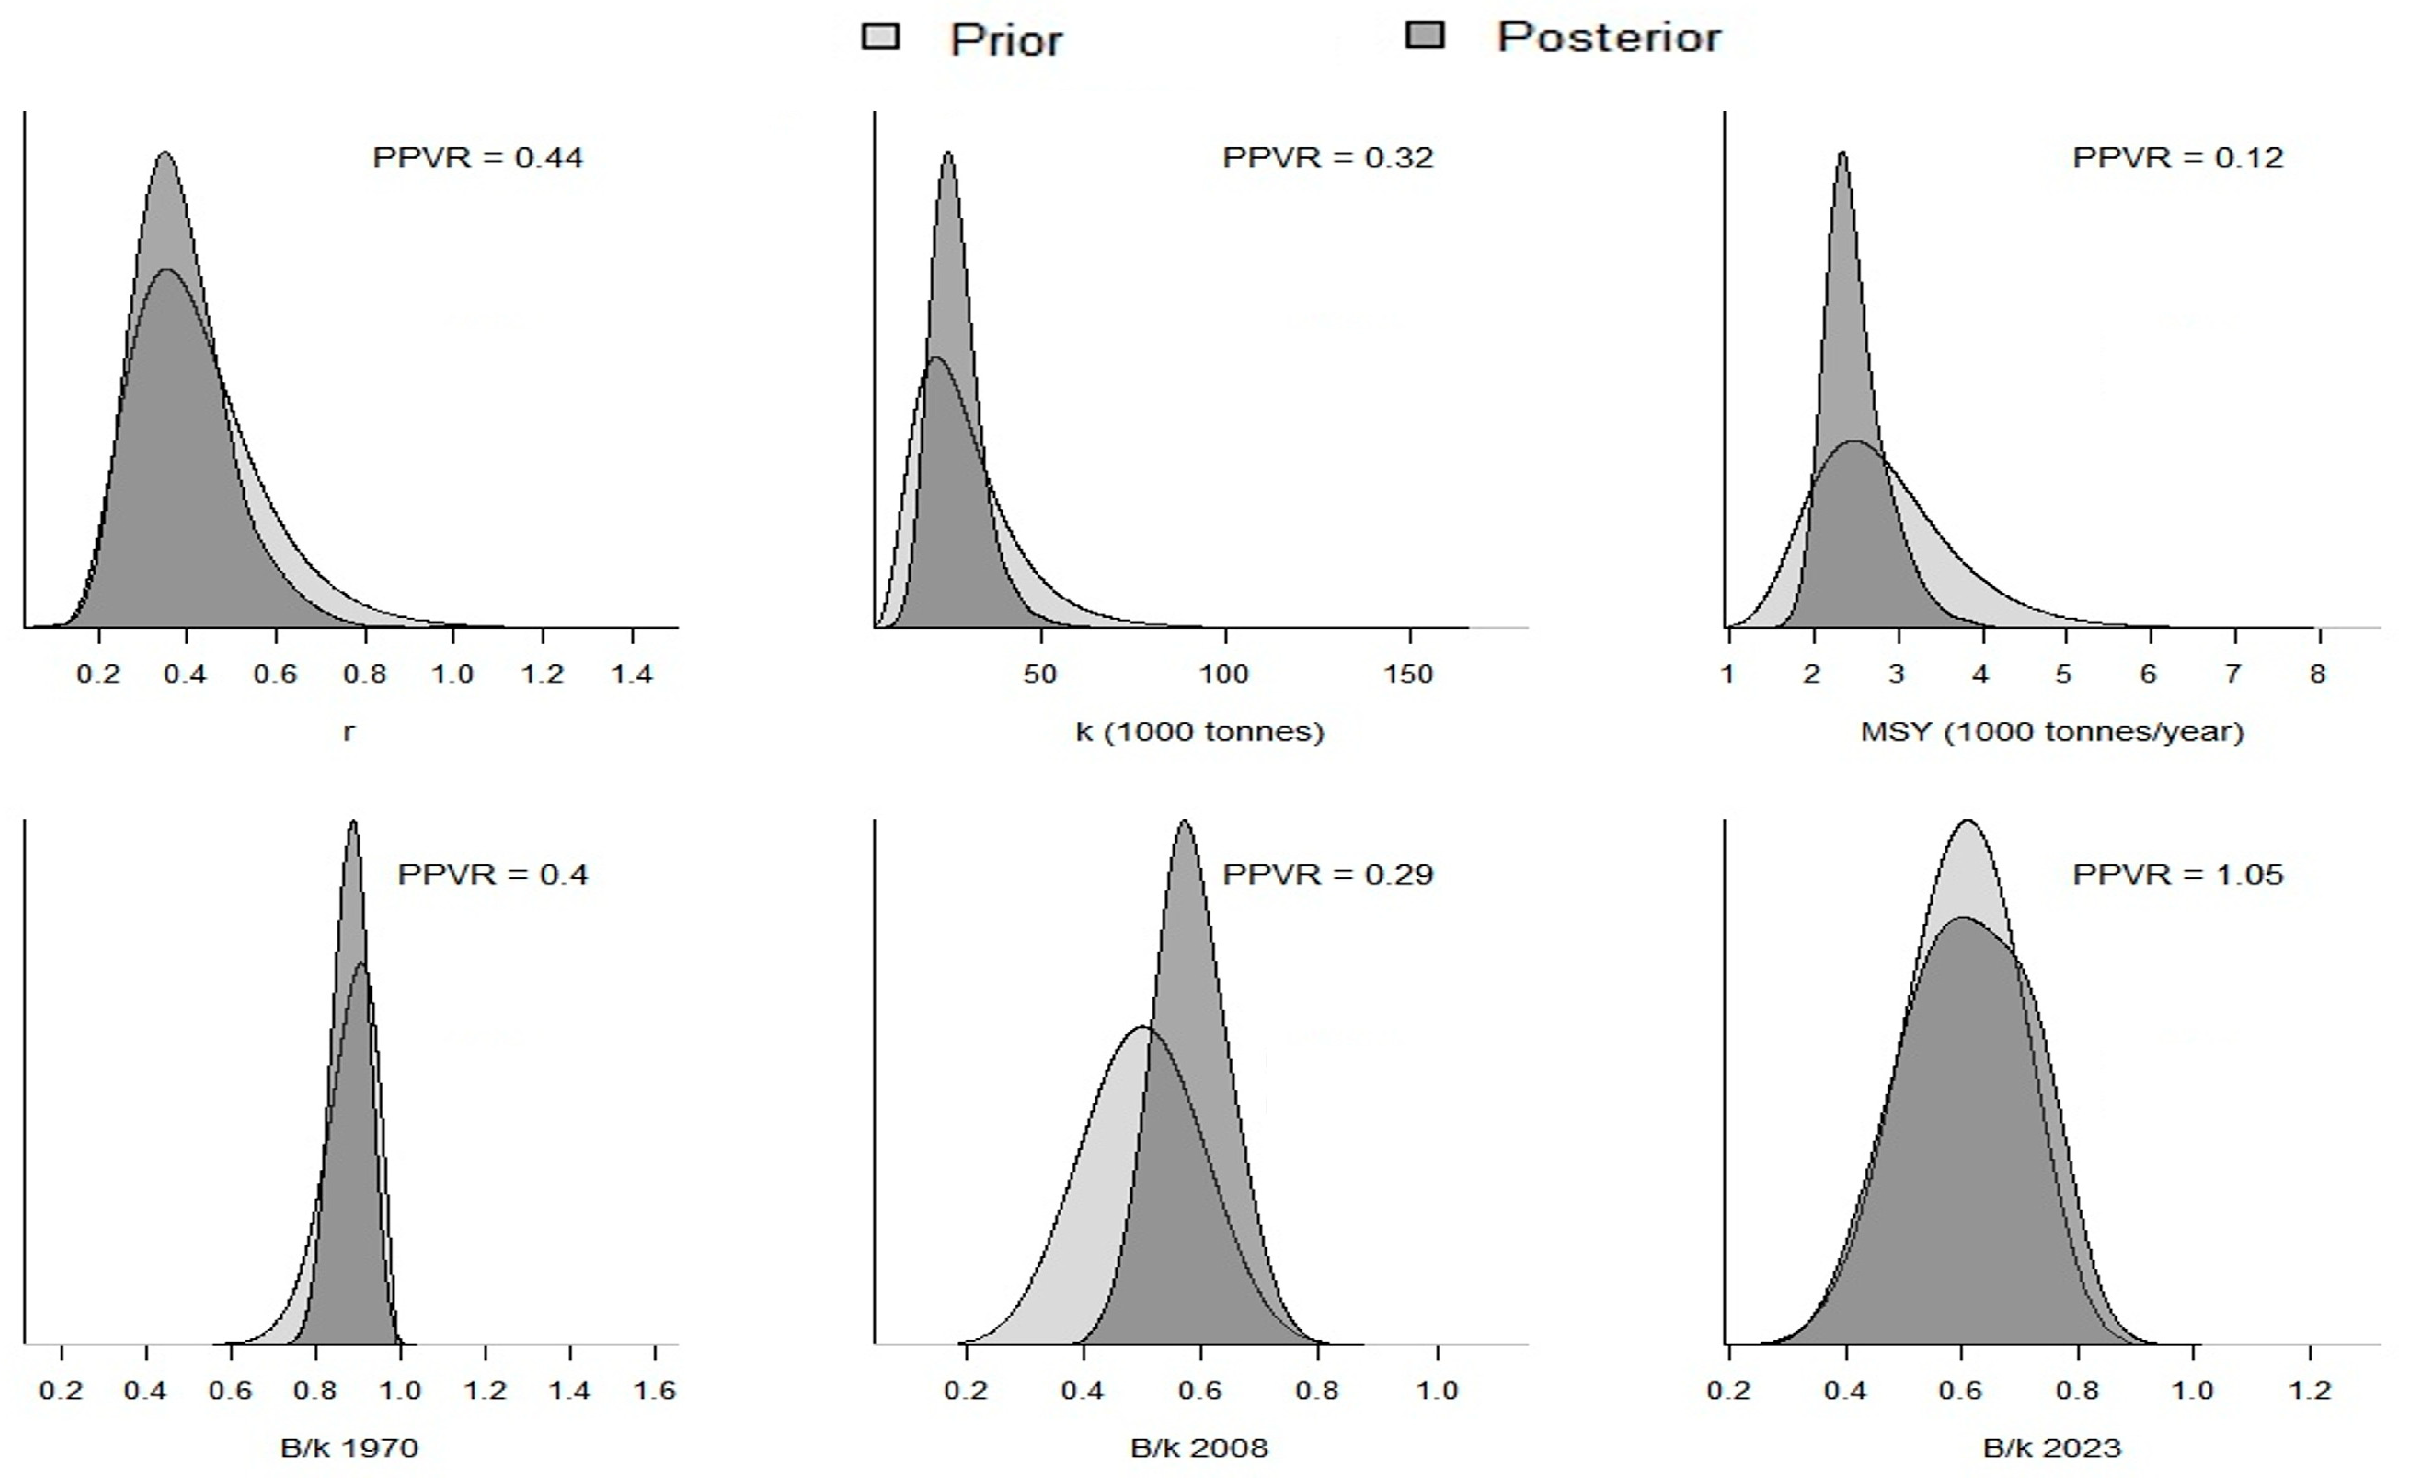
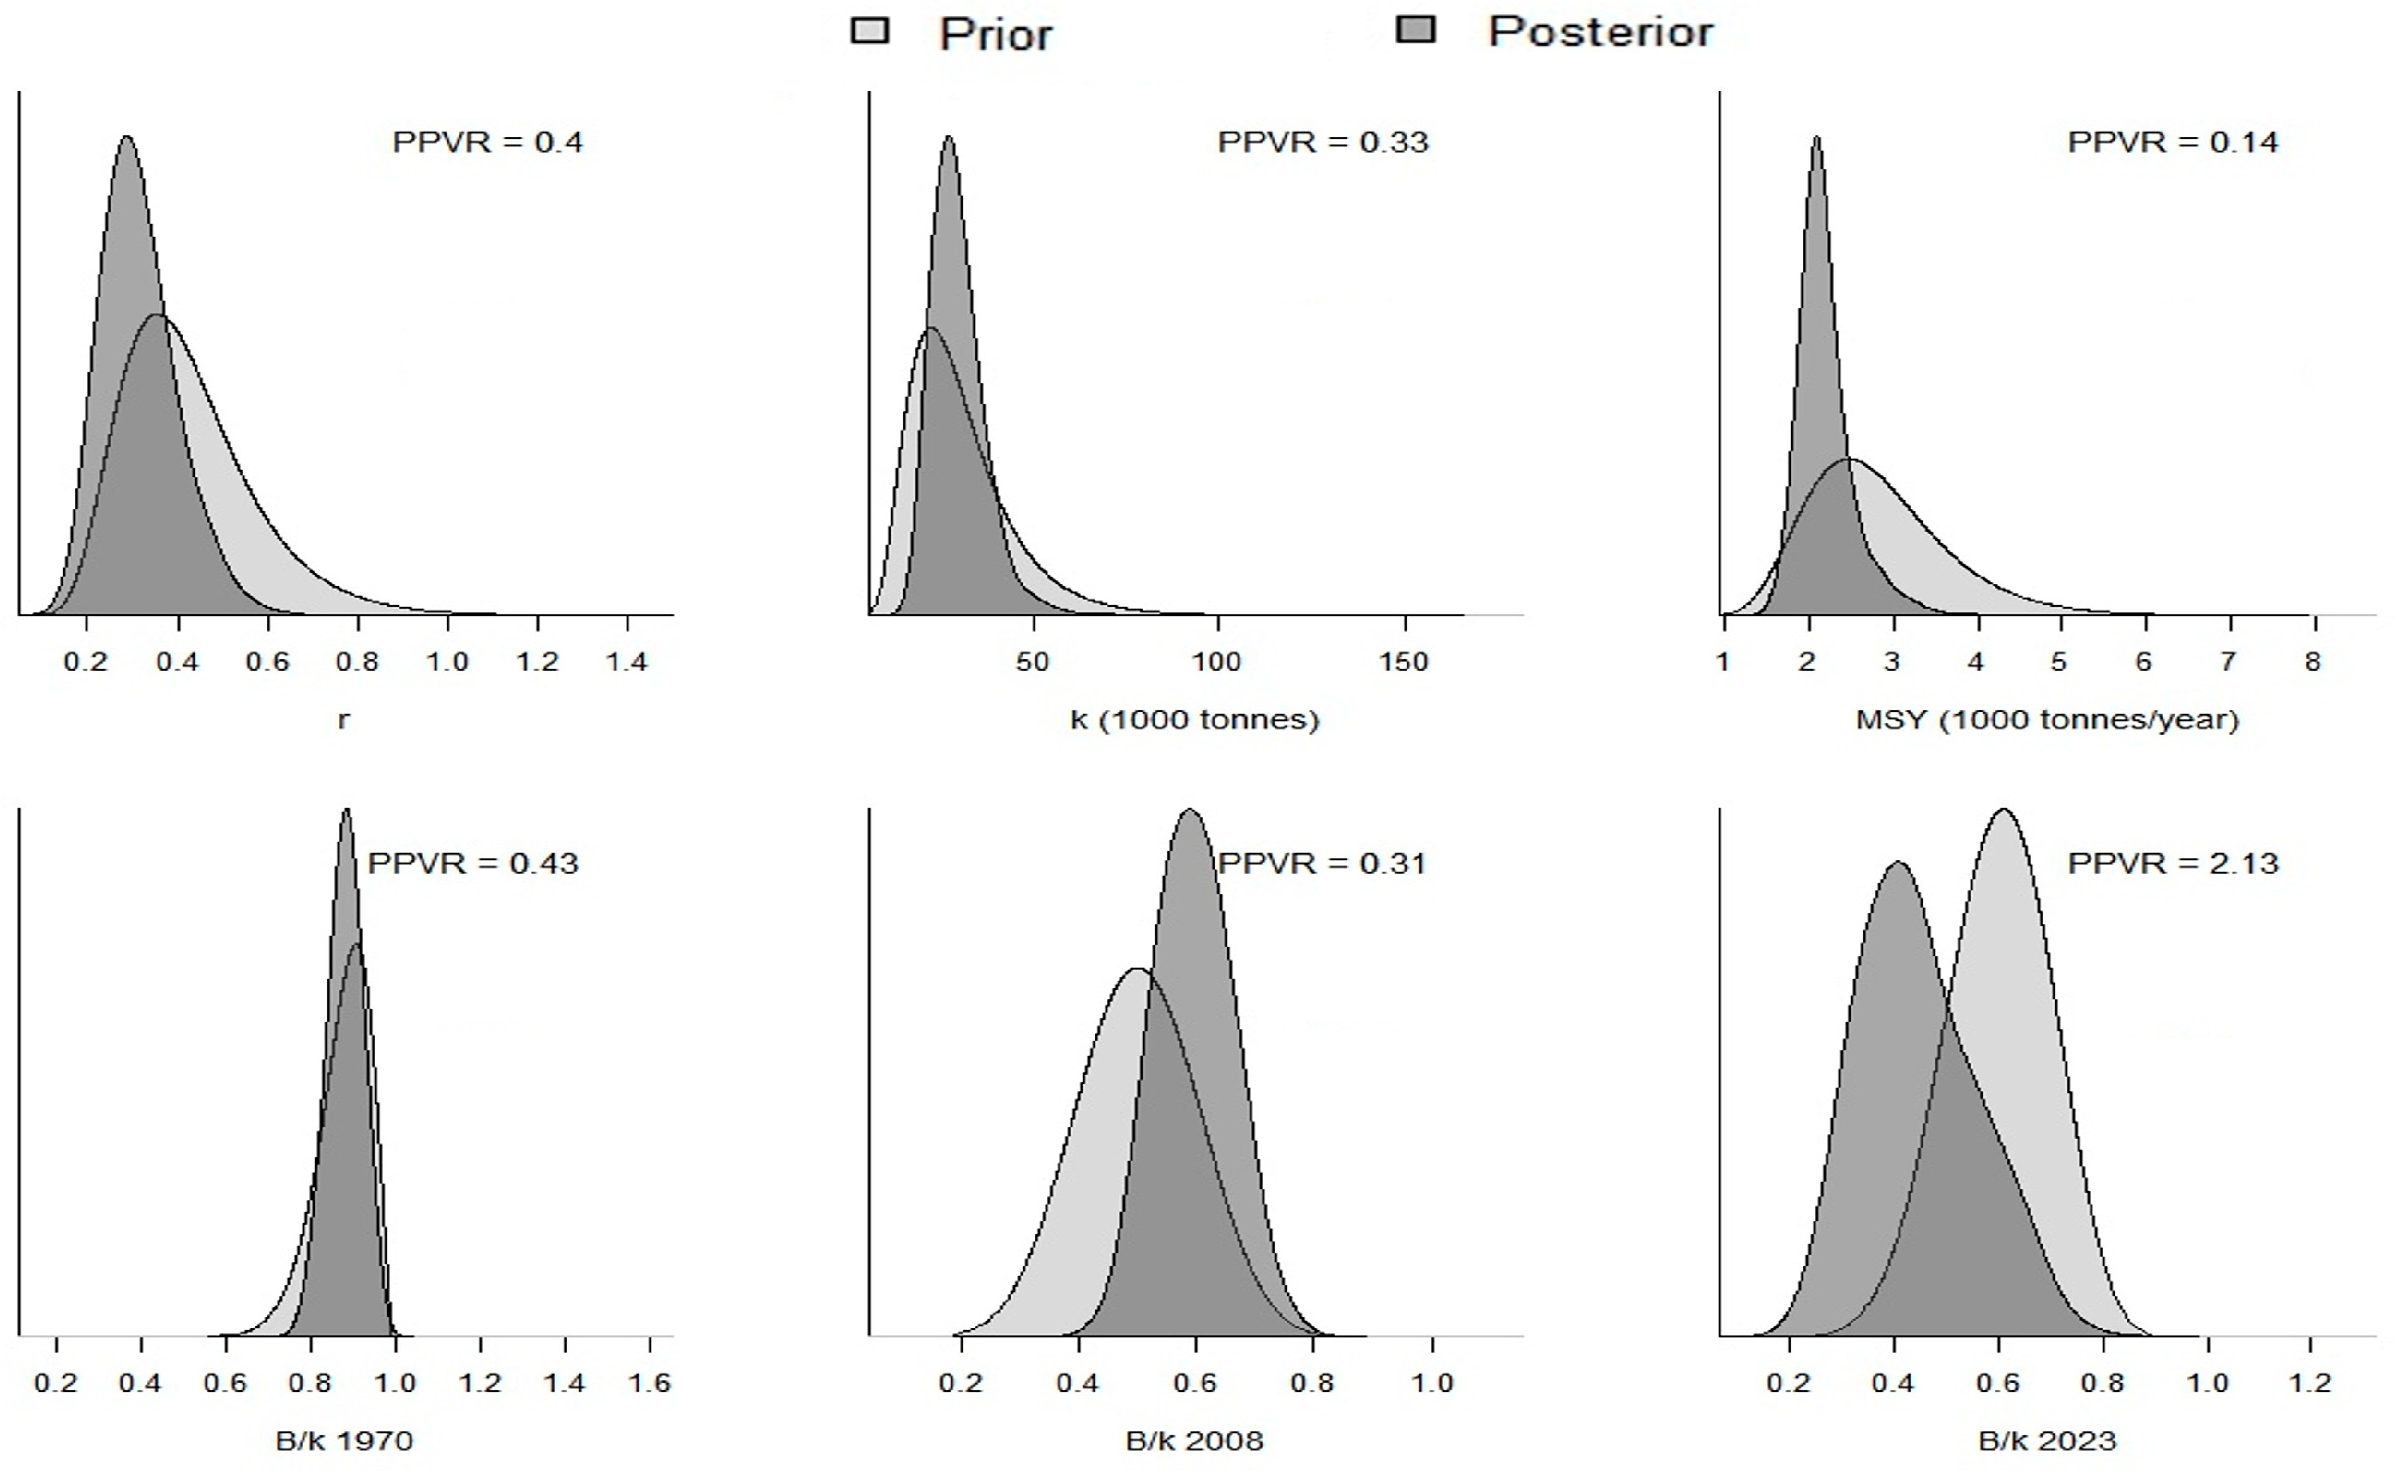
As shown in Figure 5 and Figure 6, most of the posterior distributions were narrower than the prior distributions, indicating that incorporating prior information reduced the model uncertainty and improved the reliability of the results. This demonstrated that quantitative prior information reflecting the characteristics of snow crabs contributed to improving the model fit.
The specific PPVR values for each case are summarized in Table 7. The PPVR value of B/k in the end year (2023) was 1.05 for the model using TAC data-based CPUE, indicating that the posterior variance was nearly identical to the prior variance, which suggests that the data provided minimal additional information. In contrast, the PPVR of 2.13 for the RS data-based CPUE suggests that the posterior variance was significantly higher than the prior variance, indicating that the data introduced additional uncertainty.
Retrospective analysis of TAC data-based CPUE showed very little differences between models that sequentially excluded data from 2023 to 2021 and the full time series model (Figure 7). This result is likely due to the relatively low interannual variability in TAC data-based CPUE, indicating that excluding a single year has little impact on model estimates.
However, the retrospective analysis of RS data-based CPUE showed greater differences between models that sequentially excluded data from 2023 to 2021, compared to those of TAC data-based CPUE (Figure 8). This result is likely due to the higher interannual variability in RS data-based CPUE, indicating that excluding specific years has a greater impact on the estimated relative biomass and fishing mortality. These results show that when using RS data-based CPUE, abundance indices from recent years have a significant impact on the model estimates.

3.3.3. Integrated Stock Status and Uncertainty Grid

Since recent years’ stock status of snow crabs in Korean waters showed some differences depending on the abundance indices, to reflect the structural uncertainty associated with the selection of CPUE index, we treated each CPUE series as an independent model scenario within a single-axis uncertainty grid. Although no additional axes of uncertainty (e.g., priors for r or B/k) were varied, the abundance index was identified as a key structural variable due to the different trends observed between the two indices. Accordingly, posterior samples (n = 6000 each) derived from the BSM analyses using the TAC-based and RS-based CPUEs were aggregated (n = 12,000 total) and used to estimate the stock status via the Kobe plot. Based on this, the current stock status of snow crabs is estimated to be healthy, with a probability of belonging to the green quadrant of 53.9%, which indicates that the stock is not overfished (B/BMSY > 1) and that overfishing is not occurring (F/FMSY < 1) (Figure 9).

4. Discussion

CMSY++ is a useful tool for assessing stock status using only catch or catch and an abundance index (CPUE or biomass) for the stock assessment of species in a data-poor environment. However, the results are very sensitive to the prior distribution of the relative biomass (B/k) among the input parameters and can be significantly affected by the prior distribution [21]. Bouch et al. [22] demonstrated that CMSY assessments can be poor when the default depletion (B/k) prior ranges are inadequate. In addition, because the default depletion setting can be influenced by the analyst’s subjective judgment when determined qualitatively, a quantitative approach using objective criteria is necessary. Therefore, in this study, we propose a method for quantitatively calculating B/k prior information using fishery data and biological information of the species. A stock assessment of snow crabs in Korean waters was conducted using the B/k values calculated using this approach for the start, intermediate, and end years of the BSM.
To estimate B/k for each year, indicators for catch, market value, quota, catch size, and vulnerability to other fisheries were created using practical and biological data such as total catch, sales amount, and average size. These indicators were calculated to evaluate the stock status in each year compared to the baseline point so that the prior information on B/k could be reflected more objectively. Therefore, this approach is expected to further improve the accuracy of the stock assessment results of CMSY++. However, because this study only presents a method to calculate B/k quantitatively using the available data, more diverse indicators should be developed in detail. In addition, although weights were assigned to each indicator based on their relative relevance and data reliability, the process may be partially affected by the nature of the available data and analyst’s interpretation. Therefore, future research should focus on developing a more transparent and robust weighting scheme.
In this study, BSM was applied to assess the stock status of snow crabs in Korean waters using two abundance indices: TAC data-based CPUE and RS data-based CPUE. The results of the two indices show differences since 2008. The recent stock status of snow crabs was evaluated as a TAC data-based CPUE with biomass (B) higher than BMSY and fishing pressure (F) lower than FMSY, whereas RS data-based CPUE had biomass (B) slightly lower than BMSY and fishing pressure (F) slightly higher than FMSY. This difference is thought to be because the TAC data-based CPUE uses data from TAC-participating offshore gillnet vessels, whereas the RS data-based CPUE uses data from both coastal and offshore gillnets. This implies that TAC data represent regulated and relatively standardized fishing activities, while RS data reflect a wider spectrum of fishing practices and effort dynamics. According to the vulnerability indicator (Table 3 and Table 4), catches from other fisheries, particularly coastal gillnet fishery, have increased in recent years, suggesting that variations in the abundance index, accounting for the influence of this fishery, should also be considered in the stock assessment. To incorporate the structural uncertainty arising from these two abundance indices, an uncertainty grid approach was applied, and the median value of all posterior samples (12,000 estimates) derived from both models was used to determine the overall stock status of the snow crab. As a result, it indicates that the stock is not currently overfished, and that overfishing is not currently occurring, with a probability of belonging to the green zone (B/BMSY > 1 and F/FMSY < 1) of 53.9%.
The Korean Government is planning to expand the TAC system to coastal fisheries to manage fishery resources for sustainable use [23]. This change will mark an important turning point in fishery management strategies. In particular, coastal fisheries in Korea are mostly small-scale, and survey data on these fisheries are mostly insufficient and limited. Therefore, the BSM can be used as a useful tool until sufficient data for stock assessment of the target species are collected. This study proposes a quantitative approach to setting B/k, and if the method is further developed, the accuracy of stock assessment using the BSM can be further improved.

Author Contributions

Conceptualization, J.-H.E. and S.-I.L.; data analysis, J.-H.E.; writing-original draft preparation, J.-H.E. and S.-I.L.; writing-review and editing, J.-H.E., S.-I.L. and S.-C.Y.; visualization, J.-H.E. All authors have read and agreed to the published version of the manuscript.

Funding

This work was supported by the NIFS (National Institute of Fisheries Science) under Grant (R2025003).

Institutional Review Board Statement

Not applicable.

Data Availability Statement

The data sources used in this study are provided in the Appendix A. CPUE and catch size data are available from the authors upon request.

Conflicts of Interest

The authors declare no conflicts of interest.

Abbreviations

TACTotal Allowable Catch
BSMBayesian Schaefer Model
CPUECatch Per Unit Effort
MSYMaximum Sustainable Yield

Appendix A

The data sources and periods used for the indicators are summarized in Table A1.
Table A1. Data and time period used for the indicators.
DataTime PeriodSource
Catch1970–2023Korea Statistical Information Service (KOSIS):
https://kosis.kr/index/index.do (accessed on 18 January 2025)
Sales amount1990–2023Korea Statistical Information Service (KOSIS):
https://kosis.kr/index/index.do (accessed on 18 January 2025)
TAC quota2002–2023Korea Fisheries Resources Agency (FIRA):
https://www.data.go.kr/data/15127264/fileData.do (accessed on 18 January 2025)
Size in catch2012–2023National Institute of Fisheries Science (NIFS)

References

  1. Jadamec, L.S.; Donaldson, W.E.; Cullenberg, P. Biological Field Techniques for Chionoecetes Crabs; NOAA: Silver Spring, MD, USA, 1999. Available online: https://repository.library.noaa.gov/view/noaa/45839 (accessed on 2 July 2024).
  2. Korean Statistical Information Service (KOSIS). Fishery Production Statistics. 2025. Available online: https://www.kosis.kr/index/index.do (accessed on 18 January 2025).
  3. Murphy, J.T. Temporal and spatial variability in size-at-maturity for the eastern Bering Sea snow and Tanner crab (Chionoecetes opilio and C. bairdi). Fish. Res. 2021, 234, 105761. [Google Scholar] [CrossRef]
  4. Shibata, Y.; Nagao, J.; Narimatsu, Y.; Morikawa, E.; Suzuki, Y.; Tokioka, S.; Okamura, H. Estimating the maximum sustainable yield of snow crab (Chionoecetes opilio) off Tohoku, Japan via a state-space stock assessment model with time-varying natural mortality. Popul. Ecol. 2021, 63, 41–60. [Google Scholar] [CrossRef]
  5. Hamabe, K.; Fujiwara, K.; Ichinokawa, M. Development of a stock-specific management procedure for snow crab fishery in the Sea of Japan using conditioned surplus production models in a data-moderate situation. Can. J. Fish. Aquat. Sci. 2025, 82, 1–13. [Google Scholar] [CrossRef]
  6. Lee, H.G.; Lee, B.R.; Lee, J.H.; Lee, S.J.; Ji, H.S. Vertical distribution characteristics of snow crab Chionoecetes spp. larvae in the East Sea. Korean J. Fish. Aquat. Sci. 2023, 56, 221–227. [Google Scholar] [CrossRef]
  7. Chun, Y.Y.; Lee, S.I.; Yoon, S.C.; Cha, H.K.; Kim, J.B. Molting and growth of the snow crab Chionoecetes opilio in the East Sea of Korea. Korean J. Fish. Aquat. Sci. 2009, 42, 380–386. [Google Scholar] [CrossRef]
  8. Chun, Y.Y.; Hong, B.G.; Hwang, K.S.; Cha, H.K.; Lee, S.I.; Hwang, S.J. Maturation of reproductive organs and spawning of the snow crab Chionoecetes opilio from the East Sea of Korea. Korean J. Fish. Aquat. Sci. 2008, 41, 119–124. [Google Scholar] [CrossRef]
  9. Winker, H.; Carvalho, F.C.; Kapur, M. JABBA: Just Another Bayesian Biomass Assessment. Fish. Res. 2018, 204, 275–288. [Google Scholar] [CrossRef]
  10. Pedersen, M.W.; Berg, C.W. A stochastic surplus production model in continuous time (SPiCT). Fish Fish. 2017, 18, 226–243. [Google Scholar] [CrossRef]
  11. Froese, R.; Demirel, N.; Coro, G.; Winker, H. User Guide for CMSY++; GEOMAR: Kiel, Germany, 2021; p. 17. Available online: https://oceanrep.geomar.de/id/eprint/52147/ (accessed on 2 July 2024).
  12. Froese, R.; Winker, H.; Coro, G.; Palomares, M.-L.D.; Tsikliras, A.C.; Dimarchopoulou, D.; Touloumis, K.; Demirel, N.; Vianna, G.M.S.; Scarcella, G.; et al. New developments in the analysis of catch time series as the basis for fish stock assessments: The CMSY++ method. Acta Ichthyol. Et Piscat. 2023, 53, 173–189. [Google Scholar] [CrossRef]
  13. National Institute of Fisheries Science (NIFS). A Study on Stock Assessment and Management Strategy Evaluation for Coastal and Offshore Fisheries; Report; NIFS: Busan, Republic of Korea, 2024. [Google Scholar]
  14. Jung, N.Y. CPUE Standardization of Sailfin Sandfish (Arctoscopus japonicus) in Korean Waters Using Fishery Data from Fishery Radio Station. Master’s Thesis, Pukyong National University, Busan, Republic of Korea, 2024. [Google Scholar]
  15. Holling, C.S. Resilience and stability of ecological systems. In Foundations of Socio-Environmental Research: Legacy Readings with Commentaries; Cambridge University Press: Cambridge, UK, 2022; pp. 460–482. [Google Scholar] [CrossRef]
  16. Froese, R.; Demirel, N.; Coro, G.; Kleisner, K.M.; Winker, H. Estimating fisheries reference points from catch and resilience. Fish Fish. 2017, 18, 506–526. [Google Scholar] [CrossRef]
  17. SeaLifeBase. 2024. Available online: http://www.sealifebase.org (accessed on 15 September 2024).
  18. Gelman, A.; Carlin, J.B.; Stern, H.S.; Dunson, D.B.; Vehtari, A.; Rubin, D.B. Bayesian Data Analysis, 3rd ed.; CRC Press: Boca Raton, FL, USA, 2013. [Google Scholar]
  19. Mullowney, D.R.J.; Baker, K.D. Multi-indicator precautionary approach frameworks for crustacean fisheries. Can. J. Fish. Aquat. Sci. 2023, 80, 1207–1220. [Google Scholar] [CrossRef]
  20. Hilborn, R.; Walters, C.J. Quantitative Fisheries Stock Assessment: Choice, Dynamics and Uncertainty; Chapman and Hall: New York, NY, USA, 1992. [Google Scholar]
  21. Cai, K.; Kindong, R.; Ma, Q.; Tian, S. Stock assessment of Chub Mackerel (Scomber japonicus) in the Northwest Pacific using a multi-model approach. Fishes 2023, 8, 80. [Google Scholar] [CrossRef]
  22. Bouch, P.; Minto, C.; Reid, D.G. Comparative performance of data-poor CMSY and data-moderate SPiCT stock assessment methods when applied to data-rich, real-world stocks. ICES J. Mar. Sci. 2021, 78, 264–276. [Google Scholar] [CrossRef]
  23. Yoon, S.C.; Kim, M.-J.; Kang, H.; Choi, M.-J. Reconstruction of recreational catch and multi-fisheries stock assessment of Hairtail (Trichiurus lepturus) in Korean waters under a data-limited situation. Fishes 2025, 10, 166. [Google Scholar] [CrossRef]
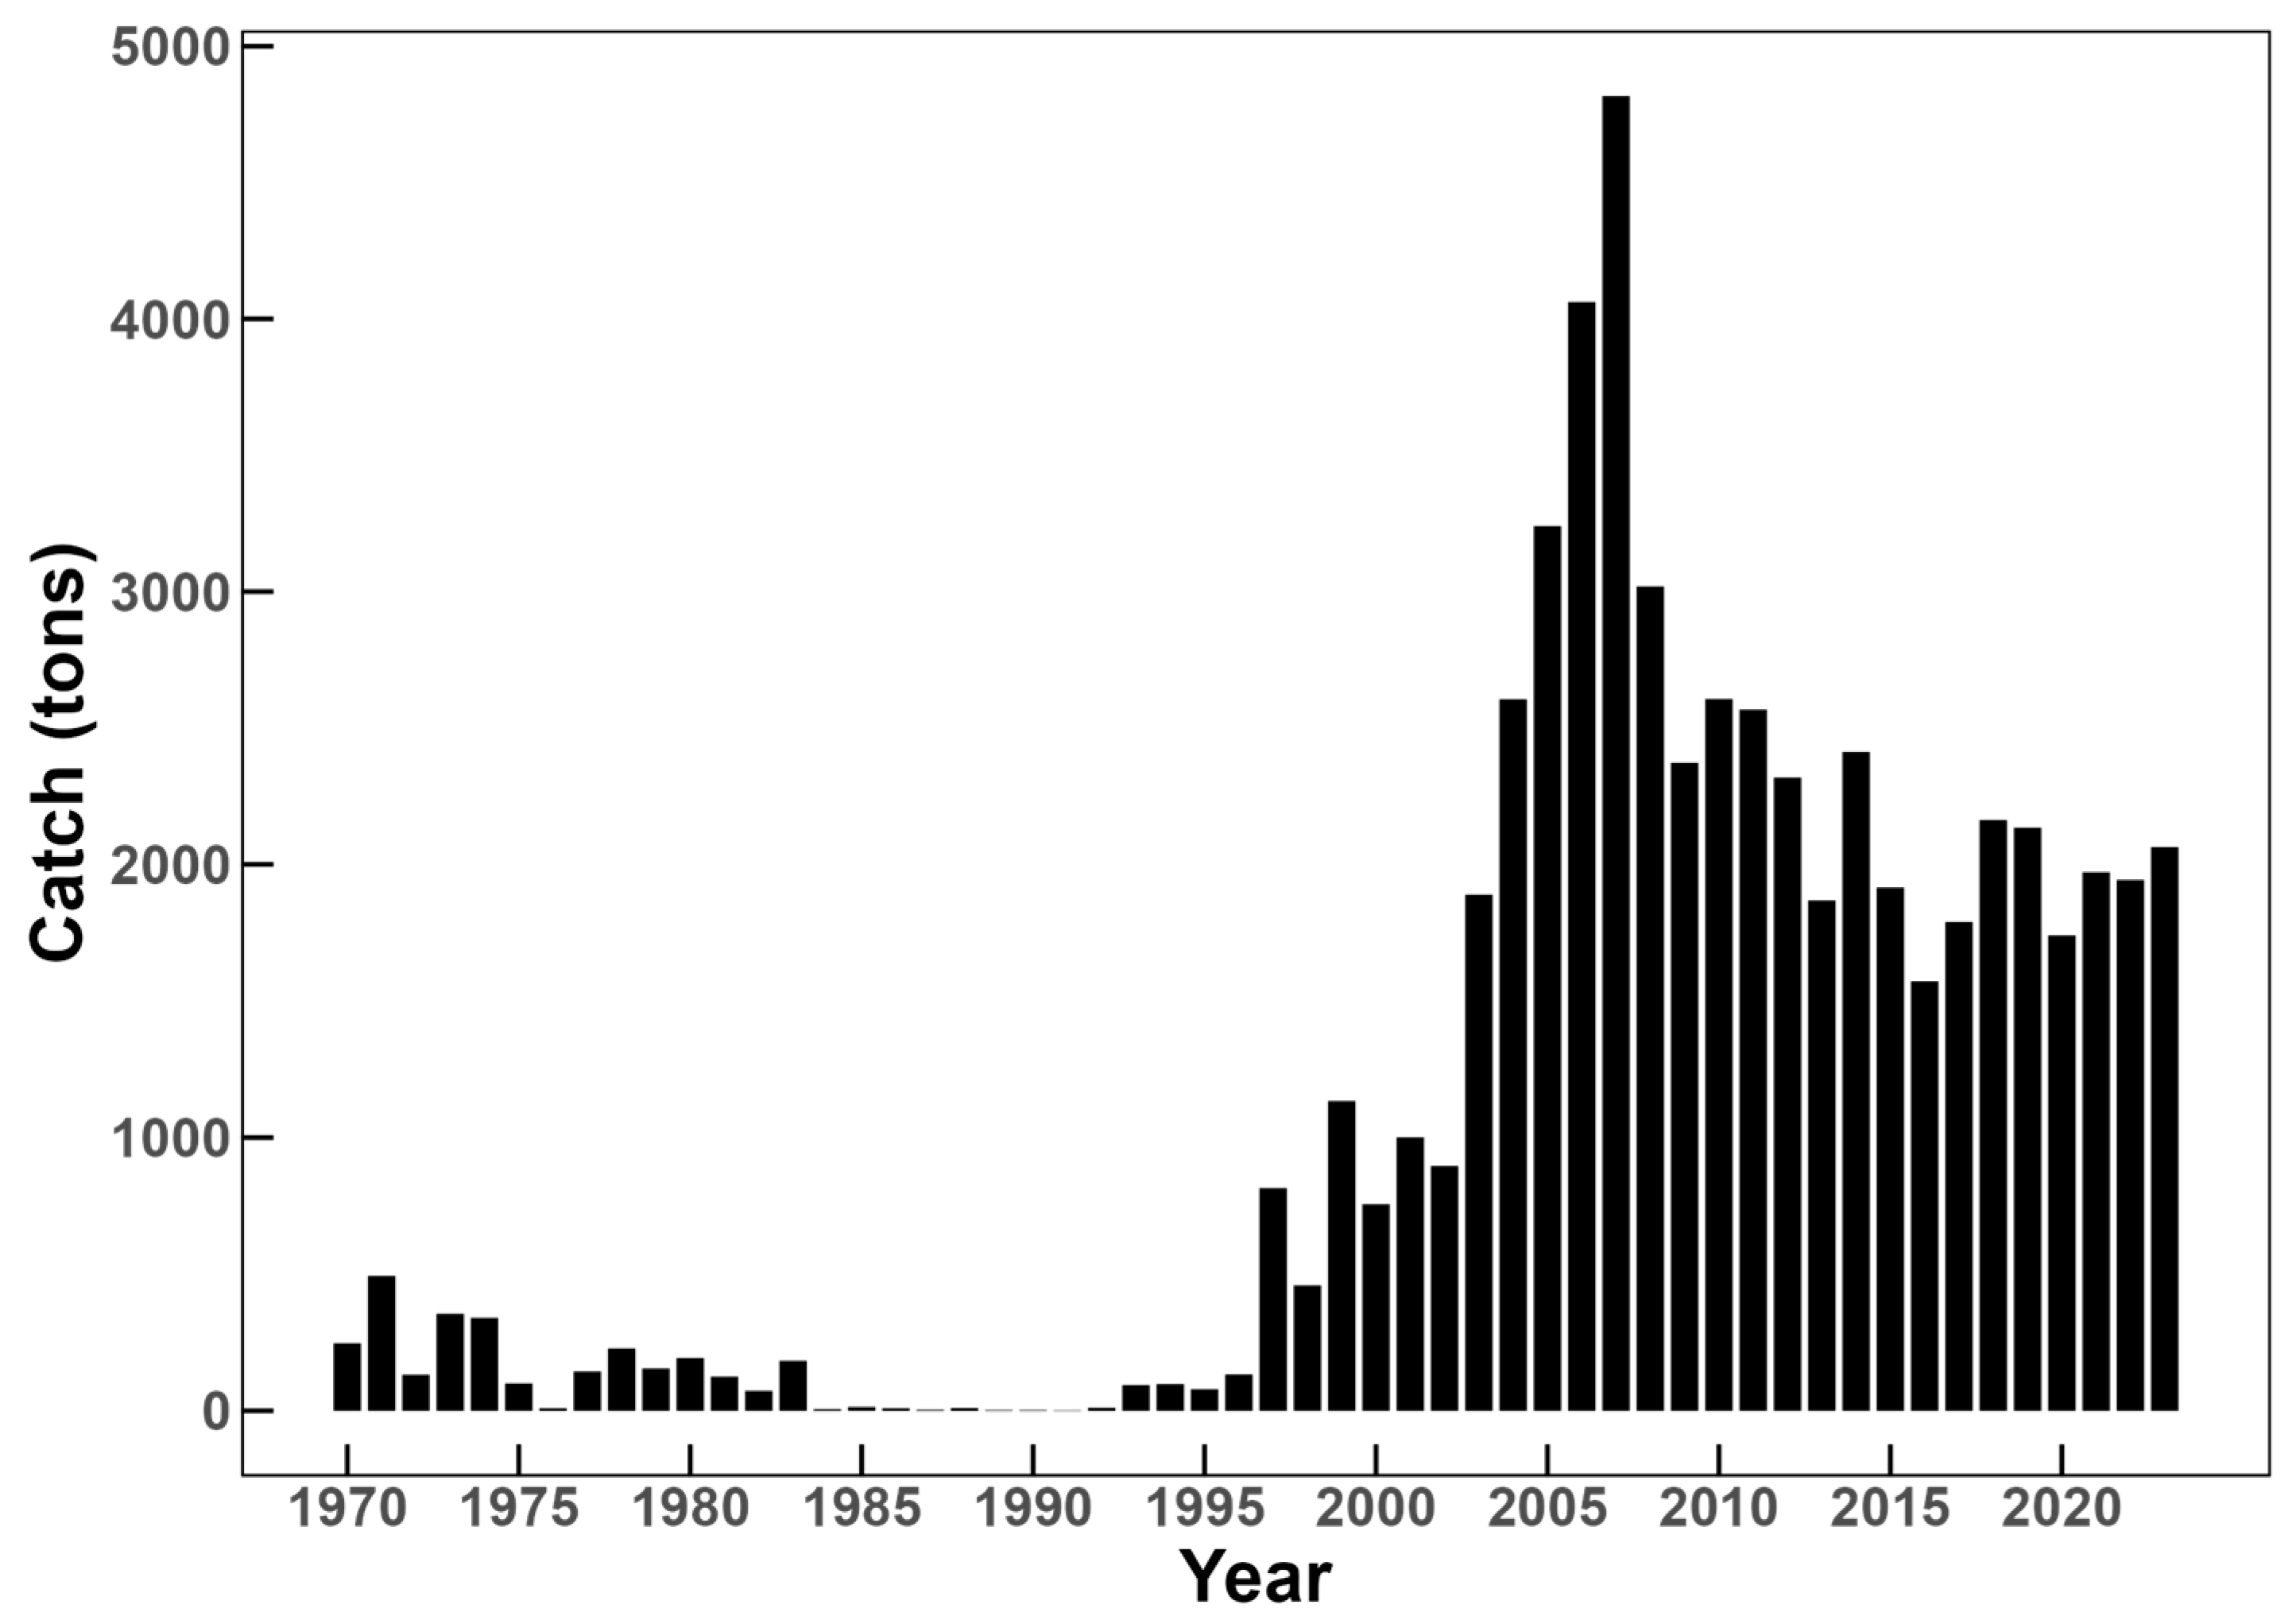
Figure 1. Annual changes in the total catch of snow crabs in Korean waters from 1970 to 2023.
Fishes 10 00400 g001
Figure 2. Annual changes in the two abundance indices (standardized CPUEs) of snow crabs in Korean waters from 2010 to 2023.
Fishes 10 00400 g002
Figure 3. Annual changes in the relative biomass (B/BMSY) and exploitation rate (F/FMSY) for snow crabs by BSM using TAC data-based CPUE. The blue solid line denotes the median of the estimates, and the gray shaded area represents the corresponding 95% confidence interval.
Fishes 10 00400 g003
Figure 4. Annual changes in the relative biomass (B/BMSY) and exploitation rate (F/FMSY) for snow crabs by BSM using RS data-based CPUE. The blue solid line denotes the median of the estimates, and the gray shaded area represents the corresponding 95% confidence interval.
Fishes 10 00400 g004
Figure 5. Prior and posterior distributions of r, k, MSY, and B/k when using TAC data-based CPUE. r: Resilience; k: Carrying capacity; MSY: Maximum Sustainable Yield; PPVR: Posterior-Prior Variance Ratio; TAC: Total Allowable Catch; CPUE: Catch Per Unit Effort.
Fishes 10 00400 g005
Figure 6. Prior and posterior distributions of r, k, MSY, and B/k when using RS data-based CPUE. r: Resilience; k: Carrying capacity; MSY: Maximum Sustainable Yield; PPVR: Posterior-Prior Variance Ratio; RS: Radio Station; CPUE: Catch Per Unit Effort.
Fishes 10 00400 g006
Figure 7. Retrospective analysis of B/BMSY and F/FMSY for snow crabs, when using TAC data-based CPUE. MSY: Maximum Sustainable Yield; B/BMSY: Biomass relative to the biomass at MSY; F/FMSY: fishing mortality relative to the fishing mortality at MSY.
Fishes 10 00400 g007
Figure 8. Retrospective analysis of B/BMSY and F/FMSY for snow crabs, when using RS data-based CPUE. MSY: Maximum Sustainable Yield; B/BMSY: Biomass relative to the biomass at MSY; F/FMSY: fishing mortality relative to the fishing mortality at MSY.
Fishes 10 00400 g008
Figure 9. Stock status of snow crabs in Korean waters based on combined TAC- and RS-based CPUE indices, presented in a Kobe plot where black dots indicate individual years from 1970 to 2023.
Fishes 10 00400 g009
Table 1. Indicator and its baseline for calculating B/k range. TAC: Total Allowable Catch.
IndicatorBaselineStock LevelEquations Used for Calculation
Total catchAverage for the applied periodLower value than the baseline is better3
Sales amountAverage for the applied periodHigher value than the baseline is better4
Catch of fisheries subject to TACCatch limit (TAC) of the yearLower value than the baseline is better3
Mean size in catchMaximum size for the applied periodHigher value than the baseline is better5
Vulnerability due to non-TAC fisheries
(catch of fisheries other than TAC fisheries)
Catch limit (TAC) of the yearLower value than the baseline is better3
Table 2. Baseline values by indicators for the start, intermediate, and end years for setting B/k. CW: Carapace Width; KRW: Korean won; TAC: Total Allowable Catch.
YearTotal CatchSales AmountCatch of Fisheries Subject to TACMean Size in CatchVulnerability
Average (tons)Average (Thousand KRW)TAC Quota
(tons)
Max
(CW, mm)
TAC Quota
(tons)
Start1970236229,328,6671228117.01228
Intermediate2008236229,328,6671500117.01500
End2023236229,328,667978117.0978
Table 3. Actual values by indicators for the start, intermediate, and end years for setting B/k.
YearTotal Catch
(tons)
Sales Amount
(Thousand KRW)
Catch of Fisheries Subject to TAC
(tons)
Mean Size in Catch
(CW, mm)
Vulnerability
(Others, tons)
Start197024729,328,667247117.024.7
Intermediate2008301943,209,0261598112.01424
End2023206349,441,766563117.01500
Table 4. The rates of the actual value to the baseline by indicator for each year.
YearTotal CatchSales AmountCatch of Fisheries Subject to TACMean Size in CatchVulnerability
Start19700.101.000.201.000.02
Intermediate20081.281.471.070.960.95
End20230.871.690.581.001.53
Table 5. The indicator scores (IS) calculated for each year and the weights by indicator.
YearTotal CatchSales AmountCatch of Fisheries Subject to TACMean Size in CatchVulnerability
Start19700.950.500.901.000.99
Intermediate20080.360.740.470.960.53
End20230.560.840.711.000.23
Weight31112
Table 6. The priors of B/k calculated for each year.
YearB/k
(Weighted Mean)
Range
LowHigh
Start19700.90.751.0
Intermediate20080.50.30.7
End20230.60.40.8
Table 7. PPVR results for r, k, MSY, and B/k for TAC data-based and RS data-based CPUEs. r: Resilience; k: Carrying capacity; MSY: Maximum Sustainable Yield; PPVR: Posterior-Prior Variance Ratio; TAC: Total Allowable Catch; RS: Radio Station; CPUE: Catch Per Unit Effort.
ParameterPPVR
TAC Data-Based CPUERS Data-Based CPUE
r0.440.40
k0.320.33
MSY0.120.14
B/k start0.400.43
B/k intermediate0.290.31
B/k end1.052.13
Disclaimer/Publisher’s Note: The statements, opinions and data contained in all publications are solely those of the individual author(s) and contributor(s) and not of MDPI and/or the editor(s). MDPI and/or the editor(s) disclaim responsibility for any injury to people or property resulting from any ideas, methods, instructions or products referred to in the content.