Article

Identification of Suitable Habitats for Threatened Elasmobranch Species in the OSPAR Maritime Area

1
Bionum—Consultants in Biological and Ecological Statistics, 21129 Hamburg, Germany
2
Bundesamt für Naturschutz (BfN—German Federal Agency for Nature Conservation), 18581 Vilm, Germany
3
Naturschutzbund Deutschland e. V. (NABU—Nature and Biodiversity Conservation Union), 18439 Stralsund, Germany
*
Author to whom correspondence should be addressed.
Fishes 2025, 10(8), 393; https://doi.org/10.3390/fishes10080393
Submission received: 16 May 2025 / Revised: 3 July 2025 / Accepted: 23 July 2025 / Published: 7 August 2025
(This article belongs to the Special Issue Habitat Assessment and Conservation of Fishes)

Abstract

Protecting threatened elasmobranch species despite limited data on their distribution and abundance is a critical challenge, particularly in the context of increasing human impacts on marine ecosystems. In the northeastern Atlantic, species such as the leafscale gulper shark, Portuguese dogfish, spurdog, and spotted ray are facing pressures from overfishing, bycatch, habitat degradation, and climate change. The OSPAR Commission has listed these species as threatened and/or declining and aims to protect them by reliably identifying suitable habitats and integrating these areas into Marine Protected Areas (MPAs). In this study, we present a spatial modelling framework using regression-based approaches to identify suitable habitats for these four species. Results show that suitable habitats of the spotted ray (25.8%) and spurdog (18.8%) are relatively well represented within existing MPAs, while those of the deep-water sharks are underrepresented (6.0% for leafscale gulper shark, and 6.8% for Portuguese dogfish). Our findings highlight the need for additional MPAs in deep-sea continental slope areas, particularly west and northwest of Scotland and Ireland. Such expansions would support OSPAR’s goal to protect 30% of its maritime area by 2030 and could benefit broader deep-sea biodiversity, including other vulnerable demersal species and benthic communities.
Key Contribution: This study presents a modelling approach to identify suitable habitats of four threatened elasmobranch species in the OSPAR maritime area, providing a scientifically sound basis for targeted Marine Protected Area (MPA) designation. The findings highlight substantial protection gaps for deep-sea sharks and recommend specific areas for new MPAs to support the 30 × 30 conservation target.

1. Introduction

Elasmobranch species are among the most threatened marine animals in the world and their populations are globally depleted, making them highly susceptible to overfishing and other pressures, and highlighting the urgent need for strengthened protection measures. The OSPAR Convention on the conservation of the Northeast Atlantic has acknowledged the critical need to implement actions to preserve endangered species [1]. A crucial element in the protection of elasmobranch (as well as other) species is identifying and preserving suitable habitats that are vital for their migration, reproduction, and feeding, or act as nursery areas for juveniles [2]. However, detailed data to reliably identify such functional areas are often lacking, and even more general proxies such as species distribution models (SDMs) remain scarce at large spatial scales, particularly for many threatened elasmobranchs. This data deficiency hinders the development and implementation of effective conservation measures [3]. In its current Northeast Atlantic Environment Strategy [4], the OSPAR Commission has highlighted the need to improve regional coordination for the collection and sharing of data, information, and knowledge—including for elasmobranchs—in response to general declines in biodiversity and large knowledge gaps identified across multiple marine species groups. This aligns with recommendations originating from the EU Marine Strategy Framework Directive (MSFD) and the Data Collection Framework (DCF), which OSPAR has increasingly sought to mirror in recent years.
Through enhanced regional cooperation, OSPAR aims to maintain or restore a good status of the North-East Atlantic marine environment in line with its conservation objectives. Critical tools in achieving this include the designation of Marine Protected Areas (MPAs) (https://www.ospar.org/work-areas/bdc/marine-protected-areas, accessed on 22 July 2025), the OSPAR List of Threatened and/or Declining Species and Habitats (T&D features; https://www.ospar.org/work-areas/bdc/species-habitats/list-of-threatened-declining-species-habitats, accessed on 22 July 2025), and a dedicated roadmap outlining collective actions for the protection of T&D species (https://www.ospar.org/site/assets/files/35421/posh_roadmap_info_doc.pdf, accessed on 22 July 2025).
In line with these measures, it is essential to assess whether suitable habitats of threatened elasmobranch species are adequately covered by existing OSPAR MPAs and to identify new areas that could potentially be designated as MPAs to increase the MPA coverage of these suitable habitats. As OSPAR has committed to the 30 × 30 target, i.e., to protect 30% of its maritime area by 2030 through MPAs and OECMs (other effective area-based conservation measures) [4], establishing new MPAs would help OSPAR progress towards increasing its current MPA coverage from currently about 11% and thereby contributing to the conservation of these endangered species.
Identifying suitable habitats for threatened elasmobranch species within the OSPAR maritime area however poses significant methodological challenges due to limited and heterogeneous data availability. Key issues include uneven spatial coverage of survey data, temporal mismatches between datasets, variable data collection methods, and insufficient information on ecologically relevant predictors.
Various methodological techniques and conceptual approaches can be used in combination to tackle these challenges: For example, to deal with the incomplete species data, it can be of great importance to acquire even heterogeneous data from a wide variety of projects and sources and to analyse them using integrative statistical methods [5,6]. The increased data density can be a major advantage over approaches that only use highly standardised/comparable data, e.g., data that showed a very high catchability for the species under consideration. However, modern and robust statistical methods ensure that different catchabilities/detectabilities of different methods for different species can be estimated to a high degree and adequately taken into account in the analysis [5,7]. In addition, regression techniques can particularly handle various challenges frequently associated with ecological data, such as overdispersion [8], nonlinear dependencies [9], nested data structures [10], or spatio-temporally correlated data [11,12].
Regarding predictor variables, the available number, quality, and spatio-temporal resolution of remote sensing data are continuously increasing, supported by a wide range of freely available databases. Institutions such as the European Environmental Agency (EEA) provide important geographic and ecological datasets (https://www.eea.europa.eu, accessed on 22 July 2025); NASA platforms, including the Ocean Color Web and AQUA MODIS, offer high-resolution oceanographic and climatological data (https://oceancolor.gsfc.nasa.gov/, accessed on 22 July 2025) and, e.g., Global Fishing Watch delivers comprehensive information on human activities in marine environments, particularly fishing patterns (https://globalfishingwatch.org/, accessed on 22 July 2025). Resources like the Marine Conservation Institute (MCI—https://marine-conservation.org/, accessed on 22 July 2025) and GEBCO (https://www.gebco.net/, accessed on 22 July 2025) contribute detailed geophysical and bathymetric datasets, while platforms such as EMODnet offer a broad spectrum of oceanographic and environmental variables (https://emodnet.ec.europa.eu/en, accessed on 22 July 2025). Together, these databases form a robust foundation for analysing marine ecosystems and modelling suitable habitats in a scientifically sound and integrative manner.
This study applies an integrative regression-based approach to model the suitable habitats of four elasmobranch species listed by OSPAR as threatened and/or declining: the spotted ray (Raja montagui), the spurdog (Squalus acanthias), and two deep-water sharks—the leafscale gulper shark (Centrophorus squamosus) and the Portuguese dogfish (Centroscymnus coelolepis). All four species are included in the OSPAR list of threatened and/or declining species and have also been assessed as globally or regionally threatened by the IUCN; the spurdog is listed as Critically Endangered in the Northeast Atlantic (Vulnerable globally), the leafscale gulper shark as Endangered, the Portuguese dogfish as Near Threatened, and the spotted ray as Least Concern [13]. These species have also been highlighted in recent studies as part of broader functional changes in Northeast Atlantic elasmobranch communities under climate change and anthropogenic pressures, underscoring their ecological roles and conservation relevance [14,15].
These four species were selected based on their conservation status, availability of sufficient occurrence data, and ecological representativeness across depth zones and life-history strategies. Together, they span shelf and deep-sea habitats and include both shark and ray taxa. In addition, these species show characteristics which make their conservation a priority: The two deep-water sharks, leafscale gulper shark and Portuguese dogfish, share key characteristics such as late sexual maturity (30–35 years), low fecundity, and long gestation periods (up to 24 months), making them particularly vulnerable to overfishing and bycatch [16,17]. Both species primarily inhabit the deep continental slopes of the Northeast Atlantic, with the leafscale gulper shark typically found below 1000 m, and Portuguese dogfish between 500–1200 m [18]. Both species display sex- and maturity-dependent spatial segregation and exhibit spatial structuring by sex and maturity across broad geographic ranges [19,20].
The spurdog is widely distributed on continental shelves from Iceland to Portugal with pregnant females likely moving to deeper waters during gestation [21,22]. Spurdogs form large schools and show strong spatial structuring by age and sex. They are slow-growing, with a lifespan of 35–50 years and low reproductive output, which also makes them highly sensitive to fishing pressure [16].
The spotted ray inhabits shallow continental shelf areas (8–150 m depth), often favouring sandy or mixed substrates [23]. Distinct nursery areas have been identified along the British and Irish coasts [24]. Like other batoids, spotted rays are vulnerable to habitat degradation from bottom-contact fishing and coastal development.
In addition to their recognised threat status, several of these species are subject to species-specific protection measures at regional and national levels. For instance, targeted fisheries for spurdog have been prohibited in EU waters since 2010 [25]. The leafscale gulper shark and Portuguese dogfish are affected by bycatch regulations, including zero TACs and associated discarding obligations under EU Council regulations [26]. All four species are listed under Annex V of the OSPAR Convention as threatened and/or declining [27], which commits contracting parties to take appropriate conservation action. Additional management measures are in place for some species under regional frameworks such as the North-East Atlantic Fisheries Commission. Stock assessments and distributional data are provided by ICES Working Group on Elasmobranch Fishes (WGEF), which offers current status evaluations and management advice for sharks, skates, and rays across the Northeast Atlantic [25]. Furthermore, the spurdog and the two deep-water sharks are included as priority species in the ICES Bycatch Risk Evaluation Roadmap, which identifies species at high bycatch risk and recommends enhanced monitoring and mitigation [28].
To improve the protection of these species, firstly the suitable habitats of each these four species that are identified in this study and then, by overlaying the suitable habitats with the current OSPAR MPA network, potential areas for additional MPAs are deduced. The applied integrative framework not only mitigated the challenges posed by data limitations but also provided a scientifically robust basis for advancing conservation efforts. The approach underscores the potential of combining diverse data sources with state-of-the-art modelling techniques to inform marine spatial planning and policy development in the face of ecological uncertainty.

2. Materials and Methods

2.1. General Approach and Definitions

The methodological workflow comprises four main steps aligned with the objectives of this study: (1) data acquisition, preparation, and quality checks, (2) review of species-specific ecological background and preliminary variable pre-selection, (3) statistical variable selection and model fitting and validation, and (4) prediction of suitable habitats and spatial overlay with the OSPAR MPA network (cf., Figure 1). In the following sections, we detail each of these steps. First, relevant elasmobranch species were identified based on conservation priority, data availability, and ecological representativeness (see Introduction Section). Occurrence records and background data were compiled from multiple public databases and literature sources. Key environmental and ecological predictor variables were identified and harmonised across spatial and temporal scales. Species–environment relationships were modelled using generalised additive mixed models (GAMMs), allowing for spatially and temporally explicit predictions of habitat suitability. Resulting suitable habitat maps were compared to the official network of OSPAR Marine Protected Areas (MPAs), as listed in the OSPAR MPA database as of October 2022, in order to assess current coverage and identify protection gaps. It should be noted that OSPAR MPAs do not always spatially align with nationally designated MPAs, and boundaries or designations may evolve over time. Based on the spatial overlay of predicted suitable habitats and MPAs, recommendations for additional area-based conservation measures were derived. Model outputs and intermediate steps were validated and visualised at relevant spatial resolutions.
In this study, ‘habitat suitability’ refers to the estimated relative potential for species occurrence across the study area as derived from statistical species distribution models (SDMs), representing environmental suitability under low anthropogenic pressure, rather than the observed occurrence patterns (that may be influenced by external pressures such as fisheries activity). ‘Prediction uncertainty’ describes the spatial variability in model outputs arising from data sparsity, differing survey efforts, or environmental heterogeneity, indicating where model results should be interpreted with caution. The term ‘hotspot’ is used to denote areas with relatively high predicted habitat suitability, highlighting potentially suitable habitats for the species of interest. ‘Suitable habitat’ is defined in detail below.

2.2. Species Data: Sources, Preparation, and Suitability for Modelling

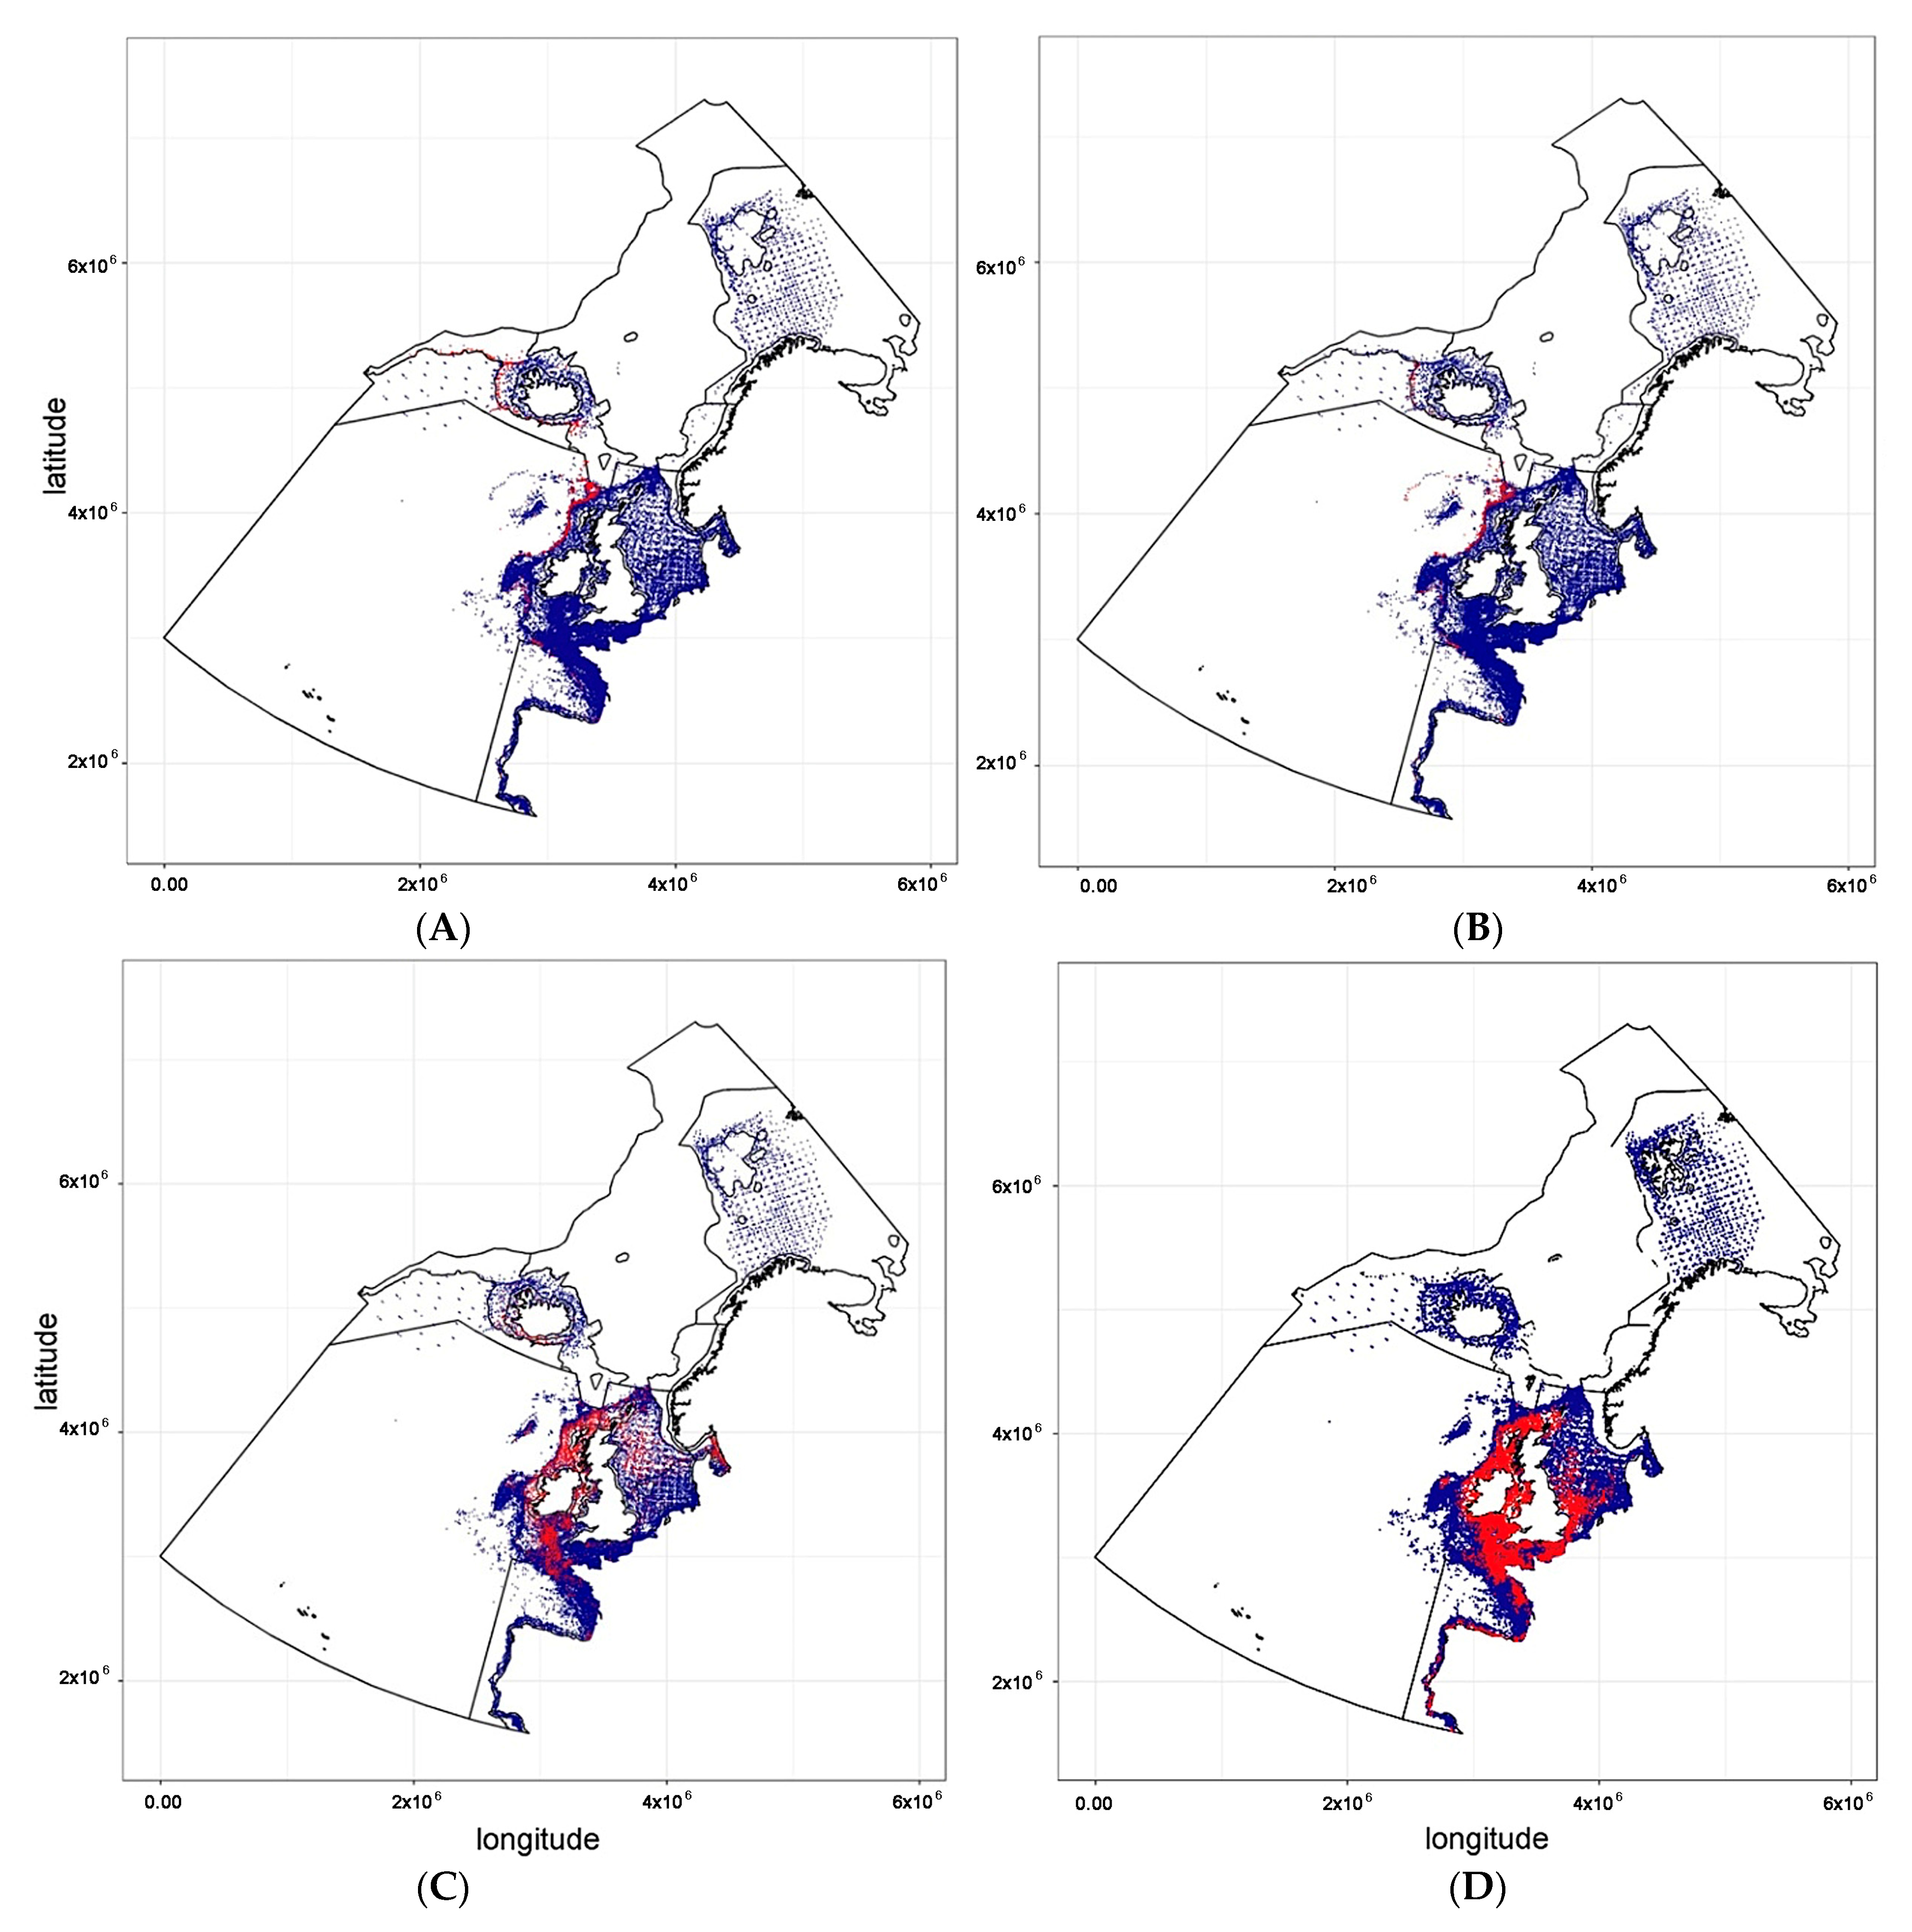
To achieve maximal spatial coverage of the entire OSPAR maritime area, species presence data were compiled from multiple sources covering the period 2000–2022. These included the ICES DATRAS datasets [29], bottom trawl data from the Norwegian Institute of Marine Research [30], data from observer programmes such as ObsMer [31], scientific surveys around Iceland [32], and ICES deepwater elasmobranch surveys [33]. The ObsMer dataset, which is not publicly accessible, was made available through direct collaboration with Ifremer and used primarily in and around the French EEZ, where it provides extensive fishery-dependent records. To ensure comparability across all data sources, including ObsMer, DATRAS, and national survey data, only gear types yielding a sufficient number of observations for the target species were retained. This approach excludes gear types that were ineffective in sampling the species of interest, thereby improving the robustness of the analyses. Standardisation to catch per haul or hour was applied where metadata allowed, and observations with incomplete sampling effort or inconsistent gear identifiers were excluded. Further details on the gear selection, standardisation steps, and haul duration estimation procedures are provided in Supporting Material S4. Because the applied modelling approach does not require estimates of absolute densities or population sizes, absolute correction factors for gear-specific catchability were not applied. Nevertheless, the potential for imperfect detection was addressed by including survey- and gear-specific identifiers as covariates (random factors) in the models. This helps to control for variation in species detectability due to differences in sampling method, spatial coverage, or operational practices [34]. An overview of the raw haul-level data prior to spatial and temporal pooling including summary statistics on presence–absence ratios for each species, along with the total number of hauls and proportion of zero catches, are provided in Table 1; presence-absence maps of available survey-based count data are given in Figure 2.

2.3. Definition and Validation of Suitable Habitats

Throughout this study, the term “suitable habitat” is used in a statistical sense to refer to areas of high predicted habitat suitability for the focal species, as derived from species distribution models (SDMs). This usage does not imply confirmed ecological function such as spawning, nursery, or feeding grounds and should be interpreted with caution, especially in light of conceptual ambiguities surrounding habitat terminology in marine management contexts [35]. Due to the limited availability of data, especially concerning sex, size, and maturity classes, suitable habitats were modelled using the maximum available data, incorporating findings from all sexes, sizes, and maturity groups. The modelling method focused on habitat suitability, emphasising only the relative values of habitat suitability to identify areas of relative importance rather than predicting absolute abundance or density. Thus, suitable habitats are defined as areas of relative importance for the considered species—independent of age and sex. To allow for comparability between species, we rescaled the predicted species-specific values to be ≤1 (more details are given below). The resulting patterns of relative habitat suitability do not automatically reflect the actual relative abundance or distribution of the animals [36], but it is assumed that these are closely related in the absence of movement barriers. Therefore, when validating and checking the plausibility of model results (such as in comparison with previous studies on abundance), no strict distinction was made between relative species abundance and relative habitat suitability.

2.4. Predictors: Sources and Preparation

Possible predictor variables have been obtained from multiple sources, with partially different levels of temporal and spatial extent and/or resolution. Like the species data, we have intended to include data for all variables that could significantly influence species distribution, as indicated by our species-specific background documents (cf., Supporting Materials S2 and S3) and not to exclusively use variables with optimal spatio-temporal resolution. Spatial data gaps, which can, e.g., be found near coastlines, have been filled by allocating each missing-value pixel the value of the nearest pixel with available data.
All variables were also tested during variable selection (cf. below) using log-transformed values, as this can improve model performance by normalising skewed distributions, reducing heteroscedasticity, and capturing nonlinear relationships [37]. Additionally, ocean regions with pronounced environmental gradients, such as oceanic fronts (marked by strong salinity and/or temperature gradients) or continental slopes (defined by changes in water depth), are often of high ecological importance [38,39,40]. To account for these dependencies, the spatial gradient for each variable was also calculated and tested. Furthermore, the spatial gradient of each log-transformed variable was calculated and tested. Additional details regarding the various data sources can be found in Supporting Material S3.

2.5. Statistical Methods

Modelling Method. For all species under consideration, we used generalised additive mixed models (GAMMs) adapted from Mercker et al. (2021) [5] to describe spatio-temporal distributions based on effort-standardised ecological count data. To improve model stability and account for spatial and temporal autocorrelation, as well as to reduce zero-inflation, the data were pooled into larger spatial-temporal units prior to model fitting [5]. These models can in addition incorporate nonlinear species–environment relationships, overdispersion, and varying detection probabilities [8,9,10,41].
The response variable in all models was the number of individuals per haul, normalised by haul duration (individuals per hour), allowing for an effort-standardised measure of abundance suitable for regression-based modelling. Incorporating detection-related variables (such as fishing gear), using effort-standardised count data, and modelling temporal patterns helped to reduce sampling bias compared to traditional presence–absence or presence-only approaches. Importantly, we acknowledge that gear type can significantly influence catchability due to gear-specific sampling depths or mesh sizes. To correct for this, the variable “fishing gear” was included as a random intercept effect in all models.
However, as noted by Refs. [5,42], several assumptions must be met, and appropriate steps must be taken to obtain reliable results from GAMM-based methods. Because this study focuses on relative spatial distribution patterns rather than absolute abundance or density estimates, an integrative approach is appropriate, as it captures spatial differences in habitat suitability rather than requiring precise estimates of absolute densities.
During the GAMM analysis we used a negative-binomial distribution, which is well-suited for describing (potentially overdispersed) count data [8]. All continuous predictors were modelled as smooth regression splines with a maximum degree of freedom of k = 3 (to prevent overfitting), with final smoothness estimated using generalised cross-validation [9]. Temporal autocorrelation was incorporated based on the methods of Ref. [5] and spatial autocorrelation was considered, if present, using a spatial 2D-spline smooth [9].
The general structure of the GAMM used for each species can be expressed as follows: log (E [Y_ij]) = α + s_1 (X_1ij) + s_2 (X_2ij) + … + s_p (X_pij) + b_gear_j + ε_ij, where Y_ij is the number of individuals of species i in haul j, α is the intercept, s (X_pij) denotes the smooth effect of the p-th environmental covariate, and b_gear_j is the random effect for fishing gear. This formulation was used for all four species, differing only in the species-specific data and covariate sets.
Model evaluation was performed based on graphical inspection of residuals, following standard practice for GAMM analyses [43,44], and considered, among others, linearity, homogeneity, normality of the random intercept, and independence.
Choice and verification of the relevant model and variables. Environmental predictor variables were sourced from publicly available databases (e.g., GEBCO 2020 for bathymetry, NASA AQUA MODIS for sea surface temperature, Barcelona Expert Center for salinity, EEA for estuarine distances, Marine Conservation Institute for sea floor temperature, and Global Fishing Watch for fishing activity—cf., Supporting Material S3). Spatial resolutions ranged from approximately 1 km to 9 km, and temporal coverage aligned with the species occurrence data (2000–2022). To capture both linear and nonlinear ecological relationships, variables were used in their original scale, logarithmic form, and as spatial gradients (cf. Supporting Material S3). The final set of predictors (after predictor selection, cf. below) varied slightly across species and comprised depth, sea surface and seafloor temperatures, salinity, distance to the coast and estuaries, sea floor lithology, and fishing activity. These variables were selected based on prior ecological knowledge (cf. Supporting Material S2) and screened for collinearity and statistical significance prior to final model fitting. Detailed information on data sources, processing steps, and variable characteristics can be found in the Supplementary Materials. Given these numerous potential predictor variables, including their different transformed versions, it is crucial to effectively pre-select variables before applying the final GAMM. This process helps identifying the relevant subset of all theoretically relevant variables resulting in ecologically sound and parsimonious models. Here, we used the “least absolute shrinkage and selection operator” (LASSO) method [45,46] which is a modern method for efficient model and variable selection [43]. Since LASSO is not directly implemented for GAMMs with a negative-binomial distribution, we selected the 15 most promising variables combining a generalised linear mixed model (GLMM) approach [10] with LASSO using a Poisson probability distribution and polynomial formulations (up to the order of 3) for all predictors. These 15 variables were then used as nonlinear predictors (with a maximum of 3 degrees of freedom—cf., above) in the GAMM fit. From this, we further refined the set by including only those covariates that showed a significant (p < 0.05) contribution in the final GAMM, yielding approximately ten covariates per species. This approach balanced ecological comprehensiveness with statistical parsimony, allowing the models to capture the range of environmental influences while maintaining interpretability and robust predictive performance given the available data density for each species.
Predicting the relative habitat suitability. Predicting the relative habitat suitability was relatively straightforward, utilising the respective predict functions available in the R package mgcv version 1.9-1 [47] and based on the various predictor variables given across the entire OSPAR maritime region. However, some modifications were made to enhance accuracy and avoid speculative extrapolations: First, predictions were limited to spatial buffers around reported occurrence points rather than the entire OSPAR region. The size of each buffer was set to 250 km and only buffers containing more than two occurrence points were considered, excluding potential false-positive observations. We checked that the predictions were robust regardless of the specific buffer size chosen. Second, for the prediction of relative habitat suitability, all human activity variables (e.g., fisheries intensity and shipping densities) were set to zero. This approach allows estimating species distribution patterns under ideal or ‘least disturbed’ conditions, providing a baseline that reflects the species’ potential habitat in the absence of significant anthropogenic pressures. By doing so, we can better identify suitable habitats that could benefit most from targeted conservation measures. Third, the maximum and minimum values of the predictor variables were constrained to the range observed in the values associated with all survey data points to minimise issues related to extrapolation (e.g., in coastal areas). Lastly, the final predicted relative habitat suitability patterns were rescaled to range from 0 to 1 (unsuitable–highest suitability) by dividing each prediction value by the 99th percentile of all predicted values (i.e., S_ij = Y_ij/q_99), yielding a robust measure of relative habitat suitability that reduces the influence of outliers. This approach allows for more consistent and comparable maps across species and habitats.
Estimation of prediction uncertainties. To estimate prediction uncertainties, we generated 10 different resamples of the original data frame used for modelling, using a “random draw with replacement” method. For each spatial pixel, the difference between the minimum and maximum predicted values from these resamples was calculated, providing an indication of uncertainty (see Supporting Material S1). This process roughly corresponds to the spatial variation in the 90% confidence intervals for relative habitat suitability. Importantly, uncertainties related to the intercept were not considered, as the focus was on relative changes across space rather than estimating total abundance or density.
Derivation of locations suitable for new/additional MPAs. To identify areas suitable for new or additional MPAs, several factors need to be considered: (a) Different species exhibit varying degrees of “patchiness” in the distribution of, and association with, suitable habitats. As a result, different total areas of protected areas might be needed to achieve similar levels of protection. (b) The percentage of suitable habitats already preserved by existing MPAs varies among species, influencing the need for further MPAs. (c) The quality of our predicted suitable habitats varies depending on the species and location/region (see Supporting Material S1). (d) For some species and identified locations, conservation measures may only be necessary during certain times of the year, such as for migratory species or during breeding seasons. (e) Predicted suitable habitats of different species may overlap. (f) MPAs need a certain size to be able to achieve their conservation objectives (not only covering a few square kilometres). In the presented approach, (a)–(e) are considered, whereby (f) is outside the scope of this study and was therefore not considered further in this paper (cf., below).
Based on these considerations, we developed a method to identify species-specific areas (suitable habitats) adequate for designating additional MPAs in the OSPAR region. The primary objective was to protect approximately 30% of these suitable habitats for each species. This goal aligns with the OSPAR North-East Atlantic Environment Strategy 2030, specifically operational objective S5.O1, whose target is to expand the MPA network to cover a minimum of 30% of the OSPAR maritime region by 2030. However, an area coverage above 25% was considered as an acceptable target value providing a good status of protection for our study. Thus, our goal was to protect at least 25% but preferably 30% of the species-specific suitable habitats.
To identify potential new MPAs (and similar to Ref. [6]), we first calculated the integral of the predicted relative habitat suitability across the whole OSPAR region (∫all). We then calculated this same integral but limited it to currently existing MPAs (∫ex). Hence, ∫all represents the total amount of suitable habitats within the OSPAR region, while ∫ex represents the proportion of suitable habitats lying within current MPAs. The ratio of these two measures (multiplied by 100) provides the percentage of species-specific suitable habitats already covered by existing MPAs. The next step involved identifying new areas (MPAnew) to add to the existing MPA network (MPAex). The goal here was to ensure that they cover 30% of the species-specific suitable habitats in the most effective manner meaning with the smallest possible total area for MPAnew. We accomplished this by sequentially adding the 1 × 1 km pixel with the highest predicted habitat suitability (not already part of MPAex or MPAnew) to MPAnew until the combined integral over MPAex and MPAnew reached 30% of ∫all. Essentially, we added “free” pixels with the highest predicted habitat suitability to the proposed protected area network until 30% of the suitable habitat was protected.

3. Results

The habitat suitability models showed good overall fit, as indicated by graphical residual diagnostics and the plausibility of predicted patterns when compared with independent and historical data. Spatial prediction uncertainty was generally low within well-sampled core areas, while higher uncertainty was observed at distribution margins and in regions with sparse data (Supporting Material S1). These results suggest that the models provide a reliable basis for identifying key areas of suitable habitat across the study region.
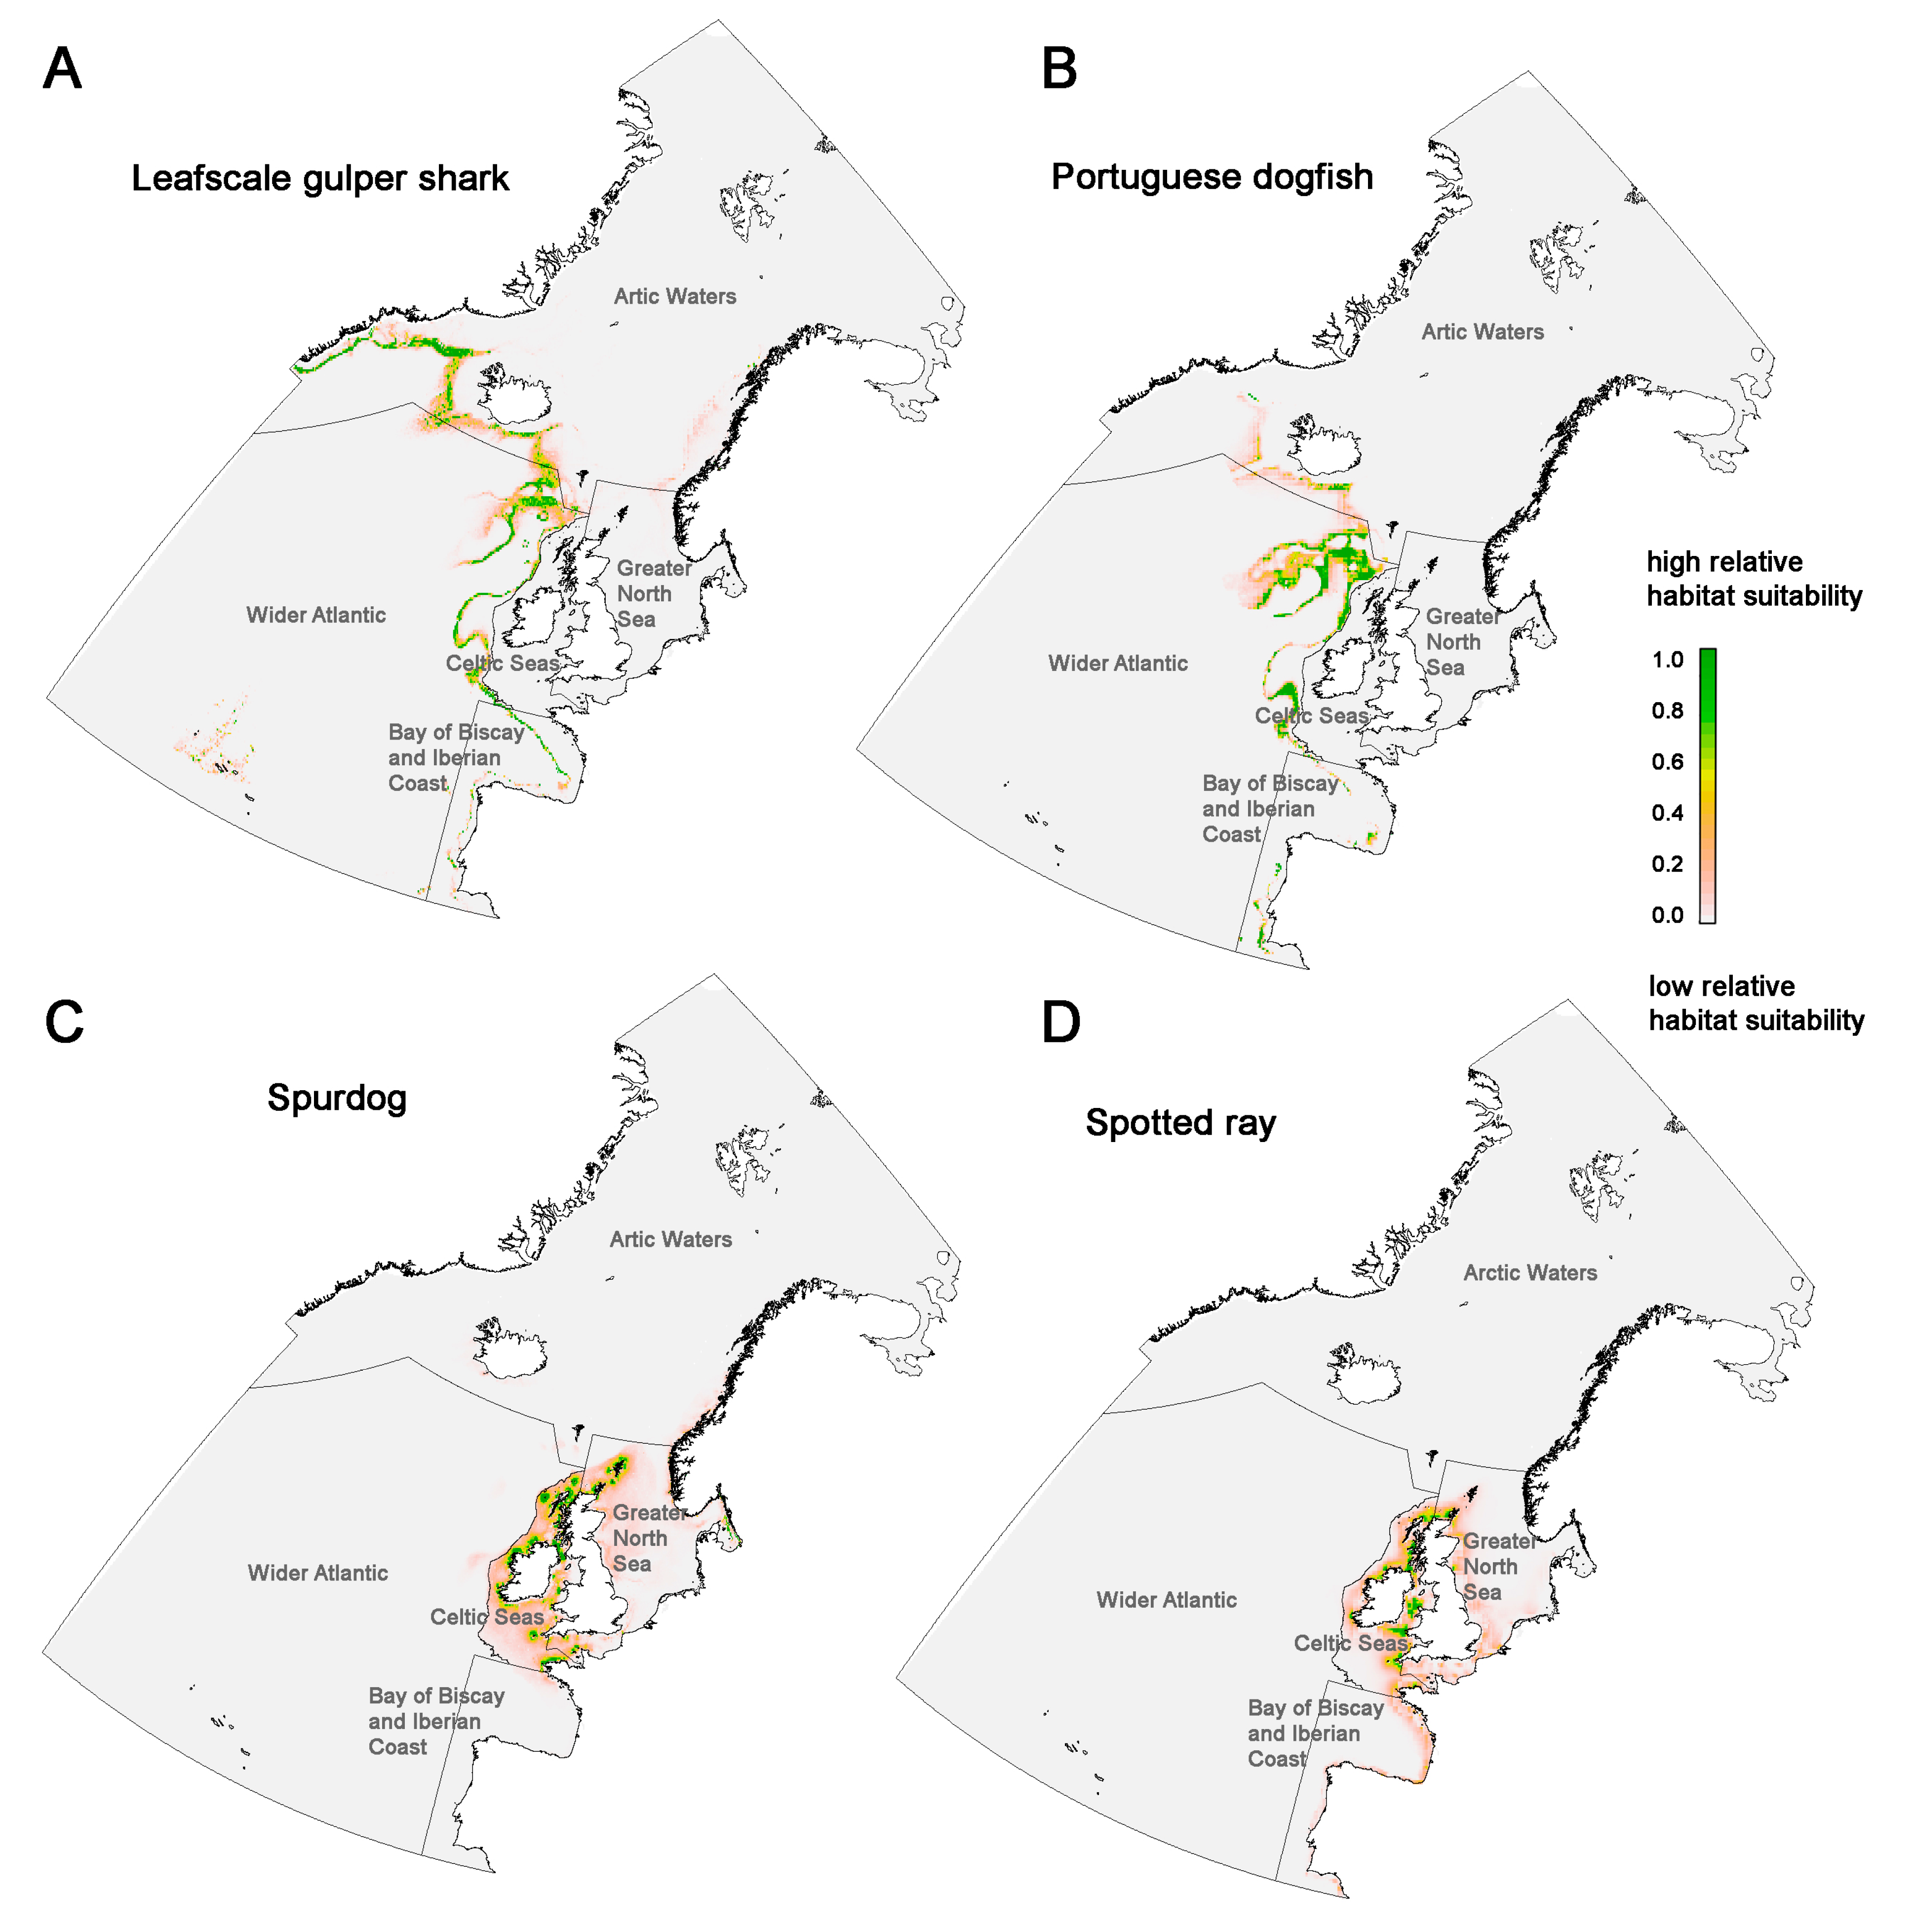
The results for the four elasmobranch species are presented below (Figure 3 and Figure 4). In particular, our analysis shows that 25.8% of the spotted ray’s suitable habitats are already covered by existing MPAs. Therefore, further MPAs are not urgently required for this species. The suitable habitats of spurdogs are also well represented within existing MPAs, with 18.8% coverage. However, additional MPAs are recommended to further increase protection for this species. Finally, only 6.0% of the leafscale gulper shark’s suitable habitats are currently protected, an order of magnitude comparable to that of the Portuguese dogfish (6.8%). Thus, in the case of the two deep-sea sharks, the current MPA coverage is more than inadequate and the installation of specific MPAs is urgently required in our view. However, model performance and prediction uncertainty varied across species. As illustrated in the uncertainty maps (Supplementary Material S1), species with well-sampled shelf habitats (spurdog and spotted ray) showed low prediction uncertainty within their core distribution areas, with uncertainty increasing towards range margins and less-sampled areas. In contrast, deep-water species (leafscale gulper shark and Portuguese dogfish) exhibited higher overall prediction uncertainty, especially along deep-water continental slopes where survey data were sparse. These spatially explicit error estimates provide an important complement to statistical measures of model fit, highlighting areas where model predictions should be interpreted with caution. The detailed species-specific results are presented below.

3.1. Leafscale Gulper Shark (Centrophorus squamosus)

Tested and selected predictor variables. The following predictors (incl. transformed values) have been tested during LASSO-based variable selection for this species: water depth, sea surface temperature, sea floor temperature, sea surface salinity, fishery intensity, month, and nearest distance to the coast. More detailed information on these variables, data sources, and transformed variants of these variables are given in the Supporting Materials S2A and S3. After LASSO-based selection, the following variables remained as predictors: water depth (untransformed and log-transformed), sea floor temperature (untransformed and as a spatial gradient), month, distance to the coast, sea surface salinity, spatial gradient in sea surface temperature (untransformed and log-transformed), and the spatial gradient in water depth.
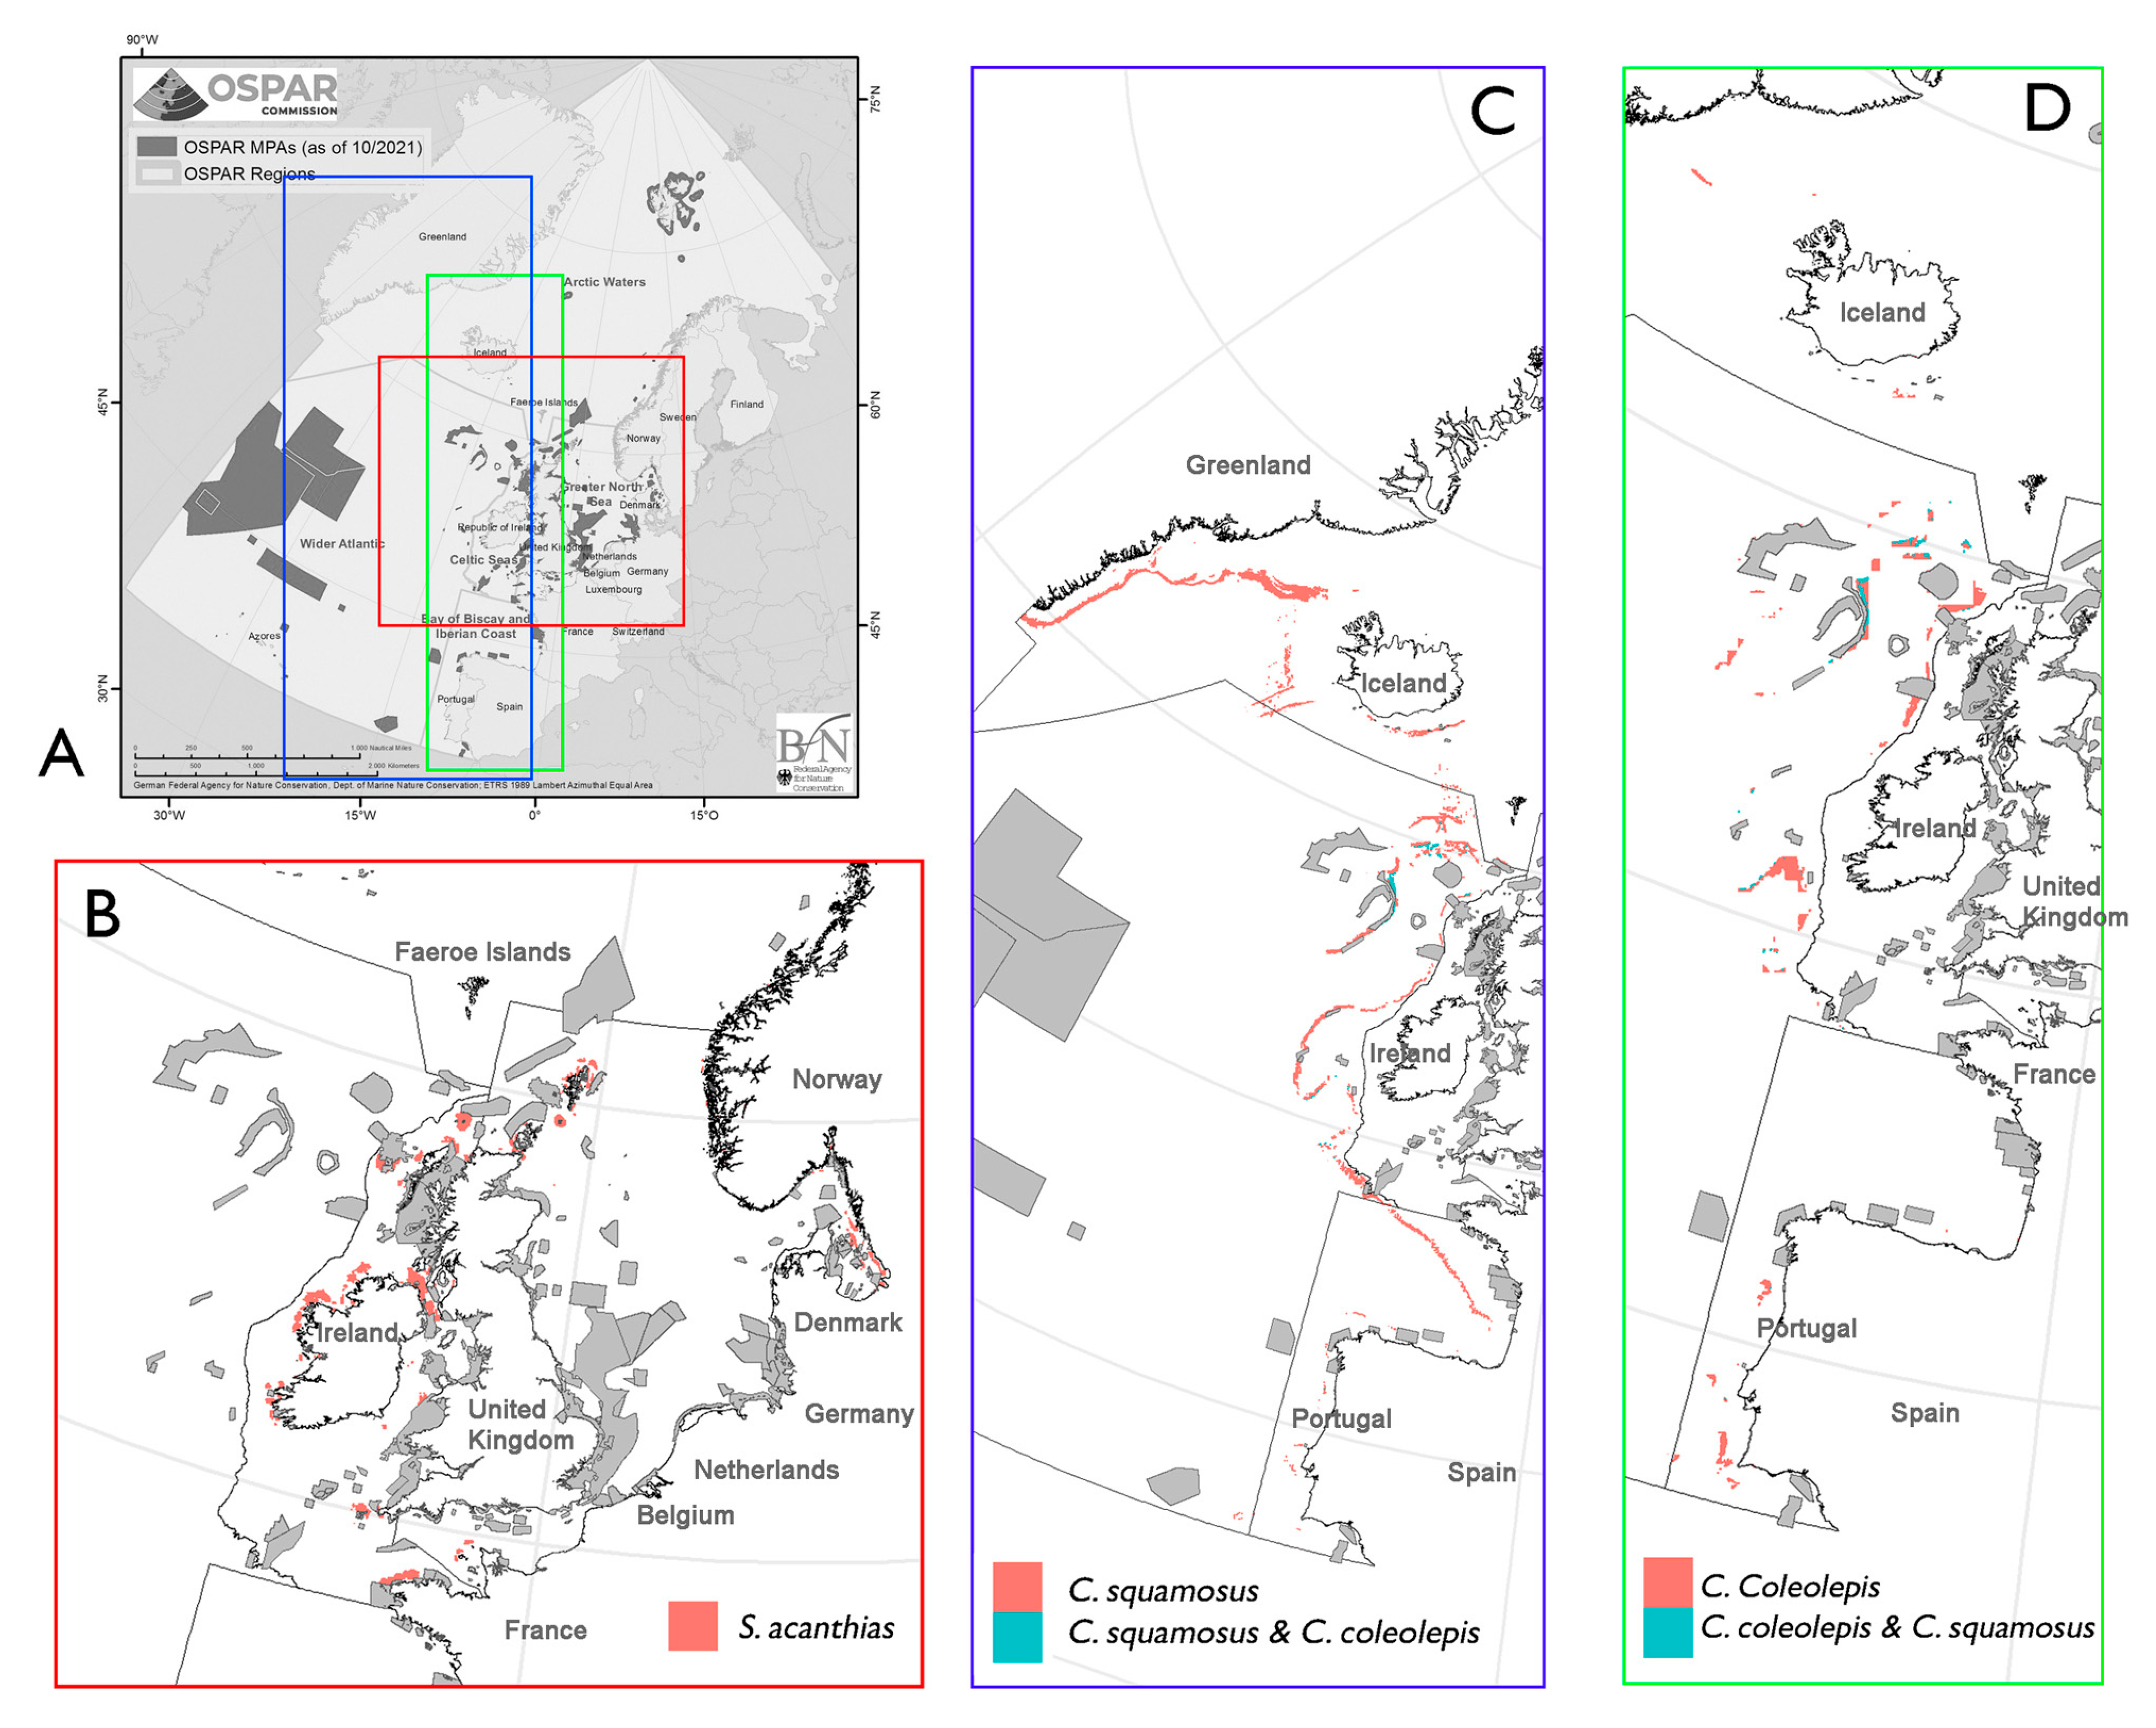
Predicted habitats and identified areas suitable for additional MPAs. The predicted relative habitat suitability for leafscale gulper sharks concentrates along continental slopes near Iceland, Ireland, and Scotland. Suitability gradually decreases further south along the slopes west of France, Spain, and Portugal. (Figure 3A). A notable hotspot is also predicted offshore between Scotland and Iceland. Our calculations suggest that currently, only 6.0% of the suitable habitats predicted for leafscale gulper sharks are already covered by the existing OSPAR MPA network. The proposed areas suitable for MPAs to enhance protection of the leafscale gulper shark are shown in Figure 4C.

3.2. Portuguese Dogfish (Centroscymnus coelolepis)

Tested and selected predictor variables. Based on previous literature (cf., Supporting Materials S2 and S3), water depth stands out as one of the key predictors for this species, with sea temperatures (sea surface and seafloor) and salinity also playing significant roles. Additionally, given the presence of distinct migration pathways, it is essential to account for seasonal variations by incorporating time-of-year variables (month) and nearest distance to the coast. These predictors (incl. transformed values) have been tested during LASSO-based variable selection. More detailed information on these variables, data sources, and transformed variants of these variables are given in the Supporting Materials S2 and S3. After LASSO-based selection, the following variables remained as predictors: water depth, spatial gradient of sea surface temperature and sea floor temperature, spatial gradient of water depth, sea floor temperature, and month.
Predicted habitats and identified areas suitable for additional MPAs. The predicted relative habitat suitability for Portuguese dogfish is related to those of the leafscale gulper sharks’ but with several notable differences across large, medium, and small spatial scales (Figure 3A vs. Figure 3B). Overall, our predictions suggest that currently, only 6.8% of the suitable habitats predicted for Portuguese dogfishes are covered by the existing OSPAR MPA network. Our model predicts on a large scale that suitable habitat for Portuguese dogfish extends less westward of Iceland compared to that of leafscale gulper sharks, as also visible in our raw data plots (see Figure 2A vs. Figure 2B). On a medium scale, the predicted hotspot for Portuguese dogfish in the Irish/Scottish/Icelandic offshore area extends further westwards than that of leafscale gulper sharks. On a small scale, Portuguese dogfish tend to inhabit shallower areas on continental slopes (primarily deeper than −500 m) compared to leafscale gulper sharks. Consequently, the proposed MPAs for the two shark species are geographically proximate but not identical. Indeed, the proposed areas for suitable habitats (Figure 4C vs. Figure 4D) show only minor overlap.

3.3. Spurdog/Spiny Dogfish (Squalus acanthias)

Tested and selected predictor variables. The following natural predictors (incl. transformed values) have been investigated during LASSO-based variable selection for this species: nearest distance to the coast, month, water depth, temperature (of sea surface and seafloor), salinity, chlorophyll a, and bottom slope (continental shelves). In addition, fishing activity and ship density have been considered with regards to anthropogenic activity. More detailed information on these variables, data sources, and transformed variants of these variables are given in the Supporting Materials S2 and S3. After LASSO-based selection, the final set of predictors included the following: spatial gradient in sea surface salinity, chlorophyll a, spatial gradient of chlorophyll a, sea surface temperature, untransformed sea surface temperature, and logarithm of sea surface temperature, logarithm of water depth, distance to coast (both untransformed and logarithmic), fishing intensity, the logarithm of shipping density, and month.
Predicted habitats and identified areas suitable for additional MPAs. The primary distribution of suitable habitat for this species (Figure 3C) occurs in spotty/fragmented patterns within the continental shelf waters surrounding Ireland, as well as in the waters to the north, west, and southwest of the UK. Overall, our predictions suggest that currently, 18.8% of the suitable habitats are covered by the existing OSPAR MPA network. Figure 4B illustrates the proposed areas suitable for establishing new spurdog-specific MPAs. Overall, suitable habitats are already well-represented within existing MPAs. However, additional protection can primarily be achieved by expanding the existing protection areas of certain MPAs and establishing new ones along the French and Irish coasts.

3.4. Spotted Ray (Raja montagui)

Tested and selected predictor variables. The following predictors (incl. transformed values) have been investigated during LASSO-based variable selection for this species: water depth, nearest distance to the coast, nearest distance to an estuary, sea floor temperature, sea surface salinity (as an additional proxy for estuaries), sea floor lithology, month, and commercial gillnet fishery intensity. More detailed information on these variables, data sources, and transformed variants of these variables are given in the Supporting Materials S2 and S3. After LASSO-based selection, the following variables remained as predictors: spatial gradient of sea surface salinity, spatial gradient of sea floor temperature, logarithm of water depth, sea surface salinity, sea floor temperature, logarithm of sea floor temperature, logarithm of nearest distance to shore, year, logarithm of nearest distance to estuaries, and logarithm of gillnet fishing intensity.
Predicted habitats and proposed areas suitable for additional MPAs. Predicted high values of relative habitat suitability for the spotted ray are mainly centred around the British Isles (Figure 3D). Our results suggest that for this species, 25.8% of the predicted suitable habitats are already covered by the existing OSPAR MPA network. This is beyond the above-defined threshold of 25% and additional areas for potential new MPAs are thus not proposed for this species.

4. Discussion

Applying a robust statistical modelling approach to a very large and diverse dataset, the present study identifies suitable habitats of four threatened elasmobranch species in the Northeast Atlantic despite the variable quality and quantity of available data. In addition, overlaying these habitats with the existing OSPAR MPA network allowed the identification of areas that could contribute substantially to the protection of these species if designated as appropriately managed MPAs. Thus, our study provides important insights for improving marine conservation efforts in the OSPAR maritime area.
In particular, our findings show that while existing OSPAR MPAs already provide some level of protection for the spurdog and particularly the spotted ray, significant gaps remain for both considered deepwater sharks. This highlights the value for a targeted and data-driven approach to MPA designation, ensuring that key habitats essential for the survival of endangered species are adequately protected. By combining diverse datasets with advanced modelling techniques, our approach addresses the challenges posed by limited and heterogeneous data availability, offering a robust scientific basis for future conservation planning. This approach is especially relevant for assessing the current state of species distribution and habitat use across the Northeast Atlantic, providing a robust baseline for future monitoring and climate-informed spatial conservation planning [14].
The predicted patterns of relative habitat suitability for the leafscale gulper shark in the OSPAR maritime region are concentrated at the continental slopes in deep water regions south and south-west of Iceland and west of Ireland and Scotland and are decreasing/fading in a southerly direction along the slopes west of France, Spain, and Portugal. These results correspond well with the survey catch plots presented in Ref. [48]. In addition to these well-known accumulations, an additional distinct hotspot is predicted offshore between Scotland and Iceland (Figure 3A and Figure 4C). Although survey data are sparse in this area (cf. Figure 2A), the available records reveal a relatively high number of positive catches supporting these model-based predictions. In addition, this offshore region also appears as a hotspot for this species in evaluations of commercial trawl-, longline-, and research survey data [19].
In contrast, there are distinct differences between our predicted patterns and figures estimating the global distribution range of this species (Ref. [49], also presented in Ref. [50]) when considering the north-western part of the species distribution within the OSPAR region. In particular, our model predicts (in accordance with our raw data plots—c.f., Figure 2A) that suitable habitats for this species are also distributed along the continental slopes west of Iceland, approaching the continental slopes of Greenland, whereas Compagno et al. (2005) [49] suggest a much more southward-pointing distribution west of Iceland, namely in a curved belt finally reaching the latitudes of southern Europe. Due to the regular occurrences of this species in our survey data from the continental slopes west of Iceland and close to Greenland, we assume our predictions to be empirically well-grounded here. Although no survey data (nor presence-only data for additional validation) were available for the predicted southerly pointing belt as suggested by Ref. [49], this does not exclude that additional suitable habitats may be located there. In any case, suitable habitats of this species are poorly covered (only 6% overlap) by existing MPAs so far. These 6% of existing MPAs overlapping with the suitable habitats of this species mainly concern only few deep-sea regions far offshore west and north-west of Scotland/Ireland (c.f., Figure 4C). An expansion of the protected areas along the predicted hotspots could result in a relatively strong increase in the protection of this species with only moderate spatial expansion required for new MPAs, yielding a potentially significant gain in habitat protection.
The predicted relative habitat suitability for the Portuguese dogfish is given in Figure 4D. In general, the predicted relative habitat suitability pattern for Portuguese dogfish is related to that for the leafscale gulper shark (cf., above and Figure 4C), but with several distinct differences at large, medium, smaller spatial scales: On a small scale (in accordance with the observations of Ref. [48]), Portuguese dogfish occupy shallower regions on continental slopes (mainly >−500 m) compared with leafscale gulper sharks (mainly <−500 m). The proposed MPAs are thus spatially close but show only minor overlap (Figure 4C,D). On a medium scale, the predicted hotspot in the offshore region between Ireland/Scotland and Iceland extends further west compared with that for leafscale gulper sharks. Indeed, in contrast to leafscale sharks, survey catches of Portuguese dogfish are reported in these westerly regions (as presented in Ref. [48]) and this difference is also indicated by our raw data plots (cf., Figure 2B). On a large scale, suitable habitat for Portuguese dogfish predicted by our model extends less far to the west of Iceland compared with that for leafscale gulper sharks (also indicated by our raw data plots). That said, the data of Ref. [48] showed no apparent corresponding difference, and evaluations of commercial trawl, longline, and research survey data presented in Moura et al. (2014) [19] suggest the opposite (in accordance with Ref. [49]). The situation remains therefore unclear. In south Europe, our model predicts greater habitat suitability for Portuguese dogfish vs. leafscale sharks, with particular hotspots on the continental slopes along the Portuguese coast (except the north). Overall, suitable habitats for this species are inadequately represented by existing MPA, whereby some additional areas could optimize its protection by extending proposed MPAs for the leafscale gulper shark and Portuguese dogfish at the same time (Figure 4C,D).
With respect to the spurdog, the primary distribution of suitable habitat for this species (Figure 3C) occurs in spotty/fragmented patterns within the continental shelf waters surrounding Ireland, as well as in the waters to the north, west, and southwest of the UK. This result corresponds to the results of Refs. [51,52] presenting patterns based on catch rates and to the results of Ref. [24] evaluating the nursery grounds, all observing the highest concentrations of this species in suitable habitats in the northwest of Scotland and north of Ireland. Furthermore, beyond the range analysed by Refs. [24,51], our model identifies additional suitable habitats in French waters west of the English Channel, aligning with the presence/absence distributions reported by Elliott et al. (2020) [15].
Finally, the predicted distribution of spotted rays within the OSPAR maritime area is largely centred around the British Isles (Figure 3D), aligning with the spatial patterns presented in Ref. [51]. The only notable difference is that we predict low abundances west and southwest of Ireland, whereas Ref. [51] reported higher historical catch rates. These differences could reflect a shift in distribution due to localised population declines or recovery dynamics over time, as well as differences in the temporal windows of the available data. Whereas the Ref. [51] data were based primarily on earlier survey periods, our study focuses on more recent data (2000–2022), potentially capturing changes in distribution patterns. Such discrepancies highlight the importance of considering both temporal and spatial dynamics when interpreting habitat suitability results. Similar long-term spatial shifts have been observed for spotted rays and other elasmobranchs [14,53,54,55]. The identification of nursery grounds for this species also shows only low densities of juveniles in the southwest UK [24], supporting a subordinate role for this area. Since existing MPAs already cover over 25% of the spotted ray’s suitable habitats, further urgent protection measures do not seem required for now. However, this study did not assess whether spotted rays or their suitable habitats are explicitly included in the conservation objectives of these MPAs. Nonetheless, our results align with previous trend estimates, indicating a decline from 2000–2005, followed by a recent recovery from 2010–2017 [33,50].
These findings have direct implications for the implementation of existing marine protection policies, such as the OSPAR 30 × 30 target, which aims to protect at least 30% of the maritime area by 2030. By highlighting spatial gaps within the current MPA network and identifying suitable habitats for threatened species, this study provides a valuable scientific foundation for prioritising new MPAs and enhancing the connectivity and effectiveness of existing protected areas across the OSPAR maritime area. Nevertheless, achieving this target will require addressing significant challenges, including the effective management of MPAs and the consideration of climate-driven shifts in species’ habitats. In this context, future assessments should also integrate climate projections and long-term monitoring data to ensure that conservation measures remain robust and adaptive to changing environmental conditions.

5. Conclusions

In conclusion, the methodological approach and results presented here provide a robust scientific basis for designating new MPAs within the North-East Atlantic to support the ‘30 × 30’ conservation target and to mitigate the vulnerability of threatened elasmobranch species. We demonstrate that >25% of the suitable habitats for the spotted ray are already covered by the existing OSPAR MPA network and suggest enhancing conservation efforts in selected and presented species-specific habitats for the leafscale gulper shark, Portuguese dogfish, and the spurdog, leading to a comparable degree of protection. In particular, for the two deep-sea sharks, whose suitable habitats are by far the least covered by existing OSPAR MPAs, our analysis highlights that protecting specific continental shelf areas would help improve the protection of both species. In addition, also other species that occupy a similar ecological niche, like vulnerable deep-sea demersal fish species along with associated benthic communities, could benefit from MPAs protecting continental shelf areas. By designating new MPAs and managing them appropriately, OSPAR could address one of the most pressing problems of marine conservation of our time: protecting species in the face of ever-increasing pressure on the marine environment, e.g., caused by human activities. We therefore recommend that OSPAR should prioritise the designation of new MPAs applying the integrative approach presented in this study, implement their effective management, and, at the same time, improve data availability through intensified surveys and monitoring efforts.

Supplementary Materials

The following supporting information can be downloaded at: https://www.mdpi.com/article/10.3390/fishes10080393/s1, Supporting Material S1: prediction uncertainties (including Figure S1A–D: Minimum and maximum predicted values for relative habitat suitability from GAMM-based analyses evaluated for 10 resamples for the four considered species); Supporting Material S2: species-specific background documents (including Table S2A–D: Important variables to model critical habitats of the four considered species [56,57,58,59,60,61,62,63,64,65,66,67]); Supporting Material S3: predictor variables and sources; Supporting Material S4: Species data filtering and standardisation procedures.

Author Contributions

Conceptualisation, M.M. (Moritz Mercker); Methodology, M.M. (Moritz Mercker); Software, M.M. (Moritz Mercker); Validation, M.M. (Moritz Mercker); Formal Analysis, M.M. (Moritz Mercker); Investigation, M.M. (Moritz Mercker); Data Curation, M.M. (Moritz Mercker); Writing—Original Draft Preparation, M.M. (Moritz Mercker); Writing—Review and Editing, M.M. (Moritz Mercker), M.M. (Miriam Müller), T.W. and J.H.; Visualisation, M.M. (Moritz Mercker); Supervision, M.M. (Miriam Müller), T.W. and J.H.; Project Administration, M.M. (Miriam Müller) and J.H.; Funding Acquisition, J.H. All authors have read and agreed to the published version of the manuscript.

Funding

This work was founded by the German Federal Agency for Nature Conservation (BfN); grant number (Förderkennzeichen): FKZ 3521532209.

Institutional Review Board Statement

No ethical approval was required for this study, as it did not involve any direct experimentation, handling, capture, or observation of animals. This research is based solely on the analysis of secondary data acquired from various external sources.

Informed Consent Statement

Not applicable.

Data Availability Statement

No new data were created or analysed in this study. All underlying data sources are cited in the main text or the Supplementary Materials. Original datasets can be requested directly from the respective data providers as referenced.

Acknowledgments

We greatly thank the many helpful experts who strongly contributed to this project in various ways, e.g., providing data and information, critically proofreading the results, or referring us to further experts and/or data.

Conflicts of Interest

The authors declare no conflicts of interest.

References

  1. Geelhoed, S.C.V.; Authier, M.; Pigeault, R.; Gilles, A.; Carlström, J.; Evans, P.; Haelters, J.; Hammond, P.; Louzao, M.; Rogan, E.; et al. Abundance and Distribution of Cetaceans; OSPAR Commission: London, UK, 2023. [Google Scholar]
  2. Hooker, S.K.; Canadas, A.M.; Hyrenbach, K.D.; Corrigan, C.; Polovina, J.J.; Reeves, R.R. Making Protected Area Networks Effective for Marine Top Predators. Endanger. Species Res. 2011, 13, 203–218. [Google Scholar] [CrossRef]
  3. Blasco, G.D.; Ferraro, D.M.; Cottrell, R.S.; Halpern, B.S.; Froehlich, H.E. Substantial Gaps in the Current Fisheries Data Landscape. Front. Mar. Sci. 2020, 7, 612831. [Google Scholar] [CrossRef]
  4. OSPAR Commission North-East Atlantic Environment Strategy 2030. 2021. Available online: https://www.ospar.org/convention/strategy (accessed on 22 July 2025).
  5. Mercker, M.; Markones, N.; Borkenhagen, K.; Schwemmer, H.; Wahl, J.; Garthe, S. An Integrated Framework to Estimate Seabird Population Numbers and Trends. Jour. Wild. Mgmt. 2021, 85, 751–771. [Google Scholar] [CrossRef]
  6. Mercker, M.; Müller, M.; Werner, T.; Hennicke, J. Identification of Key Habitats of Bowhead and Blue Whales in the OSPAR Area of the North-East Atlantic—A Modelling Approach towards Effective Conservation. J. Mar. Sci. Eng. 2024, 12, 1445. [Google Scholar] [CrossRef]
  7. Mendel, B.; Schwemmer, P.; Peschko, V.; Müller, S.; Schwemmer, H.; Mercker, M.; Garthe, S. Operational Offshore Wind Farms and Associated Ship Traffic Cause Profound Changes in Distribution Patterns of Loons (Gavia spp.). J. Environ. Manag. 2019, 231, 429–438. [Google Scholar] [CrossRef]
  8. Lindén, A.; Maentyniemi, S. Using the Negative Binomial Distribution to Model Overdispersion in Ecological Count Data. Ecology 2011, 92, 1414–1421. [Google Scholar] [CrossRef]
  9. Wood, S. Generalized Additive Models: An Introduction with R, 2nd ed.; Chapman & Hall/CRC: New York, USA, 2017. [Google Scholar]
  10. Bolker, B.M.; Brooks, M.E.; Clark, C.J.; Geange, S.W.; Poulsen, J.R.; Stevens, M.H.H.; White, J.-S.S. Generalized Linear Mixed Models: A Practical Guide for Ecology and Evolution. Trends Ecol. Evol. 2009, 24, 127–135. [Google Scholar] [CrossRef] [PubMed]
  11. Dormann, C.F.; McPherson, J.M.; Araujo, M.B.; Bivand, R.; Bolliger, J.; Carl, G.; Davies, R.G.; Hirzel, A.; Jetz, W.; Daniel Kissling, W.; et al. Methods to Account for Spatial Autocorrelation in the Analysis of Species Distributional Data: A Review. Ecography 2007, 30, 609–628. [Google Scholar] [CrossRef]
  12. Zuur, A.F.; Ieno, E.N.; Saveliev, A.A. Spatial, Temporal and Spatial-Temporal Ecological Data Analysis with R-INLA; Highland Statistics Ltd.: Newburgh, UK, 2017; Volume I–II. [Google Scholar]
  13. IUCN The IUCN Red List of Threatened Species, Version 2024-1; IUCN: Gland, Switzerland, 2024.
  14. Coulon, N.; Elliott, S.; Teichert, N.; Auber, A.; McLean, M.; Barreau, T.; Feunteun, E.; Carpentier, A. Northeast Atlantic Elasmobranch Community on the Move: Functional Reorganization in Response to Climate Change. Glob. Chang. Biol. 2024, 30, e17157. [Google Scholar] [CrossRef]
  15. Elliott, S.A.M.; Carpentier, A.; Feunteun, E.; Trancart, T. Distribution and Life History Trait Models Indicate Vulnerability of Skates. Prog. Oceanogr. 2020, 181, 102256. [Google Scholar] [CrossRef]
  16. Ebert, D.A.; Stehmann, M.F.W. Sharks, Batoids and Chimaeras of the North Atlantic; FAO: Roma, Italy, 2013. [Google Scholar]
  17. Figueiredo, I.; Moura, T.; Neves, A.; Gordo, L.S. Reproductive Strategy of Leafscale Gulper Shark Centrophorus squamosus and the Portuguese Dogfish Centroscymnus coelolepis on the Portuguese Continental Slope. J. Fish Biol. 2008, 73, 206–225. [Google Scholar] [CrossRef]
  18. Rodríguez-Cabello, C.; Sánchez, F. Is Centrophorus squamosus a Highly Migratory Deep-Water Shark? Deep Sea Res. Part I: Oceanogr. Res. Pap. 2014, 92, 1–10. [Google Scholar] [CrossRef]
  19. Moura, T.; Jones, E.; Clarke, M.W.; Cotton, C.F.; Crozier, P.; Daley, R.K.; Diez, G.; Dobby, H.; Dyb, J.E.; Fossen, I.; et al. Large-Scale Distribution of Three Deep-Water Squaloid Sharks: Integrating Data on Sex, Maturity and Environment. Fish. Res. 2014, 157, 47–61. [Google Scholar] [CrossRef]
  20. Veríssimo, A.; McDowell, J.R.; Graves, J.E. Genetic Population Structure and Connectivity in a Commercially Exploited and Wide-Ranging Deepwater Shark, the Leafscale Gulper (Centrophorus squamosus). Mar. Freshw. Res. 2012, 63, 505–512. [Google Scholar] [CrossRef]
  21. Narberhaus, I.; Krause, J.; Bernitt, U. Bedrohte Biodiversität in Der Deutschen Nord- Und Ostsee: Empfindlichkeiten Gegenüber Anthropogenen Nutzungen Und Den Effekten Des Klimawandels; Bundesamt für Naturschutz: Bonn, Germany, 2012. [Google Scholar]
  22. Thorburn, J.; Neat, F.; Bailey, D.M.; Noble, L.R.; Jones, C.S. Winter Residency and Site Association in the Critically Endangered North East Atlantic Spurdog Squalus acanthias. Mar. Ecol. Prog. Ser. 2015, 526, 113–124. [Google Scholar] [CrossRef]
  23. Zidowitz, H.; Kaschner, C.; Magath, V.; Thiel, R.; Weigmann, S.; Thiel, R. Gefährdung Und Schutz Der Haie Und Rochen in Den Deutschen Meeresgebieten Der Nord- Und Ostsee: BfN-Skripten 450; BfN: Bonn, Germany, 2017. [Google Scholar]
  24. Ellis, J.R.; Milligan, S.P.; Readdy, L.; Taylor, N.; Brown, M.J. Spawning and Nursery Grounds of Selected Fish Species in UK Waters; CEFAS: Lowestoft, UK, 2012. [Google Scholar]
  25. ICES. Report of the Working Group on Elasmobranch Fishes (WGEF). In ICES Scientific Reports; ICES: Copenhagen, Denmark, 2023; Volume 5, p. 837. [Google Scholar] [CrossRef]
  26. EU Council Regulation. Council Regulation (EU) 2022/109 of 27 January 2022 Fixing for 2022 the Fishing Opportunities for Certain Fish Stocks and Groups of Fish Stocks, Applicable in Union Waters and for Union Fishing Vessels in Certain Non-Union Waters; Council of the European Union: Brussels, Belgium, 2022; Document 32022R0109. [Google Scholar]
  27. OSPAR. OSPAR List of Threatened and/or Declining Species and Habitats; Agreement 2008–6, updated 2021; OSPAR: London, UK, 2021. [Google Scholar]
  28. ICES. ICES Roadmap for Bycatch of Endangered, Threatened, and Protected (ETP) Species; ICES Convention, policies, and strategy; ICES: Copenhagen, Denmark, 2022; 48p. [Google Scholar] [CrossRef]
  29. ICES/DATRAS International Council for the Exploration of the Sea (ICES) DATRAS: Database of Trawl Surveys with Access to Standard Data Products. Available online: https://www.ices.dk/data/data-portals/Pages/DATRAS.aspx (accessed on 22 July 2025).
  30. NMDC. Norway Institute of Marine Research (IMR) Bottom Trawl Survey Data (Norwegian Marine Data Centre—NMDC). Available online: http://metadata.nmdc.no/metadata-api/landingpage/15ce748250a85dda02e6e4362552f0b1 (accessed on 22 July 2025).
  31. Cornou, A.-S.; Dimeet, J.; Tetard, A.; Gaudou, O.; Quinio-Scavinner, M.; Fauconnet, L.; Dube, B.; Rochet, M.-J. Observations à Bord Des Navires de Pêche Professionnelle. Bilan de l’échantillonnage 2013. Ifremer 2015. [Google Scholar] [CrossRef]
  32. Solmundsson, J. MFRI Survey Data from Icelandic Waters—Marine and Freshwater Research Institute (MFRI) Database; MFRI: Hafnarfjörður, Iceland, 2022. [Google Scholar]
  33. ICES. OSPAR Request for Scientific Knowledge on Selected Elasmobranch Species to Update the OSPAR List Assessments; ICES Special Request Advice; ICES: Copenhagen, Denmark, 2020. [Google Scholar]
  34. Guillera-Arroita, G. Modelling of Species Distributions, Range Dynamics and Communities under Imperfect Detection: Advances, Challenges and Opportunities. Ecography 2017, 40, 281–295. [Google Scholar] [CrossRef]
  35. Elliott, S.A.M.; Milligan, R.J.; Heath, M.R.; Turrell, W.R.; Bailey, D.M. Disentangling Habitat Concepts for Demersal Marine Fish Management. In Oceanography and Marine Biology; CRC Press: Boca Raton, FL, USA, 2016; ISBN 978-1-315-36859-7. [Google Scholar]
  36. Elith, J.; Philipps, S.; Hastie, T.; Dudik, M.; Chee, Y.; Yates, C.J. A Statistical Explanation of MaxEnt for Ecologists. Divers. Distrib. 2011, 17, 43–57. [Google Scholar] [CrossRef]
  37. Osborne, J. Notes on the Use of Data Transformations. Pract. Assess. Res. Eval. 2002, 8, 6. [Google Scholar]
  38. Schneider, D.C. Seabirds and Fronts: A Brief Overview. Polar Res. 1990, 8, 17–21. [Google Scholar] [CrossRef]
  39. Arkhipkin, A.; Brickle, P.; Laptikhovsky, V. Links between Marine Fauna and Oceanic Fronts on the Patagonian Shelf and Slope. Arquipélago. Life Mar. Sci. 2013, 30, 19–37. [Google Scholar]
  40. Bost, C.A.; Cotté, C.; Bailleul, F.; Cherel, Y.; Charrassin, J.B.; Guinet, C.; Ainley, D.G.; Weimerskirch, H. The Importance of Oceanographic Fronts to Marine Birds and Mammals of the Southern Oceans. J. Mar. Syst. 2009, 78, 363–376. [Google Scholar] [CrossRef]
  41. Zuur, A.F.; Saveliev, A.A.; Ieno, E.N. Zero Inflated Models and Gerneralized Linear Mixed Models Withh R; Highland Statistics Ltd.: Newburgh, UK, 2012. [Google Scholar]
  42. Waggitt, J.J.; Evans, P.G.H.; Andrade, J.; Banks, A.N.; Boisseau, O.; Bolton, M.; Bradbury, G.; Brereton, T.; Camphuysen, C.J.; Durinck, J.; et al. Distribution Maps of Cetacean and Seabird Populations in the North-East Atlantic. J. Appl. Ecol. 2020, 57, 253–269. [Google Scholar] [CrossRef]
  43. Korner-Nievergelt, F.; Roth, T.; von Felten, S.; Guelat, J.; Almasi, B.; Korner-Nievergelt, P. Bayesian Data Analysis in Ecology Using Linear Models with R, BUGS, and Stan; Elsevier: London, UK, 2015. [Google Scholar]
  44. Zuur, A.F.; Ieno, E.N.; Elphick, C.S. A Protocol for Data Exploration to Avoid Common Statistical Problems. Methods Ecol. Evol. 2010, 1, 3–14. [Google Scholar] [CrossRef]
  45. Tibshirani, R. The Lasso Method for Variable Selection in the Cox Model. Stat. Med. 1997, 16, 385–395. [Google Scholar] [CrossRef]
  46. Tibshirani, R. Regression Shrinkage and Selection via the Lasso. J. R. Stat. Soc. B 1996, 58, 267–288. [Google Scholar] [CrossRef]
  47. Wood, S. Package ‘Mgcv.’ Package ‘mgcv’ version 1.7–29. 2015, Volume 1, p. 729. Available online: https://cran.r-project.org/package=mgcv (accessed on 22 July 2025).
  48. ICES. NEAFC/OSPAR Joint Request on the Status and Distribution of Deep-Water Elasmobranchs; ICES Special Request Advice 2020, Sr.2020.09; ICES: Copenhagen, Denmark, 2020. [Google Scholar]
  49. Compagno, L.J.V.; Dando, D.; Fowler, S. Field Guide to Sharks of the World; HarperCollins: London, UK, 2005. [Google Scholar]
  50. OSPAR. Background Document for Leafscale Gulper Shark: Centrophorus Squamosus; OSPAR Commission: London, UK, 2010. [Google Scholar]
  51. Heessen, H.J.; Daan, N.; Ellis, J.R. Fish Atlas of the Celtic Sea, North Sea, and Baltic Sea; KNNV Publishing, Wageningen Academic Publishers: Wageningen, The Netherlands, 2015. [Google Scholar]
  52. Werner, T.; Hennicke, J. A Proposed Method to Evaulate the Extent to Which Critical Habitats of OSPAR T&D Species Are Covered by the OSPAR MPA Network: Annex 1. In Proceedings of the OSPAR Convention for the Protection of the Marine Environment of the North-East Atlantic—ICG-POSH Meeting, Edinburgh, UK, 21–23 November 2017. [Google Scholar]
  53. Bisch, A. Improving Knowledge on Chondrichthyans Using Fisheries Dependent Data. Master‘s Thesis, Station Marine de Dinard (CRESCO), Muséum National d’Histoire Naturelle, Paris, France, 2020. [Google Scholar]
  54. OSPAR. Case Reports for the OSPAR List of Threatened and/or Declining Species and Habitats; OSPAR Commission: London, UK, 2008. [Google Scholar]
  55. Sguotti, C.; Lynam, C.P.; García-Carreras, B.; Ellis, J.R.; Engelhard, G.H. Distribution of Skates and Sharks in the North Sea: 112 Years of Change. Glob. Change Biol. 2016, 22, 2729–2743. [Google Scholar] [CrossRef]
  56. Bañón, R.; Piñeiro, C.; Casas, M. Biological Aspects of Deep-Water Sharks Centroscymnus Coelolepis and Centrophorus Squamosus in Galician Waters (North-Western Spain). J. Mar. Biol. Assoc. United Kingd. 2006, 86, 843–846. [Google Scholar] [CrossRef]
  57. Barreau, T.; Rodriguez-Cabello, C.; Batsleer, J.; Johnston, G. Workshop to Review and Update OSPAR Status Assessments for Stocks of Listed Sharks, Skates and Rays in Suppot of OSPAR (WKSTATUS): Volume Issue 71: ICES Scientific Reports; ICES CIEM: Copenhagen, Denmark, 2020. [Google Scholar]
  58. Girard, M.; Buit, M.-H.D. Reproductive Biology of Two Deep-Water Sharks from the British Isles, Centroscymnus Coelolepis and Centrophorus Squamosus (Chondrichthyes: Squalidae). J. Mar. Biol. Assoc. United Kingd. 1999, 79, 923–931. [Google Scholar] [CrossRef]
  59. Clarke, M.W.; Connolly, P.L.; Bracken, J.J. Aspects of Reproduction of the Deep Water Sharks Centroscymnus Coelolepis and Centrophorus Squamosus from West of Ireland and Scotland. J. Mar. Biol. Assoc. United Kingd. 2001, 81, 1019–1029. [Google Scholar] [CrossRef]
  60. Rodríguez-Cabello, C.; González-Pola, C.; Sánchez, F. Migration and Diving Behavior of Centrophorus Squamosus in the NE Atlantic. Combining Electronic Tagging and Argo Hydrography to Infer Deep Ocean Trajectories. Deep Sea Res. Part I Oceanogr. Res. Pap. 2016, 115, 48–62. [Google Scholar] [CrossRef]
  61. Rodríguez-Cabello, C.; Sánchez, F. Catch and Post-Release Mortalities of Deep-Water Sharks Caught by Bottom Longlines in the Cantabrian Sea (NE Atlantic). J. Sea Res. 2017, 130, 248–255. [Google Scholar] [CrossRef]
  62. Shark Trust (2009) Chapter 1: The British Isles. Part 1: Skates and Rays. An Illustrated Compendium of Sharks, Skates, Rays and Chimaera. Available online: http://www.sharktrust.org/fact-files (accessed on 22 July 2025).
  63. Mas, F.; Forselledo, R.; Domingo, A.; Pin, O.; Troncoso, P.; Errico, E.; Marquez, A.; Tanaka, S.; Weigmann, S. New Records and Range Extension of the Portuguese Dogfish Centroscymnus Coelolepis in the South-Western Atlantic Ocean, with Comments on Its Morphology. J. Fish Biol. 2020, 96, 601–616. [Google Scholar] [CrossRef]
  64. Stehlik, L.L.; NOAA. Spiny Dogfish, Squalus Acanthias, Life History and Habitat Characteristics: NOAA Technical Memorandum NMFS-NE-203: Essential Fish Habitat Source Document: Second Edition; U.S. Department of Commerce: Woods Hole, MA, USA, 2007. [Google Scholar]
  65. Dell’apa, A.; Pennino, M.G.; Bonzek, C.F. Modeling the Habitat Distribution of Spiny Dogfish (Squalus Acanthias), By Sex, in Coastal Waters of the Northeastern United States. Fish. Bull. 2017, 115, 89–100. [Google Scholar] [CrossRef]
  66. OSPAR commission Background Document for Spotted Ray: Raja Montagui; OSPAR Commission: London, UK, 2010.
  67. Dutkiewicz, A.; Müller, R.D.; O’Callaghan, S.; Jónasson, H. Census of Seafloor Sediments in the World’s Ocean. Geology 2015, 43, 795–798. [Google Scholar] [CrossRef]
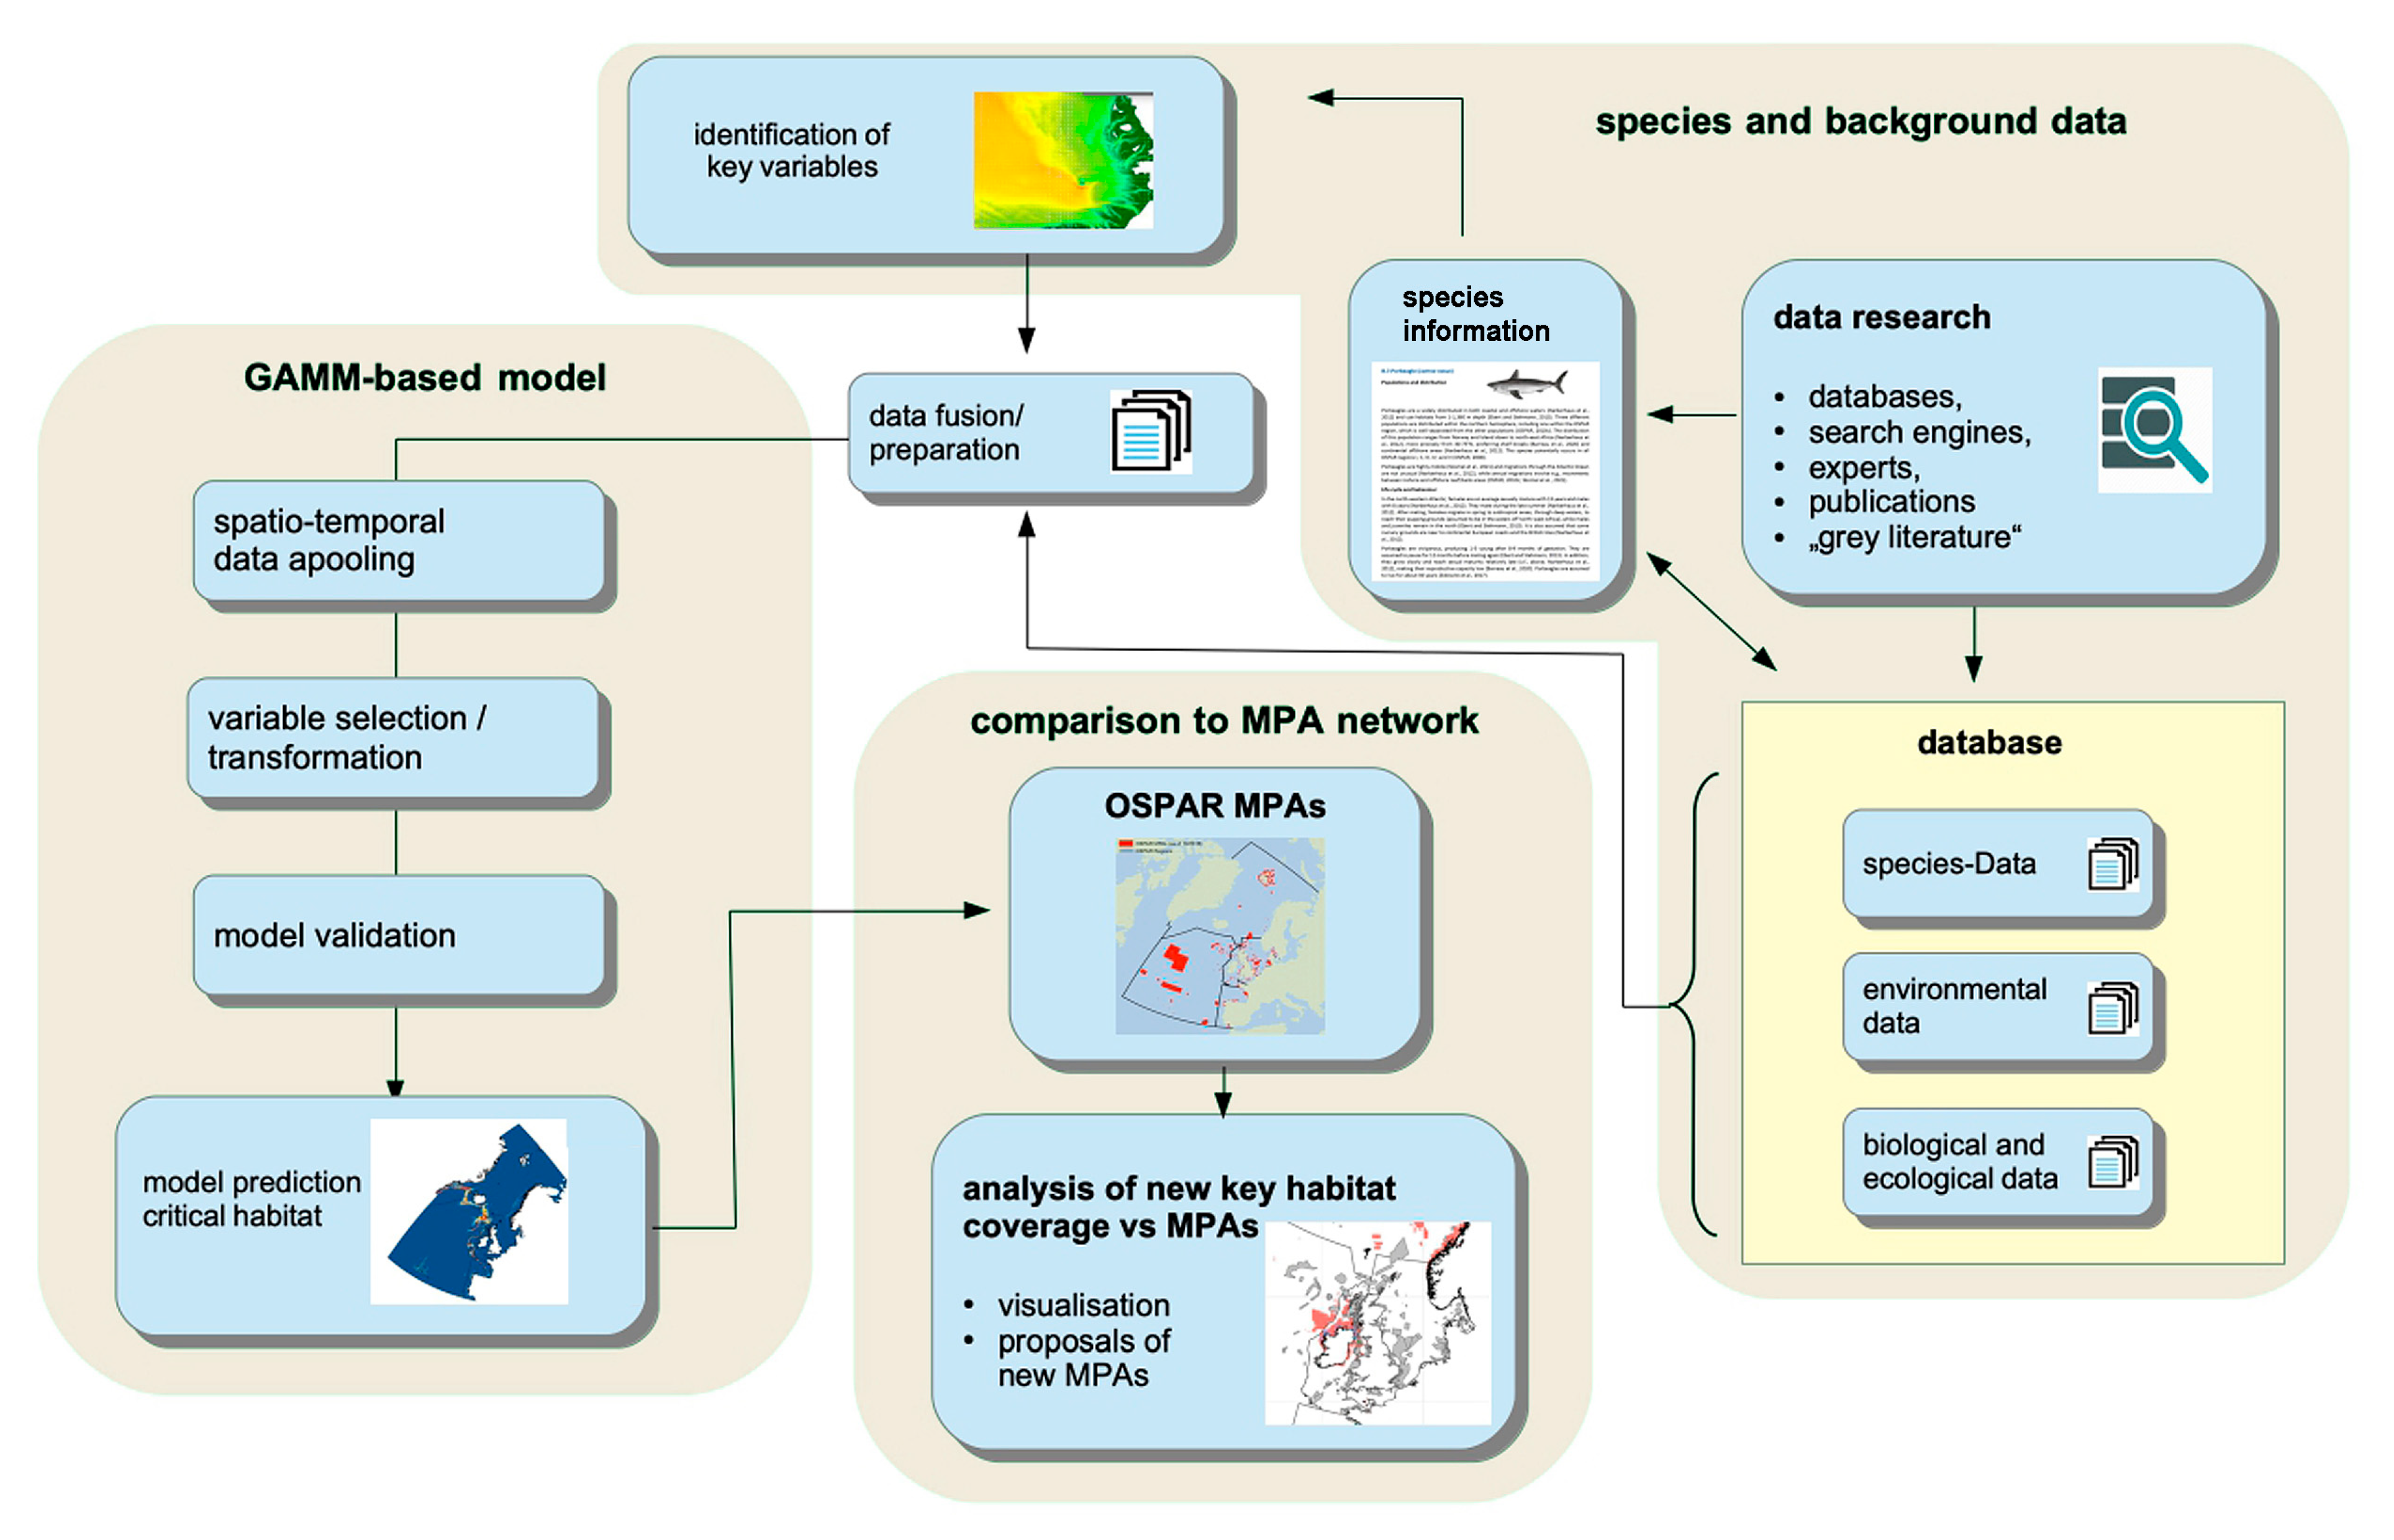
Figure 1. Schematic overview of tasks and workflow of the present study.
Fishes 10 00393 g001
Figure 2. Presence–absence map of available survey-based count data. (A) Leafscale gulper shark (Centrophorus squamosus); (B) Portuguese dogfish (Centroscymnus coelolepis); (C) spurdog (Squalus acanthias); and (D) spotted ray (Raja montagui). Fishes 10 00393 i001 “N_total” (blue dots) represents the total number of hauls (both zero and positive), and Fishes 10 00393 i002 “N_obs” (red dots) refers to the number of positive hauls exclusively.
Fishes 10 00393 g002
Figure 3. GAMM-based predicted relative habitat suitability (heatmap colour scale) for the leafscale gulper shark (A), the Portuguese dogfish (B), the spurdog (C), and the spotted ray (D) in the entire OSPAR region. The geographic context of the OSPAR area (boundaries, coordinates, and regional delineation) is presented in Figure 4A.
Fishes 10 00393 g003
Figure 4. Proposed locations suitable for new MPAs with respect to the leafscale gulper shark, the Portuguese dogfish, and the spurdog, augmenting existing MPAs (grey). Additional locations for the spotted ray are not proposed, since 25.8% of the predicted suitable habitats are already covered by the existing OSPAR MPA network for this species. (A) Overview OSPAR region and existing MPAs; coloured rectangles correspond to cropped subregions with respect to the spurdog (B), the leafscale gulper shark (C), and the Portuguese dogfish (C). In (B), areas proposed for MPAs are depicted in the red colour, and in (C,D) in red and green colours. In particular, (C,D), the green colour indicates overlapping proposed locations between the leafscale gulper shark and the Portuguese dogfish. (A) is adapted and modified with kind permission from the Federal Agency for Nature Conservation (BfN).
Fishes 10 00393 g004
Table 1. Summary statistics on presence–absence ratios for each species in the raw haul-level data.
SpeciesTotal HaulsPositive HaulsAbsences%Zeros
Leafscale gulper shark329,66411,451318,21396.5%
Portuguese dogfish329,3116903322,40897.9%
Spurdog207,04526,801180,24487.0%
Spotted ray213,97323,140190,83389.2%
Disclaimer/Publisher’s Note: The statements, opinions and data contained in all publications are solely those of the individual author(s) and contributor(s) and not of MDPI and/or the editor(s). MDPI and/or the editor(s) disclaim responsibility for any injury to people or property resulting from any ideas, methods, instructions or products referred to in the content.