Article

In Situ Study on the Influence of a Dark Environment on the Upstream Behaviors of Plateau Fishes in Fishways: A Pilot Study

1
Hydraulic Engineering Department, Nanjing Hydraulic Research Institute, Nanjing 210029, China
2
College of Water Conservancy and Hydropower Engineering, Hohai University, Nanjing 210098, China
3
Jiangxi Port and Shipping Logistics Development Group Co., Ltd., Jiujiang 332005, China
*
Authors to whom correspondence should be addressed.
Fishes 2025, 10(3), 136; https://doi.org/10.3390/fishes10030136
Submission received: 12 February 2025 / Revised: 6 March 2025 / Accepted: 18 March 2025 / Published: 20 March 2025
(This article belongs to the Special Issue Habitat Assessment and Conservation of Fishes)

Abstract

To help fish to bypass dams and other human-made barriers, some fishways have ingeniously incorporated extended tunnel sections. This innovative design not only optimizes the overall structure of the fishway but also significantly reduces disturbances to the surrounding ecosystem. However, the potential challenges posed by long tunnel sections to fish upstream migration remain insufficiently studied and poorly understood. This study conducted in situ experiments utilizing a passive-integrated-transponder (PIT) system to quantitatively assess the effects of dark and natural light environments on the upstream migration behavior of plateau-endemic fishes (Schizothorax macropogon, Schizothorax waltoni, and Schizothorax oconnori) in a vertical-slot fishway. A 655 m section of the fishway was selected for the experiment, with shading cloth used to simulate the dark environment (DE) of tunnel sections, and its removal serving as the natural light environment (NE). The results showed that in the DE, the upstream behaviors of S. macropogon, S. waltoni, and S. oconnori were not hindered. The entry efficiency at the experimental segment (Ee) of all three species exceeded 65% in the DE, which was higher than that in the NE. The passage efficiency (Ep) of S. macropogon and S. waltoni showed no significant difference between the DE and NE, whereas S. oconnori exhibited a significant difference, with an overall Ep of 0% in the NE and 75.0% in the DE. Additionally, the DE caused a temporary disruption to the diel migration rhythms of the three species. The transit speeds (St) of S. macropogon and S. waltoni were both elevated in the DE, with S. waltoni showing a particularly significant increase; its average St in the DE (0.080 m/s) was much higher than in the NE (0.021 m/s). Ridge regression analysis further indicated that the DE was the primary factor influencing the St and had a positive effect on upstream behavior. Moreover, differences in the upstream migration performances of different species under varying light conditions highlighted species-specific sensitivity to light. This study offers key insights for fish passage design in canyon hydropower projects and highlights the potential of tunnel-type fishways in restoring river connectivity.
Key Contribution: This study highlights that the dark environment in fishways significantly enhances the upstream migration efficiency and speed of plateau-endemic fishes, especially Schizothorax oconnori. It also reveals species-specific responses to light, offering key insights for optimizing fishway design in canyon hydropower projects.

1. Introduction

Rivers are carriers of material flow, species flow, and information flow [1], with species flow referring to fish migrations and the dispersal of fish eggs and tree seeds [2]. Short- and long-distance migrations of fish are essential for meeting their basic biological needs, such as spawning, foraging, and overwintering, and are crucial for maintaining genetic diversity [3,4]. Longitudinally, in rivers, the construction of dams often results in the disruption of fish migrations, a phenomenon that is widespread globally [5], leading to significant declines in species abundance and diversity in both upstream and downstream fish populations [6].
To restore river connectivity, engineers have creatively adopted fishways to help fish to bypass dams [7]. In fishway designs, culverts are often used to pass through dams. These culverts are typically short and represent a small proportion of the total length of the fishway, and their impact on fish upstream migration is often unintentionally overlooked. However, in China, there are two situations where long tunnel sections are widely used in fishways. The first scenario occurs when fishways are constructed in mountainous canyons, where issues such as high water-heads, steep slopes, and limited space are common. In such cases, fishways with long tunnel sections can meet the connectivity needs of the upstream and downstream sections while minimizing the risks of high embankment slopes and environmental disruption caused by large-scale excavation [8], as seen in the Jinchuan Hydropower Station Fishway [9]. The second scenario involves retrofitting fishways at older dams to restore upstream and downstream river connectivity and support fish migration. In such cases, tunnel sections can be utilized to bypass the dam without compromising the integrity of the main structure [10], such as in the Bailin Dam Fishway [11]. This study has gathered several case examples (Table 1). In these cases, the length of the tunnel sections can reach up to 962 m, with the tunnel section comprising up to 85.4% of the total fishway length. Current research lacks a systematic evaluation of the use of long tunnel sections in fishways, and there are insufficient data to support their effectiveness in restoring river connectivity and protecting ecosystems.
Evidently, the presence of tunnel sections in fishways presents two primary challenges for fish during upstream migration. The first challenge is the drastic change in light intensity when fish transition from open channels to tunnels, which may impede their upstream movement. The second challenge is that the presence of tunnel sections creates a dark environment, which itself may have a negative impact on fish upstream migration, especially for diurnal species that are adapted to moving under illuminated conditions [12]. Juvenile Danio rerio exhibit strong photophobic behavior [13]; Salmo salar smolts actively forage during the day but do not feed at night, showing relatively passive migratory behavior at night [14]. Huang [15] found that the positive phototaxis of Schizothorax przewalskii influenced their behavior in passing through culverts and that dark culverts could not prevent individuals that had ascended from descending again. The swimming ability and upstream efficiency of fish such as Clupea pallasii and Craterocephalus stercusmuscarum significantly decrease in the low-light environment [16]. However, Anguilla anguilla shows no significant response to low-light conditions but exhibits a strong avoidance reaction to light [17]. Tarena [18] found that artificial light could negatively impact the passage performances or swimming speeds of Gobio gobio and Telestes muticellus in real fishways or natural streams with illuminated areas. Lin [19] showed that in uniform flows slower than 0.25 m/s, increased illumination inhibited the swimming stability of Ctenopharyngodon idellus. Xu [20] found that Schizothorax waltoni is sensitive to light intensity, and a low-light environment is beneficial for its growth and development. However, it is worth noting that existing studies are mostly based on experimental models or artificial environments, and there is a lack of in situ experimental support for the actual impacts of dark tunnel environments on fish upstream migration behaviors.
In recent years, the Yarlung Tsangpo River has become a key focus of hydropower construction in China. Schizothorax macropogon, S. waltoni, and Schizothorax oconnori are endemic fish species in the Yarlung Tsangpo River, with S. macropogon and S. waltoni being listed as national second-class protected animals. Wang [21] found that schizothoracids in the Yarlung Tsangpo River are less sensitive to water flow compared to those in the Yangtze River Basin, suggesting that schizothoracids in the Yarlung Tsangpo are more vulnerable to environmental changes. Currently, there is a lack of scientific literature on the behavioral responses of S. macropogon, S. waltoni, and S. oconnori to different light intensities, and little is known about the upstream behaviors of these three species in fishways.
The purpose of this study is to investigate whether the presence of a dark environment in fishways affects the upstream migration behaviors of S. macropogon, S. waltoni, and S. oconnori. This paper is organized as follows: Section 2 provides a detailed description of the experimental design, including the setup of the experimental environment, fish tagging and release processes, and data collection methods. Section 3 presents the main findings and results of the experiment. Section 4 discusses the experimental results in the context of the existing literature, analyzing fish upstream behaviors under different environmental conditions and identifying the key factors influencing upstream speeds. The paper concludes with Section 5.

2. Materials and Methods
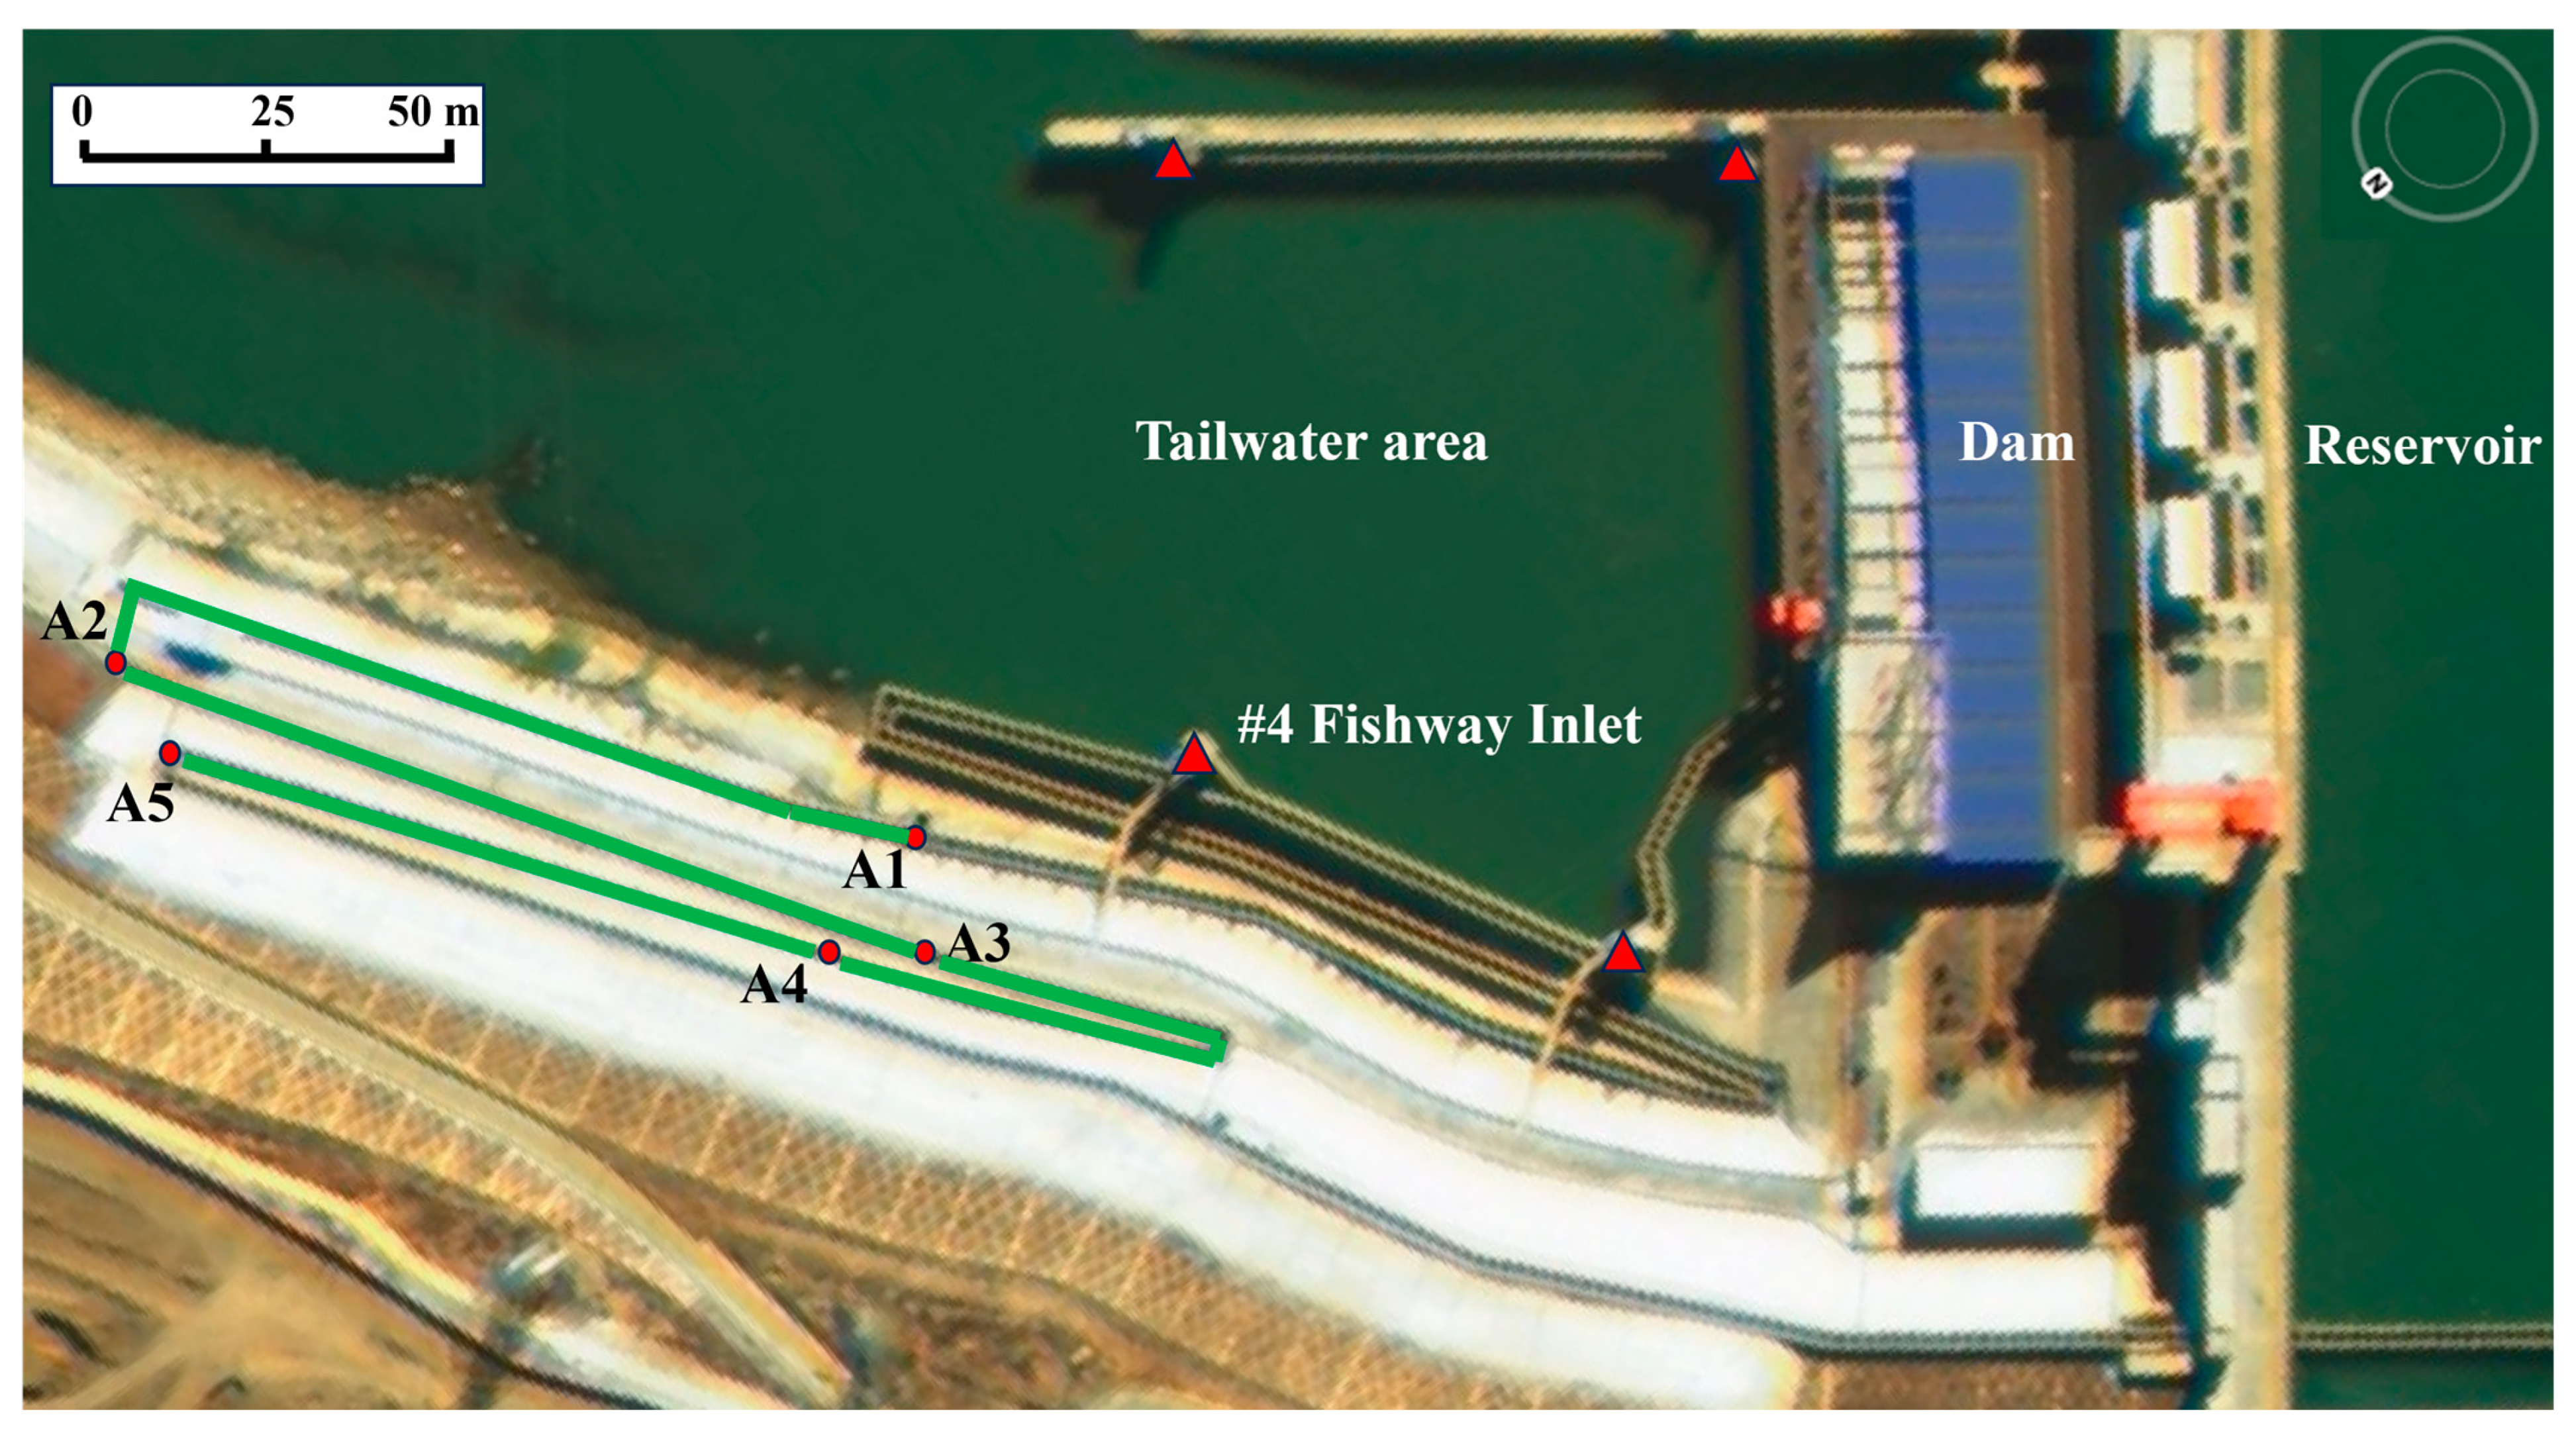
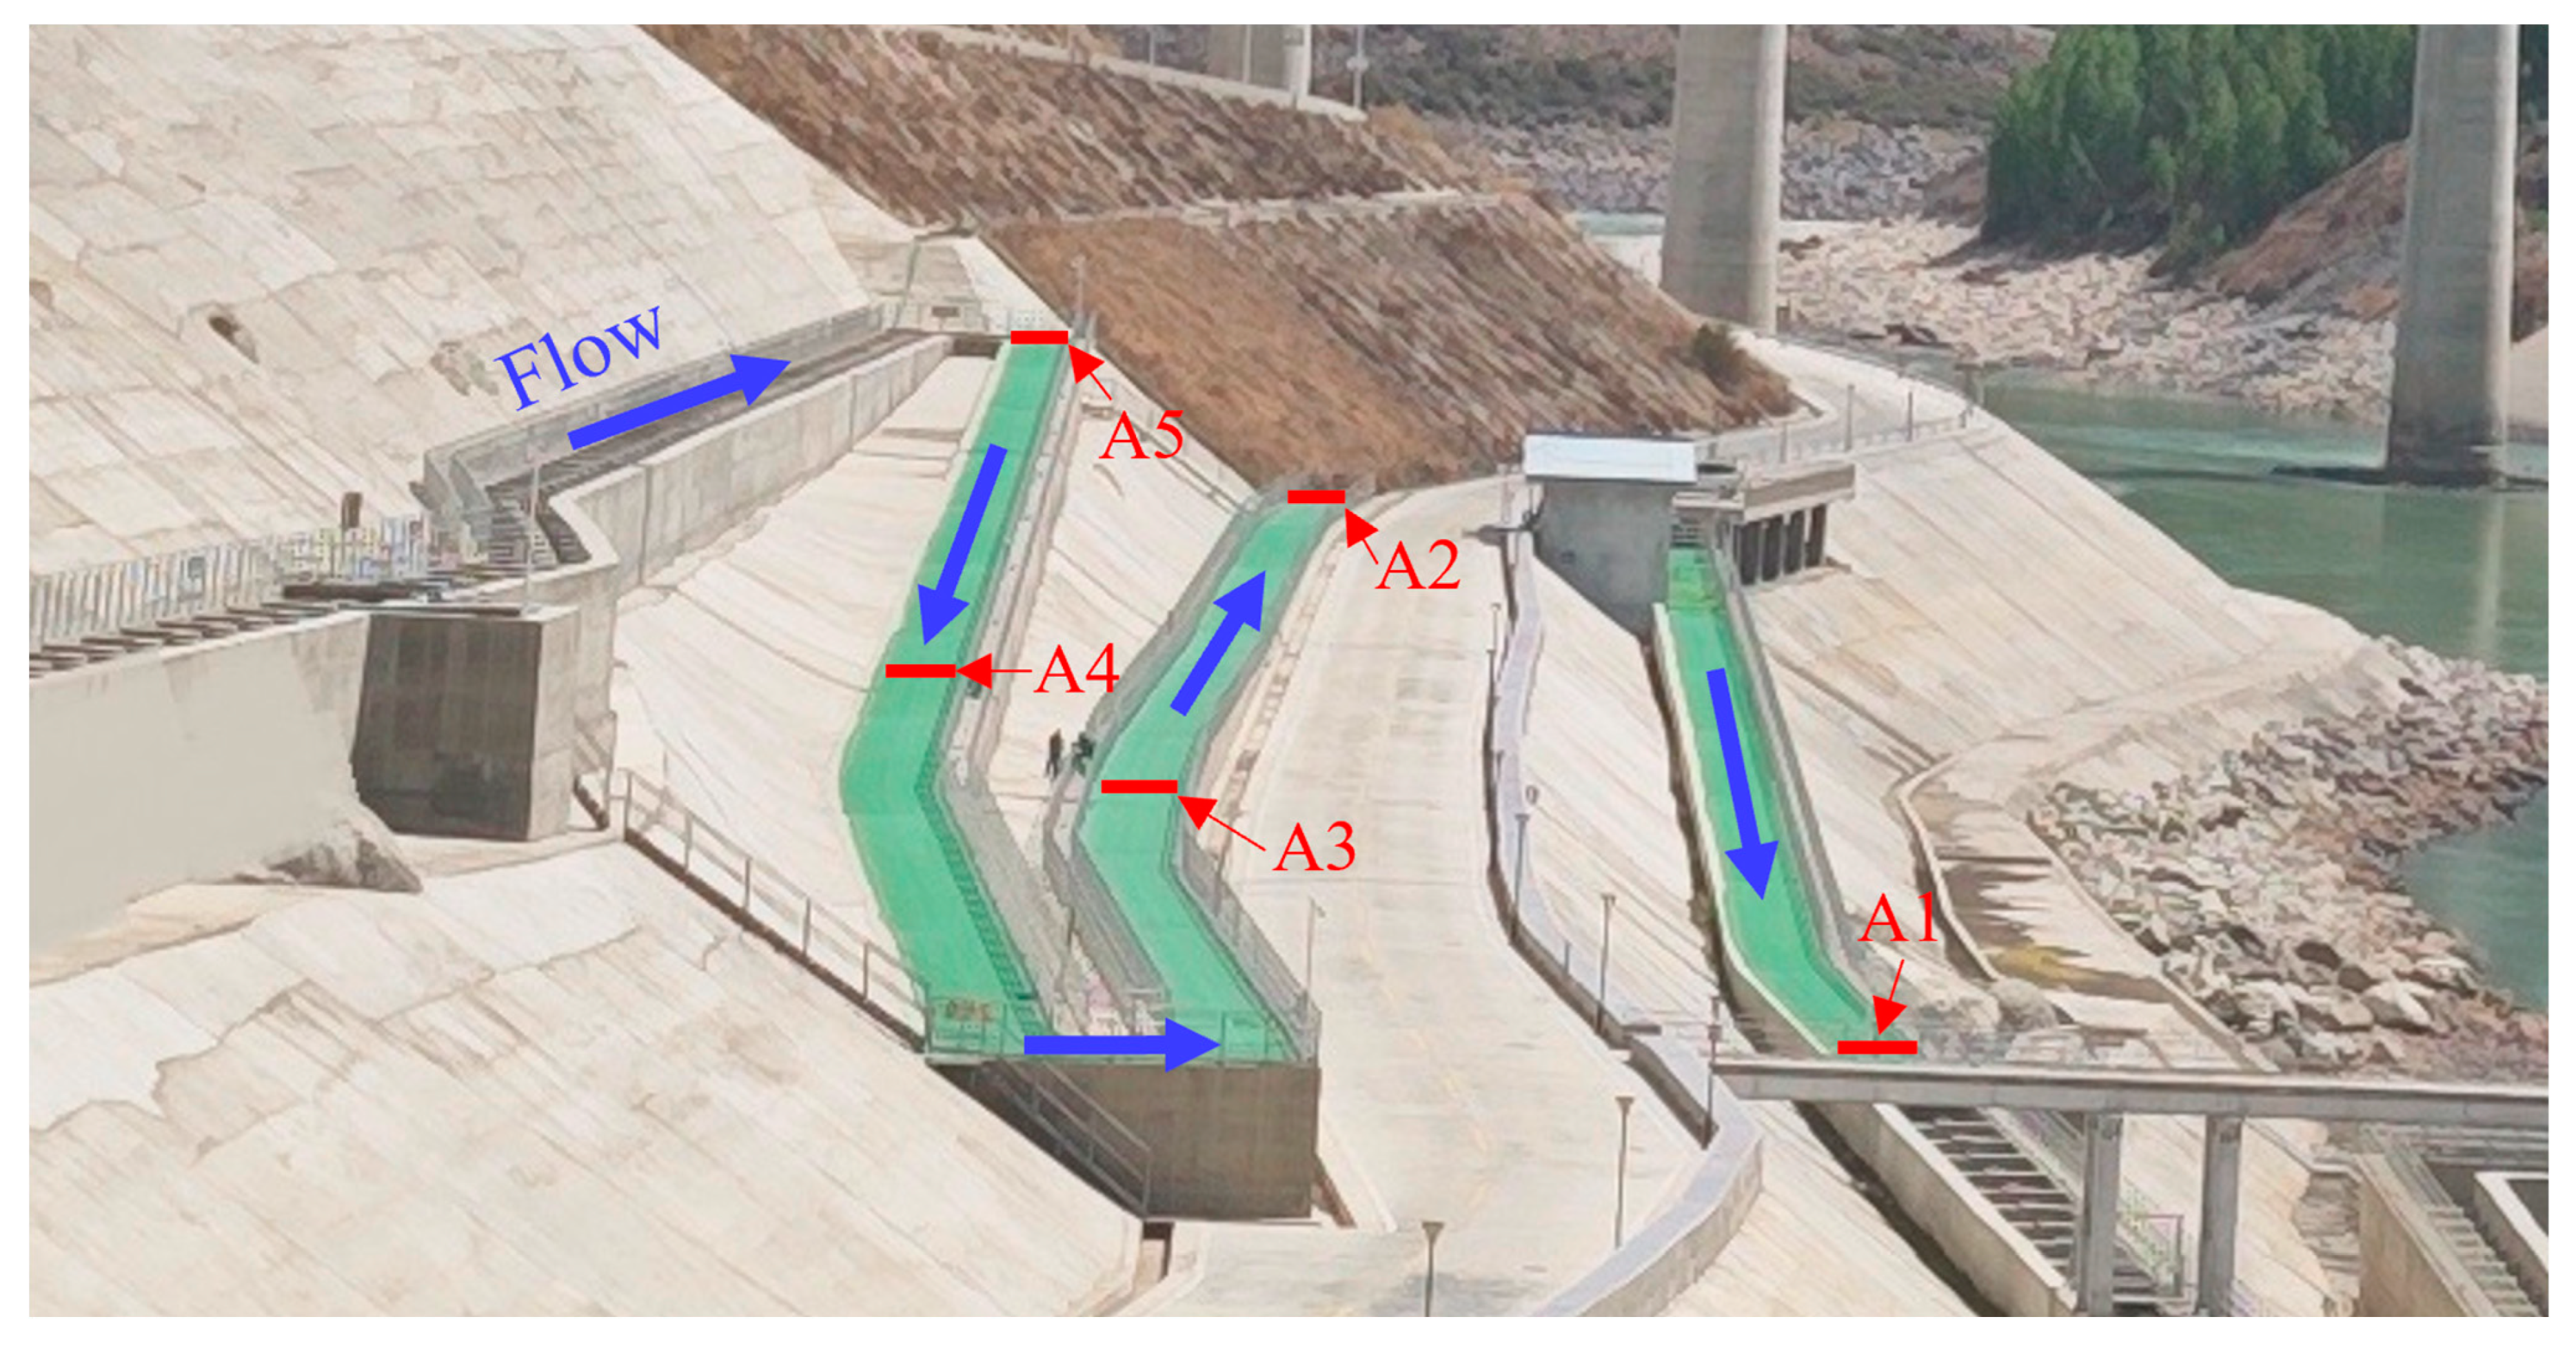
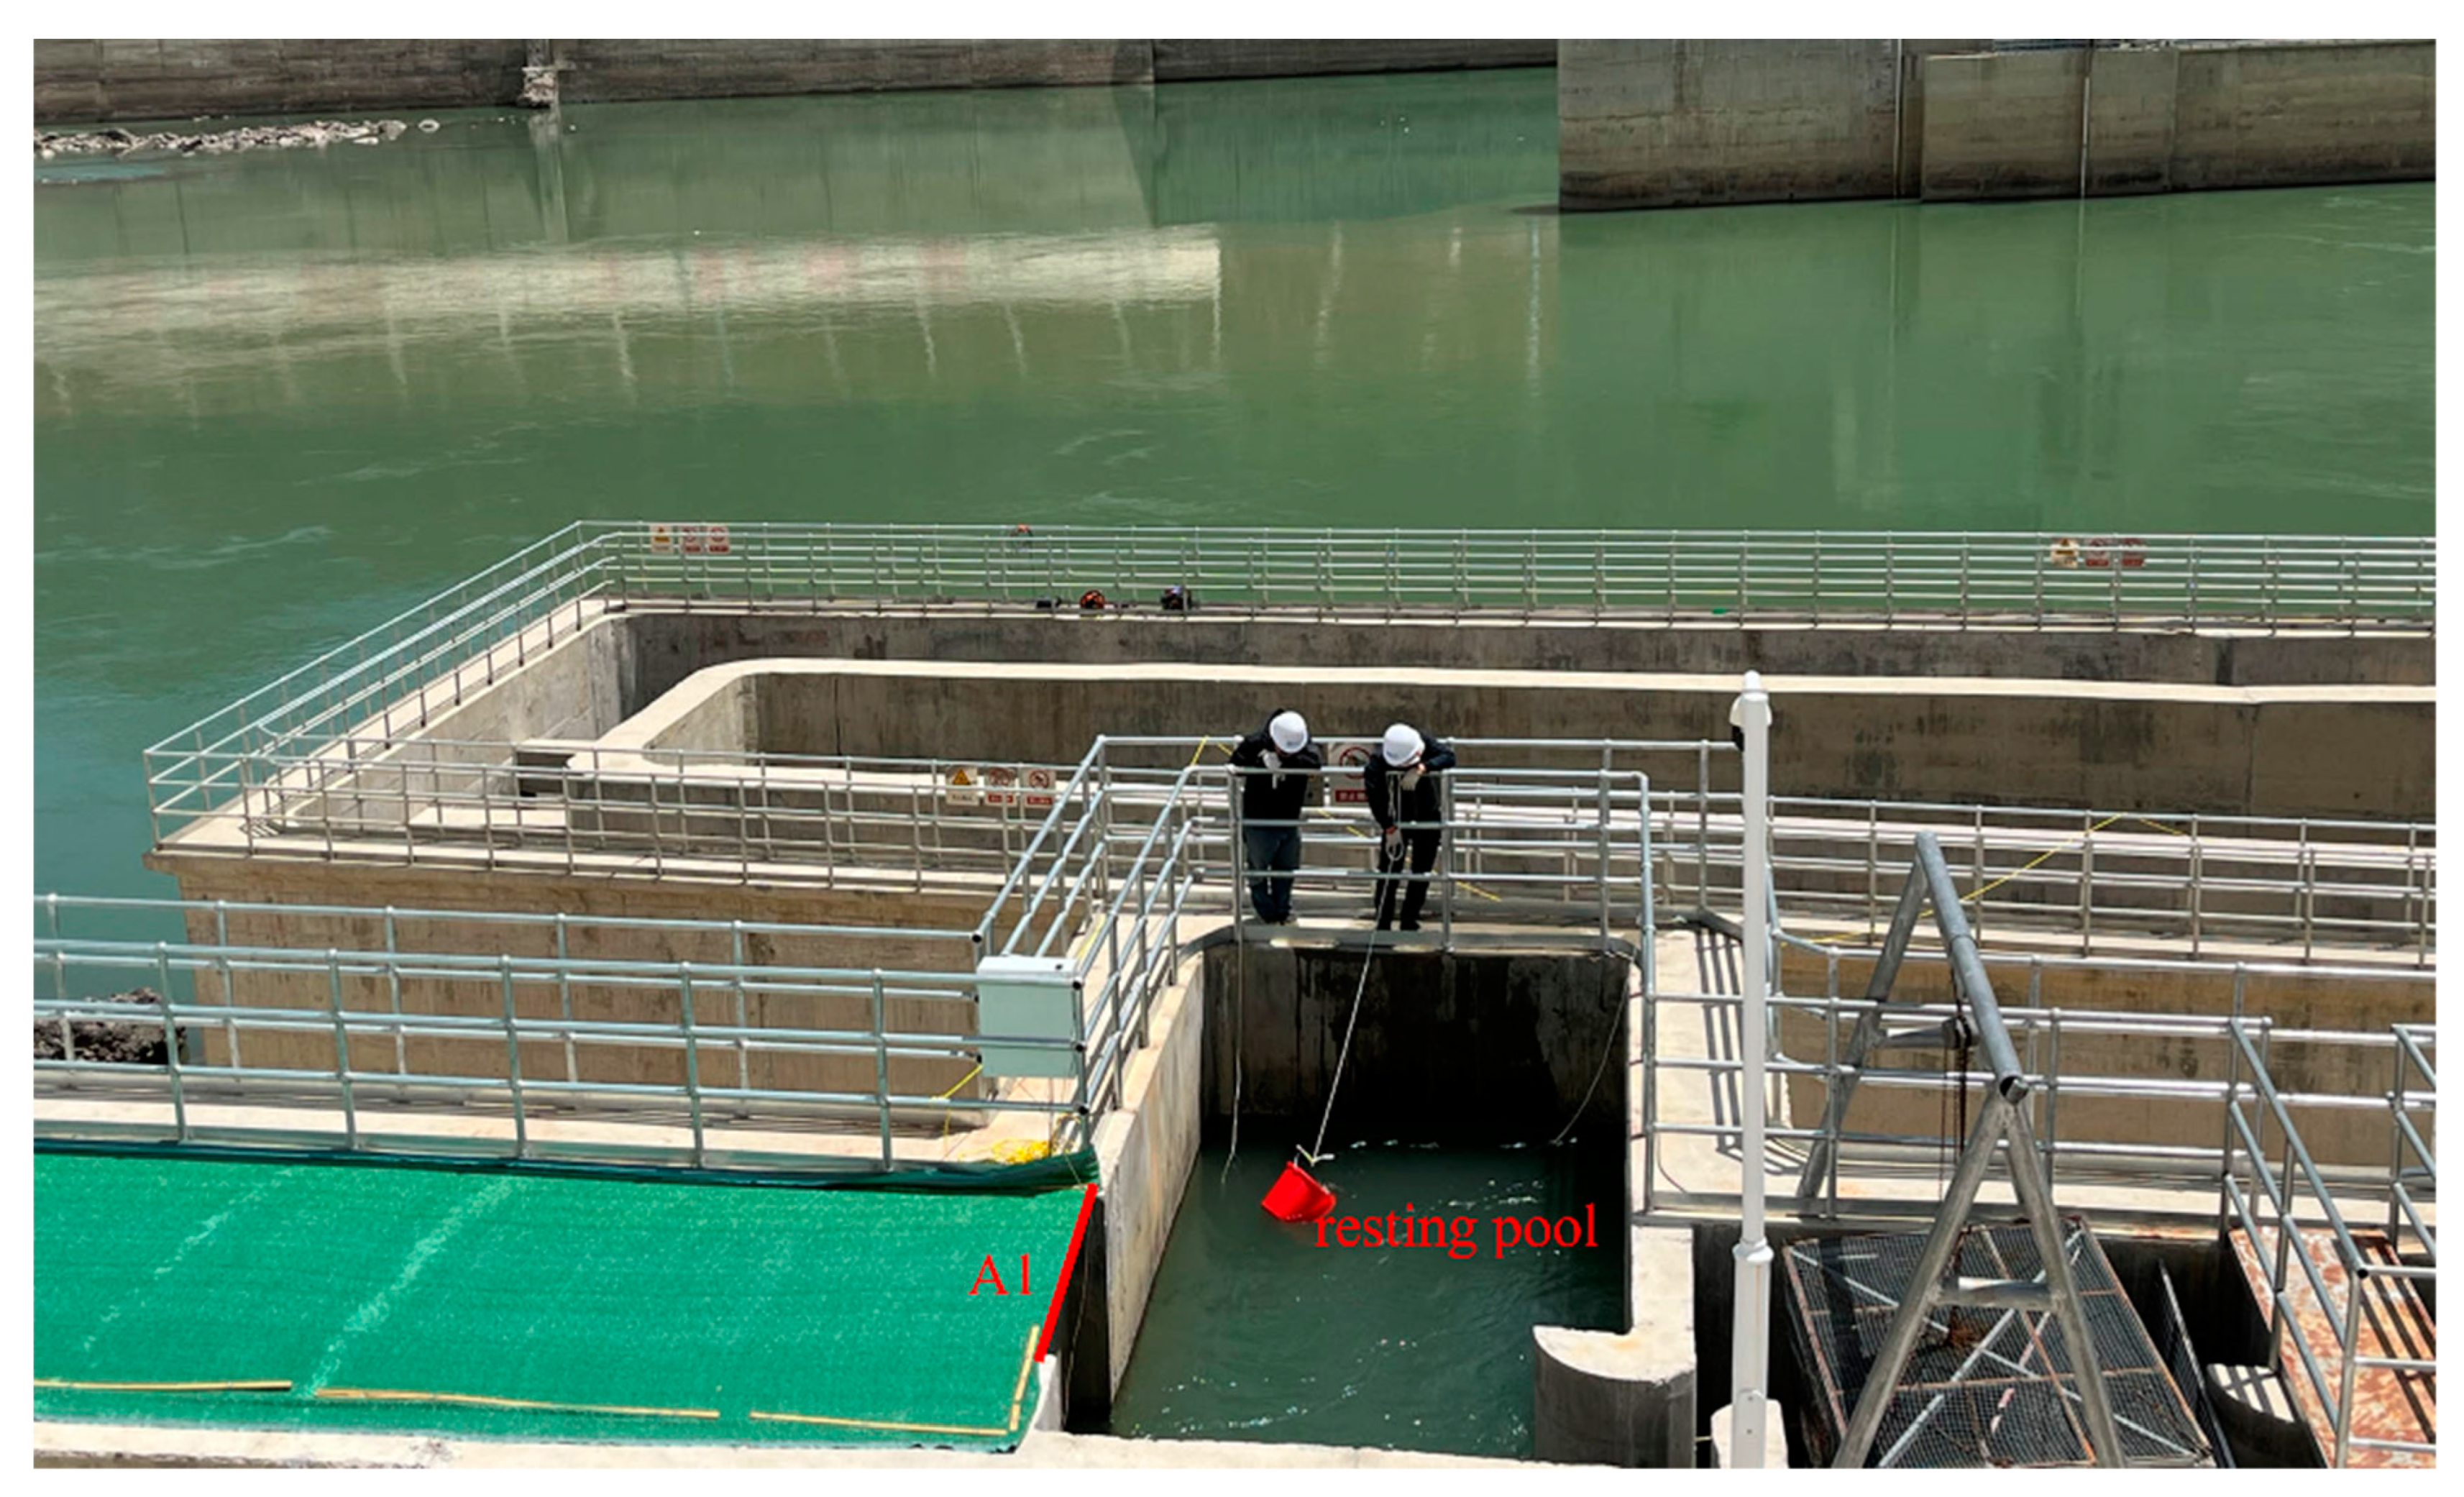
2.1. Study Area

This study was conducted in a fishway located in the middle reaches of the Yarlung Tsangpo River in Tibet, China. The fish passage is a vertical-slot fishway, with a total length of 2597 m, a width of 2.40 m, and a single-chamber pool length of 2.70 m. The bottom slope is 2%, with a total of 780 pool chambers. The primary fish migration period spans from March to June, while February and from July to October are secondary migration periods. The main target species for this fishway are S. oconnori, S. macropogon, and S. waltoni. The upstream water intake gate of the fishway can automatically adjust its opening based on the reservoir’s water level, with intelligent control of the inflow to ensure the optimal water levels within the fishway.

2.2. Experimental Design

The experiment was conducted during the primary fish migration period. From 27 April 2024 to 16 May 2024, shading cloth was used to create a DE similar to that of a tunnel. The shading cloth is made of 4 cm thick opaque artificial turf. On 17 May 2024, the shading cloth was removed, exposing the fishway to natural light conditions. We monitored the upstream migration of the fish in real time by injecting PIT tags into their bodies and using half-duplex RFID technology. When a fish passed through or entered the range of an antenna, the system recorded the detection time and the associated tag number [22,23,24]. The test section encompassed two hundred eighty-five pool chambers, with a total of five antennae installed along the passage from downstream to upstream. The A1 antenna was located 405 m from the #4 fishway inlet, with the distances between the A1 and A2 antennae being 185.62 m, between the A2 and A3 antennae being 168.31 m, between the A3 and A4 antennae being 177.13 m, and between the A4 and A5 antennae being 124.10 m. A schematic diagram of the layout is shown in Figure 1, and the field layout is shown in Figure 2. During the experiment, the water temperature along the test section remained constant. A water level and temperature logger (HOBO MX20L-01, Onset Computer Corporation, Bourne, MA, USA) was deployed at the A1 antenna location to continuously record the water level and temperature (Figure 3) at an interval of 1 h.
All the fish were captured using gill nets in the downstream river before the tagging procedure. They were implanted with PIT tags (8.3 mm × 1.4 mm; 0.02 g in air) using a needle injector through a small (0.4 cm) incision made along the ventral midline of the body cavity [25]. Before tagging, they were anesthetized with eugenol (0.02 g/L), then their bodyweight (W, g) and length (L, cm) were recorded. To reduce handling stress, all the procedures were carried out rapidly and completed within one minute. After surgery, the fish were transferred to a well-aerated tank with fresh river water for recovery. More than 12 h later, they were released into a resting pool downstream of the A1 antenna (Figure 4). The release times during the experiment were between 9:30–11:30 and 14:30–16:30, with a similar number of tagged fish released during each time window. A total of 76 fish were released during the experiment. In the DE, nine S. macropogon, nine S. waltoni, and eighteen S. oconnori were released. In the NE, 10 S. macropogon, 18 S. waltoni, and 12 S. oconnori were released. It is worth noting that multiple research teams have cumulatively placed over 800 tagged fish upstream and downstream of this fishway, and their passage through the antennae is recorded by us.

2.3. Data Analysis

When analyzing PIT tag data for fish that pass through the antennae multiple times, we adopted the following data processing approach: At A1, we recorded the last detected timestamp, while at A2, A3, A4, and A5, we recorded the first detected timestamp. On this basis, we carried out a series of calculations, and we used three indicators: the entry efficiency at the experimental segment, the passage efficiency, and transit speeds. The entry efficiency at the experimental segment (Ee) represents the ability of fish to enter the experimental segment. The passage efficiency (Ep) reflects the ability of fish to pass through the experimental segment. Transit speeds (St) indicate the movement efficiency of fish within the experimental segment, with higher speeds generally suggesting smoother migration conditions. The calculation formulae for these metrics are as follows:
Ee = N 1 / N 0 × 100 %
In Formula (1), N0 denotes the number of fish released into the resting pool, and N1 refers to the number of fish successfully detected at the A1 antenna.
Epi = Ni / N 1 × 100 %
In Formula (2), N1 denotes the number of fish successfully detected at the A1 antenna, and Ni refers to the number of fish successfully detected at the Ai antenna (i = 2, 3, 4, or 5).
St = L / T
In Formula (3), L denotes the upstream distance, and T refers to the corresponding passage time.
Fisher’s exact test was used to compare differences in Ee and Ep. The Kruskal–Wallis test was applied to analyze differences in transit speeds between the NE and DE. The Mann–Whitney U test was employed to compare the distribution differences in the hourly passage counts of the fish between the DE and NE. A ridge regression model was constructed to evaluate the effects of various factors on St; both biotic and abiotic factors were considered, including the fish length (L), fish weight (W), species (S), water temperature (WT), water level (WL), release time (RT), and test environment (TE). Data processing was performed using Microsoft Office, and academic data visualization was carried out using Origin (version 2024). The Kruskal–Wallis and Mann–Whitney U tests were analyzed in Origin, while Fisher’s exact test and the ridge regression model construction were performed in R (version 4.4.2).

3. Results

3.1. Entry Efficiency at the Experimental Segment and Passage Efficiency at Each Antenna

In this study, 76 test fish were tagged and released, among which 50 individuals were detected by the antennae (Table 2). Specifically, in the NE, five S. macropogon, nine S. oconnori, and eight S. waltoni were detected at the A1 antenna. In contrast, in the DE, six S. macropogon, sixteen S. oconnori, and six S. waltoni were detected at the A1 antenna. Additionally, 29 previously tagged fish from earlier releases were also detected. After traceability, the information of 13 fish was confirmed, and these fish were all test fish released by other research teams in 2021. At the A1 antenna, two S. waltoni and two S. oconnori were detected in the NE, whereas eight S. waltoni and one S. oconnori were detected in the DE.
In the resting pool, different fish species exhibited varying responses to the upstream environment. In the NE, where no significant light transition occurred at the A1 antenna, the Ee values of the fish species ranked in descending order as S. oconnori (75.0%), S. macropogon (50.0%), and S. waltoni (44.4%). In the DE, where a significant light transition was present at the A1 antenna, the Ee values of all the species improved compared to those in the NE. Specifically, the Ee value of S. oconnori increased to 88.9%, while the Ee values of both S. macropogon and S. waltoni rose to 66.7%.
After entering the experimental segment, the fish in the NE experienced normal day–night light cycles, whereas those in the DE were subjected to complete darkness. In the NE, the Ep values of S. macropogon at nodes A2, A3, A4, and A5 were 100.0%, 60.0%, 40.0%, and 40.0%, respectively; for S. oconnori, the corresponding values were 88.9%, 55.6%, 22.0%, and 0%; and for S. waltoni, the values were 75.0%, 62.5%, 37.5%, and 25.0%. In the DE, the Ep values of S. macropogon at A2, A3, A4, and A5 were 66.7%, 66.7%, 50.0%, and 33.3%, respectively; for S. oconnori, the values were 93.8%, 93.8%, 75.0%, and 75.0%; and for S. waltoni, the values were 50.0%, 50.0%, 16.7%, and 16.7%. For S. waltoni released in 2021, the Ep values at A2, A3, A4, and A5 in the DE were 100.0%, 87.5%, 37.5%, and 37.5%, respectively.
Statistical analysis indicated that the Ee value of each fish species showed no significant differences between the two environments (Fisher’s exact test, p > 0.05). Similarly, the Ep values of S. macropogon and S. waltoni at all the antennae were not significantly different across the two environments (Fisher’s exact test, p > 0.05). For S. oconnori, the Ep value at the A2 antenna showed no significant difference between the two environments (Fisher’s exact test, p > 0.05). However, significant differences were observed at the A3, A4, and A5 antennae (Fisher’s exact test, p = 0.04, 0.02, and 0.0005). As S. oconnori migrated upstream, the environmental impact on its Ep value became progressively more pronounced, with the most significant difference observed at the A5 antenna. Additionally, in the DE, no significant differences in the Ep values were found at any node between S. waltoni released in 2021 and those released in this study (Fisher’s exact test, p > 0.05).

3.2. Upstream Rhythms of Fish in Different Environments

The upstream migration rhythms of the fish were analyzed using the signals detected at A3. Positioned at the midpoint of the experimental segment, A3 reflects changes in fish rhythms after traversing a certain distance, providing a more accurate representation of fish behavior influenced by light conditions during upstream migration. During the experiment, 17 fish were detected at A3 in the NE, while 25 fish were detected at A3 in the DE. The numbers of fish passing per hour in the NE and DE showed no significant differences (Mann–Whitney U test, p > 0.05).
In the NE, the upstream migration of the fish was evenly dispersed between night and day, with comparable numbers of fish passing during the day and night (Figure 5). Upstream migration was primarily concentrated during periods of light transition in the morning (7:00–7:59) and evening (19:00–21:59), while upstream migration significantly decreased during midday (12:00–14:59), exhibiting a typical diurnal rhythm. The fitted curve shows large fluctuations, indicating that fish behavior in the NE was more complex and more significantly influenced by diurnal rhythms.
In the DE, 76% of the fish passed through the A3 antenna during the daytime (6:00–19:59), with peaks in upstream migration occurring between 11:00–14:59 and 15:00–18:59, approximately 1–2 h after the fish release times. The fitted curve is relatively smooth, reflecting a simpler pattern of upstream behavior in the DE.

3.3. Fish Transit Speed and Influencing Factors

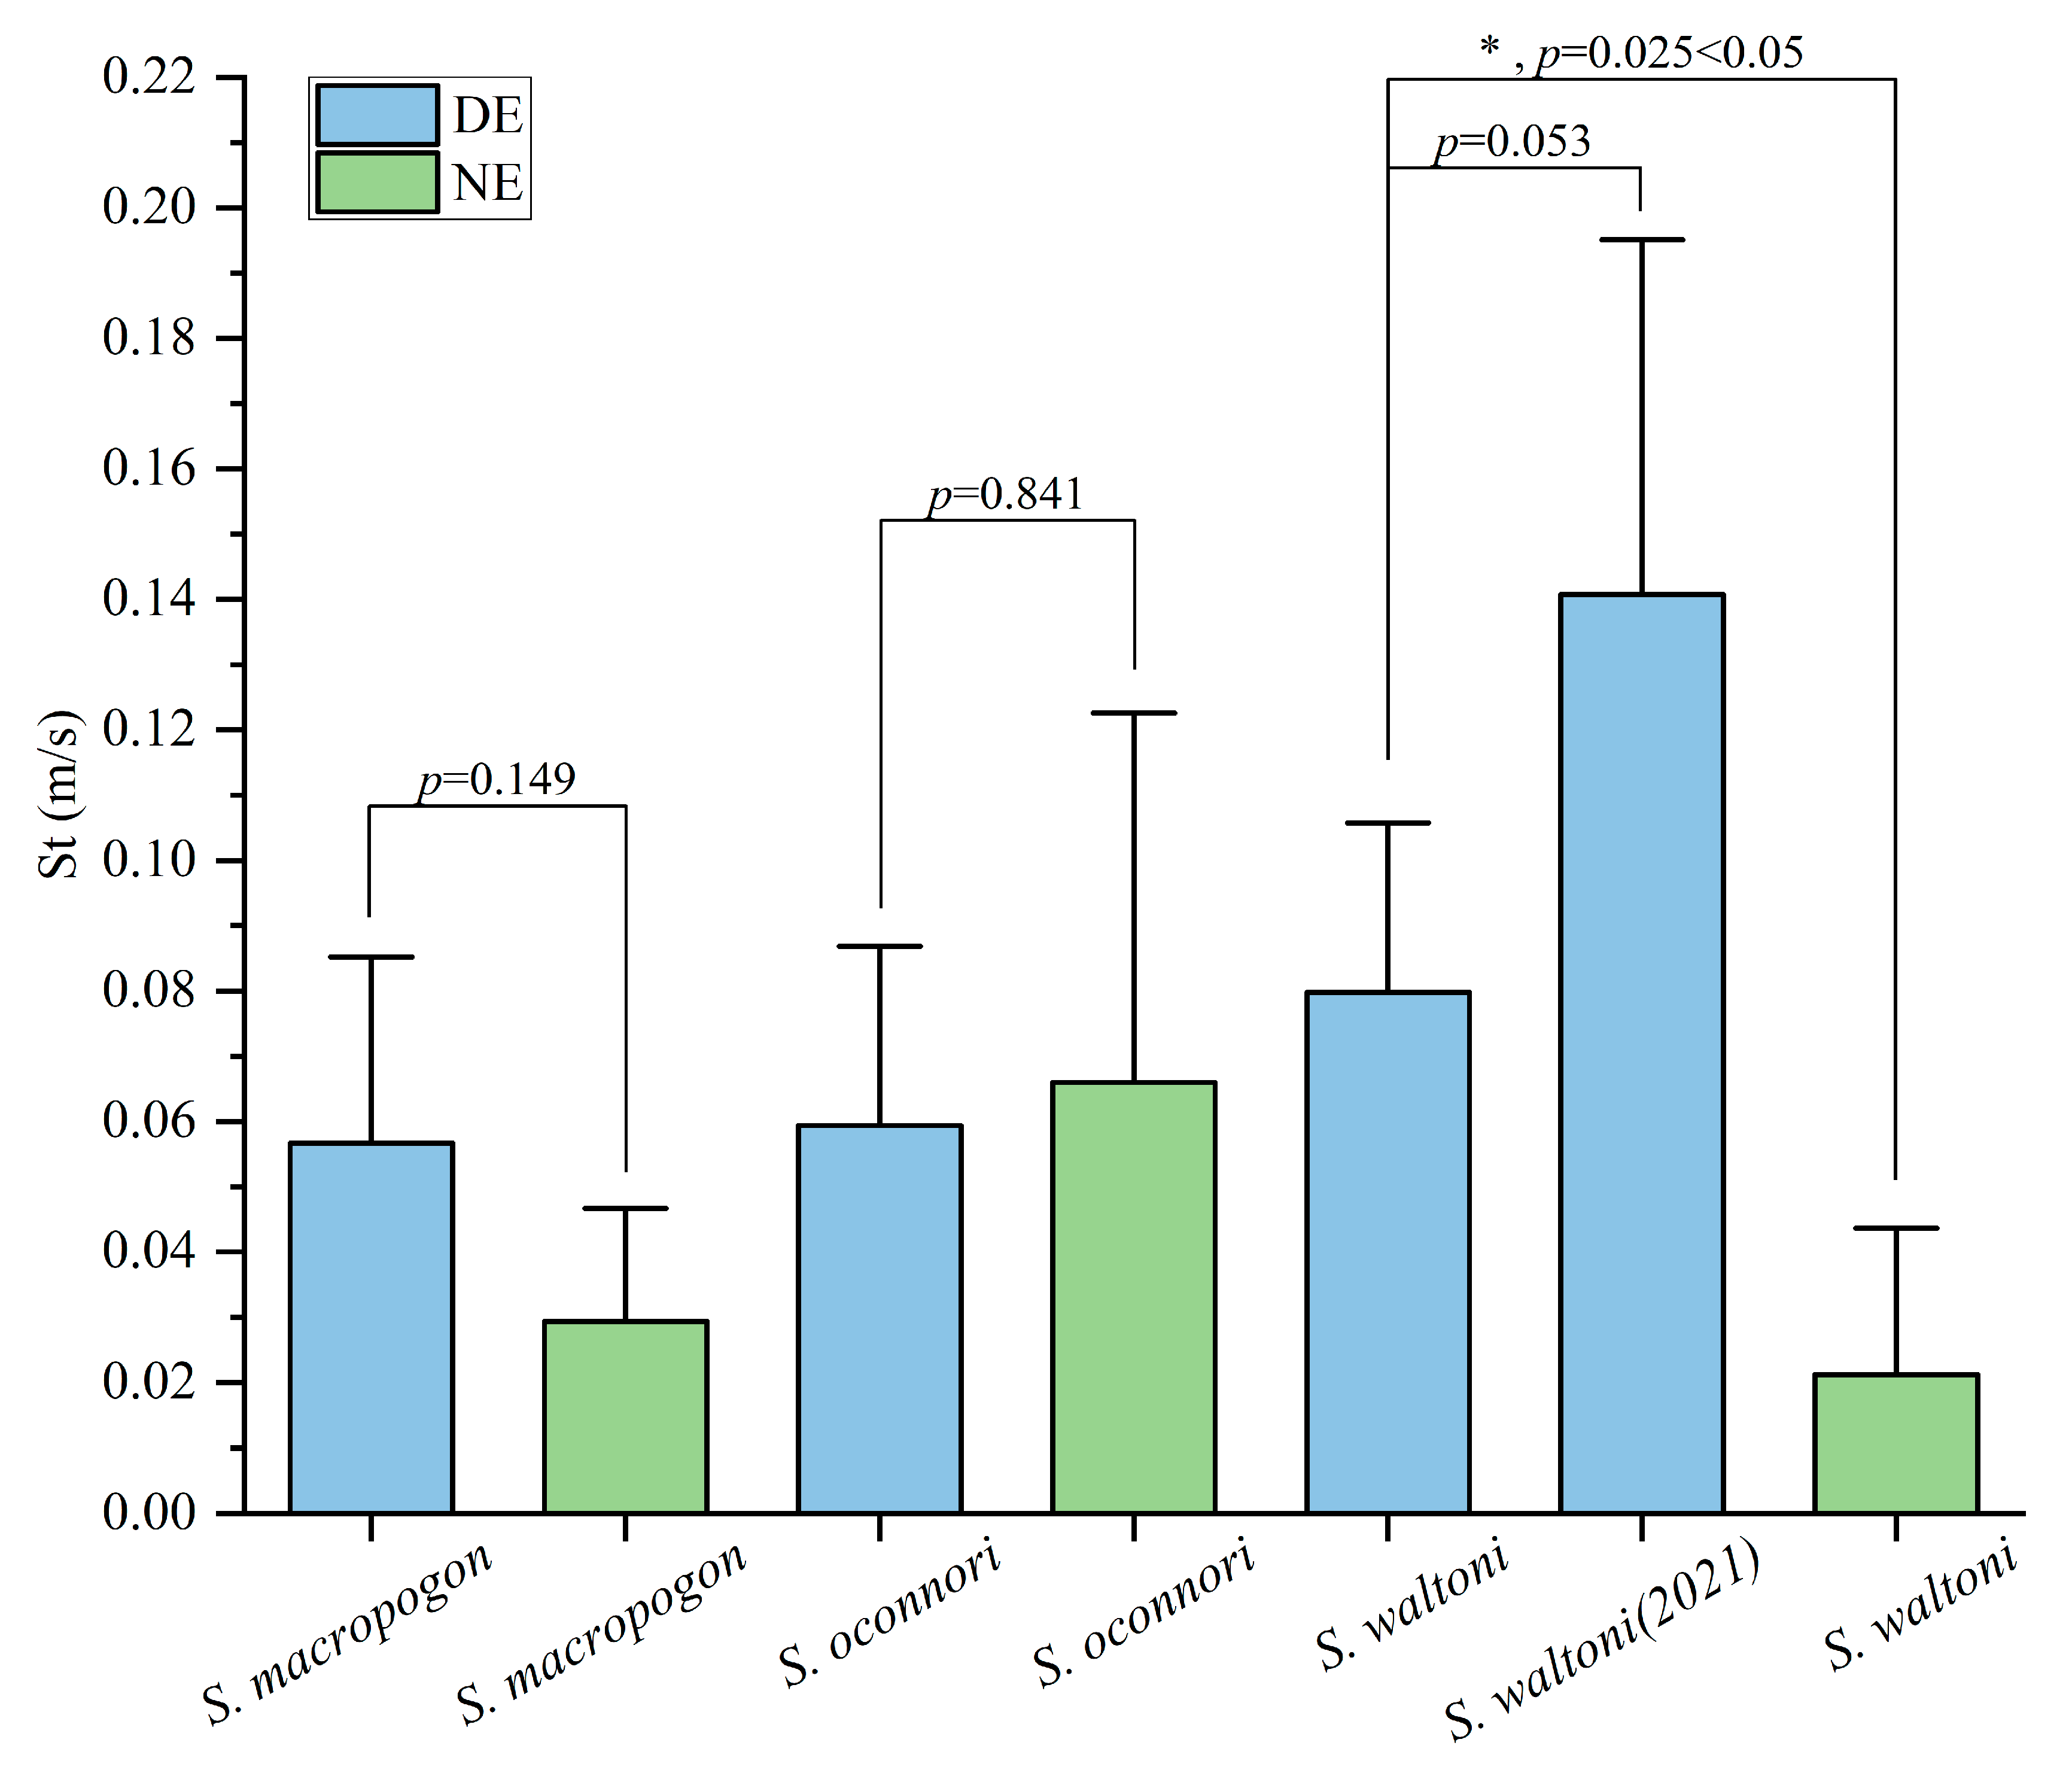
3.3.1. Analysis of Environmental Differences in Transit Speed

The average St of S. oconnori (0.066 m/s) was significantly higher than those of S. macropogon (0.029 m/s) and S. waltoni (0.021 m/s) (Table 2, Figure 6). In the DE, the average St of S. waltoni (0.080 m/s) was slightly higher than those of S. macropogon (0.057 m/s) and S. oconnori (0.059 m/s), with the latter two showing similar speeds. In the DE, the average St values of S. macropogon and S. waltoni were higher than those in the NE, increasing by factors of 2 and 3.8, respectively, while the average St of S. oconnori remained relatively stable across the two environments (Figure 6).
The St values of S. macropogon and S. oconnori did not show significant differences between the DE and NE (Kruskal–Wallis test, p > 0.05). However, the St values of S. waltoni exhibited a significant difference between the two environments (Kruskal–Wallis test, p = 0.025). Notably, in the DE, the average St value of the S. waltoni released in 2021 was higher than that of the S. waltoni released in the current experiment, although the difference was not statistically significant (Kruskal–Wallis test, p = 0.053 > 0.05).

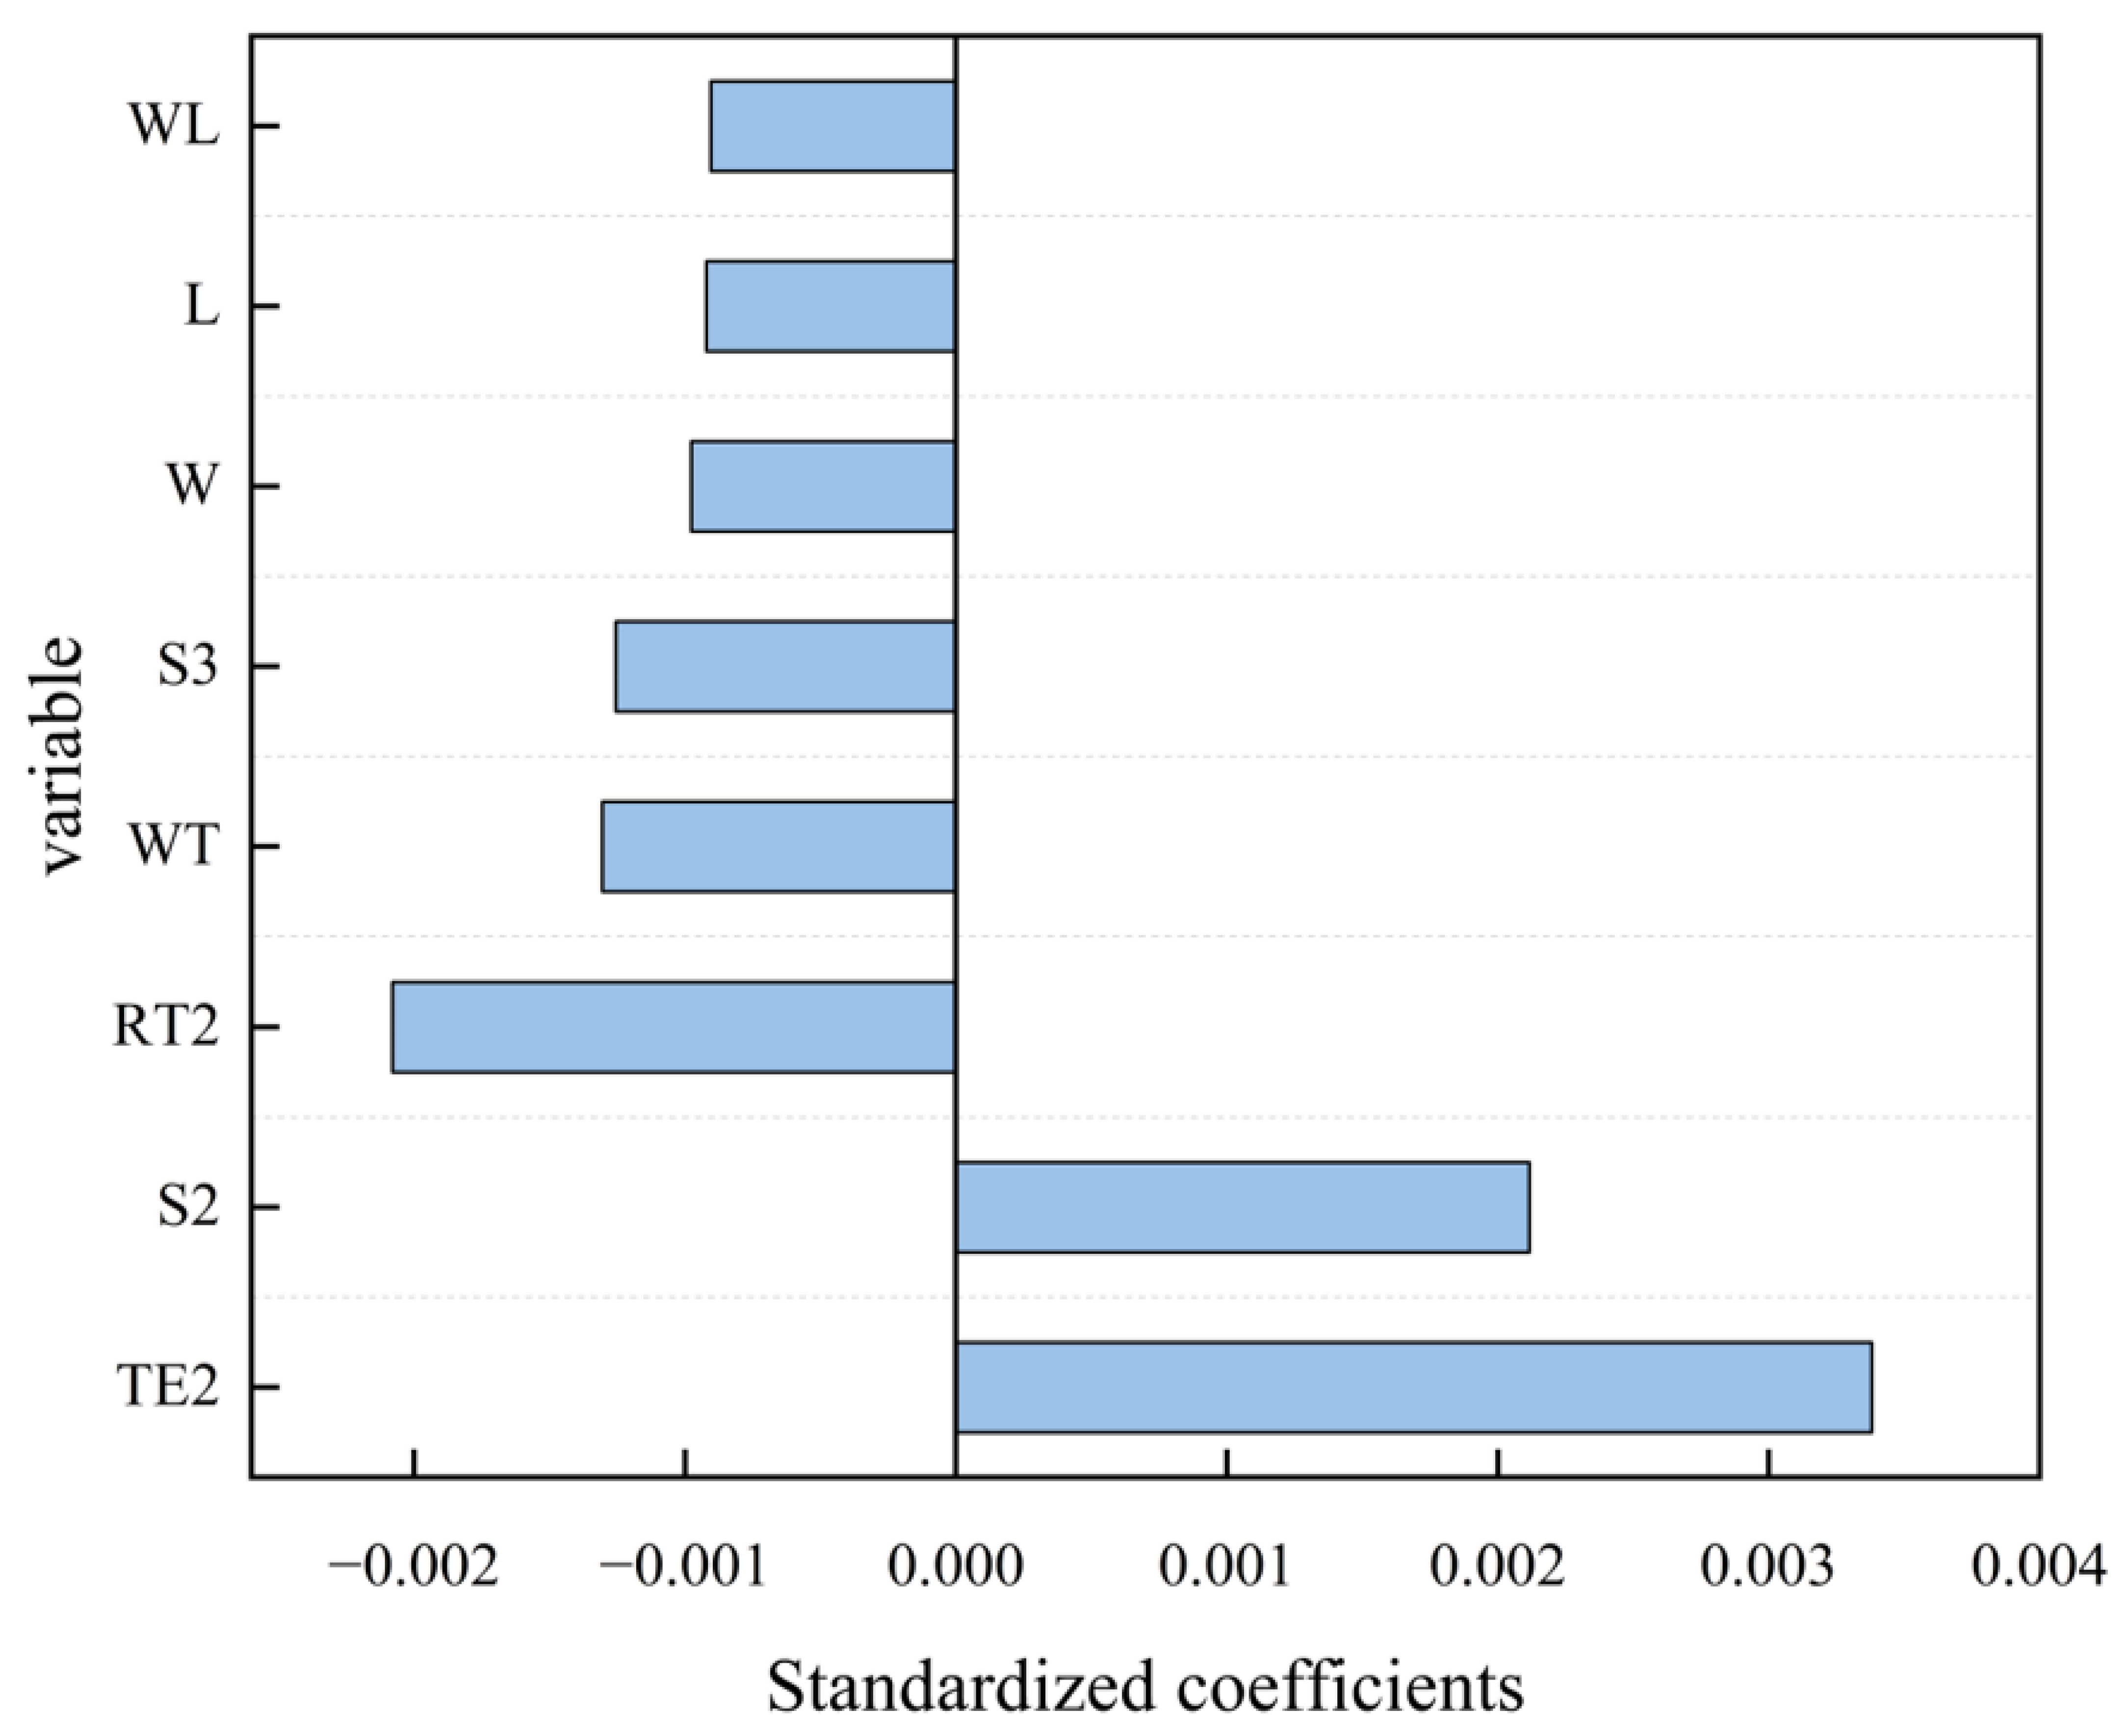
3.3.2. Analysis of the Key Factors Influencing Transit Speeds

To identify the key factors influencing St, a ridge regression model was constructed, and the regression coefficients were standardized and subsequently ranked in ascending order of their absolute values (Figure 7). The test environment (DE/NE) was identified as a key factor influencing St; in the ridge regression analysis, the NE was used as the reference variable, and TE2 represented the difference between the DE and NE (regression coefficient = 0.00338). TE2 had the largest absolute value among the regression coefficients and was positive. This indicates that in this experiment, the test environment played a dominant role in influencing St, with the DE having a positive effect on the upstream migration of the three plateau schizothoracids in the vertical-slot fishway.
The fish species was another key influencing factor. In the ridge regression analysis, S. macropogon was used as the reference variable. S2 represented the difference between S. oconnori and S. macropogon (regression coefficient = 0.00256), while S3 represented the difference between S. waltoni and S. macropogon (regression coefficient = −0.00139). The regression coefficients (Figure 7) indicated that the upstream migration performance of S. oconnori was better than that of S. macropogon, whereas the upstream migration performance of S. waltoni was inferior to that of S. macropogon.
The release time (RT) was the third most influential factor. RT2 represents the difference between the afternoon release (14:30–16:30) and the morning release (9:30–11:30), with a regression coefficient of −0.00208. The negative value indicates that fish released in the morning had a higher transit speed than those released in the afternoon. The water temperature (WT), weight (W), length (L), and water level (WL) all had negative impacts on the fish transit speed, with regression coefficients of −0.0013, −0.00098, −0.00092, and −0.00091, respectively (Figure 7). In terms of absolute coefficient values, the water temperature had a slightly greater effect on the transit speed, while the effects of the water level, length, and weight were relatively smaller and similar.

4. Discussion

4.1. Analysis of Fish Upstream Behaviors in Different Environments

In this study, S. macropogon, S. waltoni, and S. oconnori exhibited higher Ee values in the DE. The crepuscular Macquaria novemaculeata showed a preference for the DE [26]. Although there is currently no direct evidence to confirm that S. macropogon and S. waltoni are crepuscular, S. oconnori is more active at night than during the day [27]. Similarly, Schizothorax wangchiachii, another species in the same genus, was found to be more active at night [28]. This study also observed that these three fish species exhibited typical crepuscular characteristics in the NE, consistent with the behavioral patterns of schizothoracids. This explains why the three schizothoracids showed a stronger willingness to migrate upstream in the DE.
The DE had a positive effect on the upstream behaviors of plateau schizothoracids. Both S. macropogon and S. waltoni exhibited high Ep values in both the DE and NE, with their average St being higher in the DE than in the NE. S. oconnori had an Ep value of 75% in the DE; however, in the NE, the Ep value of S. oconnori decreased progressively across nodes, with no tagged individuals detected at A5. This indicates that the DE did not pose a challenge to the upstream migration of the three plateau schizothoracids, while the NE negatively impacted the upstream migration of S. oconnori. Increased illumination inhibited the swimming stability of Ctenopharyngodon idellus [19]. However, our study was conducted under field conditions in a fishway, whereas Lin’s study was conducted in an open tank in the laboratory.
We found that fish in the NE exhibited crepuscular activity rhythms, whereas in the DE, their upstream behaviors showed greater daytime activity concentration, with a significantly weakened diurnal rhythm. This suggests that the DE caused a temporary disruption to the upstream migration rhythms of these three schizothoracids. Such changes in migration rhythms are common during fish migration, as supported by similar studies by Keefer [29], Ono [30], Thorpe [14], Jones [16], and Pulgar [31]. However, the ecological impacts of these changes remain unclear, and whether they could lead to potential negative ecological effects requires further research.

4.2. Identification of the Key Factors Influencing Transit Speeds

The growth, development, behavior, and physiological processes of fish are strongly regulated by the combined effects of biotic and abiotic factors [32,33]. Ridge regression analysis indicated that the test environment was the most critical influencing factor, with the absence of light in the DE having positive effects on the St values of S. macropogon, S. waltoni, and S. oconnori. Fish migration and upstream movement are highly environmentally dependent [29]. In the DE, the reduction in complex visual signals means fish experience fewer visual stimuli or disturbances, allowing them to rely more on non-visual sensory systems (e.g., the lateral line) to perceive the direction and intensity of the water flow, potentially enhancing their focus on upstream migration. Additionally, predator pressure is significantly reduced in the DE, enabling the fish to concentrate more on their migration, resulting in faster speeds. This aligns with the predator–prey model, which suggests that fish exhibit more cautious behavior in the environment where predators are perceived, but act more boldly when the risk of predation is lower [34].
The fish species is an important factor influencing the St value [31,35,36]. The ridge regression results indicated that S. oconnori outperformed S. macropogon and S. waltoni in upstream migration. However, S. waltoni exhibited better swimming capabilities than S. oconnori [21]. This discrepancy may arise from differences in experimental conditions. Wang’s study was conducted under highly controlled indoor conditions, where the water flow was the primary variable. In contrast, this study employed in situ experiments with more complex environmental factors, including light, the water temperature, and the water level. Further analysis revealed that S. waltoni was better adapted to the DE, exhibiting higher St values in this environment, while S. oconnori maintained consistently high St values in both the DE and NE. This is likely because of the significant species-specific responses of fish to changes in light conditions [37,38]. These findings are also consistent with the results of indoor experiments by Xu [20], which demonstrated that S. waltoni is sensitive to light intensity and prefers the DE, enabling it to better perceive the water flow direction in a dark environment.
The effect of the release time on the St value may be attributed to the influence of the water temperature on their migratory behavior. Fish released in the morning (9:30–11:30) experience lower water temperatures compared to those released in the afternoon (14:30–16:30). The water temperature has a negative impact on the St value, as higher temperatures may affect energy allocation and behavioral patterns, thereby inhibiting migration speed and migratory capacity [39]. At the same time, higher water levels are often associated with higher water flow velocities, which increase the difficulty for fish to overcome hydraulic resistance. Additionally, the fish length (L) and weight (W) exerted relatively minor negative effects on the St value. This could be partly explained by smaller individuals exhibiting greater flexibility, allowing them to better adapt to complex hydrodynamic conditions. Additionally, the water level, fish length, and weight have minor negative impacts on St values, suggesting that multiple limiting factors may collectively influence the migration process. On the one hand, higher water levels are typically associated with higher flow velocities, increasing the difficulty for fish to overcome water resistance [40]. On the other hand, smaller individuals may exhibit greater adaptability under complex hydrodynamic conditions, because of their higher level of flexibility [41].
In summary, the results of this study emphasize the dominant roles of the test environment (DE/NE) and fish species in influencing St values. These findings provide new insights for fishway design, suggesting that tunnel sections can be optimized based on species-specific differences to better support fish migration behavior and ecological needs. Future research could further validate the applicability of these conclusions to other fish species or environmental conditions, potentially using a tunnel.

4.3. Establishment of a Basin-Wide PIT Database

This study detected 29 fish tagged by other research teams, among which 13 were confirmed to have been released in 2021. The average St value of the S. waltoni released in 2021 was higher than that of the S. waltoni released in the current study, though this difference did not reach statistical significance (p = 0.053) but was close to the threshold of statistical significance. This trend suggests that the fish released in 2021 may have stronger migratory capabilities because of factors such as individual condition, environmental adaptability, or the long-term presence of internal tags. This finding highlights the potential impact of internal tags on the long-term migratory behavior of fish, which warrants further investigation [42]. Although the current data do not provide sufficient support for definitive statistical conclusions, this trend offers a new perspective for future research.
Since 2018, more than four batches of tagged fish have been released in the upstream and downstream regions of this fishway (in 2018, 2021, and 2024), including S. waltoni, S. oconnori, S. macropogon, and Schizopygopsis younghusbandi, among other plateau-endemic and rare fish species. The total number of released tagged fish is estimated to exceed 800 individuals. This provides a foundation for establishing a basin-wide PIT-tagged fish database, which can encompass fish migration data across different time periods and spatial scales, offering a more comprehensive understanding of the migratory patterns and ecological adaptability of plateau-endemic rare fish species. Similar fish-tagging databases, such as the Columbia Basin PIT Tag Information System (PTAGIS) in the USA, support large-scale fish monitoring and conservation. A standardized tagging system, like ICAR-certified PIT tags, enhances data compatibility, tracking efficiency, and multi-agency collaboration, facilitating data sharing. The establishment of a basin-wide PIT-tag database holds significant scientific and management value, providing critical data support for the conservation of plateau-endemic rare fish species, optimization of fishway design, and management of migratory corridors across hydropower systems. This will contribute to achieving basin-scale fish resource management and ecosystem protection goals.
This study utilized PIT technology to obtain quantitative data on fish passages through the same vertical-slot fishway in both the DE and NE. Overall, the findings revealed that the upstream migrations of S. macropogon, S. waltoni, and S. oconnori were not hindered in a dark environment, although differences in the passage efficiency and speeds were observed among the species. These results align with those in previous studies, indicating that the dark environment in tunnel sections has a significant impact on fish movement [26,30]. Despite these important conclusions, certain limitations should be noted. The experiments were conducted over a short time frame and within a single fishway, which may limit the generalizability of the results to other fishways or environmental conditions. Future research should involve long-term studies across diverse fishway types to better understand the broader effects of tunnel sections on fish migration.

5. Conclusions

This study demonstrated that the presence of a dark environment in a vertical-slot fishway did not hinder the upstream migrations of S. macropogon, S. waltoni, and S. oconnori. The main findings are as follows:
  • There were no significant differences in the entry efficiencies at the experimental segment for the three species in the dark and natural light environments. However, when facing the dark environment, the three fishes had entry efficiencies at the experimental segment of 66.7%, 88.9%, and 66.7%, respectively, all higher than their performances in the natural light environment;
  • The passage efficiencies of S. macropogon and S. waltoni showed no significant differences between the dark and natural light environments, with the passage efficiencies at the A5 antenna ranging from a minimum of 16.7% (S. waltoni in the dark environment) to a maximum of 40.0% (S. macropogon in the natural light environment). In contrast, S. oconnori exhibited a significant difference in the passage efficiencies between the two environments, with a passage efficiency at the A5 antenna of 0 in the natural light environment, which increased significantly to 75.0% in the dark environment;
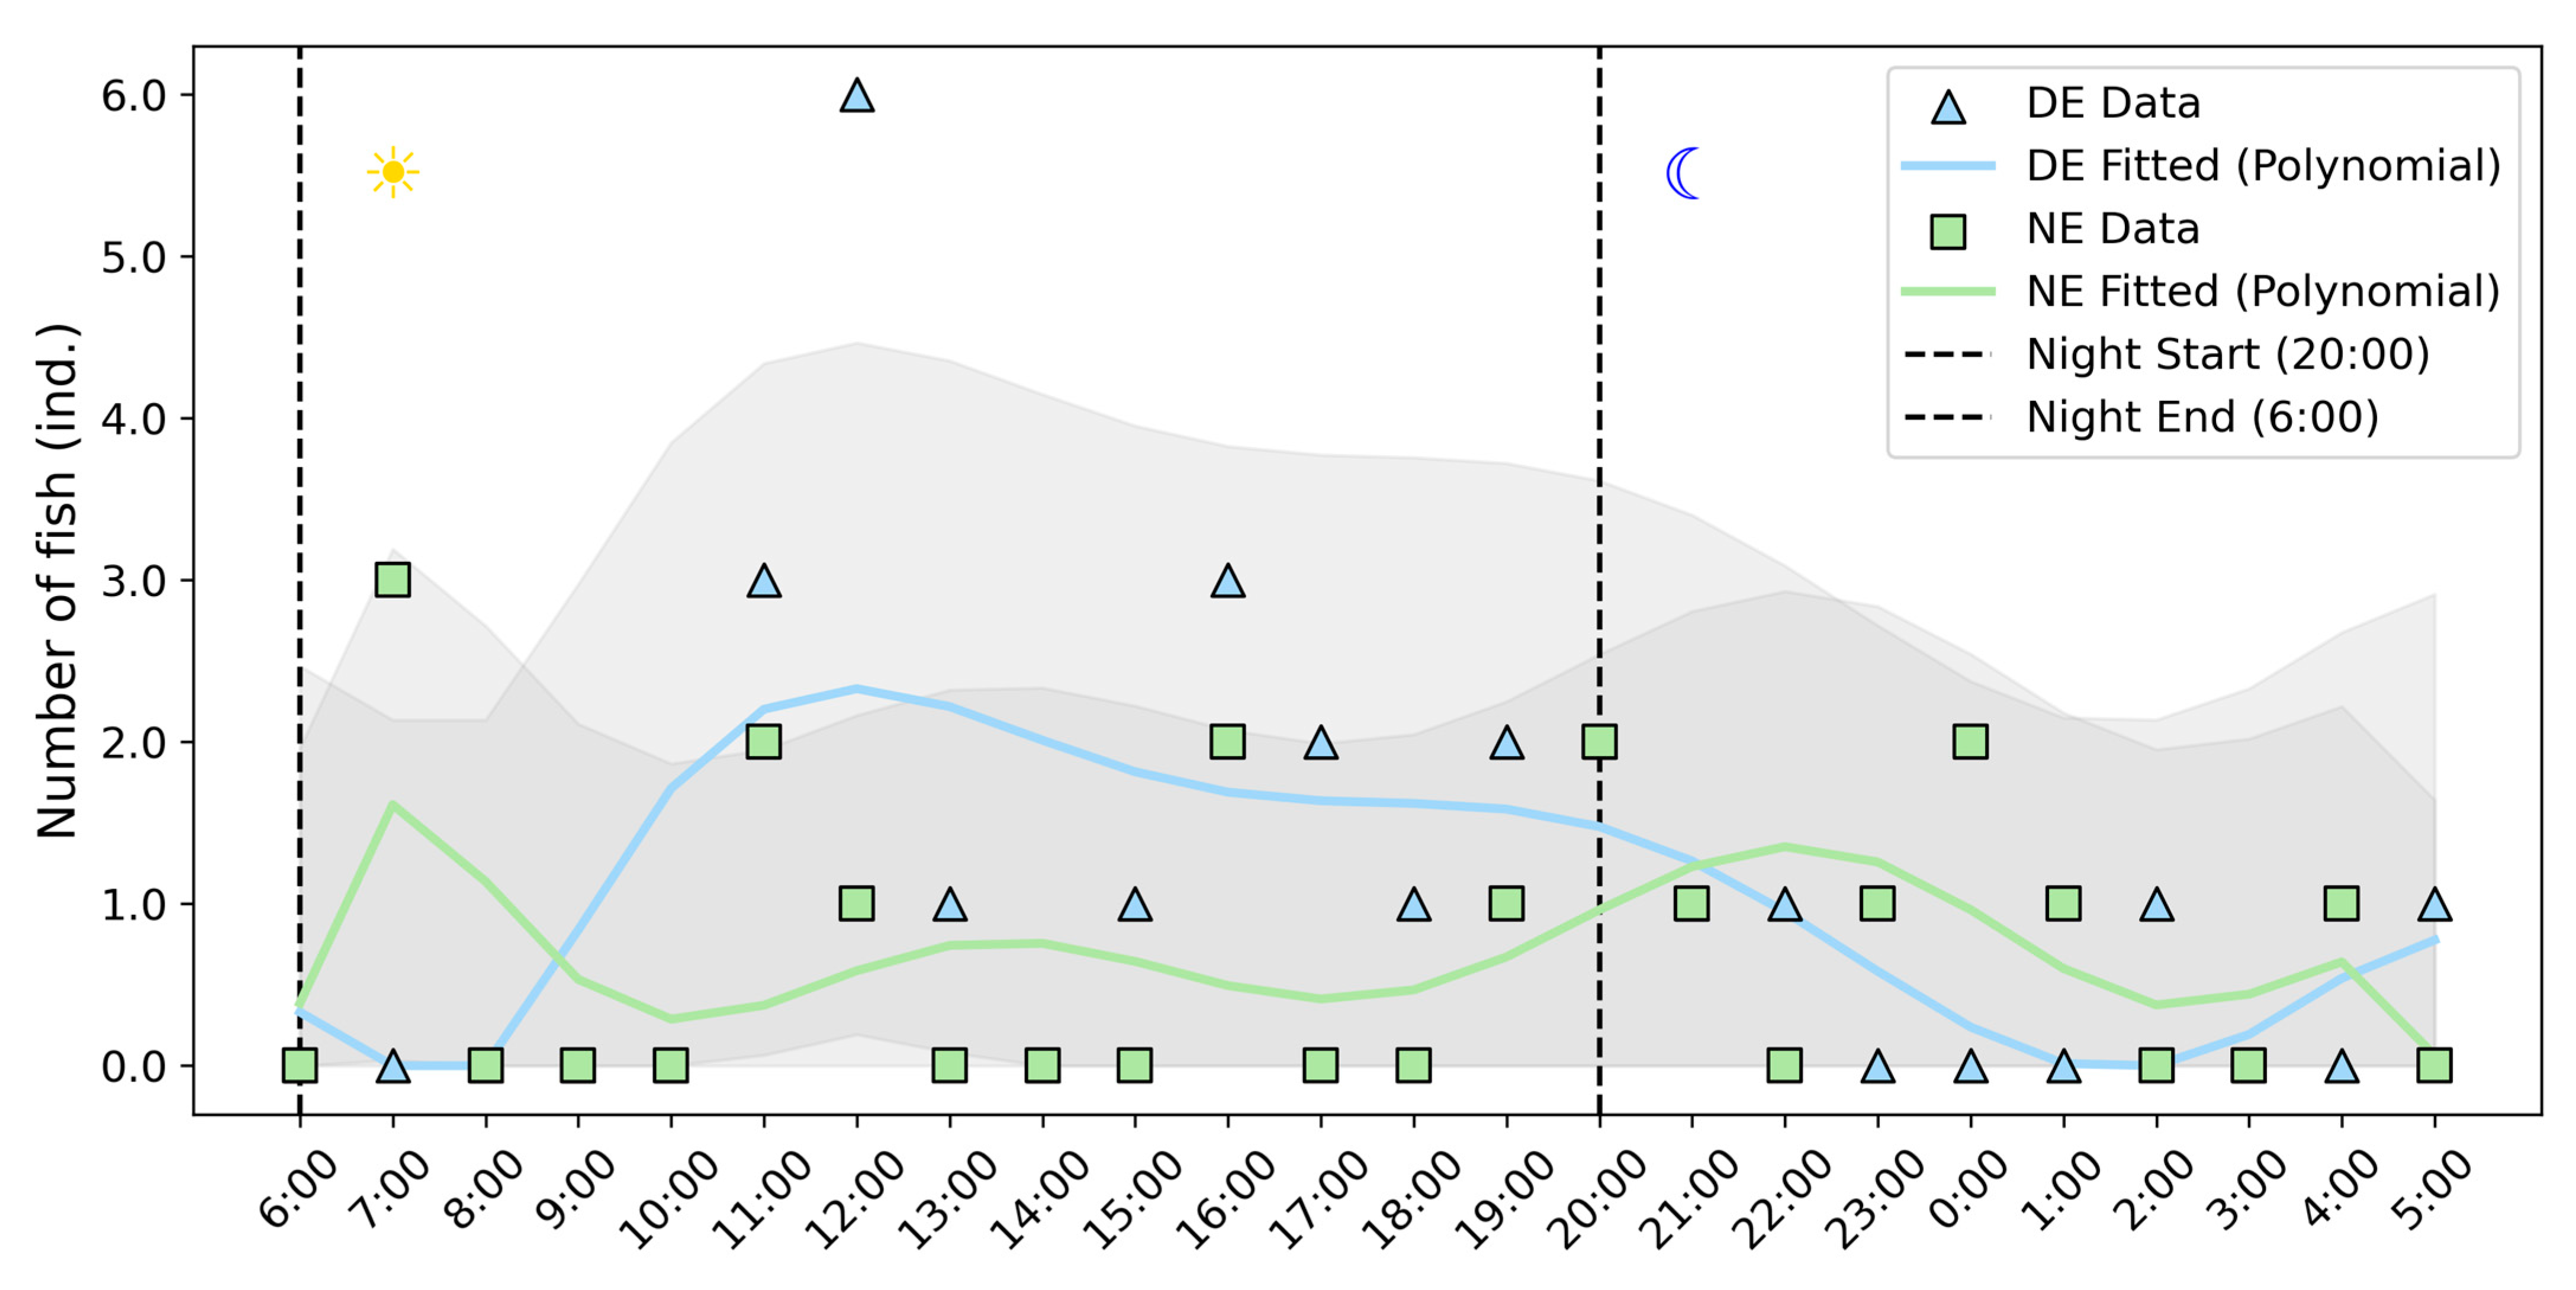
  • The dark environment disrupted the crepuscular migration rhythms of the three plateau schizothoracids. In the natural light environment, these fishes exhibit a distinct diel rhythm, with pronounced migration peaks during the morning (07:00–07:59) and evening (19:00–21:59) twilight periods. However, in the dark environment, the majority (76%) of the individuals migrate upstream during the daytime (06:00–19:59);
  • The average transit speeds of S. macropogon and S. waltoni in the dark environment were 2 times and 3.8 times higher, respectively, than those in the natural light environment, while the transit speeds of S. oconnori remained relatively stable across both environments. The dark environment had a dominant and positive effect on the transit speeds of all three species. The differences in the upstream behaviors among the species under varying light conditions highlighted species-specific adaptive responses. S. oconnori outperformed S. macropogon and S. waltoni in upstream migration, while S. waltoni exhibited greater adaptability to the dark environment.
This study provides critical scientific evidence for the future design of fishways and ecological restoration in the Yarlung Tsangpo River. In mountainous canyon terrains, utilizing tunnel-section fishways to restore river connectivity may be an effective approach. Future research should explore the long-term effects of dark tunnel environments on the migration rhythms and behaviors of fish to optimize fishway design and enhance ecological conservation outcomes.

Author Contributions

Conceptualization, B.W., J.L. (Jianzhang Lv) and H.L.; data curation, Y.H.; formal analysis, K.C.; funding acquisition, F.Y. and J.L. (Jingjuan Li); investigation, W.H.; methodology, B.W.; project administration, J.L. (Jingjuan Li); resources, Y.H.; supervision, X.W.; validation, B.W., H.L. and Z.W.; visualization, B.W.; writing—original draft, B.W.; writing—review and editing, F.Y. and J.L. (Jianzhang Lv). All authors have read and agreed to the published version of the manuscript.

Funding

This research was funded by the National Key Research and Development Program of China (2022YFC3204200, 2022YFC3204204), the Nanjing Hydraulic Research Institute Fund (Y123005), the Science and Technology Project of China Huaneng Group Co., Ltd.—Research on Key Technology for Evaluating the Fish Passing Effect of Fish Gathering and Fish Lift Systems at Wunonglong Power Station and Lidi Power Station (HNKJ23-H2), and Hydraulic Monitoring and Research on the Joint Operation of Fishways at Jiacha and Zangmu Hydropower Stations (HY123004).

Institutional Review Board Statement

This study does not require ethical approval.

Informed Consent Statement

Not applicable.

Data Availability Statement

Some of or all the data, models, and/or codes that support the findings of this study are available from the corresponding author upon reasonable request.

Conflicts of Interest

Fei Yao was employed by the company Jiangxi Port and Shipping Logistics Development Group Co., Ltd. The funder had the following involvement with the study: 1. Providing funding and resources during the study and participate in final review of the manuscrip., and did not involve in the process and result of the analysis 2. Fei Yao was responsible for funding acquisition and writing—review and editing during this research. The remaining authors declare that this research was conducted in the absence of any commercial or financial relationships that could be construed as potential conflicts of interest.

Abbreviations

  • The following abbreviations are used in this manuscript:
DEdark environment
NEnatural light environment
Eeentry efficiency at the experimental segment
Eppassage efficiency
Sttransit speed

References

  1. Freeman, M.C.; Pringle, C.M.; Jackson, C.R. Hydrologic connectivity and the contribution of stream headwaters to ecological integrity at regional scales. J. Am. Water Resour. Assoc. 2007, 43, 5–14. [Google Scholar] [CrossRef]
  2. Amoros, C.; Bornette, G. Connectivity and biocomplexity in waterbodies of riverine floodplains. Freshw. Biol. 2002, 47, 761–776. [Google Scholar] [CrossRef]
  3. Blanchet, S.; Rey, O.; Etienne, R.; Lek, S.; Loot, G. Species-specific responses to landscape fragmentation: Implications for management strategies. Evol. Appl. 2010, 3, 291–304. [Google Scholar] [CrossRef] [PubMed]
  4. Gouskov, A.; Reyes, M.; Wirthner-Bitterlin, L.; Vorburger, C. Fish population genetic structure shaped by hydroelectric power plants in the upper Rhine catchment. Evol. Appl. 2016, 9, 394–408. [Google Scholar] [CrossRef]
  5. Hall, C.J.; Jordaan, A.; Frisk, M.G. The historic influence of dams on diadromous fish habitat with a focus on river herring and hydrologic longitudinal connectivity. Landsc. Ecol. 2011, 26, 95–107. [Google Scholar] [CrossRef]
  6. Rosenberg, D.M.; McCully, P.; Pringle, C.M. Global-scale environmental effects of hydrological alterations: Introduction. Bioscience 2000, 50, 746–751. [Google Scholar] [CrossRef]
  7. Silva, A.T.; Lucas, M.C.; Castro-Santos, T.; Katopodis, C.; Baumgartner, L.J.; Thiem, J.D.; Aarestrup, K.; Pompeu, P.S.; O’Brien, G.C.; Braun, D.C.; et al. The future of fish passage science, engineering, and practice. Fish Fish. 2018, 19, 340–362. [Google Scholar] [CrossRef]
  8. Pan, D.; Lichuan, K.; Ying, C.; Peng, D.; Xin, G.; Hao, X. Research on the Structure and Application of canal-tunnel combined vertical slot fishway. Sichuan Water Resour. 2024, 45, 60–63. [Google Scholar]
  9. Xiaoli, W. CHN ENERGY started construction of the longest ecological fishway project in Asia. Constr. Enterp. Manag. 2023, 4, 120. [Google Scholar]
  10. Xianren, Z.; Chao, Y. Research on the design and application of fishway engineering of the BaLin Dam. Jilin Water Resour. 2024, 6, 69–73. [Google Scholar] [CrossRef]
  11. Qingyun, T.; Jie, T. The Application of Numerical Simulation in the Smooth Design of the Fishway of the Balin Dam. Sci. Technol. Innov. 2024, 5–8. [Google Scholar]
  12. Jones, M.J.; Hale, R. Using knowledge of behaviour and optic physiology to improve fish passage through culverts. Fish Fish. 2020, 21, 557–569. [Google Scholar] [CrossRef]
  13. Steenbergen, P.J.; Richardson, M.K.; Champagne, D.L. Patterns of avoidance behaviours in the light/dark preference test in young juvenile zebrafish: A pharmacological study. Behav. Brain Res. 2011, 222, 15–25. [Google Scholar] [CrossRef]
  14. Thorpe, J.E.; Morgan, R.I.G.; Pretswell, D.; Higgins, P.J. Movement Rhythms in Juvenile Atlantic Salmon, Salmo-Salar L. J. Fish Biol. 1988, 33, 931–940. [Google Scholar] [CrossRef]
  15. Huang, J.; Lin, C.; Shi, X.; Zhang, N.; Shi, S.; Zhang, B.; Mo, W. Light environment optimization of culvert fishway based on the phototaxis of Schizothorax prenanti. Chin. J. Ecol. 2021, 40, 2155–2163. [Google Scholar] [CrossRef]
  16. Jones, M.J.; Baumgartner, L.J.; Zampatti, B.P.; Beyer, K. Low light inhibits native fish movement through a vertical-slot fishway: Implications for engineering design. Fish. Manag. Ecol. 2017, 24, 177–185. [Google Scholar] [CrossRef]
  17. Hadderingh, R.H.; Van Aerssen, G.; De Beijer, R.; Van der Velde, G. Reaction of silver eels to artificial light sources and water currents: An experimental deflection study. Regul. Rivers-Res. Manag. 1999, 15, 365–371. [Google Scholar] [CrossRef]
  18. Tarena, F.; Comoglio, C.; Candiotto, A.; Nyqvist, D. Artificial light at night affects fish passage rates in two small-sized Cypriniformes fish. Ecol. Freshw. Fish 2024, 33, 13. [Google Scholar] [CrossRef]
  19. Lin, C.Y.; Deng, Z.D.; Shi, X.T.; Dai, H.C.; Wang, J.X.; Huang, W.Q.; Luo, J.; Huang, J. Mutually promoting or constraining? Disentangling the superimposed effect of velocity and illuminance on fish motion in low-velocity flows with a novel metric. Freshw. Biol. 2022, 67, 1468–1480. [Google Scholar] [CrossRef]
  20. Xu, J.; Sang, W.; Dai, H.; Lin, C.; Ke, S.; Mao, J.; Wang, G.; Shi, X. A Detailed Analysis of the Effect of Different Environmental Factors on Fish Phototactic Behavior: Directional Fish Guiding and Expelling Technique. Animals 2022, 12, 240. [Google Scholar] [CrossRef]
  21. Wang, H.T.; Jiang, X.T.; Liu, K.J.; Pu, X.C.; Wang, Y.M. Swimming ability of Schizothoracinae fishes in Yarlung Zangbo River of China. J. Fish Biol. 2024, 105, 95–109. [Google Scholar] [CrossRef] [PubMed]
  22. Franklin, A.E.; Haro, A.; Castro-Santos, T.; Noreika, J. Evaluation of Nature-Like and Technical Fishways for the Passage of Alewives at Two Coastal Streams in New England. Trans. Am. Fish. Soc. 2012, 141, 624–637. [Google Scholar] [CrossRef]
  23. Robinson, W.; Baumgartner, L.J.; Homsombath, K.; Ning, N.; Phommachanh, K.; Phommavong, T.; Poomchaivej, T.; Pomorin, K.; Simmanivong, D.; Singhanouvong, D.; et al. PIT tagging systems are suitable for assessing cumulative impacts of Mekong River hydropower plants on (upstream) fish migrations in Lao PDR. Fish Res. 2024, 274, 5. [Google Scholar] [CrossRef]
  24. Xu, J.W.; Li, D.Q.; Hu, X.Z.; Jiao, Y.L.; Wang, J.P.; Wu, Y.J.; Lin, C.Y.; Ke, S.F.; Bai, T.X.; Wang, N.N.; et al. Quantitative Assessment and Regulation of Passage and Entrance Attraction Efficiency of Vertical-Slot Fishway on Heishuihe River in Southwest China. Animals 2024, 14, 2365. [Google Scholar] [CrossRef]
  25. Bao, J.H.; Li, W.W.; Zhang, C.S.; Mi, X.Y.; Li, H.T.; Zhao, X.J.; Cao, N.; Twardek, W.M.; Cooke, S.J.; Duan, M. Quantitative assessment of fish passage efficiency at a vertical-slot fishway on the Daduhe River in Southwest China. Ecol. Eng. 2019, 141, 12. [Google Scholar] [CrossRef]
  26. Keep, J.K.; Watson, J.R.; Cramp, R.L.; Jones, M.J.; Gordos, M.A.; Ward, P.J.; Franklin, C.E. Low light intensities increase avoidance behaviour of diurnal fish species: Implications for use of road culverts by fish. J. Fish Biol. 2021, 98, 634–642. [Google Scholar] [CrossRef]
  27. Liang, Y.; Hou, Y.Q.; Hu, W.B.; Johnson, D.; Wang, J.X. Flow velocity preference of Schizothorax oconnori Lloyd swimming upstream. Glob. Ecol. Conserv. 2021, 32, 10. [Google Scholar] [CrossRef]
  28. Hou, Y.Q.; Yang, Z.; An, R.D.; Cai, L.; Chen, X.J.; Zhao, X.J.; Zou, X. Water flow and substrate preferences of Schizothorax wangchiachii (Fang, 1936). Ecol. Eng. 2019, 138, 1–7. [Google Scholar] [CrossRef]
  29. Keefer, M.L.; Caudill, C.C.; Peery, C.A.; Moser, M.L. Context-dependent diel behavior of upstream-migrating anadromous fishes. Environ. Biol. Fishes 2013, 96, 691–700. [Google Scholar] [CrossRef]
  30. Ono, K.; SimenstadSchool, C.A. Reducing the effect of overwater structures on migrating juvenile salmon: An experiment with light. Ecol. Eng. 2014, 71, 180–189. [Google Scholar] [CrossRef]
  31. Pulgar, J.; Manríquez, P.H.; Widdicombe, S.; Garcia-Huidobro, R.; Quijón, P.A.; Carter, M.; Aldana, M.; Quintanilla-Ahumada, D.; Duarte, C. Artificial Light at Night (ALAN) causes size-dependent effects on intertidal fish decision-making. Mar. Pollut. Bull. 2023, 193, 6. [Google Scholar] [CrossRef] [PubMed]
  32. Ren, Y.; Xie, D.; Li, B.; Liu, Y.; Hu, S.; Liu, H.; Shi, Y.; Zhu, S. Influence of water temperature, habitat complexity and light on the predatory performance of the dark sleeper Odontobutis potamophila (Gunther, 1861). J. Freshw. Ecol. 2020, 35, 367–378. [Google Scholar] [CrossRef]
  33. Koeda, K.; Touma, H.; Tachihara, K. Nighttime migrations and behavioral patterns of Pempheris schwenkii. PeerJ 2021, 9, 15. [Google Scholar] [CrossRef]
  34. Peterson, A.N.; Soto, A.P.; McHenry, M.J. Pursuit and Evasion Strategies in the Predator–Prey Interactions of Fishes. Integr. Comp. Biol. 2021, 61, 668–680. [Google Scholar] [CrossRef] [PubMed]
  35. Thurow, R.F.; Peterson, J.T.; Chandler, G.L.; Moffitt, C.M.; Bjornn, T.C. Concealment of juvenile bull trout in response to temperature, light, and substrate: Implications for detection. PLoS ONE 2020, 15, 17. [Google Scholar] [CrossRef]
  36. Maximino, C.; de Brito, T.M.; Dias, C.; Gouveia, A.; Morato, S. Scototaxis as anxiety-like behavior in fish. Nat. Protoc. 2010, 5, 209–216. [Google Scholar] [CrossRef]
  37. Ali, M.A.; Sakurai, S.; Collin, S.P. Adaptative Radiation of the Retina in Galaxiidae (Salmoniformes). Aust. J. Zool. 1990, 38, 173–186. [Google Scholar] [CrossRef]
  38. Amtstaetter, F.; O’Connor, J.; Borg, D.; Stuart, I.; Moloney, P. Remediation of upstream passage for migrating Galaxias (Family: Galaxiidae) through a pipe culvert. Fisheries Manag. Ecol. 2017, 24, 186–192. [Google Scholar] [CrossRef]
  39. Bogaard, M.; Gido, K.; McKinstry, M.; Pennock, C. Water temperature predicts razorback sucker Xyrauchen texanus spawning migrations. Environ. Biol. Fishes 2023, 106, 1503–1517. [Google Scholar] [CrossRef]
  40. Katopodis, C.; Kells, J.; Acharya, M. Nature-Like and Conventional Fishways: Alternative Concepts? Can. Water Resour. J. 2001, 26, 211–232. [Google Scholar] [CrossRef]
  41. Hockley, F.; Wilson, C.; Brew, A.; Cable, J. Fish responses to flow velocity and turbulence in relation to size, sex and parasite load. J. R. Soc. Interface 2013, 11, 20130814. [Google Scholar] [CrossRef] [PubMed]
  42. Matley, J.K.; Klinard, N.V.; Jaine, F.R.A.; Lennox, R.J.; Koopman, N.; Reubens, J.T.; Harcourt, R.G.; Cooke, S.J.; Huveneers, C. Long-term effects of tagging fishes with electronic tracking devices. Fish. Fish. 2024, 25, 1009–1025. [Google Scholar] [CrossRef]
Figure 1. Aerial view of the test area. From right to left, the picture shows the reservoir, dam, and tailrace area. The fishway is arranged on the left bank of the river, and four fish inlets are arranged around the tailrace area (marked with a red triangle). The total length of the test section is about 655 m (marked with green lines), and there are five antennae (marked with red dots).
Fishes 10 00136 g001
Figure 2. The experimental site layout diagram. The test section, covered with green artificial turf, includes a total of 285 pool chambers. The water flow direction within the fishway is indicated by blue arrows. Along the flow direction, five antennae—A5, A4, A3, A2, and A1—are sequentially positioned.
Fishes 10 00136 g002
Figure 3. The water temperature and water level at antenna A1 were monitored from 27 April 2024 to 5 June 2024. The black dashed line indicates 17 May 2024, the date when the shading cloth was removed. The tick marks correspond to 00:00 each day. The lowest water temperature in the fishway occurs between 9:00 and 13:00, while the highest occurs between 16:00 and 20:00.
Fishes 10 00136 g003
Figure 4. The release of fish in the rest pool downstream of the A1 antenna. We used a bucket to release fish into the resting pool, manually lowering it slowly to the water surface to avoid sudden movements. After a brief pause, the bucket was gently tilted (about 30–45°), allowing the fish to exit voluntarily, minimizing stress and ensuring smooth adaptation.
Fishes 10 00136 g004
Figure 5. Diurnal rhythm (24 h) variations of the fish at the A3 antenna. The gray area represents the 95% confidence interval of the fitted curve.
Fishes 10 00136 g005
Figure 6. Mean transit speeds (St) of different Schizothorax species in different environments (mean ± SD). Error bars represent standard deviation (SD). Statistical significance between groups is indicated by p-values, with p < 0.05 considered as significant. The asterisk (*) denotes a statistically significant difference (p = 0.025 < 0.05).
Fishes 10 00136 g006
Figure 7. Standardized ridge regression coefficients of various factors for fish transit speed (St) in the fishway. The influencing factors include the fish length (L), fish weight (W), species (S), water temperature (WT), water level (WL), release time (RT), and test environment (TE). In the figure, TE2 represents the dark environment compared to the natural light environment, RT2 represents the afternoon release (14:30–16:30) compared to the morning release (9:30–11:30), S2 represents S. oconnori compared to S. macropogon, and S3 represents S. waltoni compared to S. macropogon.
Fishes 10 00136 g007
Table 1. Basic information on some fishways with long tunnels in China. The last row contains information about the fishway where our study was conducted, with the tunnel serving as the experimental segment.
NameRiverDam Height/Water Level (m)Total Length (m)Tunnel Length (m)Tunnel Proportion (%)StatusType
Gongzui Hydropower Station FishwayDadu River85.6156567443.1CompletedVertical-Slot Fishway
Batang Hydropower Station FishwayJinsha River69217657026.2Under ConstructionVertical-Slot Fishway
Jinchuan Hydropower Station FishwayDadu River111.5502096219.2Under ConstructionNatural-like Fishway
Zhala Hydropower Station FishwayYuqiao River67297082127.6Under ConstructionVertical-Slot Fishway
Xiangqi Hydropower Station FishwayXiangjiang River7555647585.4CompletedVertical-Slot Fishway
Balin Dam FishwayMengjiang Bawang River46183026514.5PlannedNatural-like Fishway
The Fishway Used in This ExperimentYarlung Zangbo River42259765525.2-Vertical-Slot Fishway
Table 2. Fish species, the number of released fish (N0), the numbers recorded at antennae (N1, N2, N3, N4, and N5), fish length (L), fish weight (W), transit speed (St), the entry efficiency at the experimental segment (Ee), and the passage efficiency (Ep) at each antenna. Ls, Ws, and Sts are expressed as mean values (± standard deviations), and the ranges are also presented. The last column corresponds to the tagged fish released by other research teams in 2021 and recorded in this study.
Test EnvironmentNEDENEDENEDEDE
SpeciesS. macropogonS. oconnoriS. waltoniS. waltoni (2021)
N01091218189-
Fish Length (cm)Mean ± SD (range)42.5 ± 4.13
(35.6–49.8)
45.7 ± 3.01
(40.5–48.6)
45.6 ± 9.02
(32.2–61.5)
44.4 ± 3.51
(37.6–50.6)
43.3 ± 5.96
(32.1–51.2)
42.7 ± 10.96
(25.1–54.4)
-
Fish weight (g)Mean ± SD (range)796.9 ± 290.96
(389.3–1335.3)
881.6 ± 135.31
(653.0–1088.2)
1101.5 ± 756.38
(357.6–2733.0)
770.9 ± 147.63
(450.8–975.7)
886.6 ± 323.37
(404.3–1432.5)
748.5 ± 492.71
(95.2–1376.3)
-
N156916868
N254815638
N334515537
N423212313
N522012213
Ee50.0%66.7%75.0%88.9%44.4%66.7%-
Ep2100.0%66.7%88.9%93.8%75.0%50.0%100.0%
Ep360.0%66.7%55.6%93.8%62.5%50.0%87.5%
Ep440.0%50.0%22.2%75.0%37.5%16.7%37.5%
Ep540.0%33.3%0%75.0%25.0%16.7%37.5%
St (m/s)Mean ± SD (range)0.029 ± 0.017
(0.012–0.050)
0.057 ± 0.027
(0.026–0.091)
0.066 ± 0.057
(0.004–0.122)
0.059 ± 0.027
(0.014–0.118)
0.021 ± 0.022
(0.004–0.061)
0.080 ± 0.026
(0.063–0.110)
0.141 ± 0.054
(0.068–0.216)
Disclaimer/Publisher’s Note: The statements, opinions and data contained in all publications are solely those of the individual author(s) and contributor(s) and not of MDPI and/or the editor(s). MDPI and/or the editor(s) disclaim responsibility for any injury to people or property resulting from any ideas, methods, instructions or products referred to in the content.

