Transcriptome Analysis Revealed the Immune and Metabolic Responses of Grass Carp (Ctenopharyngodon idellus) Under Acute Salinity Stress
Abstract
1. Introduction
2. Materials and Methods
2.1. Animals and Salinity Challenges
2.2. Sample Collection
2.3. Hematological Parameters Analysis
2.4. Sample Preparation and RNA-Seq Analysis
2.5. Identification of DEGs
2.6. KEGG Pathway Analysis
2.7. Real-Time Quantitative PCR
2.8. Statistical Analysis
3. Results
3.1. Survival Percentage
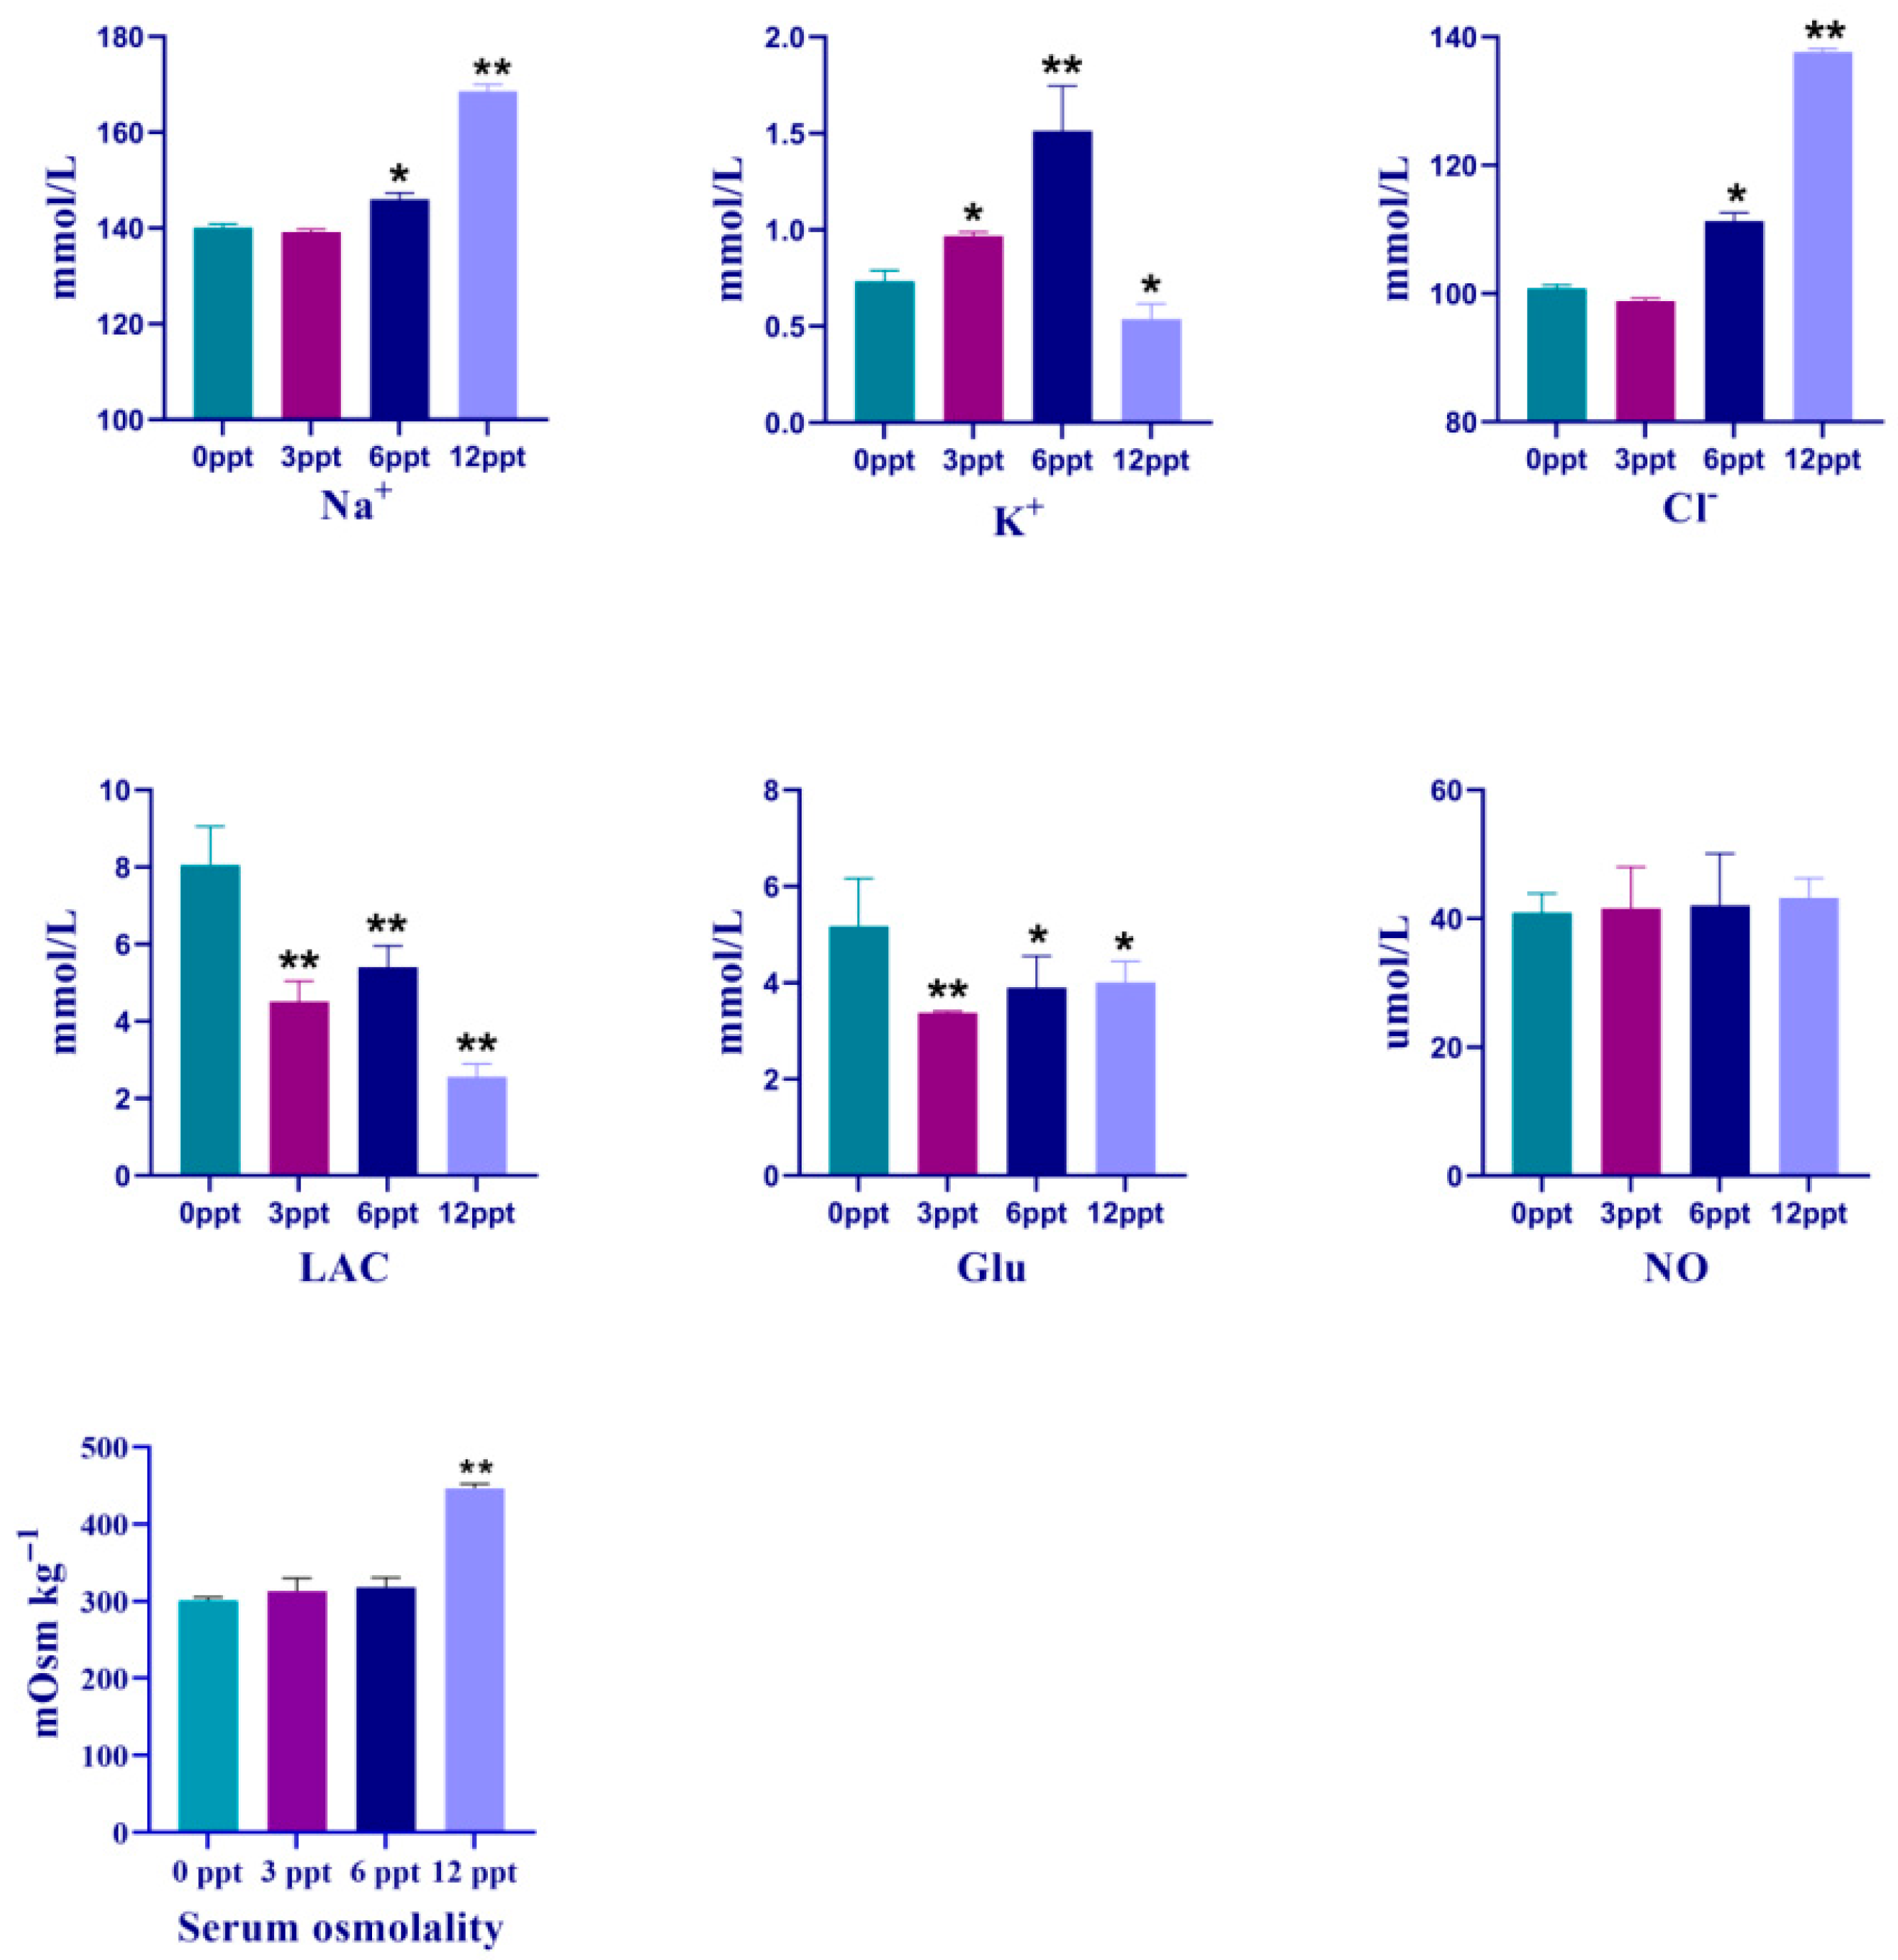
3.2. Serum Biochemistry
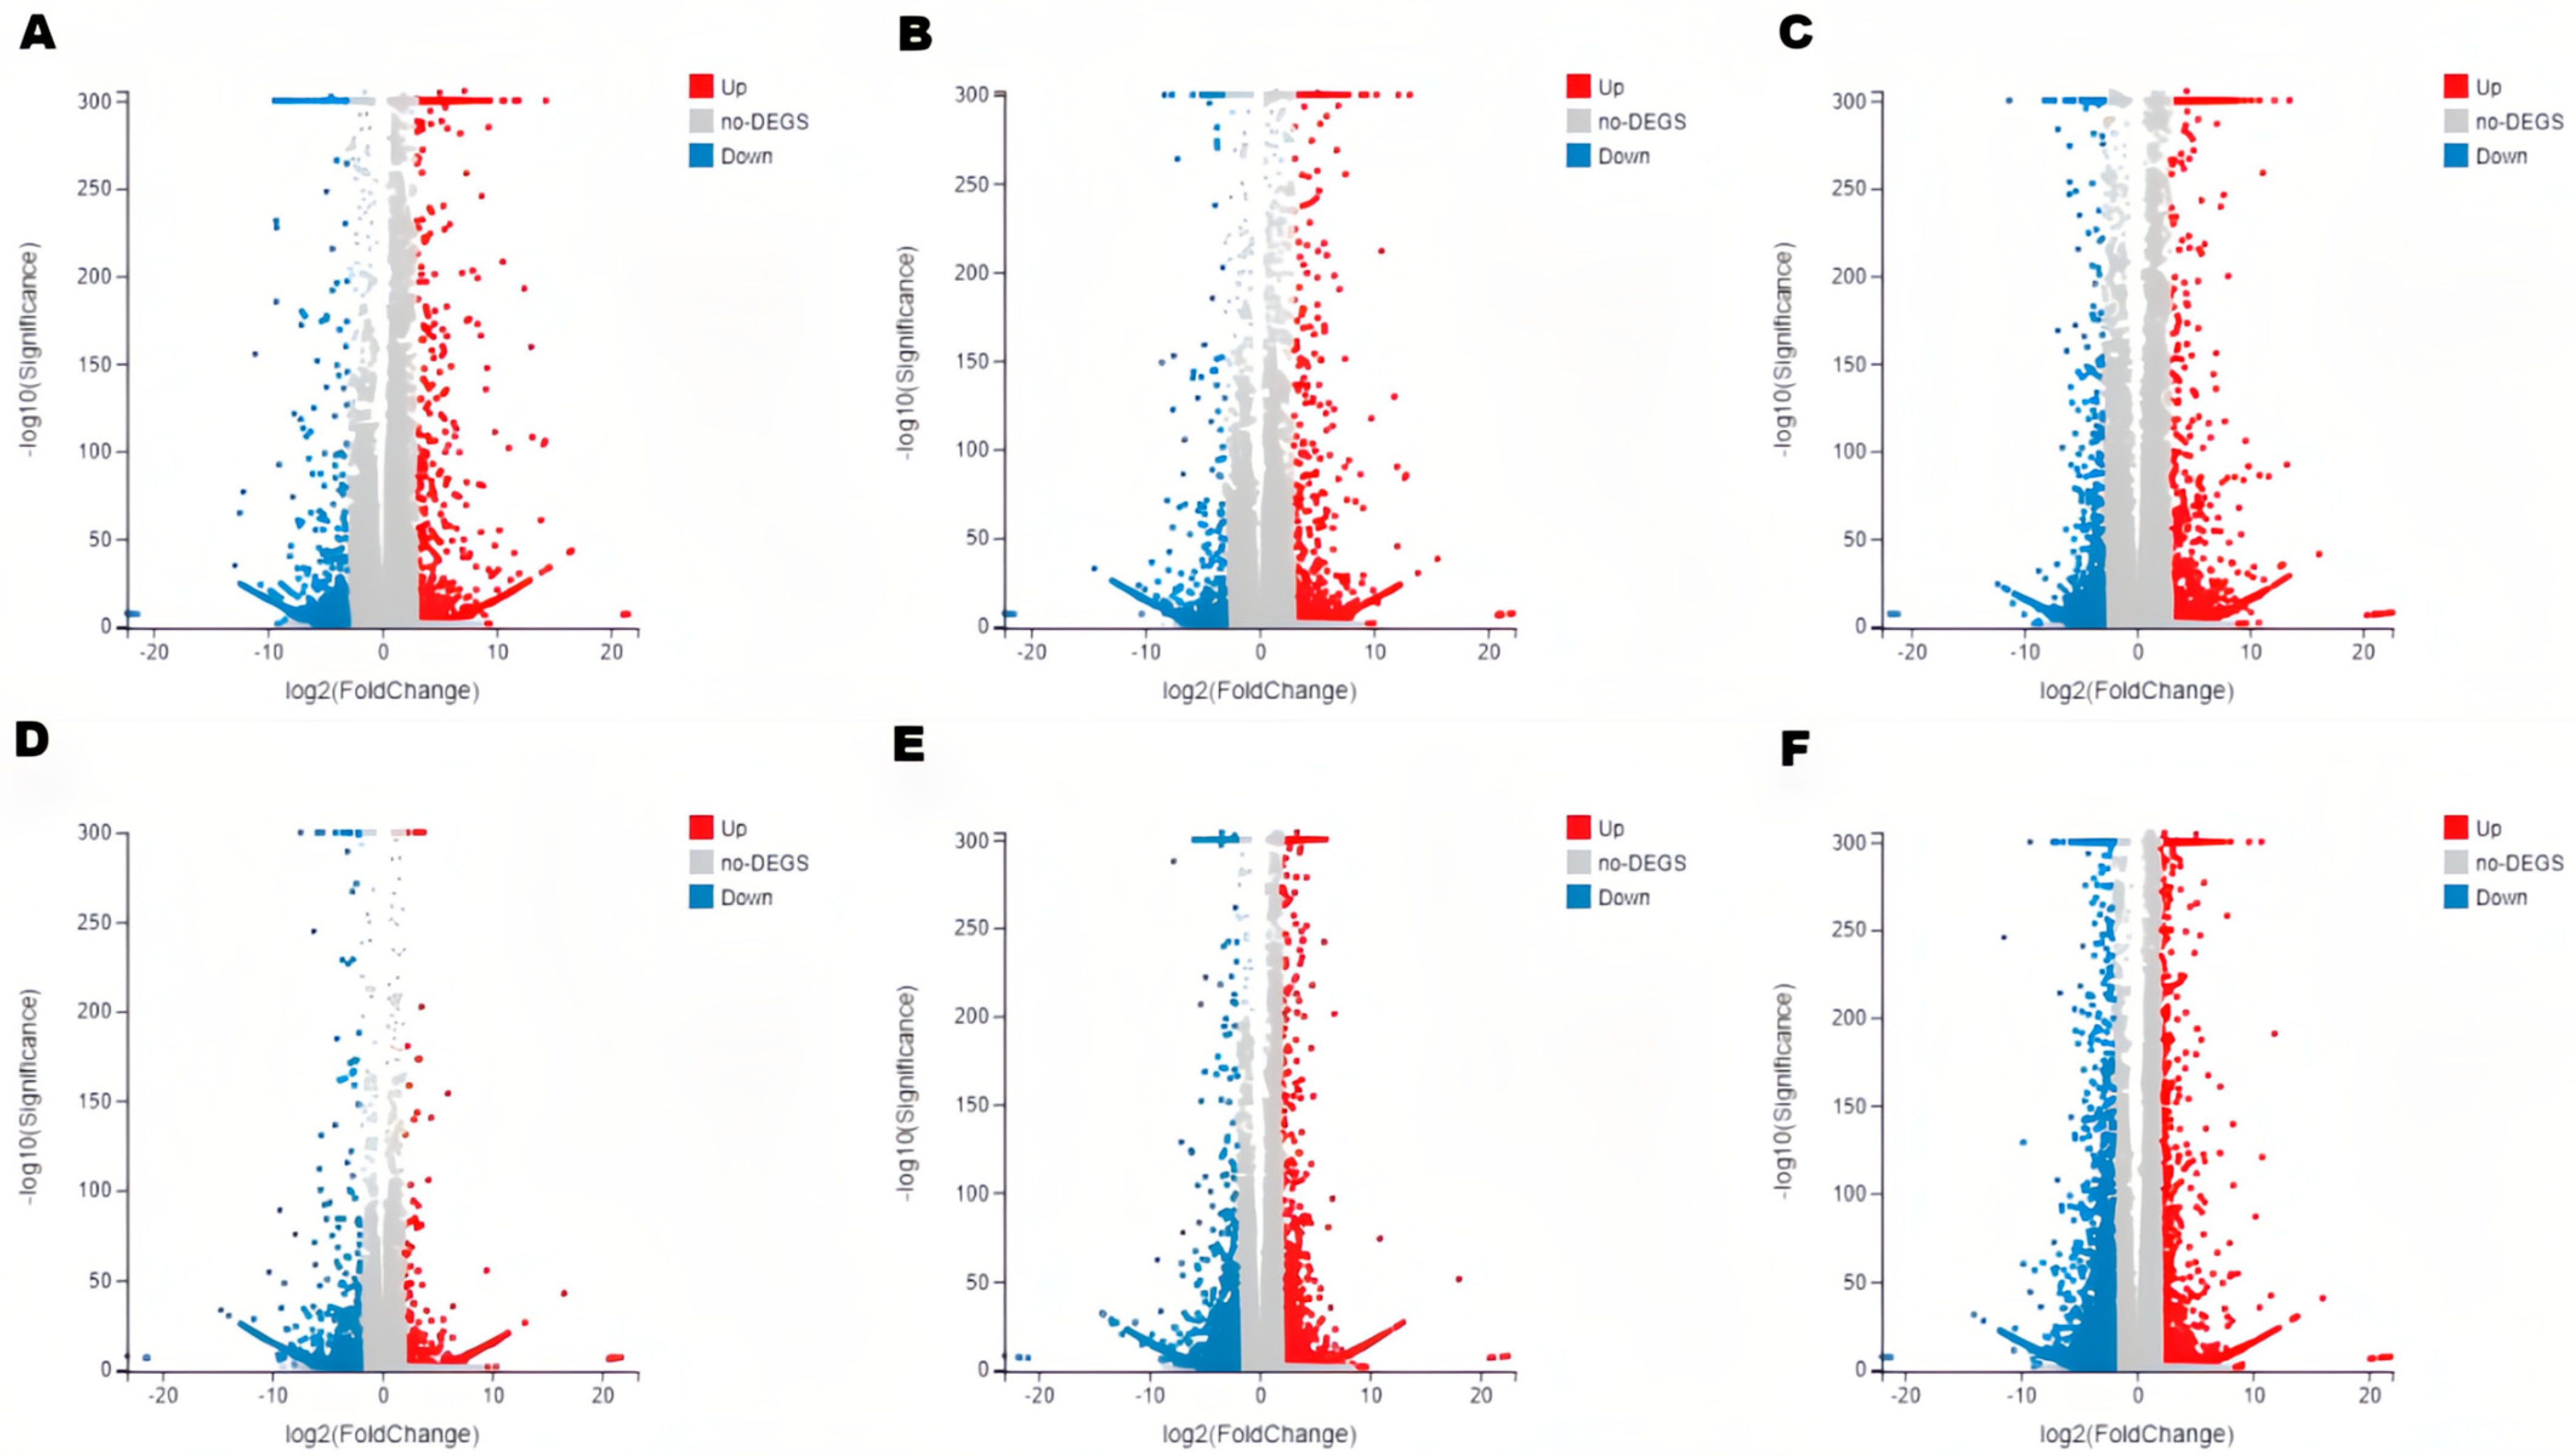
3.3. Transcriptome Sequencing and Analysis of DEGs
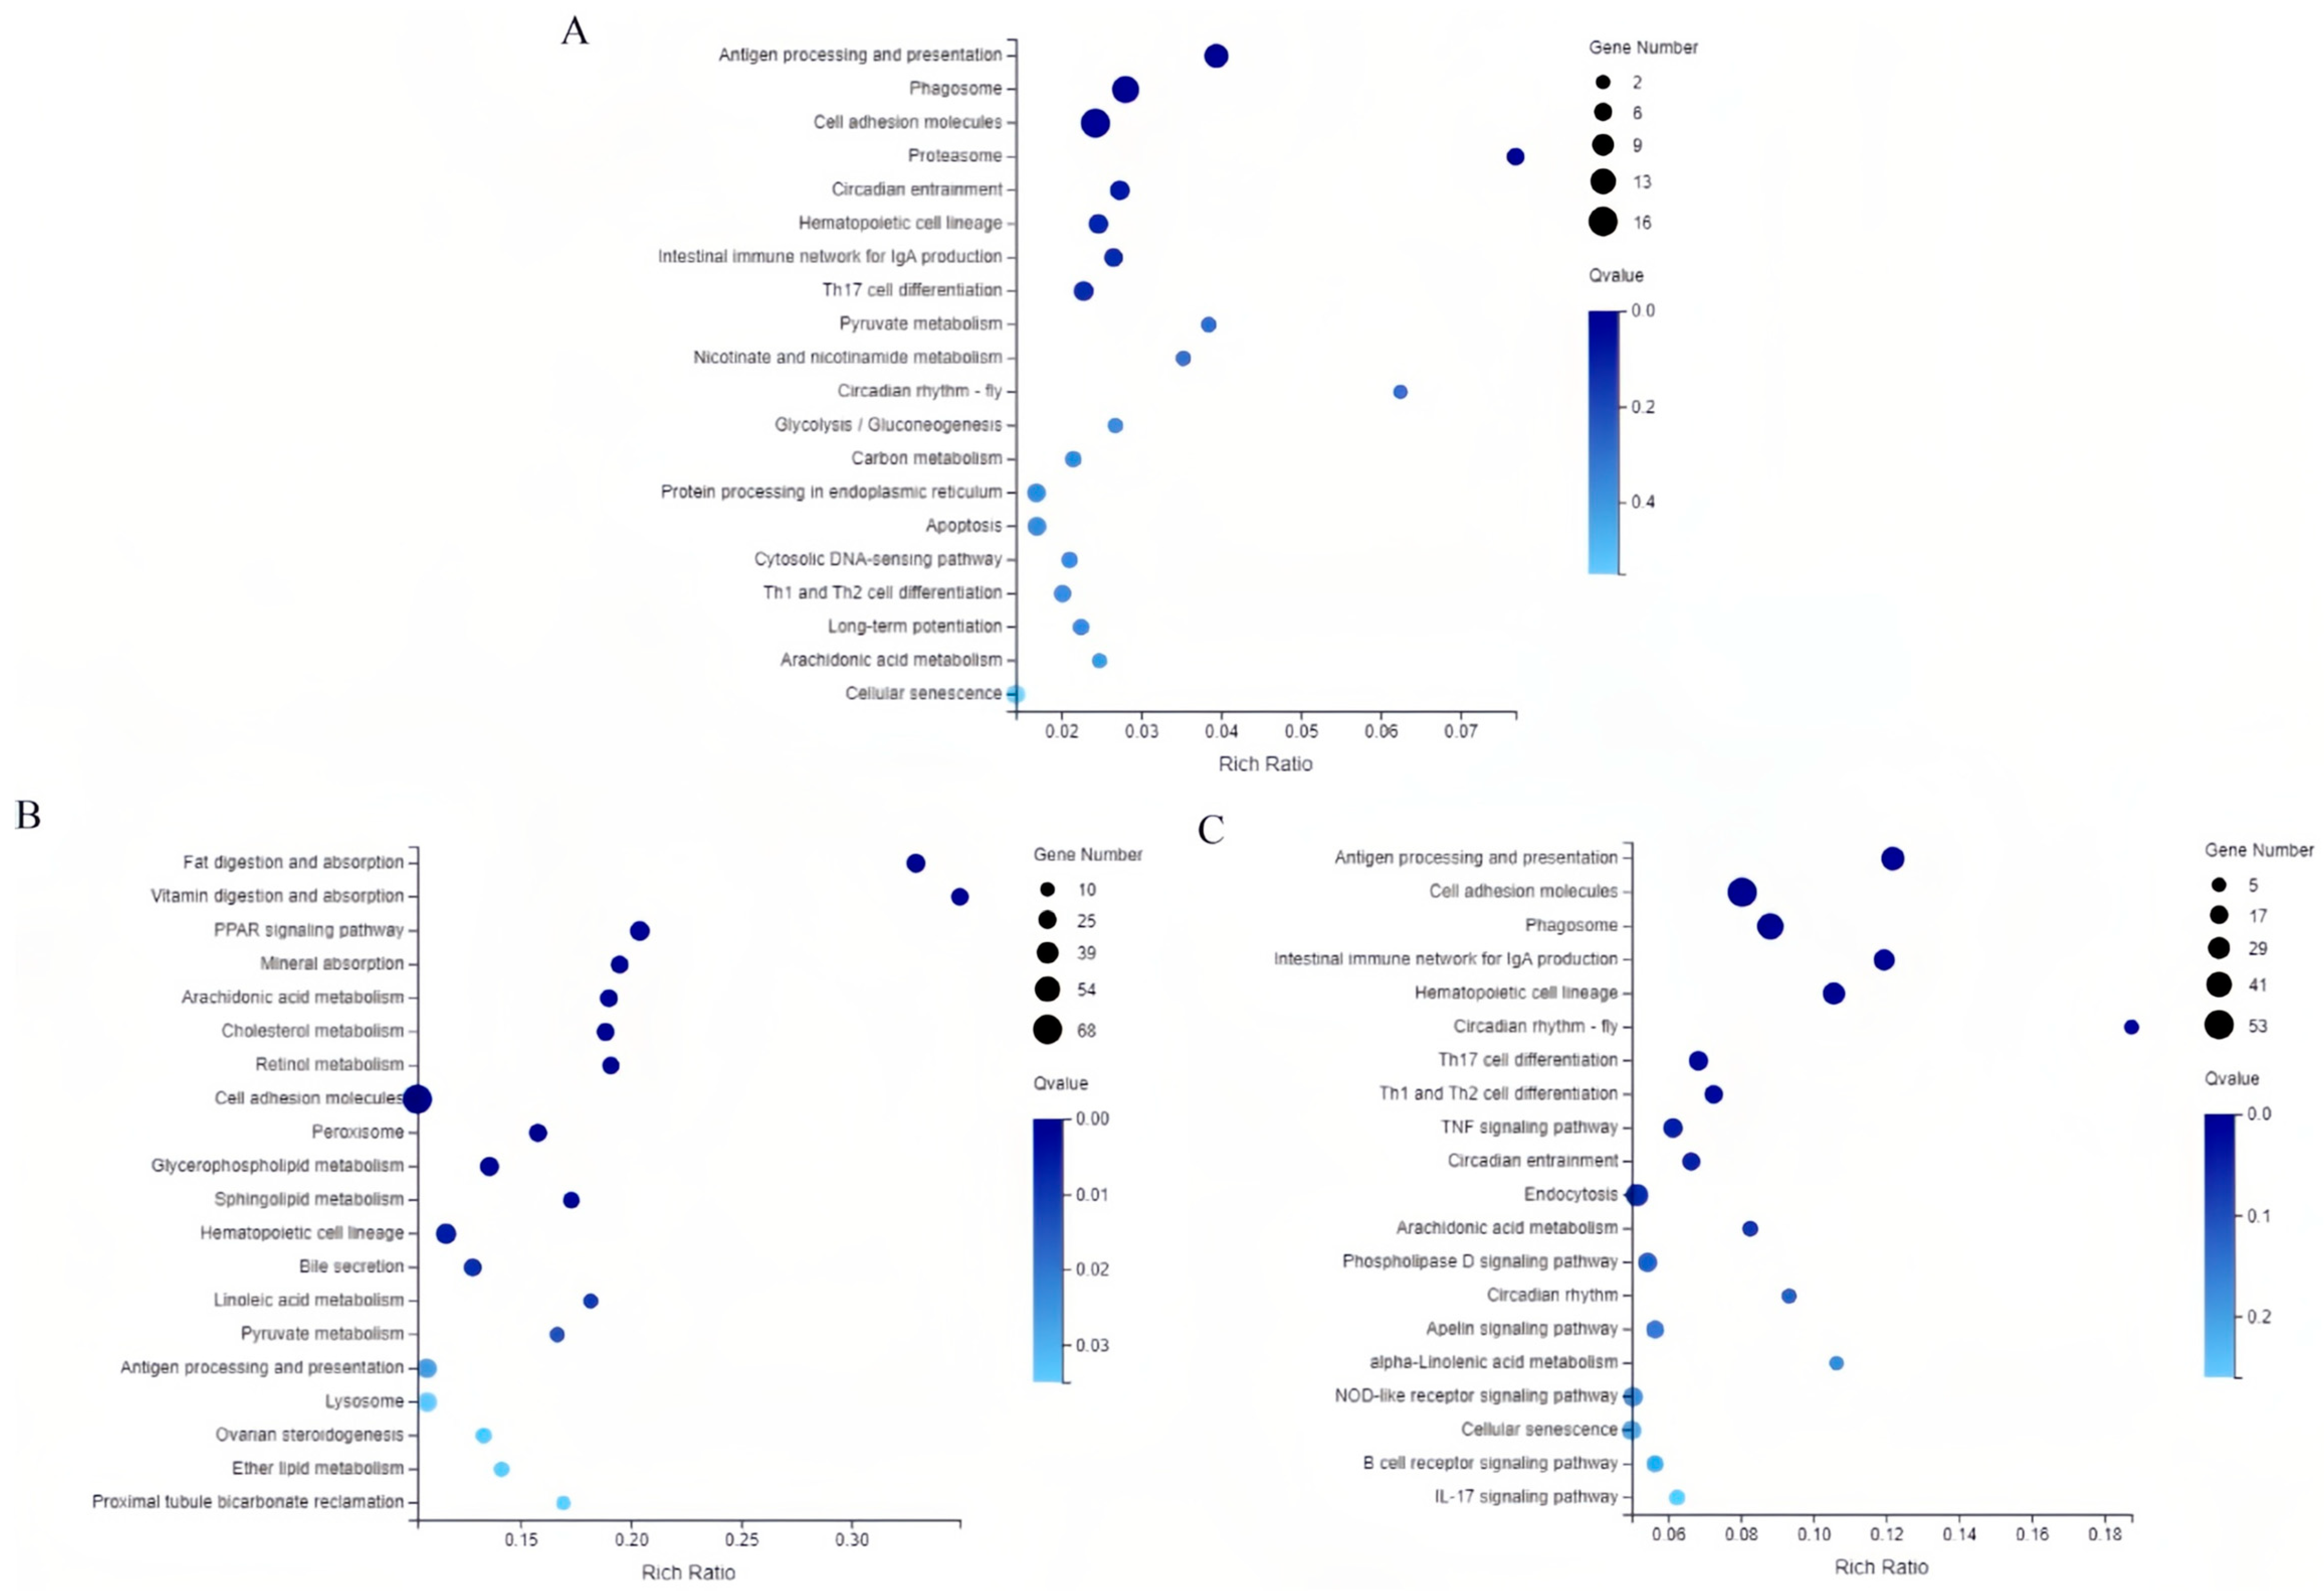
3.4. KEGG Pathways Enrichment Analysis of DEGs
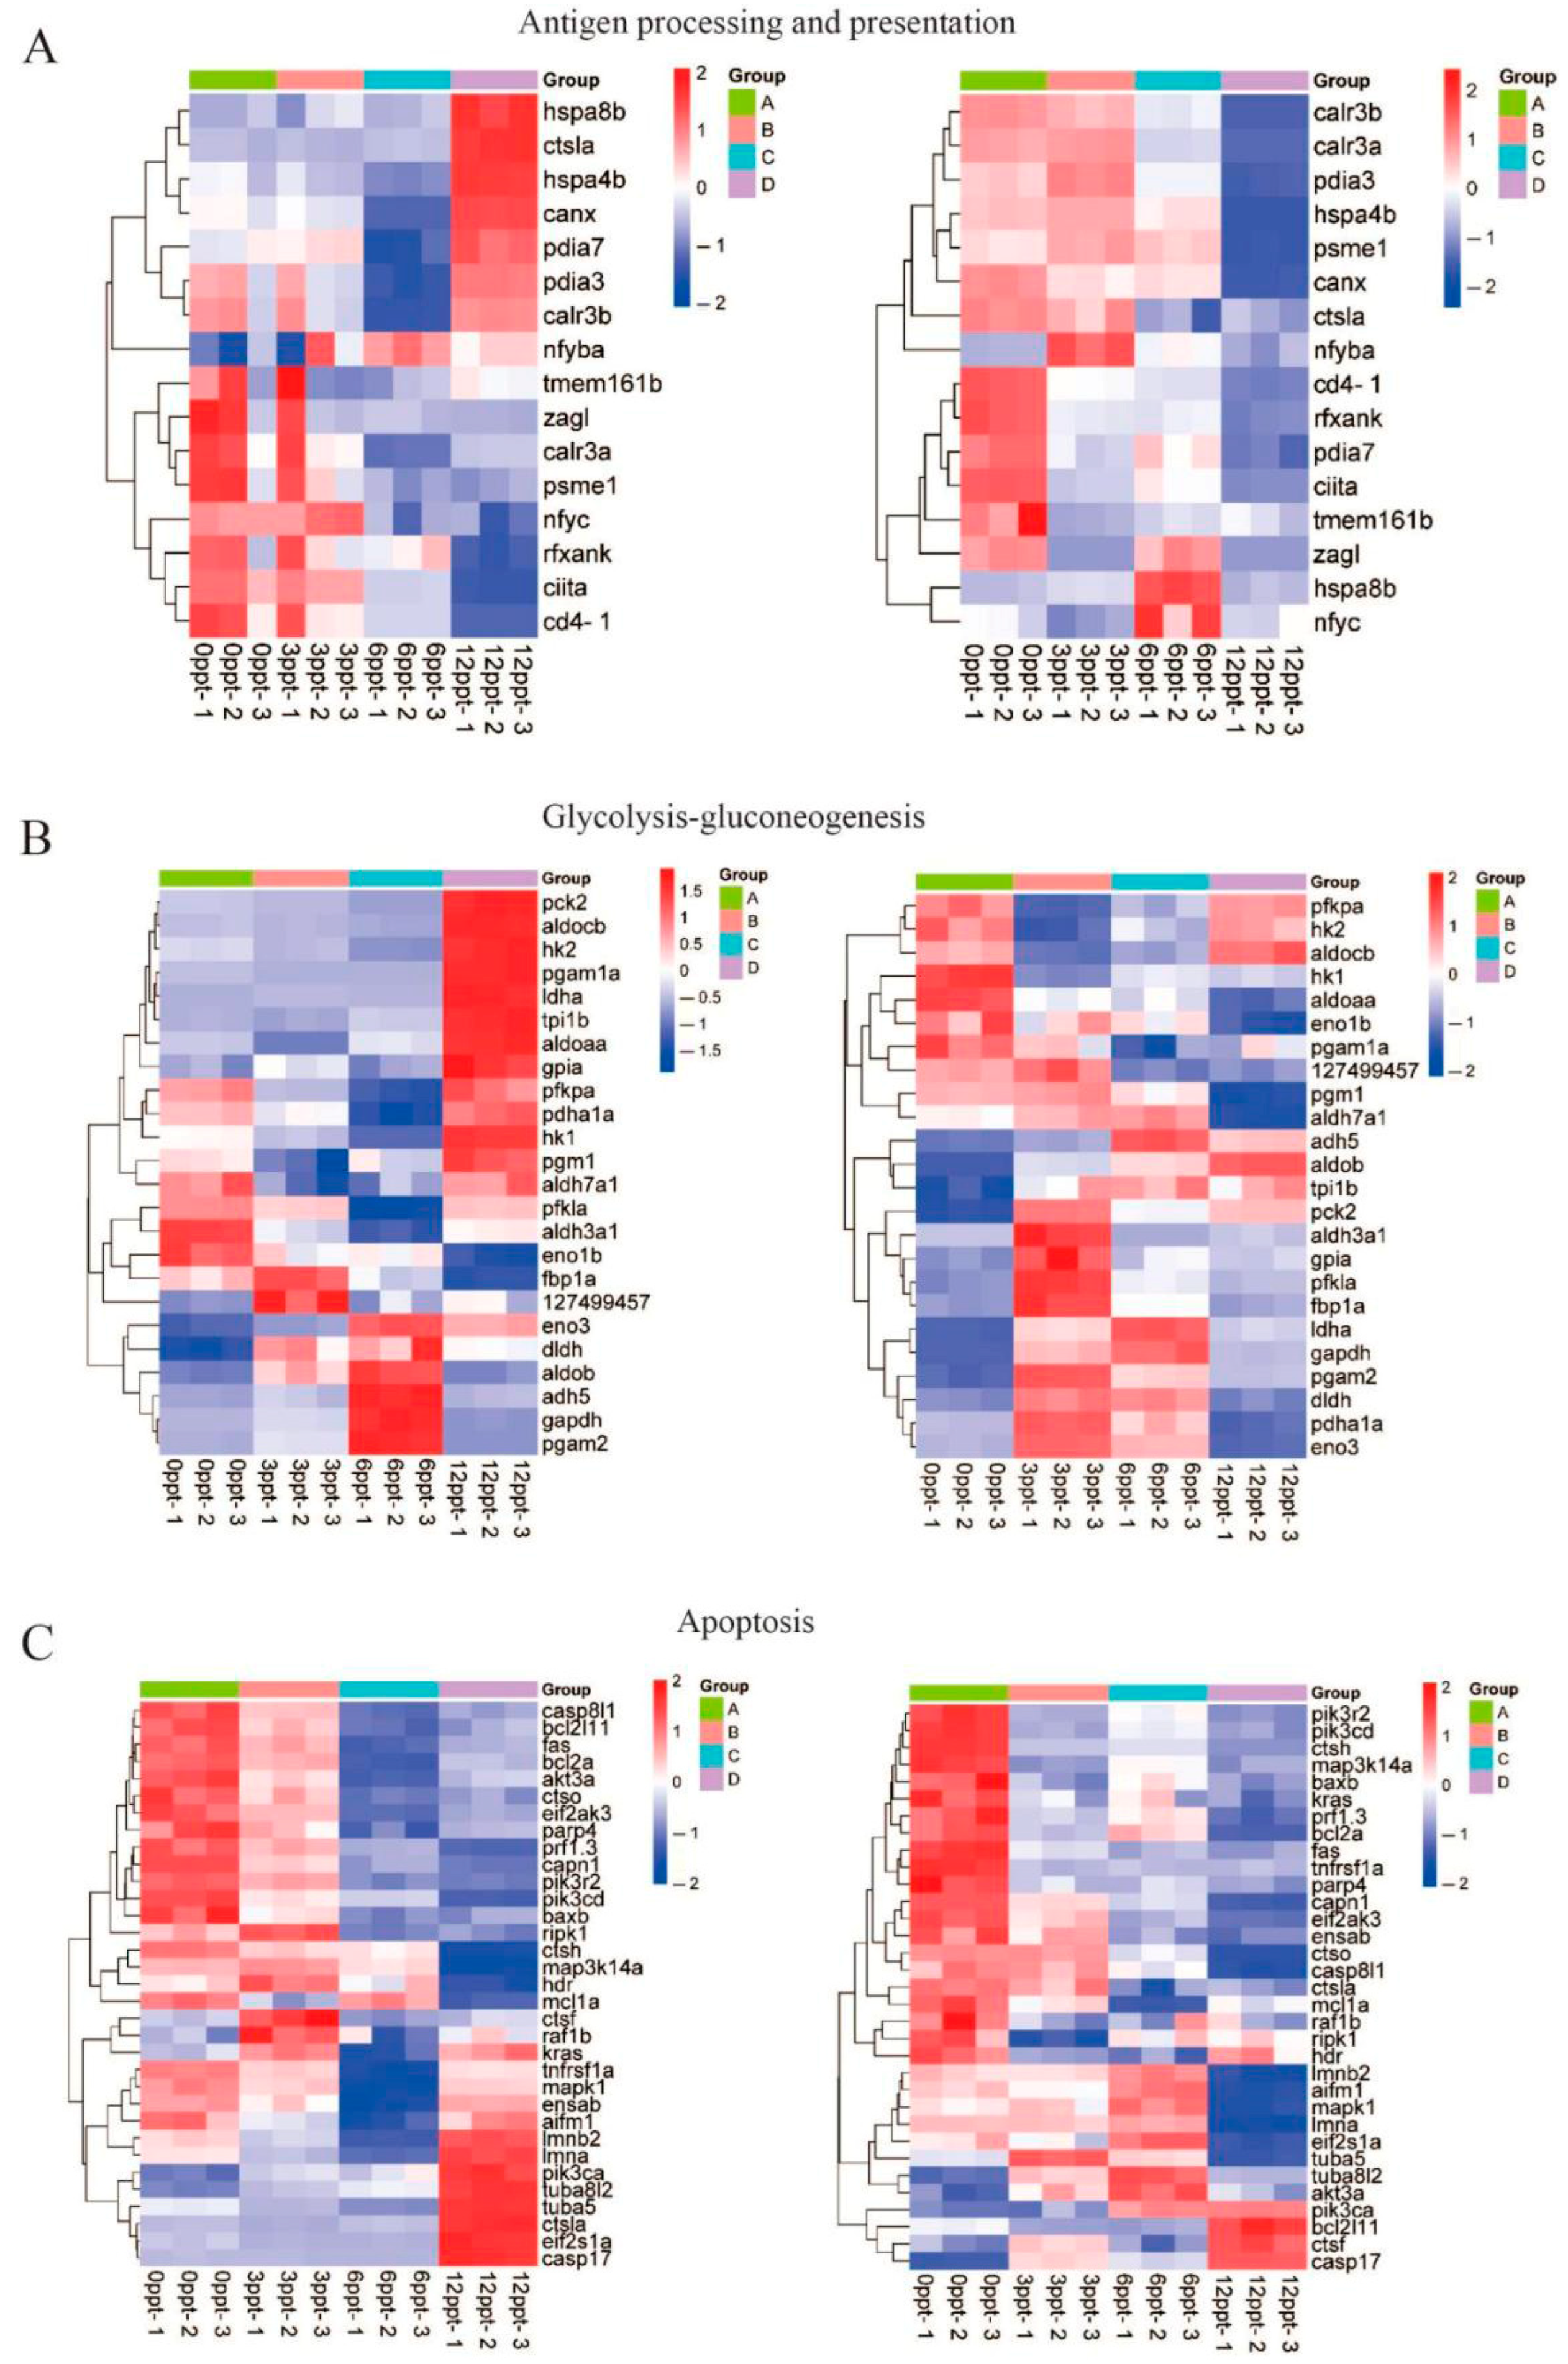
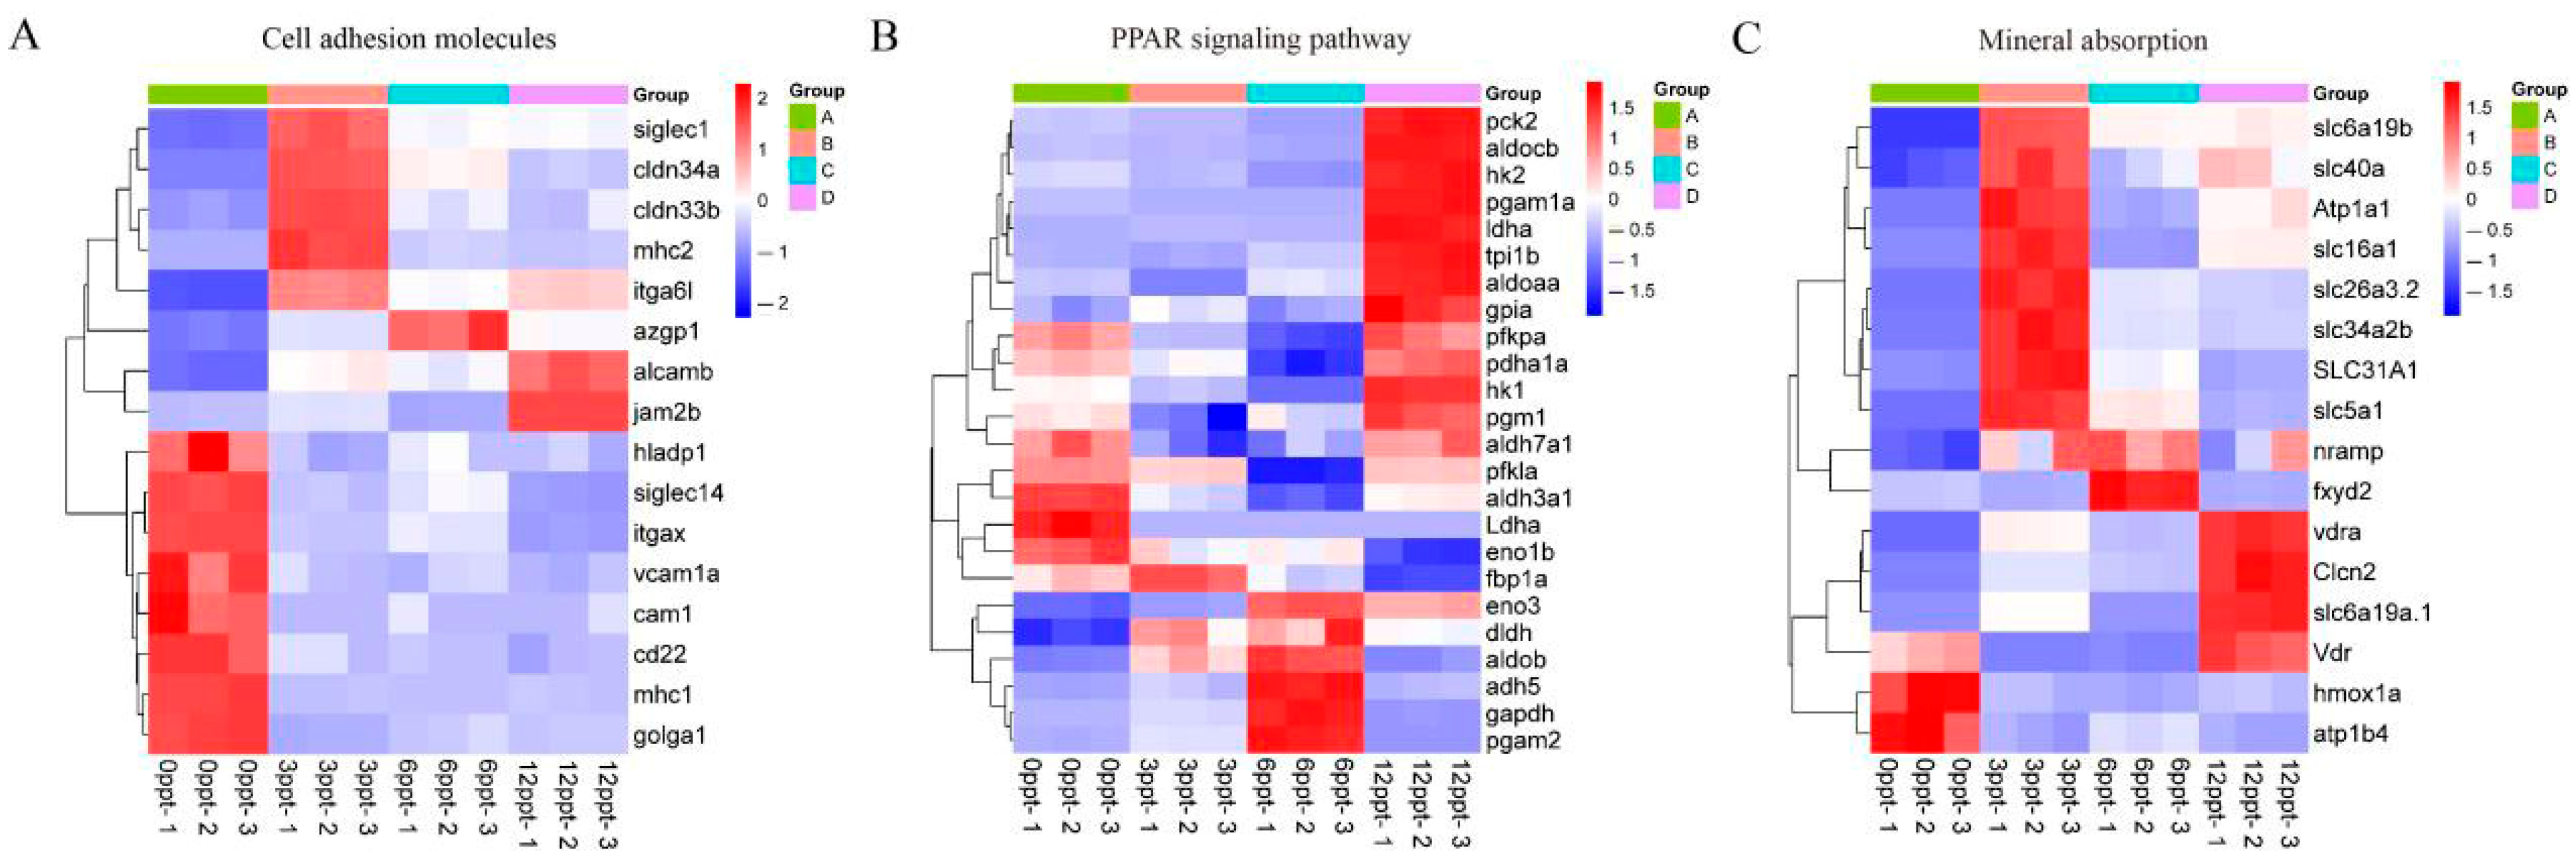
3.5. Salinity Stress Involves Immune and Metabolic Pathways
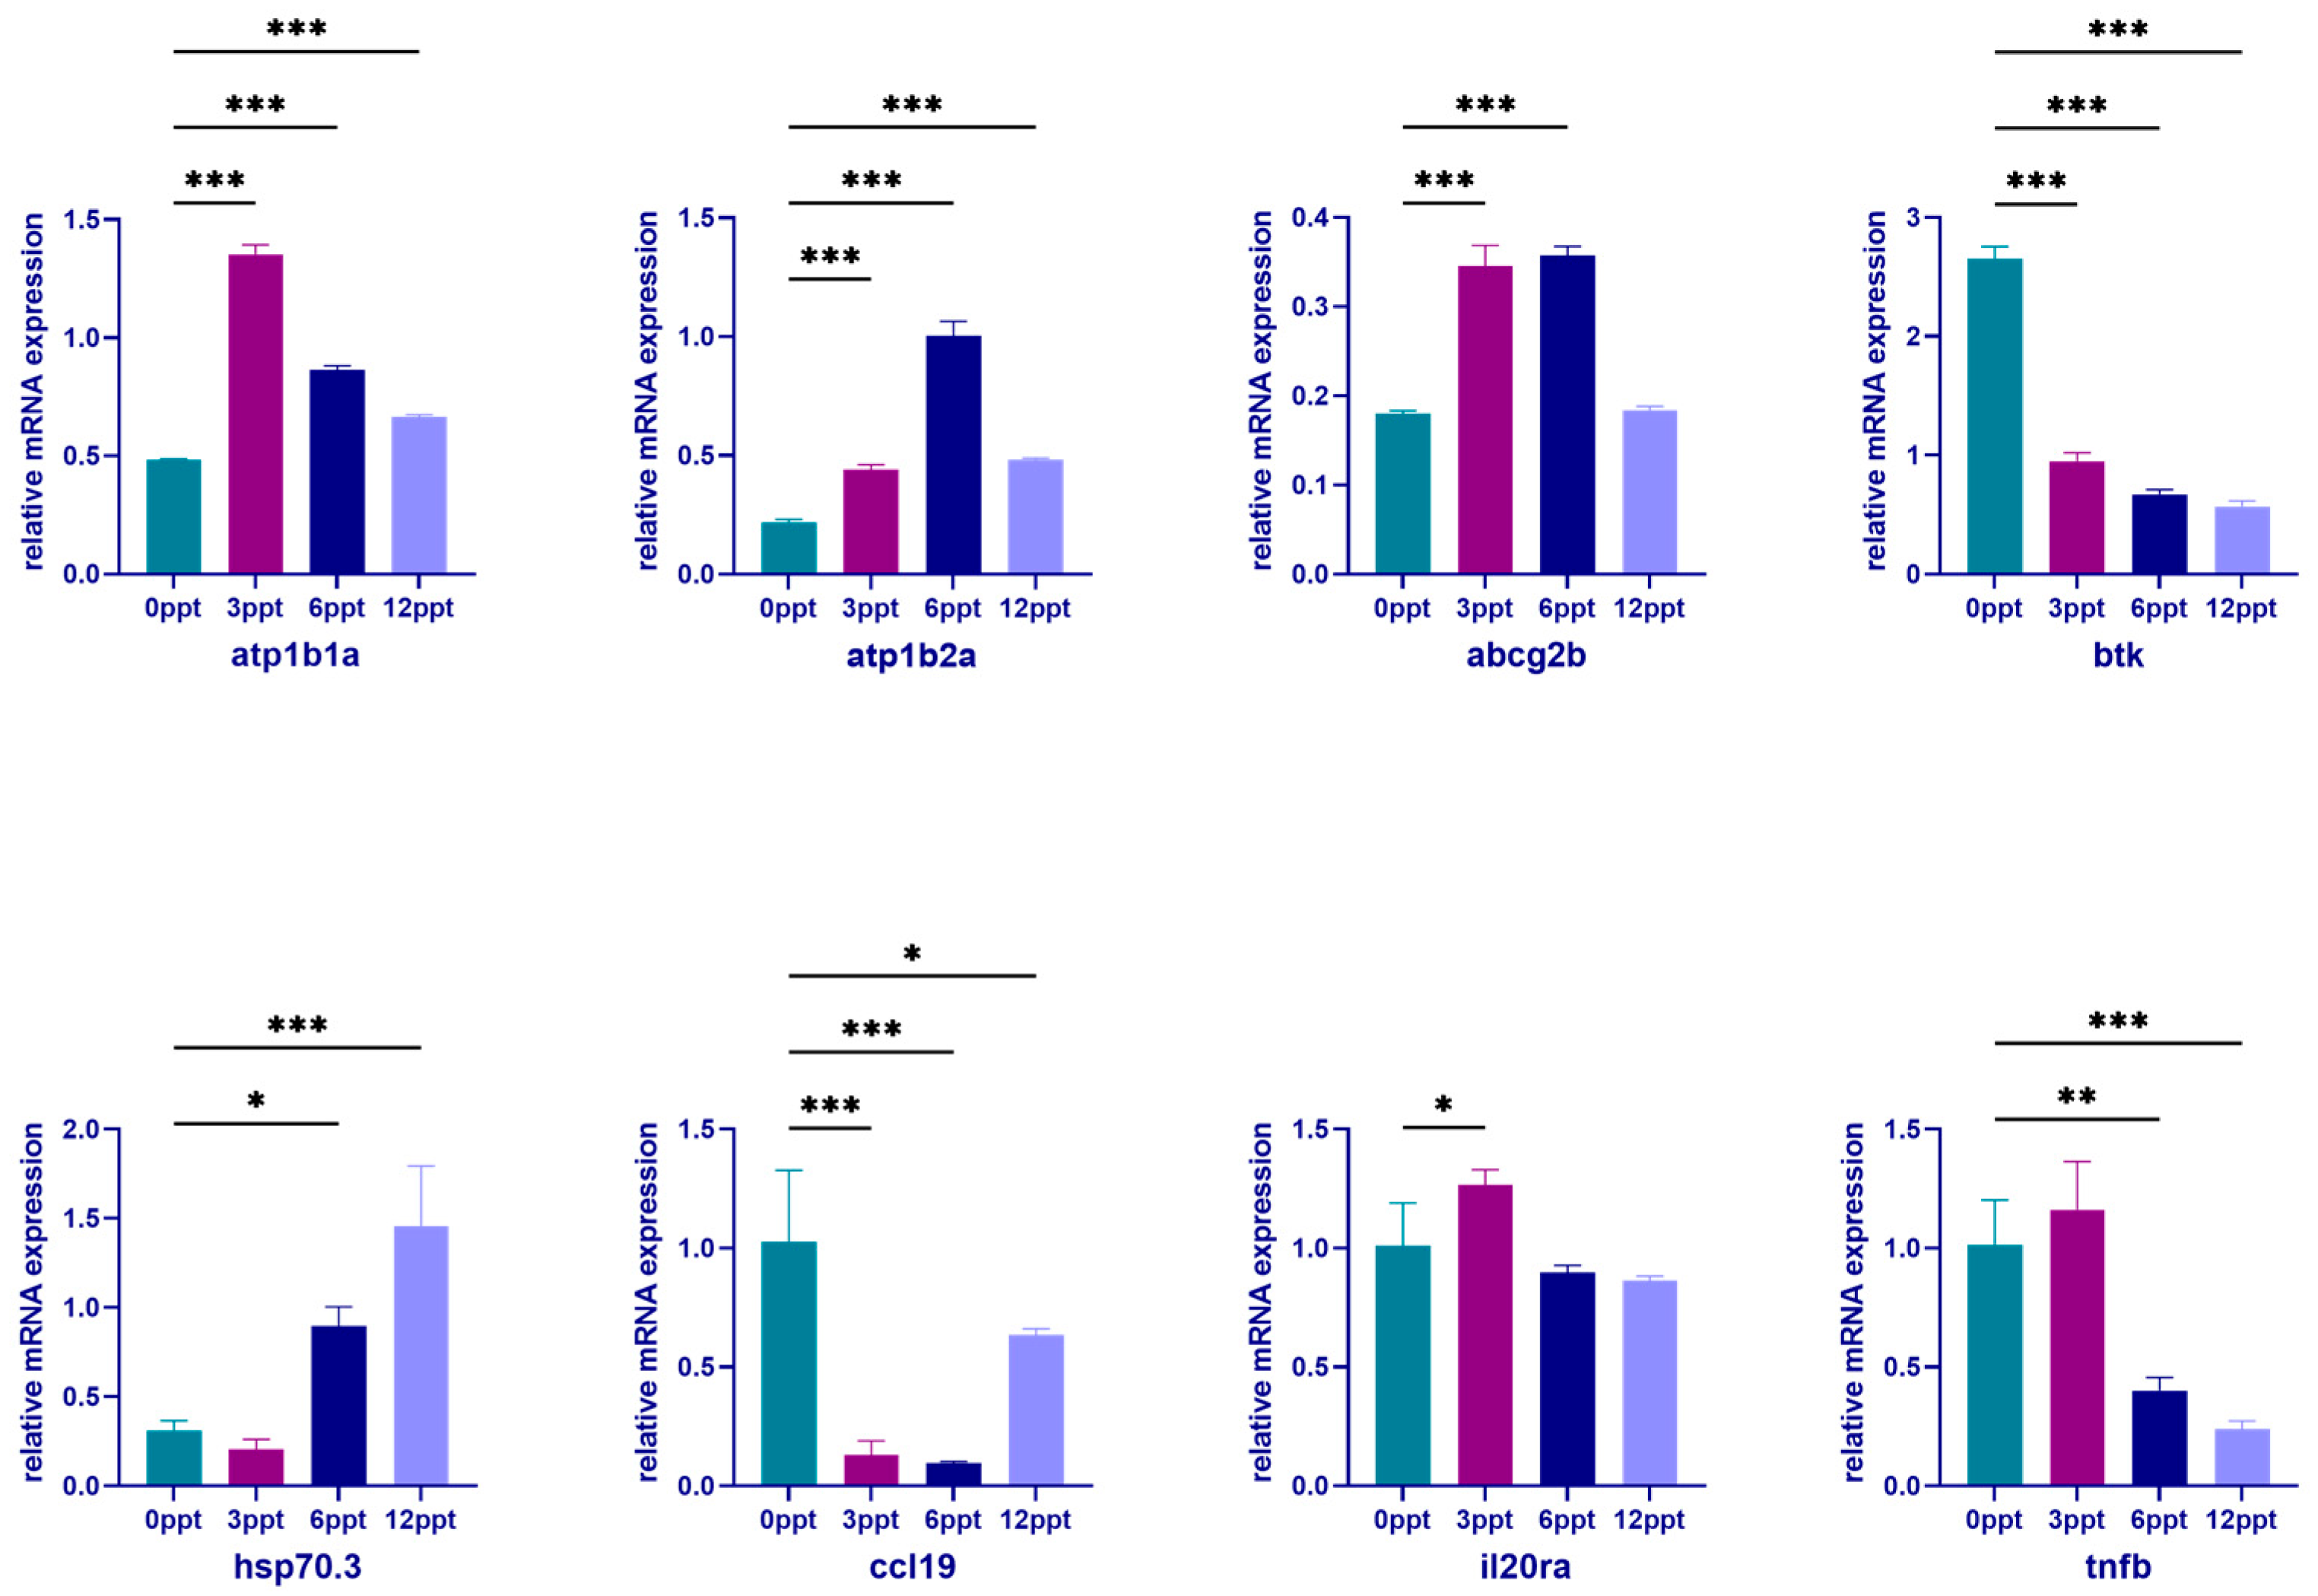
3.6. Validation of the Reliability of Transcriptome Data by qPCR
4. Discussion
5. Conclusions
Author Contributions
Funding
Institutional Review Board Statement
Informed Consent Statement
Data Availability Statement
Conflicts of Interest
Appendix A
| Time (h) | Salinity (ppt) | Cumulative Death | Cumulative Mortality % | 50% Lethal Salinity (95% Confidence Interval) |
|---|---|---|---|---|
| 24 | 3 | 0 | 0% | 16.92 (13.64–21.44) |
| 6 | 0 | 0% | ||
| 12 | 3 | 10% | ||
| 18 | 20 | 67% | ||
| 24 | 22 | 73% | ||
| 48 | 3 | 0 | 0% | 15.85 (13.92–17.94) |
| 6 | 0 | 0% | ||
| 12 | 4 | 13% | ||
| 18 | 22 | 73% | ||
| 24 | 25 | 83% | ||
| 72 | 3 | 0 | 0% | 15.43 (14.35–16.54) |
| 6 | 0 | 0% | ||
| 12 | 4 | 13% | ||
| 18 | 23 | 77% | ||
| 24 | 27 | 90% | ||
| 96 | 3 | 0 | 0% | 13.72 (13.28–15.16) |
| 6 | 0 | 0% | ||
| 12 | 8 | 27% | ||
| 18 | 27 | 90% | ||
| 24 | 27 | 90% |
| Target Gene | Primer Sequence | Size (bp) | Amplification Efficiency (%) | Accession No. |
|---|---|---|---|---|
| β-actin | F 1: CCAAAGCCAACAGGGAAAAG R 2: GCACAGTGTGGGTGACACCA | 156 | 99.7 | XM_051886219.1 |
| atp1b1a | F: GGCTTATCACACACCCCAC R: GCTCTCCAGTTCTCCACGA | 195 | 96.8 | XM_051897962.1 |
| atp1b2a | F: CAGTTGGGGTCTGATTCTGTTGT R: TTATAGGGTGCGAGGAAGTTGTC | 249 | 97.2 | XM_051880029.1 |
| abcg2b | F: AGAGTCTGGGTTATGAGTGC R: CTGGTAGAAAAACGAGGTGA | 236 | 98.7 | XM_051894188.1 |
| btk | F: CTCCTGACCGACTCTACCCTT R: CGATTCTTGGAACCTCTTTTG | 265 | 99.6 | XM_051860457.1 |
| hsp70.3 | F: AGATGAGGCAGTGGCTTATGGT R: GTGAAGGTCTGGGTCTGTTTGG | 102 | 99.6 | XM_051886299.1 |
| ccl19 | F: AAGCGGACTTAGCATTGGAC R: ATAACAGCATCACGGGGACA | 118 | 98.5 | XM_051892863.1 |
| il-20ra | F: AGCCCGTACAGGACACAAG R: GACCCAACAAGCCCATCAG | 157 | 98.7 | XM_051876329.1 |
| tnf-b | F: CGGCGTAGGGGGAGTTTATC R: TTTCCGTGCTCTGGTGGTGT | 210 | 99.6 | XM_051862354.1 |
| ptgs2b | F: CAGATAGCTGGAAGGGTGGC R: AAAGCGTTTCCTGTAGGCGT | 126 | 99.7 | XM_051874699.1 |
| safb | F: GTGACAACAGGGACTGGGAG R: ATGTATCCACCTCGGCTTGC | 127 | 99.3 | XM_051908317.1 |
| ciita | F: GTCAGCTGCTGTCCAGTCAT R: AGCTGCTCTTCAGCTTCACC | 176 | 99.2 | XM_051888588.1 |
| gpt | F: CGCCAACGTGAAGAAGGTTG R: ACACAGTGCCATCACCTGTC | 187 | 97.1 | XM_051914358.1 |
| mhc-i | F: AACCTGTCAAGCCCTCTGAT R: AGTTCTCACAGTCACGTTGTG | 133 | 96.9 | XM_051873036.1 |
| cd-22 | F: GCACTGAAAGTCGAAGTGCC R: TGACAGTGACTGCAGGTGTC | 163 | 98.3 | XM_051865084.1 |
| il-8 | F: ACAACCCTCAATGCATTCCCA R: CTCGGTTTTGCGACAGTGTG | 144 | 98.9 | XM_051892690.1 |
References
- Hopmans, J.W.; Qureshi, A.S.; Kisekka, I.; Munns, R.; Grattan, S.R.; Rengasamy, P.; Ben-Gal, A.; Assouline, S.; Javaux, M.; Minhas, P.S.; et al. Chapter One—Critical knowledge gaps and research priorities in global soil salinity. In Advances in Agronomy; Academic Press: Cambridge, UK, 2021; Volume 169, pp. 1–191. [Google Scholar]
- Mukhopadhyay, R.; Sarkar, B.; Jat, H.S.; Sharma, P.C.; Bolan, N.S. Soil salinity under climate change: Challenges for sustainable agriculture and food security. J. Environ. Manag. 2021, 280, 111736. [Google Scholar] [CrossRef]
- Zhang, X.; Wen, H.; Wang, H.; Ren, Y.; Zhao, J.; Li, Y. RNA-Seq analysis of salinity stress-responsive transcriptome in the liver of spotted sea bass (Lateolabrax maculatus). PLoS ONE 2017, 12, e0173238. [Google Scholar] [CrossRef]
- Su, H.; Li, Y.; Ma, D.; Fan, J.; Zhong, Z.; Zhu, H. Metabolism responses in the intestine of Oreochromis mossambicus exposed to salinity, alkalinity and salt-alkalinity stress using LC-MS/MS-based metabolomics. Comp. Biochem. Physiol. Part D Genom. Proteom. 2023, 45, 101044. [Google Scholar] [CrossRef]
- Sun, S.; Gong, C.; Deng, C.; Yu, H.; Zheng, D.; Wang, L.; Sun, J.; Song, F.; Luo, J. Effects of salinity stress on the growth performance, health status, and intestinal microbiota of juvenile Micropterus salmoides. Aquaculture 2023, 576, 739888. [Google Scholar] [CrossRef]
- Scott, G.R.; Schulte, P.M.; Wood, C.M. Plasticity of osmoregulatory function in the killifish intestine: Drinking rates, salt and water transport, and gene expression after freshwater transfer. J. Exp. Biol. 2006, 209, 4040–4050. [Google Scholar] [CrossRef] [PubMed]
- Ding, L.; Liu, Y.; Wei, X.; Geng, C.; Liu, W.; Han, L.; Yuan, F.; Wang, P.; Sun, Y. Effects of Saline-Alkaline Stress on Metabolome, Biochemical Parameters, and Histopathology in the Kidney of Crucian Carp (Carassius auratus). Metabolites 2023, 13, 159. [Google Scholar] [CrossRef] [PubMed]
- Yang, J.; Liu, M.; Zhou, T.; Li, Q.; Lin, Z. Genome-wide methylome and transcriptome dynamics provide insights into epigenetic regulation of kidney functioning of large yellow croaker (Larimichthys crocea) during low-salinity adaption. Aquaculture 2023, 571, 739410. [Google Scholar] [CrossRef]
- Harshini, V.; Shukla, N.; Raval, I.; Kumar, S.; Shrivastava, V.; Patel, A.K.; Joshi, C.G. Kidney transcriptome response to salinity adaptation in Labeo rohita. Front. Physiol. 2022, 13, 991366. [Google Scholar] [CrossRef]
- Livak, K.J.; Schmittgen, T.D. Analysis of relative gene expression data using real-time quantitative PCR and the e 2−∆∆CT Method. Methods 2001, 25, 402–408. [Google Scholar] [CrossRef]
- Iheanacho, S.C.; Odo, G.E. Neurotoxicity, oxidative stress biomarkers and haematological responses in African catfish (Clarias gariepinus) exposed to polyvinyl chloride microparticles. Comp. Biochem. Phys. C Toxicol. Pharmacol. 2020, 232, 108741. [Google Scholar] [CrossRef]
- Okomoda, V.T.; Isah, S.; Solomon, S.G.; Ikhwanuddin, M. Salinity tolerance in Clarias gariepinus (Burchell, 1822): Insight on blood parameter variations and gill histological changes. Fish Physiol. Biochem. 2024, 50, 605–616. [Google Scholar] [CrossRef] [PubMed]
- Okomoda, V.T.; Ataguba, G.A.; Ayuba, V.O. Hematological Response of Clarias gariepinus Fingerlings Exposed to Acute Concentrations of Sunsate®. J. Stress Physiol. Biochem. 2013, 9, 271–278. [Google Scholar]
- Okomoda, V.T. Haematology and gonad histology of Oreochromis niloticus (Linnaeus, 1758) fed Carica papaya seed meal. Braz. J. Aquat. Sci. Technol. 2017, 21, 8–15. [Google Scholar] [CrossRef][Green Version]
- Okomoda, V.T.; Koh, I.C.C.; Hassan, A.; Amornsakun, T.; Shahreza, M.S. Hematological parameters of pure and reciprocal crosses of Pangasianodon hypophthalmus (Sauvage, 1878) and Clarias gariepinus (Burchell, 1822). Comp. Clin. Pathol. 2018, 27, 549–554. [Google Scholar] [CrossRef]
- Sarma, K.; Prabakaran, K.; Krishnan, P.; Grinson, G.; Anand Kumar, A. Response of a freshwater air-breathing fish, Clarias batrachus to salinity stress: An experimental case for their farming in brackishwater areas in Andaman, India. Aquac. Int. 2013, 21, 183–196. [Google Scholar] [CrossRef]
- Laiz-Carrión, R.; Sangiao-Alvarellos, S.; Guzmán, J.M.; Río, M.P.M.D.; Míguez, J.M.; Soengas, J.L.; Mancera, J.M. Energy Metabolism in Fish Tissues Related to Osmoregulation and Cortisol Action. Fish Physiol. Biochem. 2002, 27, 179–188. [Google Scholar] [CrossRef]
- Wendelaar Bonga, S.E. The stress response in fish. Physiol. Rev. 1997, 77, 591–625. [Google Scholar] [CrossRef]
- Boeuf, G.; Payan, P. How should salinity influence fish growth? Comp. Biochem. Physiol. Part C Toxicol. Pharmacol. 2001, 130, 411–423. [Google Scholar] [CrossRef] [PubMed]
- Eckert, S.M.; Yada, T.; Shepherd, B.S.; Stetson, M.H.; Hirano, T.; Grau, E.G. Hormonal control of osmoregulation in the channel catfish Ictalurus punctatus. Gen. Comp. Endocrinol. 2001, 122, 270–286. [Google Scholar] [CrossRef]
- Varsamos, S.; Nebel, C.; Charmantier, G. Ontogeny of osmoregulation in postembryonic fish: A review. Comp. Biochem. Physiol. Part A Mol. Integr. Physiol. 2005, 141, 401–429. [Google Scholar] [CrossRef] [PubMed]
- Árnason, T.; Magnadóttir, B.; Björnsson, B.; Steinarsson, A.; Björnsson, B.T. Effects of salinity and temperature on growth, plasma ions, cortisol and immune parameters of juvenile Atlantic cod (Gadus morhua). Aquaculture 2013, 380–383, 70–79. [Google Scholar] [CrossRef]
- Stewart, H.A.; Noakes, D.L.G.; Cogliati, K.M.; Peterson, J.T.; Schreck, C.B. Salinity Effects on Plasma Ion Levels, Cortisol, and Osmolality in Chinook salmon Following Lethal Sampling. Comparative biochemistry and physiology. Comp. Biochem. Physiol. Part A Mol. Integr. Physiol. 2015, 192, 38–43. [Google Scholar] [CrossRef]
- Dosdat, A.; Métailler, R.; Desbruyères, E.; Huelvan, C. Comparison of brown trout (Salmo trutta) reared in fresh water and sea water to freshwater rainbow trout (Oncorhynchus mykiss): II. Phosphorus balance. Aquat. Living Resour. 1998, 11, 21–28. [Google Scholar] [CrossRef]
- Tsuzuki, M.Y.; Ogawa, K.; Strüssmann, C.A.; Maita, M.; Takashima, F. Physiological responses during stress and subsequent recovery at different salinities in adult pejerrey Odontesthes bonariensis. Aquaculture 2001, 200, 349–362. [Google Scholar] [CrossRef]
- Evans, T.G.; Kultz, D. The cellular stress response in fish exposed to salinity fluctuations. J. Exp. Zool. Part A Ecol. Integr. Physiol. 2020, 333, 421–435. [Google Scholar] [CrossRef]
- Wang, X.; Wang, S.; Li, C.; Chen, K.; Qin, J.G.; Chen, L.; Li, E. Molecular Pathway and Gene Responses of the Pacific White Shrimp Litopenaeus vannamei to Acute Low Salinity Stress. J. Shellfish Res. 2016, 34, 1037–1048. [Google Scholar] [CrossRef]
- Escobar-Sierra, C.; Lampert, K.P. Field application of de novo transcriptomic analysis to evaluate the effects of sublethal freshwater salinization on Gasterosteus aculeatus in urban streams. PLoS ONE 2024, 19, 24. [Google Scholar] [CrossRef] [PubMed]
- Peng, Y.; Shi, H.; Liu, Y.; Huang, Y.; Zheng, R.; Jiang, D.; Jiang, M.; Zhu, C.; Li, G. RNA Sequencing Analysis Reveals Divergent Adaptive Response to Hypo- and Hyper-Salinity in Greater Amberjack (Seriola dumerili) Juveniles. Animals 2022, 12, 327. [Google Scholar] [CrossRef]
- Chen, J.; Cai, B.; Tian, C.; Jiang, D.; Shi, H.; Huang, Y.; Zhu, C.; Li, G.; Deng, S. RNA Sequencing (RNA-Seq) Analysis Reveals Liver Lipid Metabolism Divergent Adaptive Response to Low- and High-Salinity Stress in Spotted Scat (Scatophagus argus). Animals 2023, 13, 1503. [Google Scholar] [CrossRef] [PubMed]
- Lee, H.; Yeo, H.; Park, J.; Kang, K.; Yi, S.; Kim, K. Adaptation responses to salt stress in the gut of Poecilia reticulata. Anim. Cells Syst. 2025, 29, 84–99. [Google Scholar] [CrossRef]
- Abd El Moneim, D.; Mansour, H.; Alshegaihi, R.M.; Safhi, F.A.; Alwutayd, K.M.; Alshamrani, R.; Alamri, A.; Felembam, W.; Abuzaid, A.O.; Magdy, M. Evolutionary insights and expression dynamics of the CaNFYB transcription factor gene family in pepper (Capsicum annuum) under salinity stress. Front. Genet. 2023, 14, 1288453. [Google Scholar] [CrossRef] [PubMed]
- de Magalhes, C.R.; Sandoval, K.; Kagan, F.; Mccormack, G.; Schrama, D.; Carrilho, R.; Farinha, A.P.; Cerqueira, M.; Rodrigues, P.M. Transcriptomic changes behind Sparus aurata hepatic response to different aquaculture challenges: An RNA-seq study and multiomics integration. PLoS ONE 2024, 19, 24. [Google Scholar]
- Qin, H.; Yu, Z.; Zhu, Z.; Lin, Y.; Xia, J.; Jia, Y. The integrated analyses of metabolomics and transcriptomics in gill of GIFT tilapia in response to long term salinity challenge. Aquac. Fish. 2022, 7, 131–139. [Google Scholar] [CrossRef]
- Ru, X.; Huang, Y.; Zhou, T.; Yang, T.; Chen, P.; Yang, J.; Zhu, C.; Shi, H.; Bailey, C. Brain Transcriptome Profiles of Greater Amberjack (Seriola dumerili) Juveniles Under Long-Term Hypo- and Hypersaline Stress. Aquac. Res. 2025, 2025, 19. [Google Scholar] [CrossRef]
- Dong, Z.; Chen, Y.; Li, H.; Huan, Z.; Li, X.; Zhang, N.; Guo, Y.; Shao, C.; Wang, Z. Liver comparative transcriptome analysis reveals the mechanism of the Hainan medaka, Oryzias curvinotus, to adapt to salinity. J. World Aquac. Soc. 2023, 54, 749–763. [Google Scholar] [CrossRef]
- Harshini, V.; Shukla, N.; Raval, I.; Kumar, S.; Shrivastava, V.; Chaudhari, A.; Patel, A.K.; Joshi, C.G. Interplay of gene expression and regulators under salinity stress in gill of Labeo rohita. BMC Genom. 2023, 24, 336. [Google Scholar] [CrossRef]
- Hu, W.; Cao, Y.; Liu, Q.; Yuan, C.; Hu, Z. Effect of salinity on the physiological response and transcriptome of spotted seabass (Lateolabrax maculatus). Mar. Pollut. Bull. 2024, 203, 116432. [Google Scholar] [CrossRef]
- Lepretre, M.; Hamar, J.; Urias, M.B.; Kultz, D. Comparative Proteomics of Salinity Stress Responses in Fish and Aquatic Invertebrates. Proteomics 2025, e202400255. [Google Scholar] [CrossRef]
- Bayaa, M.; Vulesevic, B.; Esbaugh, A.; Braun, M.; Ekker, M.E.; Grosell, M.; Perry, S.F. The involvement of SLC26 anion transporters in chloride uptake in zebrafish (Danio rerio) larvae. J. Exp. Biol. 2009, 212, 3283–3295. [Google Scholar] [CrossRef] [PubMed]
- Perry, S.F.; Vulesevic, B.; Grosell, M.; Bayaa, M. Evidence that SLC26 anion transporters mediate branchial chloride uptake in adult zebrafish (Danio rerio). Am. J. Physiol. Integr. Comp. Physiol. 2009, 297, R988–R997. [Google Scholar] [CrossRef]
- Shen, M.; Wang, Y.; Zhu, F.; Wei, M.; Xu, D.; Zhang, C.; Du, S.; Jiang, J.; Zhou, J.; Zhang, Z.; et al. Integrative transcriptomic and metabolomic analysis reveals the effects of a sudden drop in salinity on osmoregulation, metabolism, anti-oxidation, and immunity in Eriocheir sinensis megalopa and juvenile stages. Aquac. Rep. 2023, 31, 101656. [Google Scholar] [CrossRef]
- Takvam, M.; Wood, C.M.; Kryvi, H.; Nilsen, T.O. Role of the kidneys in acid-base regulation and ammonia excretion in freshwater and seawater fish: Implications for nephrocalcinosis. Front. Physiol. 2023, 14, 1226068. [Google Scholar] [CrossRef]
- Armesto, P.; Infante, C.; Cousin, X.; Ponce, M.; Manchado, M. Molecular and functional characterization of seven Na+/K+-ATPase beta subunit paralogs in Senegalese sole (Solea senegalensis Kaup, 1858). Comp. Biochem. Physiol. Part B Biochem. Mol. Biol. 2015, 182, 14–26. [Google Scholar] [CrossRef]
- Evans, A.N.; Lambert, F.N. Na+/K+-ATPase α1 mRNA expression in the gill and rectal gland of the Atlantic stingray, Dasyatis sabina, following acclimation to increased salinity. BMC Res. Notes 2015, 8, 219. [Google Scholar] [CrossRef][Green Version]
- Blondeau-Bidet, E.; Banousse, G.; L’Honore, T.; Farcy, E.; Cosseau, C.; Lorin-Nebel, C. The role of salinity on genome-wide DNA methylation dynamics in European sea bass gills. Mol. Ecol. 2023, 32, 5089–5109. [Google Scholar] [CrossRef]
- Bonzi, L.C.; Monroe, A.A.; Lehmann, R.; Berumen, M.L.; Ravasi, T.; Schunter, C. The time course of molecular acclimation to seawater in a euryhaline fish. Sci. Rep. 2021, 11, 18127. [Google Scholar] [CrossRef] [PubMed]
- Luo, L.; Yang, L.; Huang, J.; Jiang, S.; Zhou, F.; Li, Y.; Jiang, S.; Yang, Q. Effects of Different Salinity Stress on the Transcriptomic Responses of Freshwater Crayfish (Procambarus clarkii, Girard, 1852). Biology 2024, 13, 530. [Google Scholar] [CrossRef]
- Liu, Y.; Yang, Y.; Qin, R.; Peng, Y.; Huang, Y.; Zhu, C.; Li, G.; Jiang, D.; Shi, H. Divergent molecular responses of greater amberjack (Seriola dumerili) to acute salinity stress revealed by comparative transcriptome analysis. Front. Mar. Sci. 2023, 10, 1185015. [Google Scholar] [CrossRef]
- Zhao, H.; Wang, Q.; Zhao, H.; Chen, C. Transcriptome profiles revealed high- and low-salinity water altered gill homeostasis in half-smooth tongue sole (Cynoglossus semilaevis). Comp. Biochem. Physiol. Part D Genom. Proteom. 2022, 42, 100989. [Google Scholar] [CrossRef] [PubMed]
- Shi, H.; Li, J.; Li, X.; Ru, X.; Huang, Y.; Zhu, C.; Li, G. Survival pressure and tolerance of juvenile greater amberjack (Seriola dumerili) under acute hypo- and hyper-salinity stress. Aquac. Rep. 2024, 36, 102150. [Google Scholar] [CrossRef]
- Gao, Y.; Tang, X.; Sheng, X.; Xing, J.; Zhan, W. Antigen uptake and expression of antigen presentation-related immune genes in flounder (Paralichthys olivaceus) after vaccination with an inactivated Edwardsiella tarda immersion vaccine, following hyperosmotic treatment. Fish Shellfish Immunol. 2016, 55, 274–280. [Google Scholar] [CrossRef]
- Jiang, Y.; Yuan, C.; Qi, M.; Liu, Q.; Hu, Z. The Effect of Salinity Stress on Enzyme Activities, Histology, and Transcriptome of Silver Carp (Hypophthalmichthys molitrix). Biology 2022, 11, 1580. [Google Scholar] [CrossRef]
- Tian, Y.; Shang, Y.; Guo, R.; Chang, Y.; Jiang, Y. Salinity stress-induced differentially expressed miRNAs and target genes in sea cucumbers Apostichopus japonicus. Cell Stress Chaperones 2019, 24, 719–733. [Google Scholar] [CrossRef] [PubMed]
- Lowe, T.L.; Clarke, S.G. Human protein arginine methyltransferases (PRMTs) can be optimally active under nonphysiological conditions. J. Biol. Chem. 2022, 298, 102290. [Google Scholar] [CrossRef] [PubMed]
- Cao, Q.; Wang, H.; Fan, C.; Sun, Y.; Li, J.; Cheng, J.; Chu, P.; Yin, S. Environmental salinity influences the branchial expression of TCR pathway related genes based on transcriptome of a catadromous fish. Comp. Biochem. Physiol. Part D Genom. Proteom. 2021, 38, 100815. [Google Scholar] [CrossRef] [PubMed]




| Component | Volume (μL) |
|---|---|
| 2×Polarsignal®qPCR mix with low rox | 5 |
| Forward primer 1 | 0.3 |
| Reverse primer 1 | 0.3 |
| cDNA 2 | 1 |
| ddH2O | 3.4 |
| Total | 10 |
| Samples | Raw Reads (M) | Clean Reads (M) | Clean Data (bpG) | Clean Reads Ratio (%) | Q20 (%) | Q30 (%) | GC Content (%) | Total Mapping (%) | Uniquely Mapping (%) |
|---|---|---|---|---|---|---|---|---|---|
| I0A | 45.12 | 44.24 | 6.64 | 98.05 | 97.25 | 91.93 | 47.68 | 95.09 | 90.73 |
| I0B | 44.8 | 44.03 | 6.6 | 98.28 | 97.24 | 91.98 | 48.31 | 95.05 | 90.69 |
| I0C | 45.44 | 44.08 | 6.61 | 97.01 | 97.19 | 91.71 | 47.32 | 95.14 | 90.78 |
| I3A | 45.12 | 44.3 | 6.65 | 98.18 | 97.23 | 91.81 | 48.65 | 95.7 | 90.3 |
| I3B | 45.12 | 44.23 | 6.63 | 98.03 | 97.47 | 92.55 | 48.24 | 95.62 | 90.26 |
| I3C | 45.12 | 44.26 | 6.64 | 98.09 | 97.31 | 92.05 | 48.58 | 95.76 | 90.26 |
| I6A | 45.12 | 44.07 | 6.61 | 97.67 | 97.53 | 92.78 | 47.12 | 95.92 | 91.59 |
| I6B | 45.12 | 44.26 | 6.64 | 98.09 | 97.48 | 92.66 | 47.40 | 95.88 | 91.54 |
| I6C | 43.03 | 42.08 | 6.31 | 97.79 | 97.51 | 92.56 | 47.60 | 95.87 | 91.53 |
| I12A | 45.12 | 44.1 | 6.62 | 97.74 | 97.33 | 92.17 | 47.12 | 96.74 | 92.23 |
| I12B | 44.8 | 44.01 | 6.6 | 98.24 | 97.35 | 92.18 | 47.40 | 96.61 | 92.17 |
| I12C | 45.12 | 44.25 | 6.64 | 98.07 | 97.48 | 92.56 | 47.60 | 96.83 | 92.34 |
| K0A | 45.12 | 44.2 | 6.63 | 97.96 | 97.06 | 91.38 | 48.65 | 94.66 | 90.6 |
| K0B | 44.8 | 44.06 | 6.61 | 98.35 | 97.19 | 91.81 | 48.24 | 94.71 | 90.63 |
| K0C | 44.8 | 44.11 | 6.62 | 98.46 | 97.06 | 91.47 | 48.58 | 94.89 | 90.78 |
| K3A | 45.44 | 44.24 | 6.64 | 97.36 | 97.39 | 92.39 | 47.12 | 95.1 | 90.97 |
| K3B | 44.89 | 43.93 | 6.59 | 97.86 | 96.94 | 90.8 | 47.40 | 95.02 | 90.91 |
| K3C | 45.12 | 44.08 | 6.61 | 97.7 | 97.26 | 92.07 | 48.65 | 95.16 | 90.99 |
| K6A | 48 | 44.21 | 6.63 | 92.1 | 97.44 | 92.87 | 48.24 | 95.8 | 90.59 |
| K6B | 48.08 | 44.12 | 6.62 | 91.76 | 97.45 | 92.88 | 48.58 | 95.84 | 90.55 |
| K6C | 47.04 | 44.12 | 6.62 | 0.0253 | 97.34 | 92.46 | 47.12 | 95.94 | 90.75 |
| K12A | 45.12 | 44.15 | 6.62 | 0.0251 | 97.2 | 91.88 | 47.40 | 96.45 | 92.37 |
| K12B | 46.08 | 44.12 | 6.62 | 0.0251 | 97.07 | 91.56 | 48.58 | 96.27 | 92.21 |
| K12C | 45.76 | 44.13 | 6.62 | 0.0253 | 97.03 | 91.32 | 47.12 | 96.47 | 92.4 |
Disclaimer/Publisher’s Note: The statements, opinions and data contained in all publications are solely those of the individual author(s) and contributor(s) and not of MDPI and/or the editor(s). MDPI and/or the editor(s) disclaim responsibility for any injury to people or property resulting from any ideas, methods, instructions or products referred to in the content. |
© 2025 by the authors. Licensee MDPI, Basel, Switzerland. This article is an open access article distributed under the terms and conditions of the Creative Commons Attribution (CC BY) license (https://creativecommons.org/licenses/by/4.0/).
Share and Cite
Ruan, L.; Wei, B.; Liu, Y.; Mu, R.; Li, H.; Wei, S. Transcriptome Analysis Revealed the Immune and Metabolic Responses of Grass Carp (Ctenopharyngodon idellus) Under Acute Salinity Stress. Fishes 2025, 10, 380. https://doi.org/10.3390/fishes10080380
Ruan L, Wei B, Liu Y, Mu R, Li H, Wei S. Transcriptome Analysis Revealed the Immune and Metabolic Responses of Grass Carp (Ctenopharyngodon idellus) Under Acute Salinity Stress. Fishes. 2025; 10(8):380. https://doi.org/10.3390/fishes10080380
Chicago/Turabian StyleRuan, Leshan, Baocan Wei, Yanlin Liu, Rongfei Mu, Huang Li, and Shina Wei. 2025. "Transcriptome Analysis Revealed the Immune and Metabolic Responses of Grass Carp (Ctenopharyngodon idellus) Under Acute Salinity Stress" Fishes 10, no. 8: 380. https://doi.org/10.3390/fishes10080380
APA StyleRuan, L., Wei, B., Liu, Y., Mu, R., Li, H., & Wei, S. (2025). Transcriptome Analysis Revealed the Immune and Metabolic Responses of Grass Carp (Ctenopharyngodon idellus) Under Acute Salinity Stress. Fishes, 10(8), 380. https://doi.org/10.3390/fishes10080380


