Article

Integrated Transcriptomic and Metabolomic Analysis Reveals the Molecular Mechanisms Involved in the Adaptations of Mandarin Fish (Siniperca chuatsi) to Compound Feed

1
Key Laboratory of Tropical and Subtropical Fishery Resources Application and Cultivation, Ministry of Agriculture and Rural Affairs, Pearl River Fisheries Research Institute, Chinese Academy of Fishery Sciences, Guangzhou 510380, China
2
Ocean College, Hebei Agricultural University, Qinhuangdao 066000, China
3
Guangdong Special Aquatic Functional Feed Engineering Technology Research Center, Foshan Nanhai Jieda Feed Co., Ltd., Foshan 528211, China
*
Authors to whom correspondence should be addressed.
Fishes 2025, 10(8), 379; https://doi.org/10.3390/fishes10080379
Submission received: 22 June 2025 / Revised: 25 July 2025 / Accepted: 1 August 2025 / Published: 4 August 2025
(This article belongs to the Section Genetics and Biotechnology)

Abstract

Siniperca chuatsi is an important high-quality freshwater aquaculture species in China. In nature, it feeds exclusively on live food. In this study, domesticated juvenile S. chuatsi were divided into three groups and fed live food (group L), compound feed (group C), or a mixed diet (group M) for three months to investigate the molecular mechanisms underlying adaptation to compound feed. Histopathological examination revealed that compound feed consumption induced looser liver cell arrangement, hepatocyte morphological irregularities, and vacuolization. A total of 1033 and 1428 differentially expressed genes (DEGs), and 187 and 184 differential metabolites (DMs), were identified in the C vs. L and C vs. M groups, respectively. Transcriptomic analysis revealed that the significantly and commonly enriched metabolic pathways shared by both comparison groups were predominantly involved in amino acid, carbohydrate, and lipid metabolisms. Metabolomic analysis demonstrated that the significantly and commonly enriched metabolic pathways shared by both comparison groups were the arachidonic acid metabolism, linoleic acid metabolism, oxidative phosphorylation, and PPAR signalling pathways. Integrated omics analysis showed that the PPAR signalling pathway was the only significantly co-enriched pathway across both omics datasets. This study provides new insights into the molecular mechanisms of compound feed adaptation and provides theoretical support for selecting feed traits in S. chuatsi.
Key Contribution: Through integrated transcriptomic and metabolomic analyses of liver tissue in Siniperca chuatsi under three feeding regimes, we identified significantly associated genes; metabolites; and signaling pathways involved in feed adaptation.

1. Introduction

Mandarin fish, belonging to the genus Siniperca, are carnivorous freshwater fish and are an economically crucial species in China. This fish is popular among consumers because of its taste and rich nutritional value. In 2023, the total fish culture production of S. chuatsi in China was 477.6 thousand tons, an increase of 18.95% compared with 2022 [1]. As a crucial freshwater aquaculture-quality fish species in China, S. chuatsi has unique food preferences. It accepts only live food under natural conditions and refuses to ingest dead food or compound feed [2,3,4]. Additionally, live food is prone to carrying viruses and parasites, which cause quality and safety issues. The use of artificial domestication to modify the diet of carnivorous fish can decrease the culture cost and natural resource dependence. Presently, preliminary developments have been observed in breeding using compound feed as an alternative to live food, and some individuals have been shown to ingest dead food or compound feed following a specific training program [5,6]. However, the regulatory mechanisms underlying the acceptance of compound feed by S. chuatsi remain poorly understood [7,8].
Feeding habits are typically linked to genetic differences. Genotyping of juvenile largemouth bass (Micropterus salmoides) using eight candidate single-nucleotide polymorphisms (SNPs) based on the polymerase chain reaction–restriction fragment length polymorphism (PCR-RFLP) method showed that five SNPs were significantly correlated with feeding tameness traits in juvenile fish and two SNPs were significantly linked to growth traits [9]. Grass carp (Ctenopharyngodon idella) show a dietary transition from carnivorous to herbivorous during growth and development, and DEGs before and after the dietary transition have been identified via transcriptome sequencing to be involved in cell proliferation and differentiation, appetite control, circadian rhythms, digestion, and metabolism [10]. In S. chuatsi, candidate genes and pathways involved in dietary domestication have been identified. Selected regions and genes linked to memory, vision, and olfactory functions were identified via whole-genome resequencing and bisulfite sequencing of individuals that could and could not be domesticated to receive compound feed [11]. Specific modules and hub genes highly linked to the digestive system in S. chuatsi were analysed using weighted gene co-expression network analysis (WGCNA) [12]. Genes such as vtgc and lect2 may play crucial roles in the adaptation of the digestive system to compound feed. The expression of genes involved in protein, fat, and carbohydrate digestion contributed to the digestion of ingested compound feed in S. chuatsi [13,14]. DNA methylation of the TFIIF gene and histone ezh1 was suggested as a novel molecular mechanism for the dietary domestication of S. chuatsi via Western blotting and bisulfite sequencing PCR analysis [15].
We have provided tools and methods to understand the mechanisms of S. chuatsi dietary domestication at the gene and metabolic levels, with the development of omics technologies, particularly the application of transcriptomics and metabolomics. Transcriptomic analysis facilitates the identification of numerous DEGs and regulatory networks, thereby facilitating the mechanistic interpretation of phenotypic variations induced by dietary transitions. Metabolites are the ultimate embodiment of life activities, and small alterations in phenotypic traits are exponentially amplified at the metabolic level, revealing the link between metabolites, their pathways, and life states. The two omics referenced in this combined analysis are mutually validating and can overcome the limitations of single-omics studies to a certain extent. Furthermore, this combined method can target key genes, metabolites, and pathways from a large amount of data, thus revealing the molecular mechanisms underlying biological phenomena. At present, combined analyses of the transcriptome and metabolome have been widely used to explore the functional genes and pathways influencing certain biological processes, such as environmental stress [16], disease [17], and growth [18] in aquatic animals.
The dietary domestication protocol for S. chuatsi was as follows: (1) feeding with dead food during days 1–4, (2) transitioning to a mixture of dead food and powdered feed from days 5–7, and (3) complete substitution with compound feed from day 8 onward. In a previous study, He et al. investigated the DEGs and DMs of two S. chuatsi groups that did not eat artificial diets and those that did using transcriptome sequencing and metabolomic analysis [15]. They identified three common pathways linked to dietary domestication, including retinol metabolism, glycerolipid metabolism, and unsaturated fatty acid biosynthesis pathways. Mixed feeding with compound feed and live food is an intermediate process in gradual S. chuatsi domestication into artificial diets; however, no studies have been conducted on this feeding regimen. To elucidate the molecular mechanisms underlying S. chuatsi adaptation to compound feed during dietary domestication, we simulated three typical transition stages (from rejection to full acceptance of compound feed) and established three experimental feeding regimens: compound feed only, live food only, and a mixed diet combining both compound feed and live food. To identify potential biomarkers associated with dietary domestication, we systematically analysed key genes, metabolites, and pathways involved in S. chuatsi adaptation to compound feed using transcriptomics and metabolomics. Subsequently, correlation analysis was performed between DEGs and DMs, followed by construction of a correlation network. Our findings revealed a close relationship between compound feed adaptation and lipid metabolism in S. chuatsi. The relevant findings provide novel insights into the molecular mechanisms underlying S. chuatsi adaptation to compound feed, while offering theoretical support for selective breeding of feed-related traits in this species.

2. Materials and Methods

2.1. Experimental Fish Culture

Experimental fish were cultured at the Nanhai Base of Guangdong Jieda Feed Co., Ltd. (Foshan, Guangdong). Following domestication, healthy S. chuatsi juveniles with similar body sizes (23.17 ± 0.75 g) were selected. They were then randomly divided into three groups, which were classified into live food (group L), compound feed (group C), and mixed diet groups (group M). Three parallels were set up in each group, and nine culture buckets (0.5 m3) with 50 fish per bucket were set up. All experimental groups were fed to satiation two times daily at 08:00 and 16:30. Group C was exclusively fed compound feed and Group L was exclusively fed mud carp (Cirrhinus molitorella) fry throughout the trial. Group M was fed compound feed for one meal and live food for the other meal (compound feed in the morning and live food in the afternoon). The compound feed was purchased from Jieda Feed Co., Ltd., Nanhai District, Foshan City, Guangdong Province, China, and was a special extruded compound feed for S. chuatsi. The main nutrient components of the compound feed and live food are shown in Table 1. The particle size of the compound feed and specifications of the live food were adjusted according to the fish growth, and the full length of the Mrigal carp fry was 40% to 60% of the full length of S. chuatsi. The groups were cultured using the same recirculating water to ensure stable cultured water quality with a temperature of (26 ± 1) °C, pH values ranging from 7.2 to 7.8, dissolved oxygen concentration ≥ 5 mg/L, ammonia nitrogen concentration < 0.2 mg/L, and nitrite concentration < 0.1 mg/L.
The culture period was three months, and feeding was stopped 24 h before sampling. The S. chuatsi groups were anaesthetised using an anaesthetic (MS-222), and the S. chuatsi individuals were dissected using autoclaved scissors and forceps. Liver tissue samples for histological analysis were randomly collected from three fish per group (one fish per replicate bucket), fixed in 4% paraformaldehyde (PFA) solution and stored at 4 °C. Liver tissue samples for transcriptomic analysis were randomly collected from three fish per group (one fish per replicate bucket), immersed in RNA preservation solution, and stored at −80 °C. Liver tissue samples for metabolomic analysis were randomly collected from six fish per group (two fish per replicate bucket), flash-frozen in liquid nitrogen, and stored at −80 °C. At the end of the culture, the weights of S. chuatsi individuals in groups C, L, and M were (148.33 ± 6.89) g, (144.33 ± 9.93) g, and (136.83 ± 5.38) g, respectively.

2.2. Preparation of Liver Tissue Sections and Hematoxylin–Eosin (H&E) Staining

Liver tissues were fixed in 4% PFA solution for 24 h. They were subsequently processed through a graded ethanol series (70~100%) for dehydration, xylene for clearing, and embedded in paraffin. Sections (4~5 μm thick) were cut, de-paraffinised in xylene, and stained with H&E. After staining, the slides were dehydrated in ethanol, cleared in xylene, and sealed with a neutral tree resin following air drying at room temperature. The sections were scanned and photographed using a digital tissue section scanner (3DHISTECH, Budapest, Hungary), and the images were observed and analysed using CaseViewer 2.3 software.

2.3. Total RNA Extraction, cDNA Library Construction, and Transcriptome Sequencing

Total RNA of S. chuatsi liver tissue was extracted using the TRIzol method. The integrity and total amount of the extracted RNA were determined using an Agilent 2100 Bioanalyzer (Agilent Technologies, Santa Clara, USA) and agarose gel electrophoresis. The RNA quality and concentration were determined using a NanoDrop 2000 spectrophotometer (Thermo Fisher Scientific, Wilmington, USA), and the extracted RNA was considered satisfactory when the OD260/280 values were approximately 1.8~2.0. The mRNA with a polyA structure in the total RNA was enriched using Oligo (dT) magnetic beads, and divalent cations were utilised to interrupt the mRNA into fragments of approximately 300 bp in length. Fragmented mRNA was used as a template to synthesise the first cDNA strand using random oligonucleotides as primers and reverse transcriptase, and the first cDNA strand was utilised as a template to synthesise the second strand. After completing library construction, libraries of approximately 450 bp were screened using PCR amplification and further quality-checked. After the libraries had been constructed and qualified, they were subjected to double-end (paired-end, PE) sequencing using Next-Generation Sequencing (NGS) technology based on the Illumina sequencing platform. BioNovoGene Co., Ltd. (Suzhou, China) facilitated the construction and sequencing of the cDNA library.

2.4. Sequencing Data Quality Control, Screening, and Functional Annotation of the DEGs

To ensure the sequencing data quality met bioinformatics standards, the raw sequencing data (FASTQ format) were processed by removing 3′-end adapter sequences and filtering out low-quality reads with mean Phred scores < Q20. Filtered high-quality sequences (clean data) were aligned to the reference genome (https://www.ncbi.nlm.nih.gov/assembly/GCF_020085105.1/, accessed on 6 December 2023). Expression was normalised using fragments per kilo bases per million fragments (FPKM). Principal component analysis (PCA) was performed using the BioDeep Platform (https://www.biodeep.cn, accessed on 10 March 2024). Gene expression was differentially analysed, and the screening conditions were as follows: expression fold difference | log2 (fold change) | > 1, significance p < 0.05. Volcano plots of DEGs were generated using the ggplot2 package in R (v4.3.0). Gene Ontology (GO) and KEGG annotations were performed using eggNOG-mapper (v2.1.7) and KOBAS (v2.0), respectively. GO and KEGG enrichment analyses were performed using the topGO and clusterProfiler packages in R (v4.3.0), respectively.

2.5. Validation Using Quantitative PCR (qPCR)

Ten DEGs (5 upregulated genes and 5 downregulated genes) were randomly selected for qPCR validation using β-actin as an internal reference gene to verify the reliability of the transcriptome sequencing results. cDNA was obtained using reverse transcription of the total RNA using an All-in-One First-Strand Synthesis Master Mix (with dsDNase) kit (Xinkailai, Guangzhou, China). The experiments were performed using a LightCycler96 real-time fluorescent quantitative PCR instrument (Roche, Basel, Switzerland). The qPCR primers were designed according to the publicly available National Center for Biotechnology Information (NCBI) sequences using Primer Premier 5 and synthesised by Sangon Biotech (Shanghai, China) (Table S1). The qPCR reaction system (20 μL) was as follows: 10 μL of 2 × SYBR Green qPCR Premix (Universal), 0.4 μL each of forward/reverse gene-specific primers, 2 μL of 5-fold diluted cDNA, and 7.2 μL of Nuclease-Free Water. Reaction program: pre-denaturation at 95 °C for 30 s, denaturation at 95 °C for 10 s, annealing at 60 °C for 10 s, and extension at 72 °C for 30 s. Forty cycles were conducted from denaturation to extension. The relative expression levels of the genes were estimated using the comparative cyclic threshold (CT) method (2−∆∆CT method).

2.6. Metabolite Extraction and Liquid Chromatography–Mass Spectrometry (LC-MS) Analysis

An appropriate amount of each piece of S. chuatsi liver tissue was accurately weighed into a 2 mL centrifuge tube, and 1 mL of the tissue extract (75% [9:1 methanol: chloroform]: 25% H2O) was added to it. To this mixture, three steel balls were added. This was then placed into a tissue grinder and was ground at 50 Hz for 60 s. The above operation was repeated two times. This mixture was subjected to ultrasound at room temperature and an ice bath for 30 min. Subsequently, the mixture was centrifuged for 10 min at 12,000 rpm and 4 °C. The supernatant was collected, transferred to a new 2 mL centrifuge tube, and concentrated and dried. Furthermore, 200 µL of 50% acetonitrile solution was prepared using 2-chloro-l-phenylalanine (4 ppm) to re-dissolve the sample. Finally, the supernatant was filtered using a 0.22 μm membrane and transferred into a detection bottle for LC-MS detection.
Chromatographic separation was conducted on a Vanquish ultra-high-performance liquid chromatography (UHPLC) System (Thermo Fisher Scientific, Waltham, MA, USA) equipped with an ACQUITY UPLC® HSS T3 column (Waters, Milford, CT, USA) in the positive and negative ion modes. Mass spectrometric detection of metabolites was separately performed in positive and negative ion modes using Q Exactive (Thermo Fisher Scientific, Waltham, MA, USA) with an ESI ion source. Raw LC-MS data were obtained, and BioNovoGene Co., Ltd. (Suzhou, China) provided the sequencing process and instrumentation.

2.7. DM Screening and Analysis

The raw data were first converted to mzXML format using MSConvert in the ProteoWizard software package (v3.0.8789) and processed using R XCMS (v3.12.0) for peak identification, filtration, and alignment; all data were determined using quality control and quality assurance. The metabolites were identified using accurate mass spectrometry and MS/MS data, which were matched with HMDB, Massbank, KEGG, LipidMaps, Mzcloud, and the metabolite database built by BioNovoGene. PCA was used to visualise the differences between the different all sample groups, and the variable importance in projection (VIP) >1 of the orthogonal partial least squares discriminant analysis (OPLS-DA) model and p < 0.05 were used to screen for significantly different metabolites. DMs identified in positive and negative ion modes were combined and subjected to KEGG pathway enrichment analysis using MetaboAnalyst (v5.0).

2.8. Correlation Analysis of the DEGs and DMs

Common DMs shared between the C vs. L and C vs. M comparison groups were subjected to Pearson’s correlation analysis with key genes and the results were visualised as a clustered heatmap. Crucial gene-metabolite relationship pairs were screened according to |correlation coefficient| > 0.8 and p < 0.05. The correlation network diagrams were drawn using Cytoscape (v3.10.0).

3. Results

3.1. Effect of Compound Feed Ingestion on the Tissue Microstructure of S. chuatsi Liver

Histological examination of liver tissues in S. chuatsi under three feeding regimes revealed the following:
In group L, hepatocytes were neatly and closely arranged, with regular morphology and uniformly stained cytoplasm. Cell nuclei were well defined and centrally located, and no obvious cytoplasmic vacuolation was observed (Figure 1A). In group M, hepatocyte arrangement was slightly looser than in group L, though cell morphology remained relatively normal. Mild vacuolar degeneration and slightly blurred cell boundaries were observed (Figure 1B). In group C, hepatocytes exhibited markedly widened intercellular spaces, and irregular morphology. Vacuolation was more pronounced, and some nuclei displayed mild pyknosis or eccentric positioning (Figure 1C).

3.2. Transcriptome Sequencing Data Analysis

After transcriptome sequencing of the S. chuatsi liver tissues, we obtained 476,942,380 raw reads across the three experimental groups: the compound feed (group C), live food (group L), and mixed diet groups (M). The number of clean reads was 469,975,968, following a data quality control process that removed splice fragments and low-quality base fragments from the raw data to obtain filtered reads. The Q20 base percentage ranged from 98.66% to 98.87%, and the Q30 base percentage ranged from 96.07% to 96.64%. Additionally, 97.33~97.62% of the clean reads could be successfully mapped to the S. chuatsi reference genome, 4.45~4.93% of the clean reads were mapped to several locations in the reference genome, and 95.07~95.55% of the clean reads were mapped to a unique location in the reference genome. The above indicates that the sequencing data were of good quality and could be used for further analyses. Table 2 and Table S2 provide the sequencing results.

3.3. PCA of the Transcriptome Data

PCA was performed on the liver transcriptome data of S. chuatsi under the three feeding regimens. Furthermore, the nine samples were clearly divided into three groups (Figure S1). The samples within the groups were clustered together, and samples between groups were dispersed. This suggest that large differences existed between groups, which could be analysed for subsequent results.

3.4. DEG Selection

Based on the transcriptome sequencing results, p < 0.05 and |log2(FC)| > 1 were used as the screening criteria. The experimental group was the compound feed group (group C). The live food (group L) and mixed diet groups (group M) were used as control groups to screen for DEGs among the comparison groups. In the C vs. L group, 1033 (548 upregulated and 485 downregulated) DEGs were obtained and 1428 (790 upregulated and 638 downregulated) DEGs were obtained in the C vs. M group. In each comparison group, the number of upregulated DEGs was higher than the number of downregulated DEGs. According to the Venn diagram, there were 228 upregulated and 172 downregulated DEGs in group C, which were shared between the two comparison groups (Figure S2).

3.5. GO and KEGG Enrichment Analysis of the DEGs

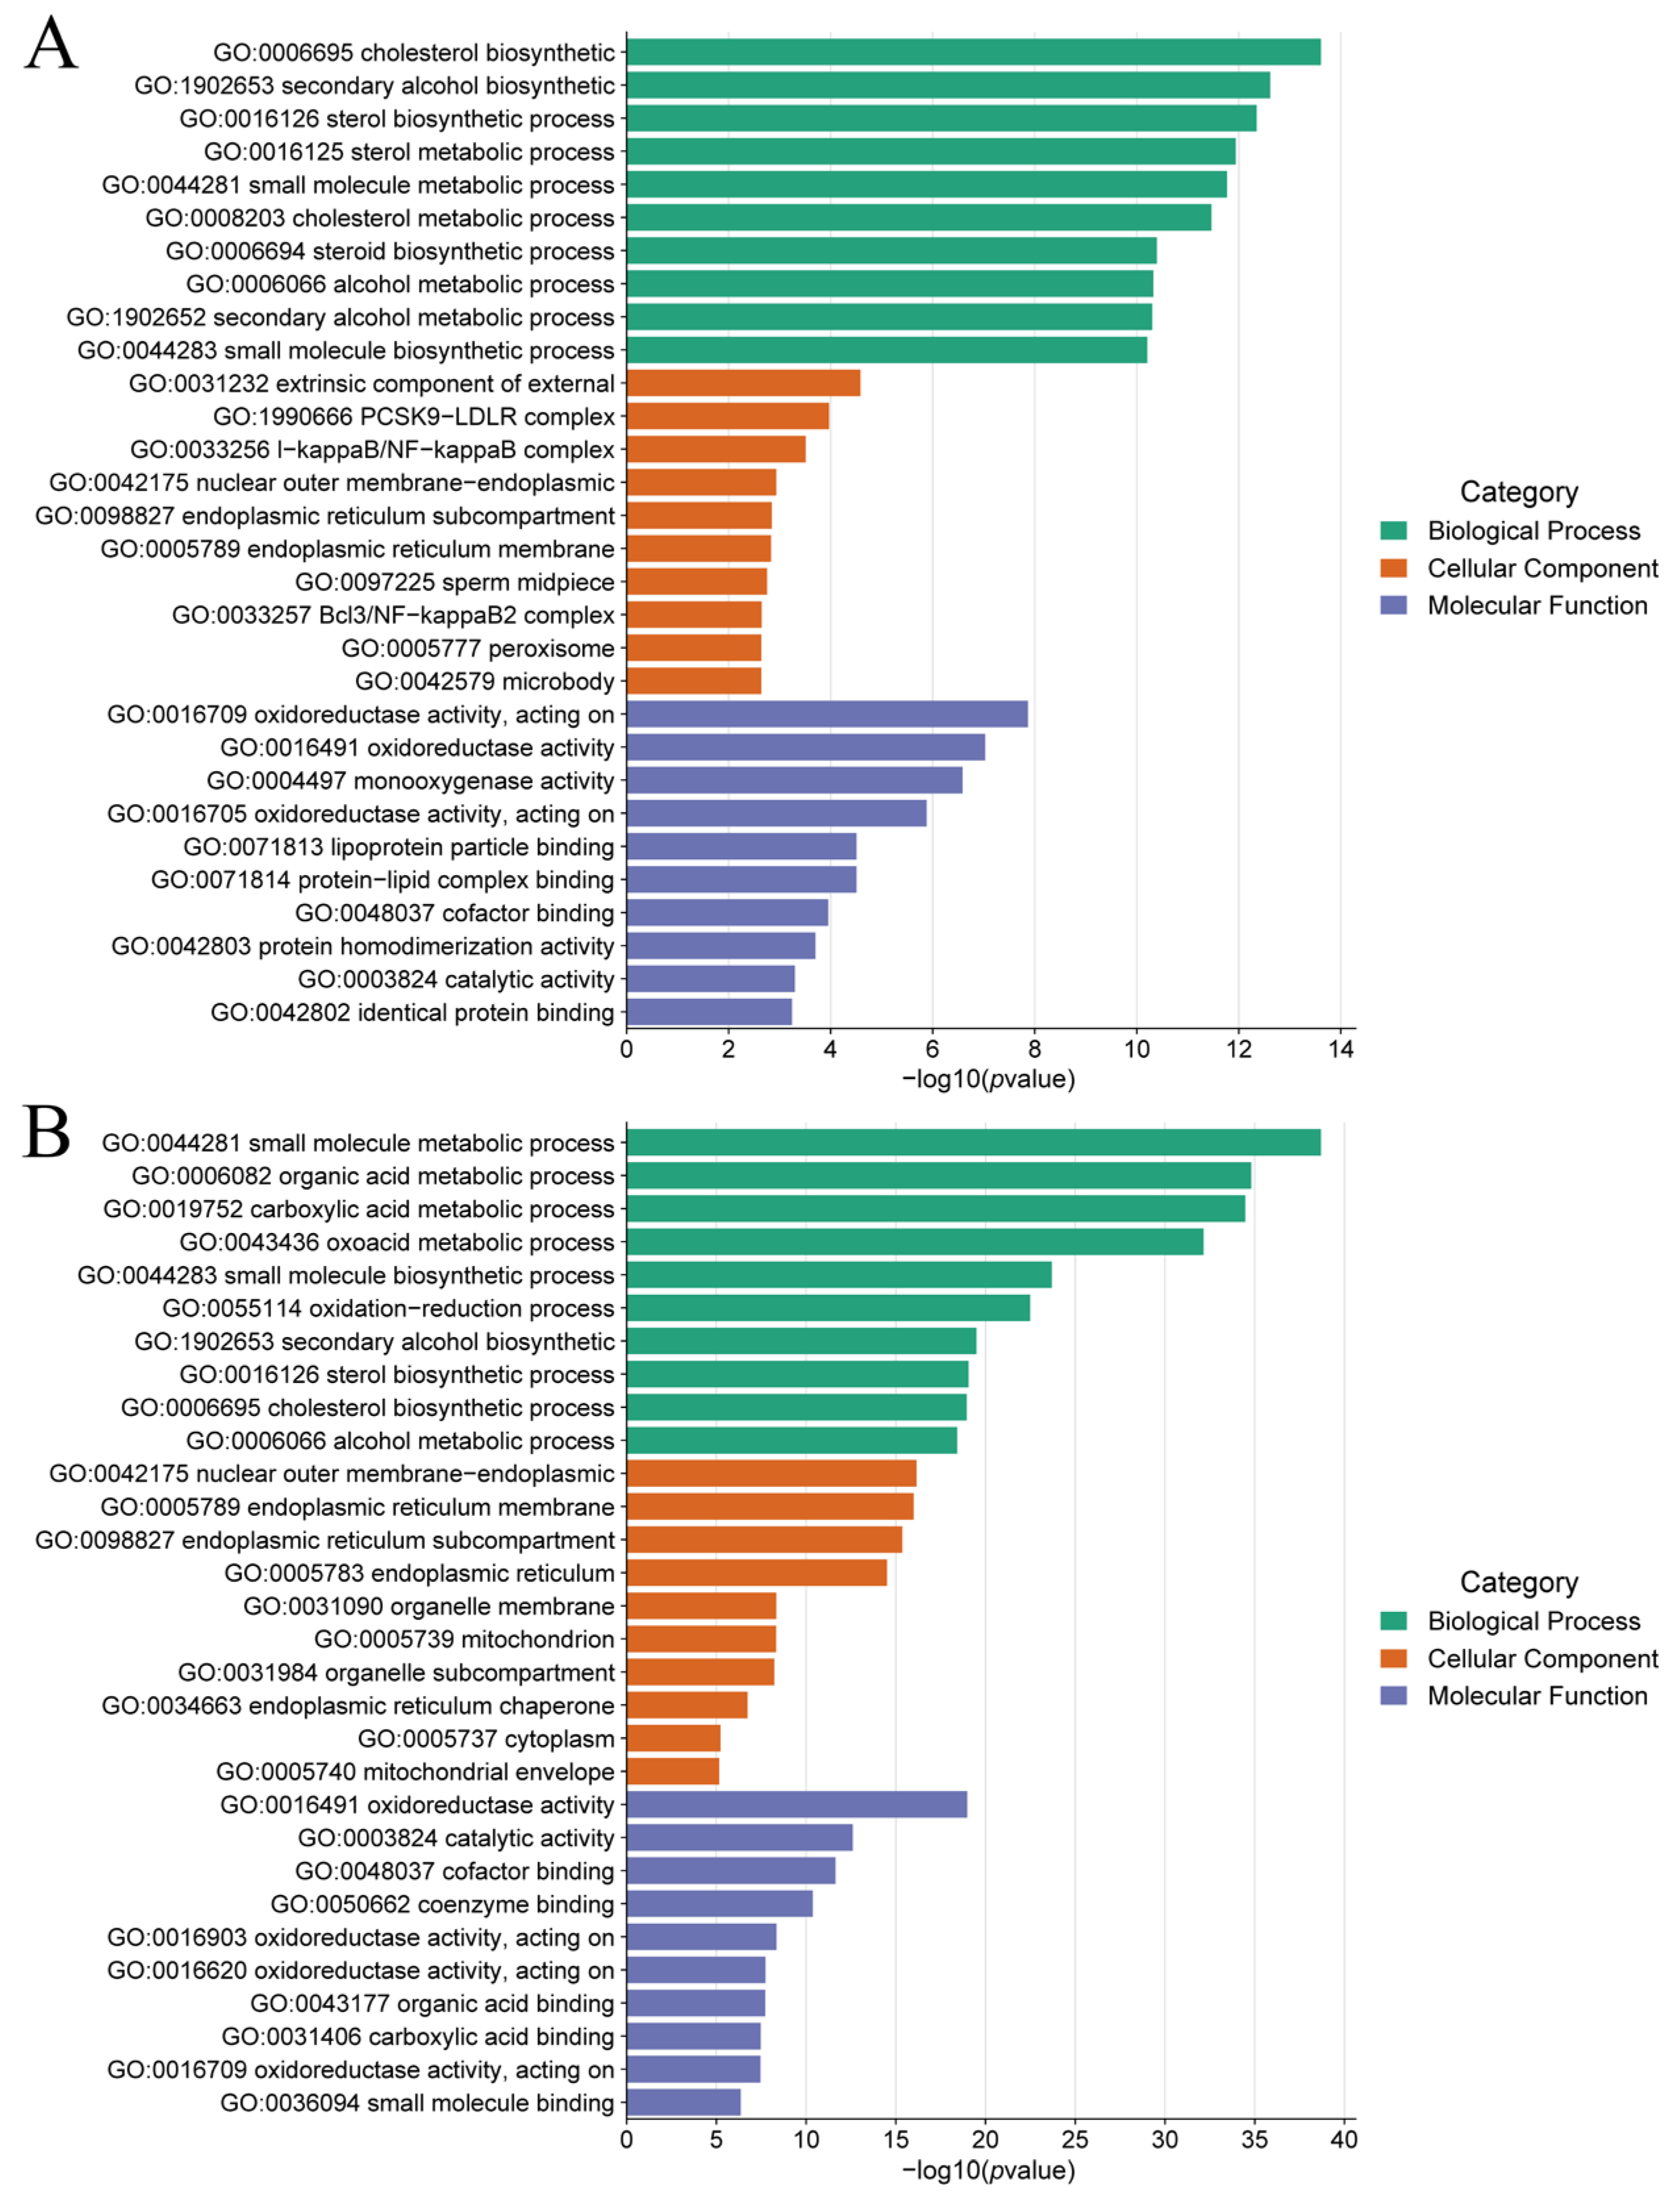
To investigate the molecular mechanisms of S. chuatsi adaptation to compound feed and to reveal the biological functions and pathways involved in the DEGs across different feeding groups, GO and KEGG enrichment analyses were performed on the DEGs from each comparison group. The enriched GO terms belonged to three ontologies: biological process (BP), cellular component (CC), and molecular function (MF). We screened GO terms with a significance level of p < 0.05. A total of 1058 GO terms were significantly enriched in the DEGs of group C vs. L, of which 877 were BP, 127 were MF, and 54 were CC. The significantly enriched GO terms included cholesterol, secondary alcohol, and sterol biosynthetic processes (Figure 2A). A total of 1552 GO terms were significantly enriched in the DEGs of group C vs. M, of which 1200 were BP, 246 were MF, and 106 were CC. The significantly enriched GO terms included small molecule, organic acid, and carboxylic acid metabolic processes (Figure 2B).
Screening for significantly enriched KEGG pathways (p < 0.05) revealed that 19 metabolic pathways were significantly enriched among the DEGs in group C vs. L. The three most significant pathways were steroid biosynthesis, PPAR signalling pathway, and tyrosine metabolism (Figure 3A). DEGs were significantly enriched in 40 metabolic pathways in group C vs. M. The three most significant pathways were steroid biosynthesis, PPAR signalling pathway, and arginine and proline metabolism (Figure 3B).
The C vs. L and C vs. M groups shared 16 metabolic pathways, including amino acid, carbohydrate, and lipid metabolism, such as tyrosine metabolism, phenylalanine metabolism, pyruvate metabolism, steroid biosynthesis, terpenoid backbone biosynthesis, and PPAR signalling pathway (Figure S3). Three pathways were uniquely enriched in the C vs. L comparison: cytokine–cytokine receptor interaction, drug metabolism–other enzymes, and riboflavin metabolism. Twenty-four metabolic pathways, including glycolysis/gluconeogenesis, tryptophan metabolism, and primary bile acid biosynthesis, were specific to the C vs. M group. In both comparison groups, DEGs that were significantly upregulated in the compound feed group were primarily enriched in the steroid biosynthesis and terpenoid backbone biosynthesis pathways, whereas DEGs that were markedly downregulated in the compound feed group were primarily enriched in the amino acid metabolism-related pathways, such as tyrosine, phenylalanine, cysteine, and methionine metabolism.

3.6. qPCR Validation

Five significantly upregulated and five significantly downregulated genes were randomly selected for qPCR validation based on the differential fold expression of DEGs to further verify the reliability of the transcriptome sequencing findings. The validation results were consistent with the RNA-Seq results, proving the reliability of the sequencing results (Figure 4).

3.7. Statistical Analysis of the Multivariate Variables Between Metabolic Groups

3.7.1. PCA of the Metabolome Data

PCA was conducted to investigate the overall distribution trends of the samples. Figure S4A, B reveals the PCA score plots in the positive (pos) and negative (neg) ion modes, respectively. The intragroup samples were closely clustered in positive and negative ion modes, indicating good experimental repeatability. The intergroup samples were clearly separated and significantly different between the groups, indicating the reliability of the experimental data.

3.7.2. OPLS-DA Analysis

This study was modelled and analysed using the OPLS-DA model in positive and negative ion modes to screen the DMs more comprehensively. Figure S5 shows the OPLS-DA score plots in positive and negative ion modes for each comparison group. The metabolic profiles of the control and experimental groups in each comparison group were clearly distinguishable, indicating significant alterations.
The following conditions indicate that the established OPLS-DA model does not display an overfitting phenomenon, and that the model is stable and reliable: OPLS-DA model parameters R2Y > 0.9, Q2 > 0.5, the intercept of Q2 regression line with the Y-axis, i.e., replacement intercept < 0, or when the R2 and Q2 points are lower than the original R2 and Q2 points on the upper right. Figure S6 shows the replacement test diagram.

3.8. DM Selection

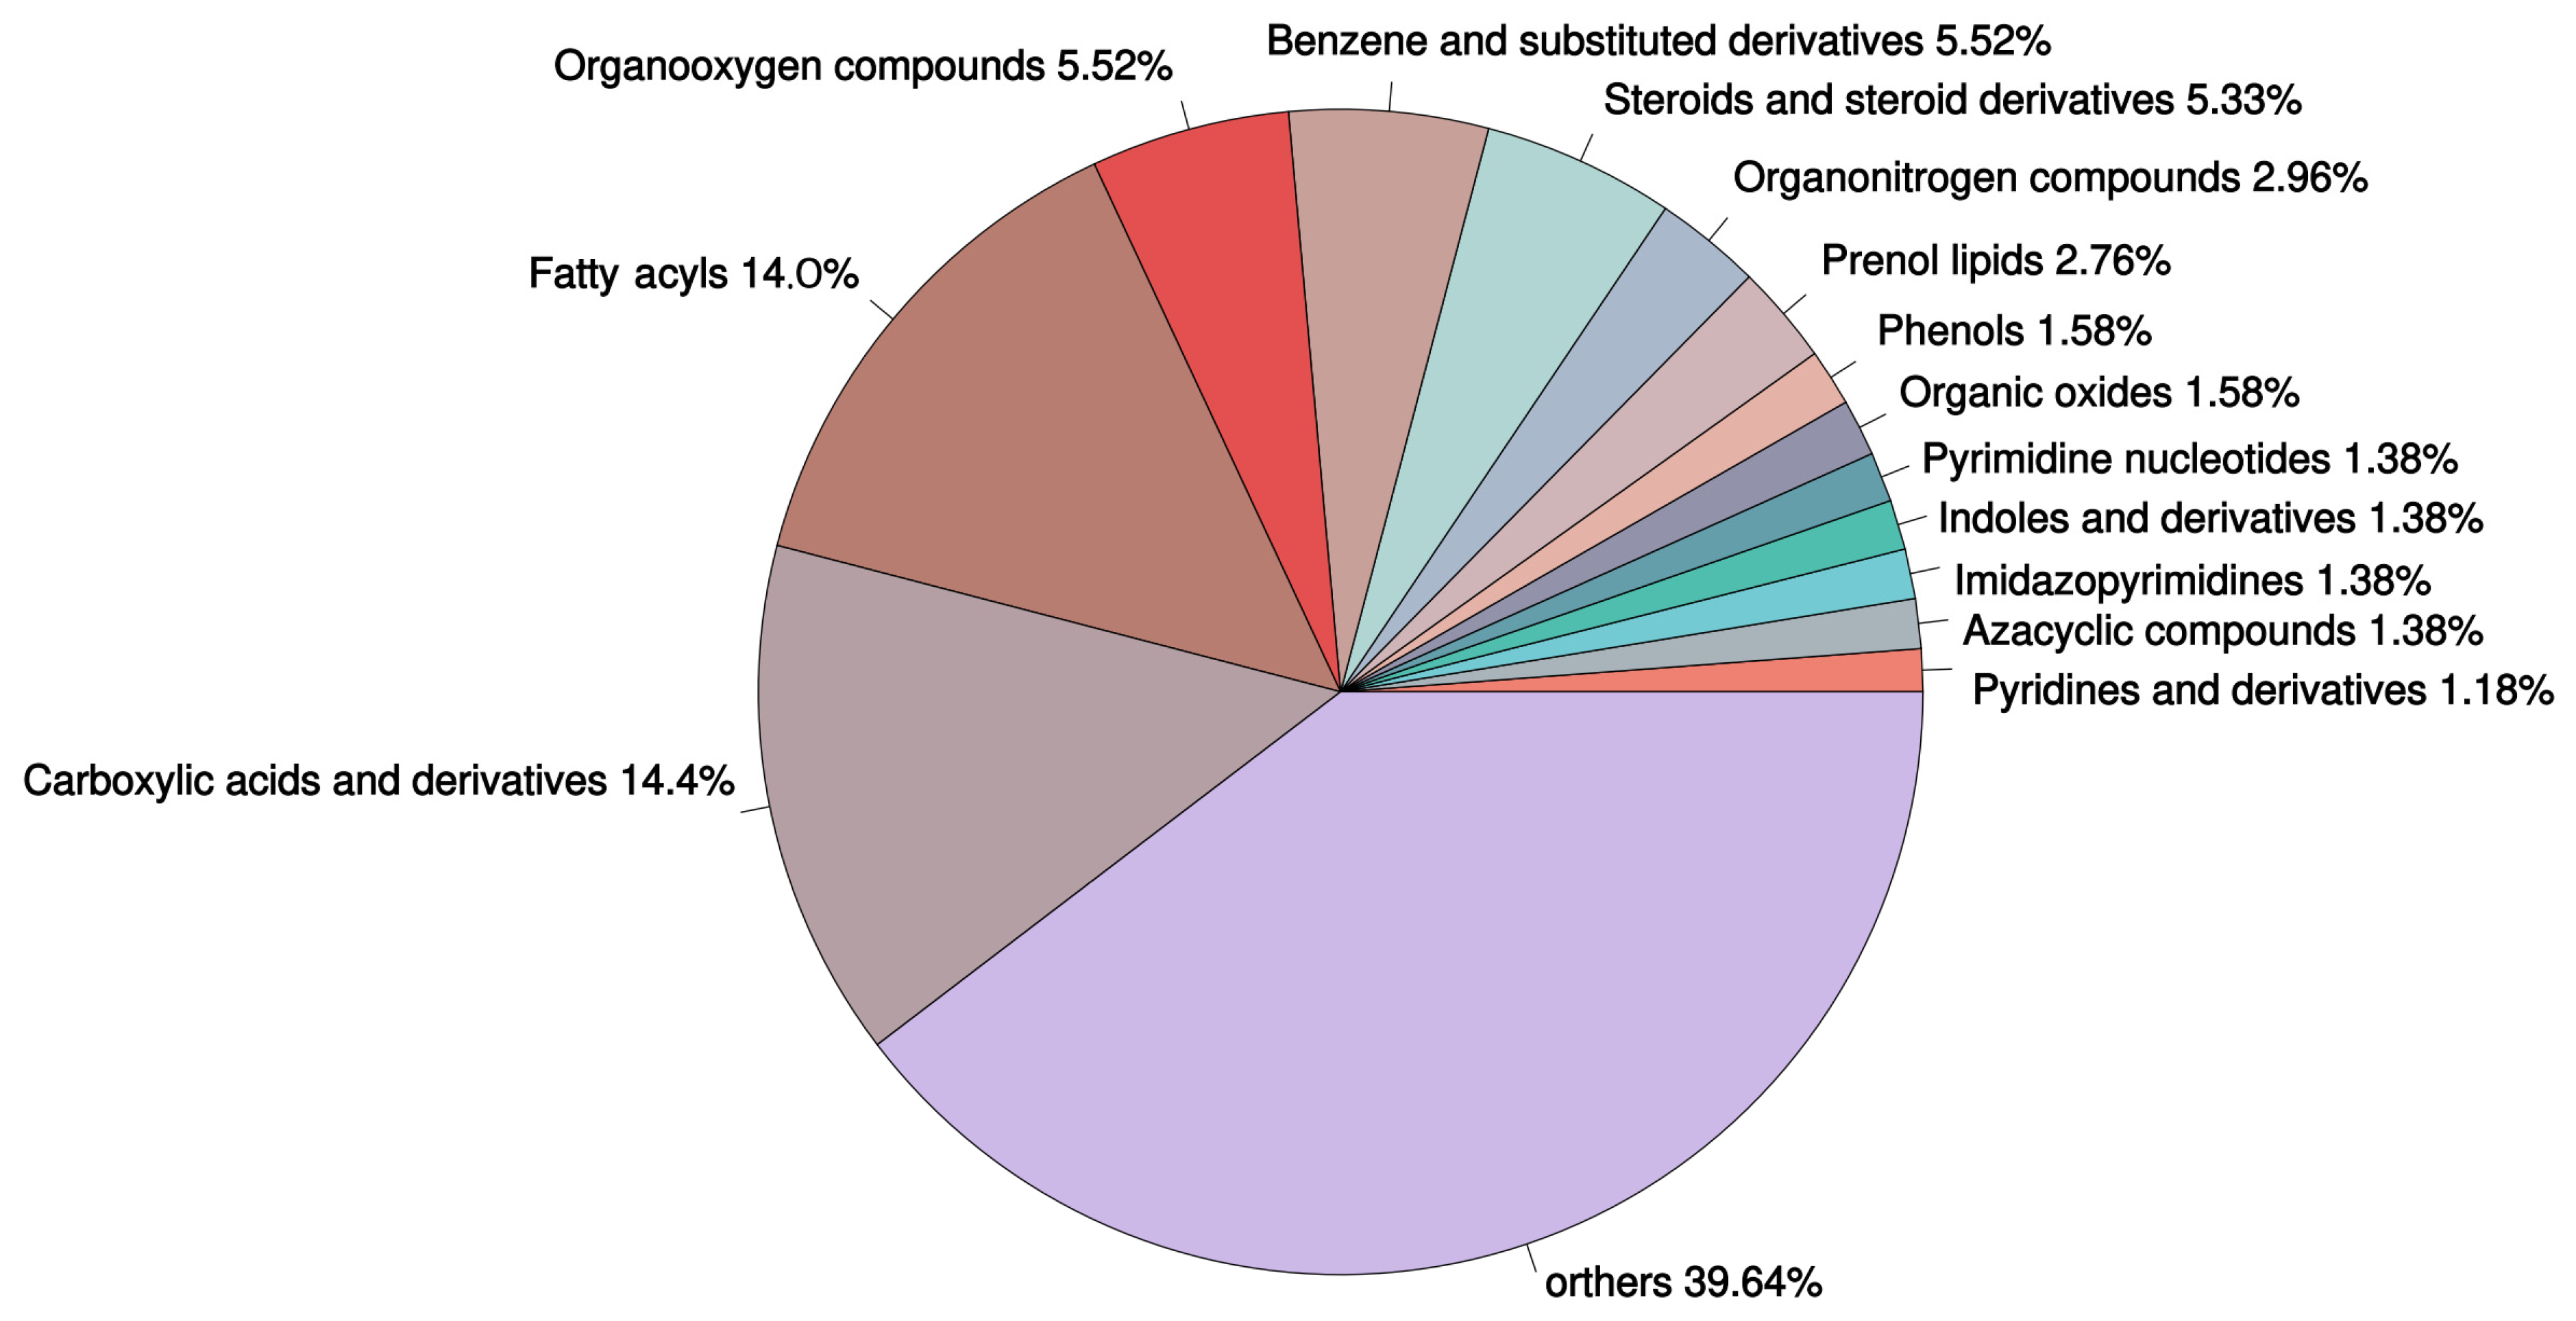
S. chuatsi liver tissues were collected from each group for LC-MS analysis, and 507 metabolites were detected. Among these, 73 were carboxylic acids and derivatives (14.40% of the total metabolites), including succinic acid and L-threonine. A total of 71 fatty acyls (14.00% of the total metabolites), including linoleic acid and arachidic acid, were detected. Furthermore, 28 benzene and substituted derivatives (5.52% of the total metabolites), including phenylacetaldehyde and phenylethylamine, were detected. Additionally, 28 organooxygen compounds (5.52% of the total metabolites), including sucrose and glyceric acid, were detected, and 27 steroids and steroid derivatives (5.33% of the total metabolites), including cortisol and taurocholic acid, were detected (Figure 5).
The VIP of OPLS-DA > 1 and p < 0.05 were used as the screening criteria for significant DMs. Group C was used as the experimental group, and groups L and M were used as the control groups to screen for DMs between each comparison group. In the C vs. L and C vs. M groups, 187 (90 upregulated and 97 downregulated) and 184 (97 upregulated and 87 downregulated) DMs were obtained, respectively (Figure S7). According to the Venn diagram, the groups that were upregulated in group C shared 56 DMs, and 57 shared downregulated DMs were found (Figure S8). DMs primarily consisted of carboxylic acids and derivatives, fatty acyls, benzene and substituted derivatives, and organooxygen compounds.

3.9. KEGG Enrichment Analysis of the DMs

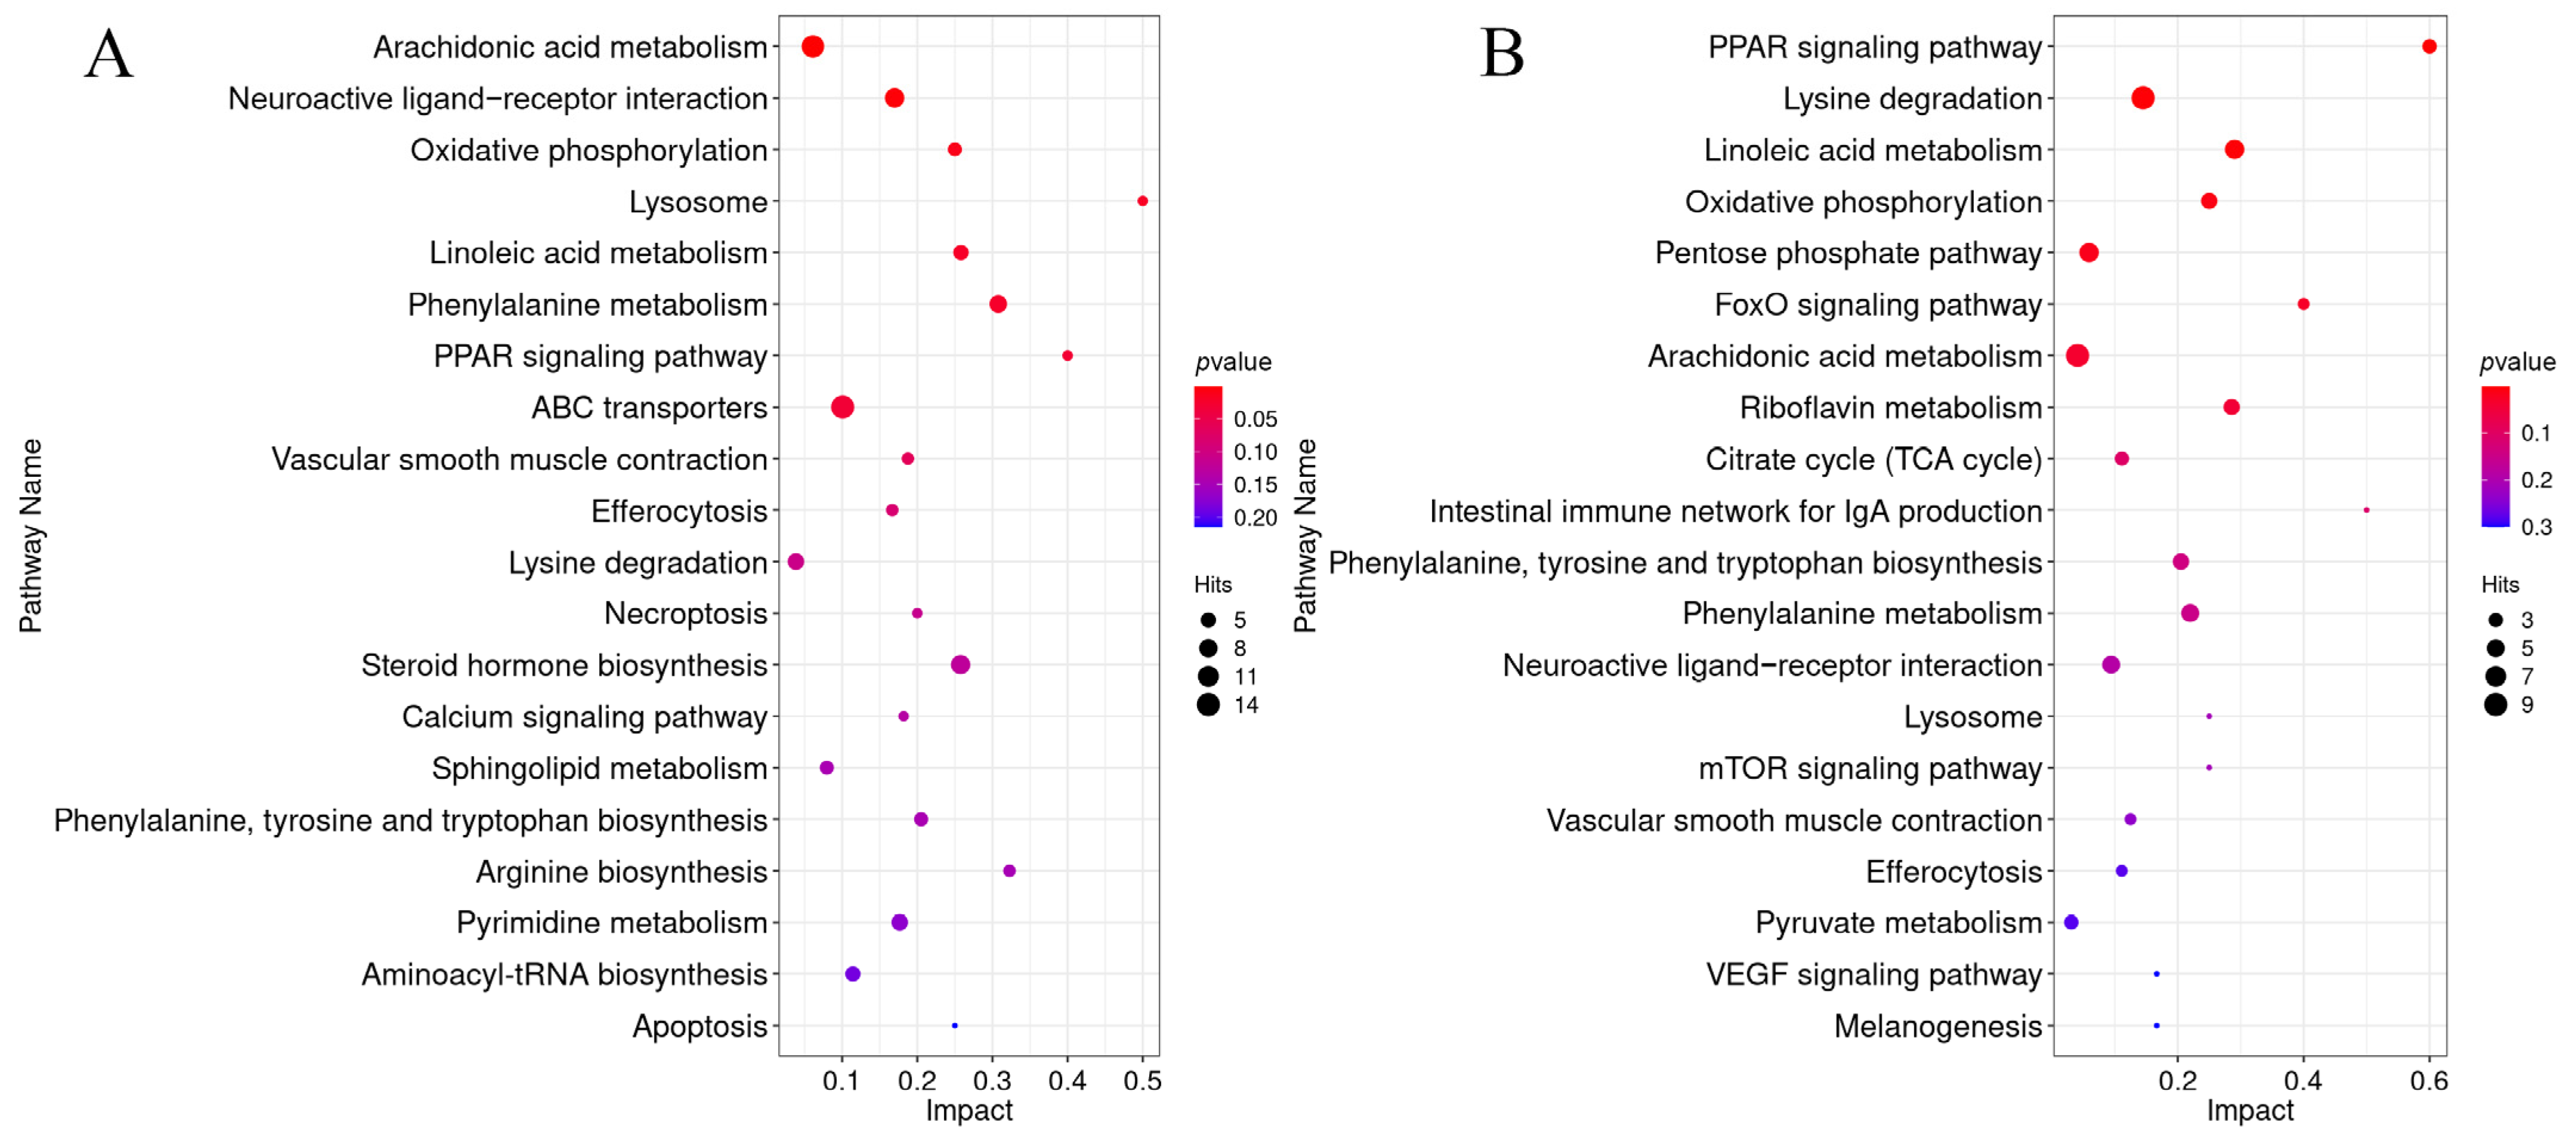
DMs were subjected to KEGG pathway annotation and enrichment analysis to screen for significantly enriched pathways (p < 0.05). We identified eight significantly enriched metabolic pathways in the C vs. L comparison: arachidonic acid metabolism, neuroactive ligand–receptor interaction, oxidative phosphorylation, lysosome, linoleic acid metabolism, phenylalanine metabolism, PPAR signalling pathway, and ABC transporter (Figure 6A). Eight metabolic pathways revealed significant enrichment in the C vs. M comparison: PPAR signalling pathway, lysine degradation, linoleic acid metabolism, oxidative phosphorylation, pentose phosphate pathway, FoxO signalling pathway, arachidonic acid metabolism, and riboflavin metabolism (Figure 6B). The significantly enriched pathways that the DMs shared in the two comparison groups were arachidonic acid metabolism, linoleic acid metabolism, oxidative phosphorylation, and PPAR signalling pathways (Figure S9).

3.10. Integrated Analysis of the Transcriptomic and Metabolomic Data

The liver tissues were subjected to a combination of transcriptomic and metabolomic analyses to further elucidate the molecular mechanisms underlying the adaptation of S. chuatsi to compound feed.

3.10.1. Common Pathway Enrichment Analysis

We mapped DEGs and DMs to KEGG pathways and screened them for significantly enriched KEGG pathways shared in the transcriptome and metabolome. The common pathways for DEGs and DMs were the PPAR signalling pathway and phenylalanine metabolism in the C vs. L comparison. The common pathways for DEGs and DMs were the PPAR and FoxO signalling pathways in the C vs. M comparison. KEGG enrichment analysis showed that the PPAR signalling pathway was the only metabolic pathway significantly enriched in both comparison groups across the multi-omics datasets (Figure 7). This pathway was enriched in key genes (slc27a4, acsl5, acsl6, fads2, and plin2) and metabolites (alpha-dimorphecolic acid and 8-HETE). Furthermore, Table S3 presents the key genes, metabolites, and pathways associated with feed adaptation in S. chuatsi, as identified through transcriptomic and metabolomic analyses.

3.10.2. Correlation Analysis of the DEGs and DMs

We performed a correlation analysis between DEGs and DMs to further elucidate the correlation between transcriptomics and metabolomics. The 25 key genes and 113 differential metabolites screened (56 upregulated and 57 downregulated metabolites in group C shared between the C vs. L and C vs. M comparison groups) were analysed for correlations. The correlation values between genes and metabolites were calculated using the Pearson’s correlation algorithm and correlation heat maps were created. Results with |correlation coefficients| > 0.8 and p < 0.05 were selected and labelled * (Figure S10). In the C vs. L group, 785 significant gene–metabolite relationship pairs were identified, of which 362 and 423 were positively and negatively correlated, respectively (Table S4). In the C vs. M group, 585 significant gene–metabolite relationship pairs were identified, of which 266 and 319 were positively and negatively correlated, respectively (Table S5).
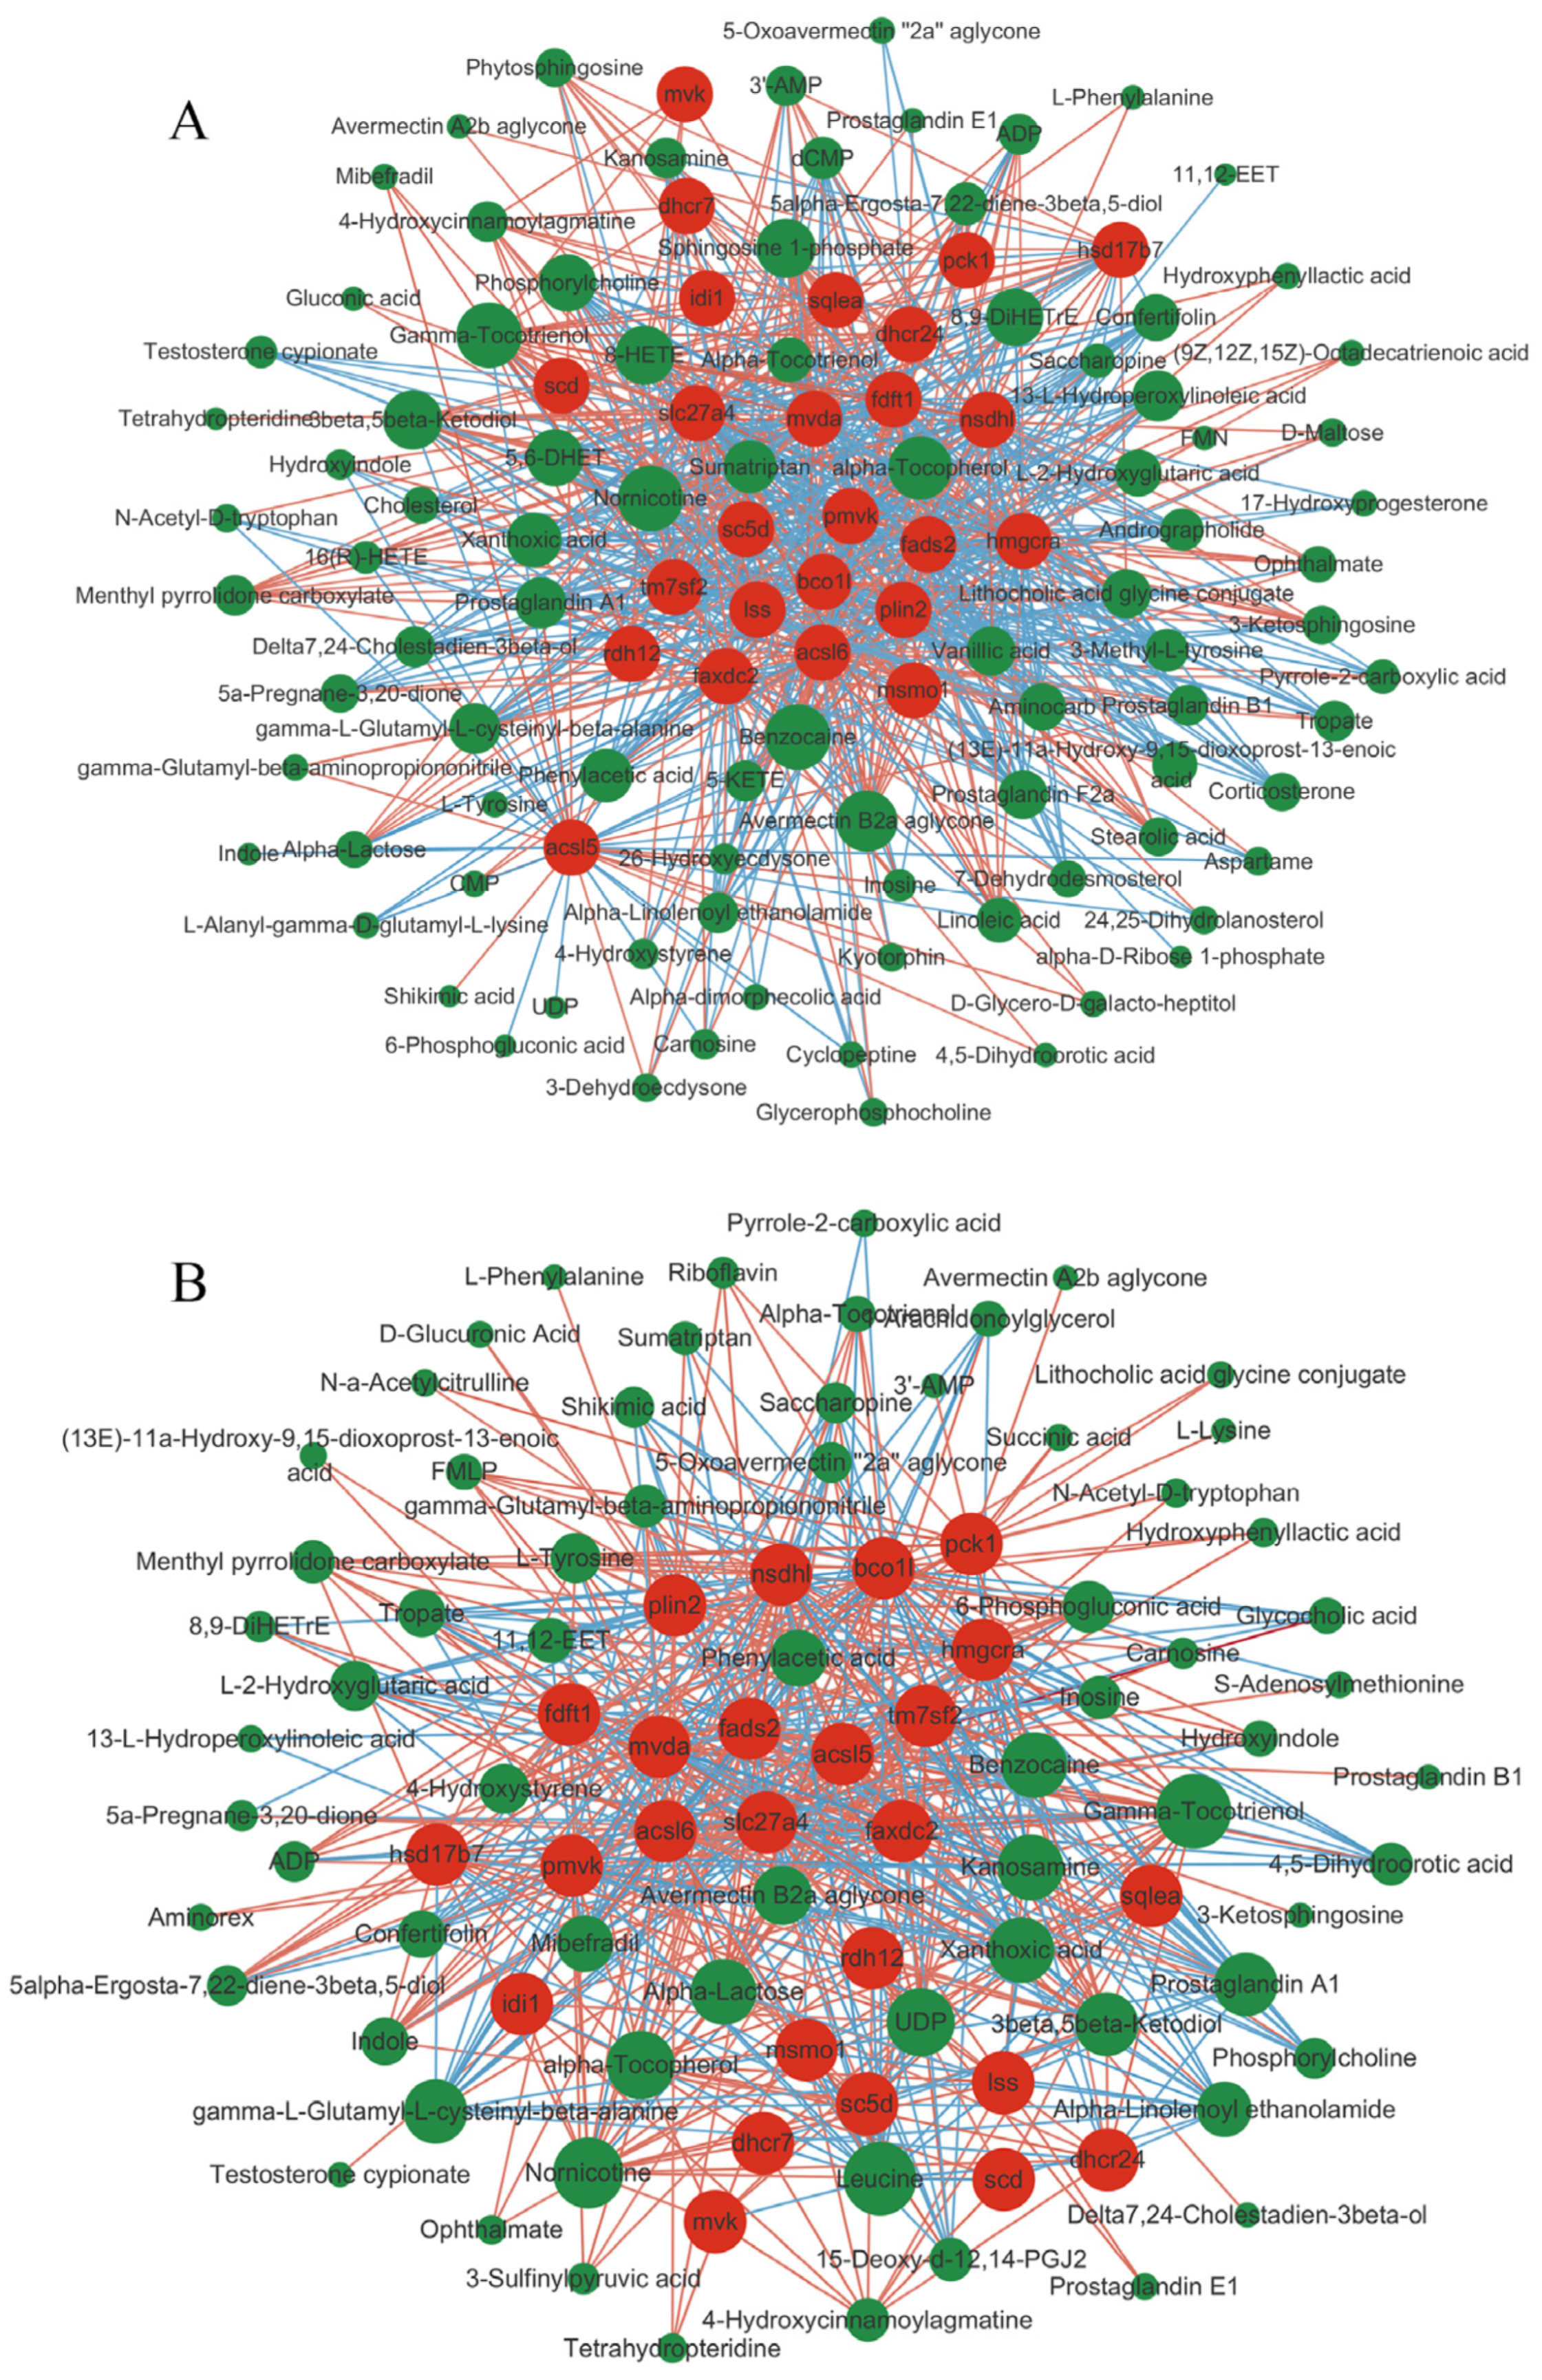
Correlation network diagrams were constructed for genes and metabolites with |correlation coefficients| > 0.8 and p < 0.05 to visualise the correlation between genes and metabolites (Figure 8). A combined analysis involving the results of the C vs. L and C vs. M comparison groups showed that gamma-tocotrienol, nornicotine, alpha-tocopherol, benzocaine, xanthoxic acid, 3beta,5beta-ketodiol, gamma-L-glutamyl-L-cysteinyl-beta-alanine, prostaglandin A1, avermectin B2a aglycone, and phenylacetic acid were the top 10 substances that were highly influenced by the key candidate genes and acted as key nodes in the correlation network diagram, with several key genes showing significant correlation in the correlation network graph.

4. Discussion

The liver, as one of the most important tissues in energy metabolism, participates in different metabolic pathways, such as carbohydrates, lipids, and proteins, in the animal body and plays a critical role in balancing homeostasis and immune defence [19]. Herein, a series of DEGs and DMs were obtained from the C vs. L and C vs. M comparison groups via transcriptome sequencing and metabolomic analysis of the S. chuatsi liver tissues under three feeding regimens. Additionally, we identified several metabolic pathways that may be associated with the adaptation of S. chuatsi to ingesting compound feed.

4.1. Key Genes and Metabolic Pathways Based on Transcriptome Analysis

Transcriptome sequencing revealed that DEGs were involved in amino acid, lipid, and carbohydrate metabolism pathways. Pathways that were significantly upregulated in group C included steroid biosynthesis, terpenoid backbone biosynthesis, and retinol metabolism. The steroid biosynthetic pathway plays a crucial role in regulating lipid metabolism, cell membrane stability, and hormone synthesis [20]. Terpenoid backbone biosynthesis provides rich precursors for complex secondary metabolite synthesis [21], mostly manifested in terms of influencing stress in fish [22,23]. However, differences in diet composition can result in alterations in this pathway [24]. Collectively, these two pathways regulate cholesterol synthesis and influence its efficiency via substrate supply and feedback regulation mechanisms. Cholesterol is a bile acids (BAs) precursor, which facilitates appetite regulation and digestion by promoting fat absorption and stimulating intestinal hormone secretion [25]. Additionally, it plays a role in glucose and metabolic regulation.
Herein, the gene expression levels involved in steroid biosynthesis, such as fdft1, dhcr7, and dhcr24, were markedly higher in group C. One of these genes, fdft1, encodes a squalene synthase that catalyses the conversion of two farnesyl pyrophosphate (FPP) molecules into squalene, a crucial initiating step in sterol biosynthesis [26]. Additionally, dhcr7 and dhcr24 are terminal enzymes involved in cholesterol synthesis [27,28]. Genes such as hmgcra, pmvk, and mvk in the terpenoid backbone biosynthesis pathway were upregulated in the C group. hmgcr is a rate-limiting enzyme in cholesterol biosynthesis and is responsible for reducing 3-hydroxy-3-methylglutaryl coenzyme A (HMG-CoA) to form mevalonate (MVA). mvk catalyses MVA phosphorylation to produce mevalonate 5-phosphate (MVA-5P), and is considered a potential regulatory enzyme of the isoprenoid biosynthetic pathway [29]. Additionally, pmvk catalyses the conversion of mevalonate 5-phosphate (MVA-5P) to MVA-5PP. The upregulated gene expression involved in the steroid biosynthesis and terpenoid backbone biosynthesis pathways promotes cholesterol production and bile acid secretion. BAs promote fat emulsification, digestion, and absorption, and improve fat utilisation and conversion in fish feed. Furthermore, diets containing relatively high carbohydrate levels usually promote the conversion of glucose to lipids such as fatty acids and cholesterol via unsaturated fatty acid biosynthesis, steroid biosynthesis, and cholesterol–butyrate metabolism pathways in aquatic animals [30]. Compared to live food, compound feed often necessitates the incorporation of appropriate amounts of starch as a binder. Enhanced steroid biosynthesis and terpenoid backbone biosynthesis pathways contribute to increased carbohydrate utilisation in the feed. Similar to our findings, Li et al. found that the expression level of the steroid biosynthetic pathway was increased in the artificial diet group by a combined miRNA–mRNA analysis of S. chuatsi fed live food and an artificial diet [31]. In Asian seabass (Lates calcarifer), the steroid biosynthesis pathway was considerably enriched in the pelleted feed group compared to that in the chilled fish group [32]. The enhancement of lipid metabolism-related pathways, such as terpenoid backbone biosynthesis, steroid biosynthesis, and fatty acid biosynthesis, promotes the acceptance of an artificial diet in largemouth bass [33].
Visual ability plays a crucial role in the predator behaviour of fish. S. chuatsi possesses relatively poor visual acuity, an inability to target quickly, and difficulty in ingesting stationary feeds, which have resulted in increased difficulties in domesticating them [2,34]. Significantly higher levels of retinol, 9-cis-retinol, and 11-cis-retinol metabolites have previously been found in individuals consuming artificial diets compared to S. chuatsi that do not eat artificial diets [15]. In the present study, beta-carotene oxygenase 1-like (bco1l) and retinol dehydrogenase 12 (rdh12) genes involved in the retinol metabolism pathway were significantly upregulated in group C. Furthermore, retinol dehydrogenases (rdhs) influence physiological functions such as vision, growth, and development in fish by catalysing the reduction of all-trans retinaldehyde to all-trans retinol (vitamin A) [35,36,37]. Similar to our findings, the gene expression levels of rdh8 were markedly upregulated in S. chuatsi that ingested dead food compared to those that did not [38]. According to the miRNA-seq findings, S. chuatsi fed artificial diets were highly enriched in the retinol metabolic pathway, with significantly higher expression levels of rdh11 [31].

4.2. Key Metabolites and Metabolic Pathways Based on Metabolome Analysis

Metabolomic analyses revealed that DMs in the C vs. L and C vs. M comparison groups were significantly enriched in the KEGG pathways for linoleic acid metabolism (upregulation of linoleic acid, alpha-dimorphecolic acid, and downregulation of 13-L-hydroperoxylinoleic acid), arachidonic acid metabolism (upregulation of 5-KETE, 8-HETE, and downregulation of 11,12-EET, 5,6-DHET), oxidative phosphorylation (ADP and succinic acid were upregulated), and the PPAR signalling pathway (alpha-dimorphecolic acid and 8-HETE were upregulated). Linoleic acid (LA) is primarily found in vegetable oils and cannot be endogenously synthesised, making it an essential fatty acid. It has various biological activities, including hypolipidemic effects, cell growth promotion, and regulation of lipid metabolism and immunity. Linoleic acid metabolism promotes fatty acid transport and oxidation and contributes to fat metabolism and energy balance; its metabolites can further participate in fatty acid synthesis and catabolic processes [39]. Arachidonic acid (ARA) is synthesised from LA via a multistep enzymatic reaction and plays crucial roles in different physiological processes such as growth, reproduction, stress resistance, pigmentation, immunity, lipid deposition, and skeletal development in fish [40,41]. It generates various active metabolites, such as epoxyeicosatrienoic acids (EETs), hydroxyeicosatetraenoic acids (HETEs), and prostaglandins (PGs) via three metabolic pathways regulated by cyclooxygenases (COX), lipoxygenases (LOX), and cytochromeP450 (CYP450), respectively [42]. EETs exhibit vasodilatory, anti-inflammatory, and antioxidant effects and are metabolised by soluble epoxide hydrolase (sEH) to less active DHETs [43]. HETEs primarily play a role in regulating vasoconstriction, vasodilation, and vascular remodelling [44]. The substantial LA accumulation and its derivative alpha-dimorphecolic acid in group C in the present study may be owing to the addition of nutrients containing LA to the feed. Additionally, 5-KETE, as a pro-inflammatory mediator, induces inflammation and oxidative stress, which was upregulated in the C group. Downregulation of 11,12-EET and 5,6-DHET may have led to the diminished anti-inflammatory and antioxidant capacities in group C. In the present study, liver tissue sections of S. chuatsi revealed that the livers in group C had the greatest damage, with a slightly irregular liver cell morphology, a sparser cellular arrangement, and an increase in vacuoles. This phenomenon may have resulted from an elevated hepatic metabolic burden induced by lipids and carbohydrates in the compounded feed, which impairs hepatocyte function, upregulates pro-inflammatory and pro-oxidant metabolites, and downregulates anti-inflammatory and antioxidant metabolites. An increase in reactive oxygen species (ROS) disrupts the lysosomal membrane, which increases the permeability of the lysosomal membrane, and proteases are released into the cytoplasm, resulting in apoptosis or damage to the hepatocytes, nuclear consolidation, and lysis [45]. These metabolites play a crucial role in regulating inflammation and oxidative stress, which can reflect the organism’s physiological state and S. chuatsi’s adaptive metabolic response to compound feed ingestion.
LA and ARA are polyunsaturated fatty acid (PUFA), and their metabolism is regulated by lipid metabolism, which is closely associated with dietary lipid structure and energy supply. The addition of appropriate amounts of essential fatty acids, such as ARA and LA, to diets can help regulate lipid metabolism in fish and improve production performance and feed utilisation efficiency [46,47]. When diets are deficient in LA or ARA, aquatic animals experience stunted growth, decreased feed intake, and reduced immunity. Diets with an appropriate ratio of α-linolenic acid (α-LNA) to LA (0.94) substantially increased fatty acid (FA) metabolism in the S. chuatsi liver, thereby promoting PUFA deposition, which includes ARA deposition [48]. Conjugated linoleic acid (CLA) is a general term for a mixture of all stereo and positional isomers of LA, and the addition of moderate amounts of CLA to diets improves the growth performance, non-specific immunity, and hepatic antioxidant capacity of large yellow croaker (Larmichthys crocea) [49]. Metabolomic analysis of grass carp (Ctenopharyngodon idellus) fed various diets showed substantial differences in arachidonic acid and steroid hormone metabolism pathways between the artificial and grass feed groups [50]. Another study on grass carp revealed that the inclusion of appropriate ARA (0.30%) in the diet improved feed utilisation efficiency, effectively inhibited lipid accumulation, and downregulated key gene expression involved in lipogenesis [51]. The addition of moderate ARA levels to the diet considerably improves growth performance and immune response in juvenile Japanese seabass (Lateolabrax japonicus) [52]. Thus, the addition of appropriate ARA and LA amounts to the compound feed helps S. chuatsi feed on this diet.

4.3. Combined Multi-Omics Analysis of Pathways

The PPAR signalling pathway was identified in the transcriptome and metabolome as being significantly enriched, and may be a key pathway influencing the dietary domestication of S. chuatsi. The PPAR signalling pathway controls lipid homeostasis in organisms and is crucial for regulating cell differentiation, energy homeostasis, and lipid metabolism [53,54]. The plin2, pck1, scd, and fads2 genes in this pathway were all upregulated in group C, whereas the acsl5 and acsl6 genes were downregulated in group C. DEGs between artificial feed and live food feeding were found to be significantly enriched, mainly in the glycolysis/gluconeogenesis and PPAR signalling pathways, in a transcriptomic study of S. chuatsi intestinal tissues [55]. plin2 is a lipid droplet protein linked to lipid metabolism in the liver and is involved in lipid droplet formation and intracellular triglyceride accumulation in the liver and peripheral tissues, thereby promoting fat deposition [56,57]. plin2 gene expression was increased in the S. chuatsi liver after feeding with high-starch diets [58]. In the present study, the plin2 gene upregulation in group C may be due to the addition of starch as a binder to the feed. This further promotes its conversion to fat and may be one of the causes of fat accumulation in the liver. pck1 is a key rate-limiting enzyme in the gluconeogenesis pathway and is responsible for catalysing the conversion of oxaloacetate (OAA) to phosphoenolpyruvate (PEP), which promotes glucose synthesis [59]. Downregulation or deletion of the pck1 gene promotes steatosis by increasing lipid deposition, and induces liver fibrosis [60]. S. chuatsi, a carnivorous fish, demonstrates poor sugar utilisation, and high-starch diets may result in liver fat deposition. You et al. found that the expression level of pck1 was lower in the livers of fish stably ingesting artificial diets than in S. chuatsi, which was anorexic to artificial diets [61]. Liu et al. also found that the expression level of the pck1 gene in the liver of S. chuatsi in an easily domesticated feed group was significantly lower than that in a non-easily domesticated feed group [62]. The results of the above studies are different from ours; in the present study, the upregulated expression of the pck1 gene was beneficial for maintaining glycolipid homeostasis in S. chuatsi under feed-fed conditions by enhancing the gluconeogenic pathway to alleviate lipid deposition.
A key rate-limiting enzyme that catalyses the conversion of saturated fatty acids (SFA) to monounsaturated fatty acids (MUFA) is scd, which plays a key role in regulating liver lipogenesis and lipid oxidation in fish [63,64]. In a previous study, the expression level of the scd1 gene was higher in the livers of S. chuatsi fed artificial diets than in those fed live food [65]. Compared to the live food, the proportion of saturated fatty acids (e.g., stearic acid and palmitic acid) is higher in compound feeds, thus necessitating scd gene upregulation to generate more monounsaturated fatty acids (e.g., oleic acid and palmitoleic acid). Live food, being rich in proteins and natural lipids, promotes greater reliance on β-oxidation rather than lipogenesis in S. chuatsi, leading to relatively low scd expression levels. fads2 is a key enzyme involved in long-chain polyunsaturated fatty acids (LC-PUFA) biosynthesis, and its activity determines the LC-PUFA biosynthetic capacity of scleractinian fish [66]. It is primarily responsible for catalysing the conversion of LA and α-LNA to longer-chain ARA and eicosapentaenoic acid (EPA). In live food which is usually enriched with n-3 LC-PUFAs, S. chuatsi can directly absorb and utilise these compounds, possibly decreasing the requirement for fads2 expression. In compound feeds, vegetable oils (e.g., soybean oil and canola oil) are usually used as the primary fat source, which are rich in C18 PUFAs (LA and ALA) but lack EPA and DHA. Furthermore, they require upregulated expression of the fads2 gene for transformation. In gilthead seabream (Sparus aurata), the progeny of parents with high fads2 expression demonstrated better growth performance and utilisation of low n-3 LC-PUFA diets than the progeny of parents with low fads2 expression [67]. Thus, the growth performance and adaptability to compound feeds of S. chuatsi were improved by scd and fads2 upregulation. A key enzyme that regulates the initial steps of lipid metabolism is acsl, which has five isoforms, acsl1, acsl3, acsl4, acsl5, and acsl6. Among them, acsl5 is situated in the endoplasmic reticulum and mitochondrial outer membrane and catalyses fatty acyl coenzyme A (acyl-CoA) formation from long-chain fatty acids (LCFAs), which is subsequently used in lipid synthesis or β-oxidation-mediated pathways [68]. The inhibition of acsl5 expression markedly decreased FA-induced lipid droplet formation and promoted fatty acid oxidation [69]. When gut-specific acsl5-induced knockout mice are fed high-fat diets, they experience rapid and sustained protection against body fat accumulation, mainly because of decreased energy intake caused by increased satiety signalling [70]. The acsl6 gene drives acyl-CoA for lipid synthesis, and its downregulation improves mitochondrial biogenesis, respiratory capacity, and lipid oxidation [71]. In mouse skeletal muscle, acsl6 downregulation increases glucose homeostasis [72]. Herein, S. chuatsi in group C decreased lipid deposition by downregulating the expression of acsl5 and acsl6, thereby preventing fatty liver.

5. Conclusions

In this study, we performed integrated transcriptomic and metabolomic analyses of S. chuatsi liver tissues under three feeding regimes. It was found that the DEGs associated with feed adaptation in S. chuatsi were primarily involved in steroid biosynthesis, terpenoid backbone biosynthesis, and retinol metabolism, including genes such as sqlea, hmgcra, and rdh12. The DMs associated with feed adaptation in S. chuatsi were primarily involved in linoleic acid and arachidonic acid metabolism, including metabolites such as linoleic acid, 5-KETE, and 8-HETE. The PPAR signalling pathway was significantly enriched in both omics analyses, involving genes such as fads2, plin2, and acsl5. The identified genes, metabolites, and pathways may play an important role in the adaptation of S. chuatsi to compound feed, and this study has provided novel evidence and ideas for further research on the domestication of S. chuatsi from the molecular level.

Supplementary Materials

The following supporting information can be downloaded at: https://www.mdpi.com/article/10.3390/fishes10080379/s1, Table S1: Primer sequence information table; Table S2: Sample comparison statistics; Table S3: Key metabolites, genes, and pathways associated with feed adaptation in S. chuatsi revealed through transcriptomic and metabolomic analyses; Table S4: Top 20 significant gene–metabolite relationship pairs in group C vs. L; Table S5: Top 20 significant gene–metabolite relationship pairs in group C vs. M; Figure S1: PCA of liver transcriptomes in S. chuatsi under three feeding practices; Figure S2: Venn diagram of shared and unique DEGs across comparison groups; Figure S3: Venn diagram of shared and unique pathways in C vs. L and C vs. M groups; Figure S4: PCA score plots under positive (A) and negative (B) ionisation modes; Figure S5: OPLS-DA score plots under positive (A) and negative (B) ionisation modes; Figure S6: OPLS-DA permutation test diagrams under positive (A) and negative (B) ionisation modes; Figure S7: Volcano diagram of DMs; Figure S8: Venn diagram of shared and unique DMs across comparison groups; Figure S9: Venn diagram of shared and unique pathways in C vs. L and C vs. M groups; Figure S10: Correlation clustering heatmap.

Author Contributions

Conceptualisation, C.W. and C.S.; methodology, Y.Y., J.D., H.Z., F.G., C.W., and C.S.; software, Y.Z.; validation, Y.Z., J.D., and H.Z.; formal analysis, Y.Y. and Y.Z.; investigation, Y.Y. and F.W.; resources, F.W., F.G., and X.Y.; data curation, Y.Y., Y.Z., J.D., F.W. and H.Z.; writing—original draft preparation, Y.Y.; writing—review and editing, C.W. and C.S.; visualisation, Y.Y.; supervision, X.Y.; project administration, F.G. and X.Y.; funding acquisition, C.S. All authors have read and agreed to the published version of the manuscript.

Funding

This research was funded by the National Key R&D Program of China (2024YFD2401500, 2023YFD2402900), Guangdong Provincial Natural Science Foundation General Project (2023A1515011543), Central Public-interest Scientific Institution Basal Research Fund, CAFS (No.2023TD95), China Agriculture Research System of MOF and MARA (CARS-46), Guangdong Province Modern Agricultural Industry Technology System (Freshwater Fish System) Innovation Team Construction Project (2024CXTD26), National Natural Science Foundation of China (No. 32002385, 32303030), and Guangdong Rural Science and Technology Special Envoy Project (KTP20240752).

Institutional Review Board Statement

All experimental procedures and sample collection were approved by the Ethics Committee for Animal Experiments of the Pearl River Fisheries Research Institute, Chinese Academy of Fisheries Sciences (Approval Code: LAEC-PRFRI-2024-10-01; Approval Date: 10 October 2024).

Data Availability Statement

The clean reads of transcriptome and metabolome data have been deposited in the China National Center for Bioinformation (CNCB) with the BioProject number of PRJCA040218.

Conflicts of Interest

Fubao Wang, working at Guangdong Special Aquatic Functional Feed Engineering Technology Research Center, Foshan Nanhai Jieda Feed Company, Ltd., declares no conflict of interest. The other authors declare no conflicts of interest. This conflict of interest does not influence the results.

References

  1. Ministry of Agriculture and Rural Affairs. China Fishery Statistics Yearbook; China Agriculture Press: Beijing, China, 2024; p. 25. [Google Scholar]
  2. Liang, X.F.; Liu, J.K.; Huang, B.Y. The role of sense organs in the feeding behaviour of Chinese perch. J. Fish Biol. 1998, 52, 1058–1067. [Google Scholar] [CrossRef]
  3. He, S.; Li, L.; Lv, L.Y.; Cai, W.J.; Dou, Y.Q.; Li, J.; Tang, S.L.; Chen, X.; Zhang, Z.; Xu, J.; et al. Mandarin fish (Sinipercidae) genomes provide insights into innate predatory feeding. Commun. Biol. 2020, 3, 361. [Google Scholar] [CrossRef]
  4. Liang, X.F.; Lin, X.T.; Li, S.Q.; Liu, J.K. Impact of environmental and innate factors on the food habit of Chinese perch Siniperca chuatsi (Basilewsky) (Percichthyidae). Aquac. Res. 2008, 39, 150–157. [Google Scholar] [CrossRef]
  5. Shen, Y.W.; Li, H.Y.; Zhao, J.L.; Tang, S.J.; Zhao, Y.; Bi, Y.H.; Chen, X.W. The digestive system of mandarin fish (Siniperca chuatsi) can adapt to domestication by feeding with artificial diet. Aquaculture 2021, 538, 736546. [Google Scholar] [CrossRef]
  6. Dou, Y.Q.; He, S.; Liang, X.F.; Cai, W.J.; Wang, J.; Shi, L.J.; Li, J. Memory Function in Feeding Habit Transformation of Mandarin Fish (Siniperca chuatsi). Int. J. Mol. Sci. 2018, 19, 1254. [Google Scholar] [CrossRef] [PubMed]
  7. Fang, W.; Leng, X.J.; Yun, B.; Wang, L.; Qian, X.Q. Artificial diets affect glucose and lipid metabolism, antioxidant capacity, and inflammatory response in the muscle of mandarin fish (Siniperca chuatsi). Front. Mar. Sci. 2024, 11, 1445902. [Google Scholar] [CrossRef]
  8. Li, Y.; Shi, J.H.; Shi, S.C.; Liu, Z.J.; Li, Z.; Li, J.Z. Effect of Live, Frozen and Artificial Feeds on Digestive Enzymes, Aminotransferase, Histology of Liver and Intestine in Mandarin Fish Hybrid (Siniperca chuatsi ♀ x Siniperca scherzeri ♂). Isr. J. Aquac.-Bamidgeh 2015, 67, 1185. [Google Scholar] [CrossRef]
  9. Cui, J.; Jiang, Z.; Wang, Z.R.; Shao, J.Q.; Dong, C.J.; Wang, L.; Li, X.J.; Du, J.X.; Li, S.J.; Qiao, Z.G.; et al. Eight single nucleotide polymorphisms and their association with food habit domestication traits and growth traits in largemouth bass fry (Micropterus salmoides) based on PCR-RFLP method. PeerJ 2023, 11, e14588. [Google Scholar] [CrossRef]
  10. He, S.; Liang, X.F.; Li, L.; Sun, J.; Wen, Z.Y.; Cheng, X.Y.; Li, A.X.; Cai, W.J.; He, Y.H.; Wang, Y.P.; et al. Transcriptome analysis of food habit transition from carnivory to herbivory in a typical vertebrate herbivore, grass carp Ctenopharyngodon idella. BMC Genom. 2015, 16, 15. [Google Scholar] [CrossRef]
  11. Li, L.; He, S.; Lin, M.H.; Zhang, Y.P.; Kuhl, H.; Liang, X.F. Whole-genome resequencing and bisulfite sequencing provide new insights into the feeding habit domestication in mandarin fish (Siniperca chuatsi). Front. Genet. 2023, 13, 1088081. [Google Scholar] [CrossRef]
  12. Shen, Y.W.; Song, L.Y.; Chen, T.T.; Jiang, H.W.; Yang, G.K.; Zhang, Y.M.; Zhang, X.D.; Lim, K.K.; Meng, X.L.; Zhao, J.L.; et al. Identification of hub genes in digestive system of mandarin fish (Siniperca chuatsi) fed with artificial diet by weighted gene co-expression network analysis. Comp. Biochem. Physiol. D-Genom. Proteom. 2023, 47, 101112. [Google Scholar] [CrossRef] [PubMed]
  13. Li, L.; Tang, S.L.; He, S.; Liang, X.F. Transcriptome Analysis Provides an Overview of Genes Involved in the Peculiar Food Preference at First-Feeding Stage in Mandarin Fish (Siniperca chuatsi). Fishes 2023, 8, 17. [Google Scholar] [CrossRef]
  14. Yi, T.L.; Sun, J.; Liang, X.F.; He, S.; Li, L.; Wen, Z.Y.; Shen, D. Effects of Polymorphisms in Pepsinogen (PEP), Amylase (AMY) and Trypsin (TRY) Genes on Food Habit Domestication Traits in Mandarin Fish. Int. J. Mol. Sci. 2013, 14, 21504–21512. [Google Scholar] [CrossRef] [PubMed]
  15. He, S.; You, J.J.; Liang, X.F.; Zhang, Z.L.; Zhang, Y.P. Transcriptome sequencing and metabolome analysis of food habits domestication from live prey fish to artificial diets in mandarin fish (Siniperca chuatsi). BMC Genom. 2021, 22, 129. [Google Scholar] [CrossRef]
  16. Li, H.Q.; Li, W.H.; Su, J.S.; Zhou, Z.X.; Miao, Y.; Tian, X.L.; Tao, M.; Zhang, C.; Zhou, Y.; Qin, Q.B.; et al. Integration of transcriptome and metabolome reveals molecular mechanisms responsive to cold stress in gynogenetic mrigal carp (Cirrhinus mrigala). Aquaculture 2024, 579, 740200. [Google Scholar] [CrossRef]
  17. Wang, J.; Wang, S.P.; Zhang, J.W.; Zhu, C.H.; Chen, S.L.; Zhou, Q. Integrated transcriptomic and metabolomic analysis provides insights into the responses to Vibrio infection in Plectropomus leopardus. Aquaculture 2024, 587, 740854. [Google Scholar] [CrossRef]
  18. Wang, J.A.; Hou, X.; Chen, X.W.; Zhang, K.J.; Wang, J.; Wang, C.H. Comprehensive analysis of metabolomics and transcriptomics provides insights into growth difference of juvenile Eriocheir sinensis during the molting cycle. Aquaculture 2021, 539, 736661. [Google Scholar] [CrossRef]
  19. Mitra, V.; Metcalf, J. Metabolic functions of the liver. Anaesth. Intensiv. Care Med. 2012, 13, 54–55. [Google Scholar] [CrossRef]
  20. Schiffer, L.; Barnard, L.; Baranowski, E.S.; Gilligan, L.C.; Taylor, A.E.; Arlt, W.; Shackleton, C.H.L.; Storbeck, K.H. Human steroid biosynthesis, metabolism and excretion are differentially reflected by serum and urine steroid metabolomes: A comprehensive review. J. Steroid Biochem. Mol. Biol. 2019, 194, 105439. [Google Scholar] [CrossRef]
  21. Si, Y.F.; Wen, H.S.; Li, Y.; He, F.; Li, J.F.; Li, S.P.; He, H.W. Liver transcriptome analysis reveals extensive transcriptional plasticity during acclimation to low salinity in Cynoglossus semilaevis. BMC Genom. 2018, 19, 464. [Google Scholar] [CrossRef]
  22. Shi, K.P.; Dong, S.L.; Zhou, Y.G.; Li, Y.; Gao, Q.F.; Sun, D.J. RNA-seq reveals temporal differences in the transcriptome response to acute heat stress in the Atlantic salmon (Salmo salar). Comp. Biochem. Physiol. D-Genom. Proteom. 2019, 30, 169–178. [Google Scholar] [CrossRef]
  23. Zhou, T.J.; Jia, C.F.; Meng, Q.; Xu, D.F.; Zhang, Z.W.; Zhu, F.; Zhao, Y.L.; Sun, R.J.; Yang, Y.X.; Chen, S.Y. Transcriptome-based analysis of the liver response mechanism of black porgy (Acanthopagrus schlegelii) to stocking density. Fishes 2023, 8, 356. [Google Scholar] [CrossRef]
  24. Wei, L.; Li, Y.; Ye, H.Z.; Xiao, J.; Hogstrand, C.; Green, I.; Guo, Z.Q.; Han, D. Dietary Trivalent Chromium Exposure Up-Regulates Lipid Metabolism in Coral Trout: The Evidence From Transcriptome Analysis. Front. Physiol. 2021, 12, 640898. [Google Scholar] [CrossRef] [PubMed]
  25. Kuhre, R.E.; Wewer Albrechtsen, N.J.; Larsen, O.; Jepsen, S.L.; Balk-Møller, E.; Andersen, D.B.; Deacon, C.F.; Schoonjans, K.; Reimann, F.; Gribble, F.M.; et al. Bile acids are important direct and indirect regulators of the secretion of appetite- and metabolism-regulating hormones from the gut and pancreas. Mol. Metab. 2018, 11, 84–95. [Google Scholar] [CrossRef]
  26. Wang, Y.J.; Rogers, P.M.; Su, C.; Varga, G.; Stayrook, K.R.; Burris, T.P. Regulation of cholesterologenesis by the oxysterol receptor, LXRα. J. Biol. Chem. 2008, 283, 26332–26339. [Google Scholar] [CrossRef] [PubMed]
  27. Prabhu, A.V.; Luu, W.; Sharpe, L.J.; Brown, A.J. Phosphorylation regulates activity of 7-dehydrocholesterol reductase (DHCR7), a terminal enzyme of cholesterol synthesis. J. Steroid Biochem. Mol. Biol. 2017, 165, 363–368. [Google Scholar] [CrossRef] [PubMed]
  28. Luu, W.; Zerenturk, E.J.; Kristiana, I.; Bucknall, M.P.; Sharpe, L.J.; Brown, A.J. Signaling regulates activity of DHCR24, the final enzyme in cholesterol synthesis. J. Lipid Res. 2013, 55, 410–420. [Google Scholar] [CrossRef]
  29. Lluch, M.A.; Masferrer, A.; Arró, M.; Boronat, A.; Ferrer, A. Molecular cloning and expression analysis of the mevalonate kinase gene from Arabidopsis thaliana. Plant Mol. Biol. 2000, 42, 365–376. [Google Scholar] [CrossRef]
  30. Zhao, L.L.; Liao, L.; Tang, X.H.; Liang, J.; Liu, Q.; Luo, W.; Adam, A.A.; Luo, J.; Li, Z.Q.; Yang, S.; et al. High-carbohydrate diet altered conversion of metabolites, and deteriorated health in juvenile largemouth bass. Aquaculture 2022, 549, 737816. [Google Scholar] [CrossRef]
  31. Li, H.Y.; Niu, S.H.; Pan, H.J.; Wang, G.J.; Xie, J.; Tian, J.J.; Zhang, K.; Xia, Y.; Li, Z.F.; Yu, E.M.; et al. Integrated miRNA-mRNA analysis reveals the molecular mechanism in mandarin fish (Siniperca chuatsi) in response to fresh baits and artificial diets feeding. Aquacult. Rep. 2023, 30, 101554. [Google Scholar] [CrossRef]
  32. Ngoh, S.Y.; Tan, D.; Shen, X.Y.; Kathiresan, P.; Jiang, J.H.; Liew, W.C.; Thevasagayam, N.M.; Kwan, H.Y.; Saju, J.M.; Prakki, S.R.S.; et al. Nutrigenomic and Nutritional Analyses Reveal the Effects of Pelleted Feeds on Asian Seabass (Lates calcarifer). PLoS ONE 2015, 10, e0145456. [Google Scholar] [CrossRef]
  33. Du, J.X.; Shao, J.Q.; Li, S.J.; Zhu, T.; Song, H.M.; Lei, C.X.; Zhang, M.; Cen, Y.K. Integrated transcriptomic and proteomic analyses reveal the mechanism of easy acceptance of artificial pelleted diets during food habit domestication in Largemouth bass (Micropterus salmoides). Sci. Rep. 2023, 13, 18461. [Google Scholar] [CrossRef] [PubMed]
  34. Zhang, R.Q.; Hao, Y.Y.; Song, Y.D.; Zhao, J.L. Predation behavior of mandarin fish (Siniperca chuatsi) regulated by visual and lateral line sensory. J. Fish. Sci. China 2022, 27, 1136–1144. (In Chinese) [Google Scholar]
  35. Lhor, M.; Salesse, C. Retinol dehydrogenases: Membrane-bound enzymes for the visual function. Biochem. Cell Biol. 2014, 92, 510–523. [Google Scholar] [CrossRef] [PubMed]
  36. Chen, C.H.; Thompson, D.A.; Koutalos, Y. Reduction of all-trans-retinal in vertebrate rod photoreceptors requires the combined action of RDH8 and RDH12. J. Biol. Chem. 2012, 287, 24662–24670. [Google Scholar] [CrossRef]
  37. Sarkar, H.; Moosajee, M. Retinol dehydrogenase 12 (RDH12): Role in vision, retinal disease and future perspectives. Exp. Eye Res. 2019, 188, 107793. [Google Scholar] [CrossRef]
  38. He, S.; Liang, X.F.; Sun, J.; Li, L.; Yu, Y.; Huang, W.; Qu, C.M.; Cao, L.; Bai, X.L.; Tao, Y.X. Insights into food preference in hybrid F1 of Siniperca chuatsi (♀) x Siniperca scherzeri (♂) mandarin fish through transcriptome analysis. BMC Genom. 2013, 14, 601. [Google Scholar] [CrossRef]
  39. House, R.L.; Cassady, J.P.; Eisen, E.J.; McIntosh, M.K.; Odle, J. Conjugated linoleic acid evokes de-lipidation through the regulation of genes controlling lipid metabolism in adipose and liver tissue. Obes. Rev. 2005, 6, 247–258. [Google Scholar] [CrossRef]
  40. Xu, H.G.; Meng, X.X.; Wei, Y.L.; Ma, Q.; Liang, M.Q.; Turchini, G.M. Arachidonic acid matters. Rev. Aquac. 2022, 14, 1912–1944. [Google Scholar] [CrossRef]
  41. Bell, J.G.; Sargent, J.R. Arachidonic acid in aquaculture feeds: Current status and future opportunities. Aquaculture 2003, 218, 491–499. [Google Scholar] [CrossRef]
  42. Wang, B.; Wu, L.J.; Chen, J.; Dong, L.L.; Chen, C.; Wen, Z.; Hu, J.; Fleming, I.; Wang, D.W. Metabolism pathways of arachidonic acids: Mechanisms and potential therapeutic targets. Signal Transduct. Target. Ther. 2021, 6, 94. [Google Scholar]
  43. Fleming, I. Cytochrome p450 enzymes and vascular homeostasis. Circ. Res. 2001, 89, 753–762. [Google Scholar] [CrossRef] [PubMed]
  44. Oltman, C.L.; Weintraub, N.L.; VanRollins, M.; Dellsperger, K.C. Epoxyeicosatrienoic Acids and Dihydroxyeicosatrienoic Acids Are Potent Vasodilators in the Canine Coronary Microcirculation. Circ. Res. 1998, 83, 932–939. [Google Scholar] [CrossRef] [PubMed]
  45. Guo, J.S.; Wu, P.H.; Cao, J.L.; Luo, Y.J.; Chen, J.J.; Wang, G.D.; Guo, W.J.; Wang, T.Y.; He, X.J. The PFOS disturbed immunomodulatory functions via nuclear Factor-κB signaling in liver of zebrafish (Danio rerio). Fish Shellfish Immunol. 2019, 91, 87–98. [Google Scholar] [CrossRef] [PubMed]
  46. Xu, H.G.; Wang, C.Q.; Zhang, Y.Q.; Wei, Y.L.; Liang, M.Q. Moderate levels of dietary arachidonic acid reduced lipid accumulation and tended to inhibit cell cycle progression in the liver of Japanese seabass Lateolabrax japonicus. Sci. Rep. 2018, 8, 10682. [Google Scholar] [CrossRef]
  47. Huang, Y.S.; Lin, Z.D.; Rong, H.; Hao, M.L.; Zhu, D.S.; Li, S.K.; Wen, X.B. Effects of conjugated linoleic acid on growth, body composition, antioxidant status, lipid metabolism and immunity parameters of juvenile Chu’s croaker, Nibea coibor. Aquac. Res. 2018, 49, 546–556. [Google Scholar] [CrossRef]
  48. Li, L.; Liang, X.F.; Cai, W.J.; Li, J.; Zhang, Y.P.; Wang, J.; Huang, K.; Liu, Y.; Zhu, Q.S.; Alam, M.S.; et al. Dietary with proper ratio of alpha-linolenic acid to linoleic acid enhanced the unsaturated fatty acids deposition of Chinese perch (Siniperca Chuatsi). Aquac. Nutr. 2021, 27, 73–85. [Google Scholar] [CrossRef]
  49. Zuo, R.T.; Ai, Q.H.; Mai, K.S.; Xu, W. Effects of conjugated linoleic acid on growth, non-specific immunity, antioxidant capacity, lipid deposition and related gene expression in juvenile large yellow croaker (Larmichthys crocea) fed soyabean oil-based diets. Br. J. Nutr. 2013, 110, 1220–1232. [Google Scholar] [CrossRef]
  50. Zhao, H.H.; Chong, J.; Tang, R.; Li, L.; Xia, J.G.; Li, D.P. Metabolomics investigation of dietary effects on flesh quality in grass carp (Ctenopharyngodon idellus). GigaScience 2018, 7, giy111. [Google Scholar] [CrossRef]
  51. Tian, J.J.; Ji, H.; Oku, H.; Zhou, J.S. Effects of dietary arachidonic acid (ARA) on lipid metabolism and health status of juvenile grass carp, Ctenopharyngodon idellus. Aquaculture 2014, 430, 57–65. [Google Scholar] [CrossRef]
  52. Xu, H.G.; Ai, Q.H.; Mai, K.S.; Xu, W.; Wang, J.; Ma, H.M.; Zhang, W.B.; Wang, X.J.; Liufu, Z.G. Effects of dietary arachidonic acid on growth performance, survival, immune response and tissue fatty acid composition of juvenile Japanese seabass, Lateolabrax japonicus. Aquaculture 2010, 307, 75–82. [Google Scholar] [CrossRef]
  53. Wang, Y.K.; Pan, Y.; Hou, M.R.; Luo, R.S.Q.; He, J.W.; Lin, F.; Xia, X.F.; Li, P.; He, C.X.; He, P.; et al. Danggui Shaoyao San ameliorates the lipid metabolism via the PPAR signaling pathway in a Danio rerio (zebrafish) model of hyperlipidemia. Biomed. Pharmacother. 2023, 168, 115736. [Google Scholar] [CrossRef]
  54. Zhong, H.; Hu, J.; Zhou, Y. Transcriptomic evidence of luteinizing hormone-releasing hormone agonist (LHRH-A) regulation on lipid metabolism in grass carp (Ctenopharyngodon idella). Genomics 2021, 113, 1265–1271. [Google Scholar] [CrossRef]
  55. Luo, J.X.; Gao, X.T.; Rong, Z.; Zhang, L.H.; Sun, Y.F.; Qi, Z.L.; Yu, Q.; Waiho, K.; Zhao, W.X.; Xu, Y.H.; et al. Transcriptome Sequencing Reveals Effects of Artificial Feed Domestication on Intestinal Performance and Gene Expression of Carnivorous Mandarin Fish (Siniperca chuatsi) and Related Mechanisms. Mar. Biotechnol. 2025, 27, 41. [Google Scholar] [CrossRef]
  56. Najt, C.P.; Lwande, J.S.; McIntosh, A.L.; Senthivinayagam, S.; Gupta, S.; Kuhn, L.A.; Atshaves, B.P. Structural and functional assessment of perilipin 2 lipid binding domain(s). Biochemistry 2014, 53, 7051–7066. [Google Scholar] [CrossRef]
  57. Takahashi, Y.; Shinoda, A.; Kamada, H.; Shimizu, M.; Inoue, J.; Sato, R. Perilipin2 plays a positive role in adipocytes during lipolysis by escaping proteasomal degradation. Sci. Rep. 2016, 6, 20975. [Google Scholar] [CrossRef] [PubMed]
  58. Gao, J.J.; Liang, X.F.; Cai, W.J.; Zhuang, W.Y. Bioinformatics and expression analysis of plin2 in Chinese perch (Siniperca Chuatsi) and its role in liver fat accumulation. Acta Hydrobiol. Sin. 2022, 46, 273–281. (In Chinese) [Google Scholar]
  59. Yu, S.; Meng, S.M.; Xiang, M.X.; Ma, H. Phosphoenolpyruvate carboxykinase in cell metabolism: Roles and mechanisms beyond gluconeogenesis. Mol. Metab. 2021, 53, 101257. [Google Scholar] [CrossRef]
  60. Ye, Q.; Liu, Y.; Zhang, G.J.; Deng, H.J.; Wang, X.J.; Tuo, L.; Chen, C.; Pan, X.M.; Wu, K.; Fan, J.G.; et al. Deficiency of gluconeogenic enzyme PCK1 promotes metabolic-associated fatty liver disease through PI3K/AKT/PDGF axis activation in male mice. Nat. Commun. 2023, 14, 1402. [Google Scholar] [CrossRef]
  61. You, J.J.; Ren, P.; He, S.; Liang, X.F.; Xiao, Q.Q.; Zhang, Y.P. Histone Methylation of H3K4 Involved in the Anorexia of Carnivorous Mandarin Fish (Siniperca chuatsi) After Feeding on a Carbohydrate-Rich Diet. Front. Endocrinol. 2020, 11, 323. [Google Scholar] [CrossRef]
  62. Liu, T.; Liang, X.F.; Zhuang, W.Y.; Cai, W.J.; Zhang, Y.P. Association of DNA methylation of pck1 and t1r1 with the food habits of Chinese perch, Siniperca chuatsi. J. Fish. Sci. China 2022, 29, 1064–1072. (In Chinese) [Google Scholar]
  63. Ma, X.Y.; Qiang, J.; He, J.; Gabriel, N.N.; Xu, P. Changes in the physiological parameters, fatty acid metabolism, and SCD activity and expression in juvenile GIFT tilapia (Oreochromis niloticus) reared at three different temperatures. Fish Physiol. Biochem. 2015, 41, 937–950. [Google Scholar] [CrossRef]
  64. Qiang, J.; Tao, Y.F.; Bao, J.W.; Chen, D.J.; Li, H.X.; He, J.; Xu, P. High Fat Diet-Induced miR-122 Regulates Lipid Metabolism and Fat Deposition in Genetically Improved Farmed Tilapia (GIFT, Oreochromis niloticus) Liver. Front. Physiol. 2018, 9, 1422. [Google Scholar] [CrossRef] [PubMed]
  65. Wang, J.J.; Zhang, L.H.; Gao, X.W.; Sun, Y.F.; Zhao, C.L.; Gao, X.T.; Wu, C.B. Molecular Cloning of the scd1 Gene and Its Expression in Response to Feeding Artificial Diets to Mandarin Fish (Siniperca chuatsi). Genes 2024, 15, 1211. [Google Scholar] [CrossRef] [PubMed]
  66. Xie, D.Z.; Ye, J.L.; Lu, M.S.; Wang, S.Q.; You, C.H.; Li, Y.Y. Comparsion of Activities of Fatty Acyl Desaturases and Elongases Among Six Teleosts With Different Feeding and Ecological Habits. Front. Mar. Sci. 2020, 7, 117. [Google Scholar] [CrossRef]
  67. Turkmen, S.; Perera, E.; Zamorano, M.J.; Simó-Mirabet, P.; Xu, H.L.; Pérez-Sánchez, J.; Izquierdo, M. Effects of Dietary Lipid Composition and Fatty Acid Desaturase 2 Expression in Broodstock Gilthead Sea Bream on Lipid Metabolism-Related Genes and Methylation of the fads2 Gene Promoter in Their Offspring. Int. J. Mol. Sci. 2019, 20, 6250. [Google Scholar] [CrossRef]
  68. Luo, Q.; Das, A.; Oldoni, F.; Wu, P.Y.; Wang, J.G.; Luo, F.; Fang, Z.F. Role of ACSL5 in fatty acid metabolism. Heliyon 2023, 9, e13316. [Google Scholar] [CrossRef]
  69. Bu, S.Y.; Mashek, D.G. Hepatic long-chain acyl-CoA synthetase 5 mediates fatty acid channeling between anabolic and catabolic pathways. J. Lipid Res. 2010, 51, 3270–3280. [Google Scholar] [CrossRef]
  70. Griffin, J.D.; Zhu, Y.; Reeves, A.; Buhman, K.K.; Greenberg, A.S. Intestinal Acyl-CoA synthetase 5 (ACSL5) deficiency potentiates postprandial GLP-1 & PYY secretion, reduces food intake, and protects against diet-induced obesity. Mol. Metab. 2024, 83, 101918. [Google Scholar]
  71. Teodoro, B.G.; Sampaio, I.H.; Bomfim, L.H.M.; Queiroz, A.L.; Silveira, L.R.; Souza, A.O.; Fernandes, A.M.A.P.; Eberlin, M.N.; Huang, T.Y.; Zheng, D.H.; et al. Long-chain acyl-CoA synthetase 6 regulates lipid synthesis and mitochondrial oxidative capacity in human and rat skeletal muscle. J. Physiol.-London 2017, 595, 677–693. [Google Scholar] [CrossRef]
  72. Lee, J.Y.; Kim, A.R.; Jung, Y.H.; Bu, S.Y. Dissociation of Systemic Glucose Homeostasis from Triacylglyceride Accumulation by Reduced Acsl6 Expression in Skeletal Muscle. Biotechnol. Bioprocess Eng. 2018, 23, 465–472. [Google Scholar] [CrossRef]
Figure 1. Microstructure of S. chuatsi liver under different feeding regimes. (A) live food group; (B) mixed diet group; (C) compound feed group.
Fishes 10 00379 g001
Figure 2. Bar plot of GO enrichment analysis. (A) comparison between the compound feed group and the live food group (C vs. L); (B) comparison between the compound feed group and the mixed diet group (C vs. M).
Fishes 10 00379 g002
Figure 3. Bubble plot of KEGG enrichment analysis. The color gradient of the dots indicates the significance level, with redder hues representing stronger enrichment, and the size of the dots corresponds to the number of differentially expressed mRNAs. (A) comparison between the compound feed group and the live food group (C vs. L); (B) comparison between the compound feed group and the mixed diet group (C vs. M).
Fishes 10 00379 g003
Figure 4. Validation of DEGs by qPCR. (A) comparison between the compound feed group and the live food group (C vs. L); (B) comparison between the compound feed group and the mixed diet group (C vs. M).
Fishes 10 00379 g004
Figure 5. Pie diagram of metabolite classification.
Fishes 10 00379 g005
Figure 6. Bubble plot of KEGG enrichment analysis. (A) comparison between the compound feed group and the live food group (C vs. L); (B) comparison between the compound feed group and the mixed diet group (C vs. M).
Fishes 10 00379 g006
Figure 7. Bubble plot of KEGG enrichment analysis. The triangles on the left represent transcriptomics, and the circles on the right represent metabolomics. If a pathway is marked with both a triangle and a circle, it indicates that the pathway is enriched in both omics datasets. (A) comparison between the compound feed group and the live food group (C vs. L); (B) comparison between the compound feed group and the mixed diet group (C vs. M).
Fishes 10 00379 g007
Figure 8. Gene–metabolite correlation network. Genes are represented by red nodes, metabolites by green nodes, and larger green dots indicate that more genes show significant correlations with the corresponding metabolite. Red lines signify positive correlations between genes and metabolites, and blue lines indicate negative correlations. (A) comparison between the compound feed group and the live food group (C vs. L); (B) comparison between the compound feed group and the mixed diet group (C vs. M).
Fishes 10 00379 g008
Table 1. Main nutrient components of compound feed and live food (%).
ItemsCrude ProteinCrude FatCrude AshMoisture
Compound feed47.6212.5914.1312.00
Live food18.355.513.2671.24
Table 2. Transcriptome sequencing data.
SampleRaw ReadsRaw Bases (bp)Clean ReadsClean Bases (bp)Q20 (%)Q30 (%)
C-156,182,8728,483,613,67255,466,8008,354,240,00798.8796.64
C-247,405,2127,158,187,01246,677,0047,027,077,88498.6696.08
C-354,969,9548,300,463,05454,136,8468,143,475,62698.7096.20
L-151,909,8267,838,383,72651,147,9947,710,117,95798.6796.07
L-253,048,7968,010,368,19652,287,5027,878,504,72098.6996.14
L-354,529,2988,233,923,99853,771,1608,107,282,76798.7496.28
M-156,344,2648,507,983,86455,546,2348,378,330,46498.8196.46
M-251,801,8347,822,076,93450,985,8927,689,201,54198.6796.12
M-350,750,3247,663,298,92449,956,5367,533,954,13698.6996.15
Disclaimer/Publisher’s Note: The statements, opinions and data contained in all publications are solely those of the individual author(s) and contributor(s) and not of MDPI and/or the editor(s). MDPI and/or the editor(s) disclaim responsibility for any injury to people or property resulting from any ideas, methods, instructions or products referred to in the content.