Article

Predicting the Body Weight of Tilapia Fingerlings from Images Using Computer Vision

by
Lessandro do Carmo Lima
1,
Adriano Carvalho Costa
1,*,
Heyde Francielle do Carmo França
1,
Alene Santos Souza
1,
Gidélia Araújo Ferreira de Melo
1,
Brenno Muller Vitorino
1,
Vitória de Vasconcelos Kretschmer
1,
Suzana Maria Loures de Oliveira Marcionilio
1,
Rafael Vilhena Reis Neto
2,
Pedro Henrique Viadanna
3,
Gabriel Rinaldi Lattanzi
2,
Luciana Maria da Silva
1 and
Kátia Aparecida de Pinho Costa
1
1
Goiano Federal Institute, Rio Verde 75901-970, GO, Brazil
2
Department of Science Animal, State University Paulista Júlio de Mesquita Filho, Registro 11900-000, SP, Brazil
3
Biological Sciences, College of Arts and Sciences, Washington State University, Pullman, WA 99163, USA
*
Author to whom correspondence should be addressed.
Fishes 2025, 10(8), 371; https://doi.org/10.3390/fishes10080371
Submission received: 24 April 2025 / Revised: 20 June 2025 / Accepted: 1 July 2025 / Published: 2 August 2025
(This article belongs to the Special Issue Application of Artificial Intelligence in Aquaculture)

Abstract

The aim of this study was to develop a mathematical model to predict the body weight of tilapia fingerlings using variables obtained through computer vision. A total of 2092 tilapia fingerlings and juveniles, weighing between 10 and 100 g, were fasted for 12 h, anesthetized, weighed, and photographed using an iPhone 12 Pro Max at 33 cm height in a closed container with different bottom colors. Images were segmented using Roboflow’s instance segmentation model, achieving 99.5% mean average precision, 99.9% precision, and 100% recall. From the segmented images, area, perimeter, major axis (MA), minor axis (SA), X and Y centroids, compactness, eccentricity, and the MA/SA ratio were extracted. Seventy percent of the data was used to build the model, and 30% for validation. Stepwise multiple regression (backward selection) was performed, using body weight as the dependent variable. The prediction model was: −17.7677 + 0.0007539(area) – 0.0848303 (MA) – 0.108338(SA) + 0.0034496(CX). The validation model showed similar coefficients and R2 = 0.99. The second validation, using observed versus predicted values, also yielded an R2 of 0.99 and a mean absolute error of 1.57 g. Correlation and principal component analyses revealed strong positive associations among body weight, area, axes, and predicted values. Computer vision proved effective for predicting tilapia fingerlings’ weight.
Key Contribution: Computer vision accurately predicted tilapia fingerlings’ weight using image data. The model achieved R2 = 0.99 and a mean absolute error of only 1.57 g. Key predictors included area, major/minor axes, and X centroid position.

1. Introduction

Evaluating animal weight is fundamental throughout all stages of fish production, as it is essential for growth monitoring, feed adjustment, and determining the optimal harvest time [1]. Fish weight changes rapidly during the initial growth phase when animals consume the highest proportion of feed. These changes are influenced by genetic, environmental, nutritional, and husbandry factors [2]. Such weight variations have direct economic implications since heavier and larger specimens command higher market prices [3].
In most fish farms, weight monitoring is performed manually [4]. Manual weighing presents several challenges, including stress induced in fish during handling, which frequently occurs when farmers capture and release fish without anesthesia [5]. As a manual process, it is also prone to human measurement errors [6]. In aquaculture operations, fish weighing typically occurs near tanks or ponds. This practice is not only labor-intensive but may also lead to physical and psychological strain for the operators involved. Furthermore, it represents a costly activity due to its high labor requirements [7].
The automation of fish fingerlings’ weight biometrics presents a significant challenge for enhancing aquaculture productivity [8]. Computer vision techniques offer a solution by enabling rapid, precise, and non-invasive image analysis, thereby reducing animal stress while improving data collection efficiency [3]. Image-based approaches–utilizing either photographs or videos–have been successfully implemented across multiple aspects of fish production, including disease assessment, behavior monitoring, biomass estimation, population counting, and size classification [9,10].
Image segmentation is one of the applied computer vision techniques that allows the identification and delimitation of areas of interest in captured images [11]. Previous research has already been carried out with some fish species at or near the commercial weight stage using segmentation to estimate body mass and carcass yields [12]. There are few scientific studies evaluating this technique during the fry stage, and little effectiveness has been found for most of the species studied [13,14].
Furthermore, existing studies face several limitations, such as: (i) low accuracy for smaller fry due to image resolution, (ii) difficulty in generalizing to different, complex, and underwater farming environments, (iii) variability in specimen morphology, (iv) dataset sample size, and (v) uncertainty in model selection and technical issues with image-based methods. These factors can reduce the accuracy of the evaluated models and hinder their implementation in real aquaculture environments [11,13].
Therefore, it is relevant to computer vision techniques that are effective for estimating weight during the fingerling and juvenile stages, and can contribute to the development of technological products that automate weight estimation using less invasive and less stressful methods. Since tilapia is the main species produced in Brazil [15], the aim of this study was to develop a model for predicting the body weight of tilapia fry using variables obtained through computer vision.
This study stands out by applying an instance segmentation model specifically for estimating the body weight of Nile tilapia fingerlings and juveniles. The fingerlings stage is particularly sensitive, as physical measurement is delicate and prone to error. By also including juvenile specimens, a phase characterized by rapid growth and high morphological variability, the predictive models become more robust to the range of sizes and weights present during early development. The use of advanced segmentation techniques allows for the extraction of morphometric features with greater precision, even in small-sized and variably shaped individuals, enhancing the model’s accuracy and applicability in real-world production settings.

2. Materials and Methods

2.1. Data Collection

This project used 2092 tilapia fingerlings and juveniles (Oreochromis niloticus) between 10 and 100 g. The experimental procedures related to the animals were carried out following the standard guidelines issued by the Ethics Committee on the Use of Animals (CEUA–6002300124).
To obtain the images and the animals’ body weight, they were fasted for 12 h, then anesthetized by immersion in a solution of 60 mg of benzocaine. L-1, weighted, and photographed. The digital photos were taken using an iPhone 12 Pro Max. The device has three cameras, one with a 12 megapixel main sensor (f/1.6), a 12 megapixel telephoto lens (f/2.2), and a 12 megapixel ultrawide (f/2.4), with a resolution of 4000 × 3000 pixels. The main camera has a focal length of 26 mm, the telephoto lens 52 mm, and the ultrawide camera 13 mm. The Nestter JBA14008 electronic scale was used to weigh the fish, and the LCD display made it possible to view the commands and weighing values.
The images were collected in a closed container (sides and roof) with varying background colors, simulating different scenarios to ensure a consistent database. The photos were collected at a standard height of 33 cm (Figure 1). After collecting the images and weighing the fish, a database was created under the name FISHIJPG–2092SEGI.
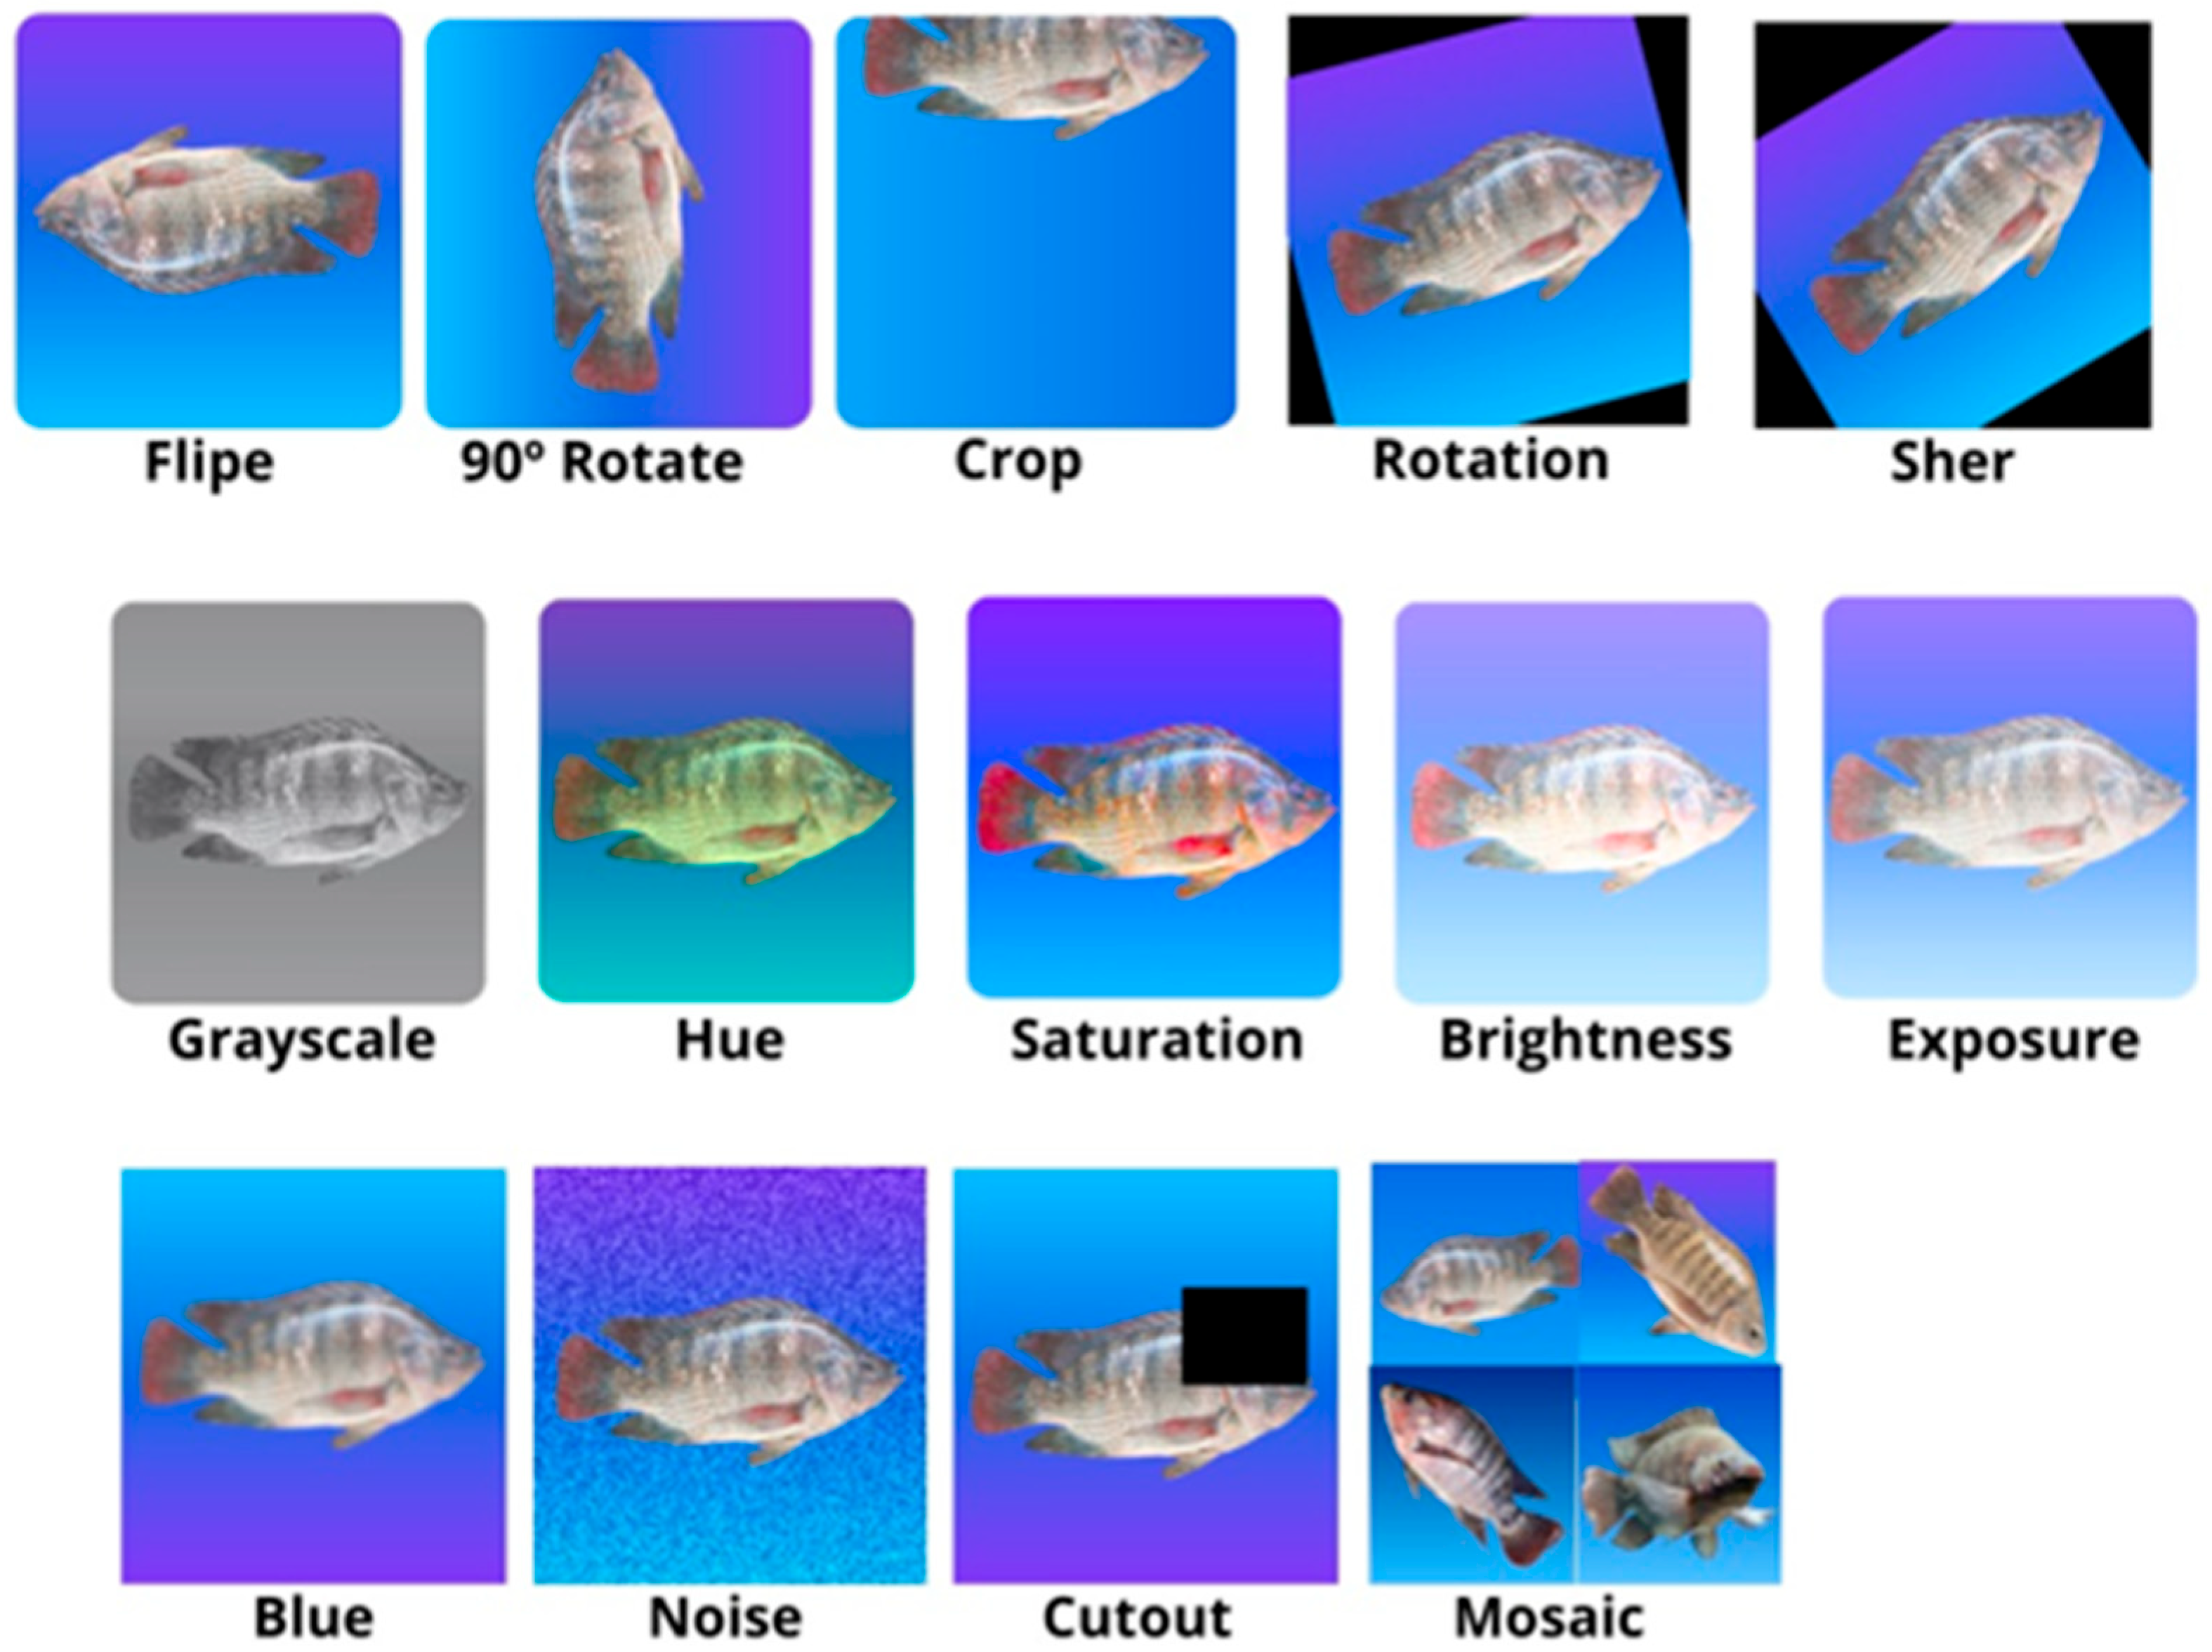
The collected digital photos were converted to JPG and resized to 640 × 640 pixels. The database was expanded using data augmentation techniques (Figure 2) from the Roboflow platform (Roboflow website), with the following techniques to increase the generalization power of the model and the database:
(A) Rotation: to create a mirrored version of the original image, resulting in a horizontal or vertical inversion;
(B) Shear: to obtain images tilted along the horizontal or vertical axis;
(C) Grayscale: to obtain grayscale images, so that the colors are less emphasized in the model;
(D) Hue: to obtain different colored images without affecting brightness or saturation;
(E) Saturation: to obtain images with different color intensities without altering hue or brightness.
The images were also labeled and pre-processed on the Roboflow platform. A neural network was then trained to segment the images in order to automate the segmentation process. To do this, 2092 images were used, 70% for training, 20% for validation, and 10% for testing. The following metrics were used to assess the quality of the segmentation: Mean Average Precision (mAP), precision, and recall.
With the model trained, masks were generated for the images to identify the regions of interest. Using the masks generated, a new data set was created with the segmented images and the information on area, perimeter, major axis (MA), minor axis (SA), X centroid (CX) and Y centroid (CY) extracted using the Python program (version 3.12.0) using the OpenCV library (Open Source Computer Vision Library). The Major-Minor Axis Ratio (RMM) [16], compactness [17] and eccentricity [18] were calculated:
R M M = 4 π x A r e a P e r i m e t e r 2
C o m p a c t n e s s = A r e a P e r i m e t e r 2
E c c e n t r i c i t y = 1 s m a l l e s t a x i s 2 l a r g e s t a x i s 2
Compactness is a measure that expresses how closely the shape of a segmented object resembles a circle. Values closer to 1 indicate more rounded shapes, while higher values suggest elongated or irregular forms. This metric is useful for assessing the regularity of object boundaries. Eccentricity represents the degree of elongation of an object, based on the ellipse that best fits its shape. It ranges from 0 to 1, where 0 corresponds to a perfectly circular shape and values close to 1 indicate more stretched or elliptical forms. Major-Minor Axis Ratio (RMM) is the ratio between the length of the major axis and the minor axis of the best-fitting ellipse around the object. This ratio indicates shape elongation: values close to 1 suggest rounded shapes, while higher values indicate greater elongation.

2.2. Statistical Analysis

An exploratory analysis of the data was carried out to check for consistency, and only observations within ±3.0 standard deviations of the mean were considered for each variable. To analyze the data, 70% of the data was used to obtain the model, and 30% for validation. The model for predicting body weight, based on the information extracted from the segmentation, was obtained using multiple linear regression methods using the Stepwise procedure with the Backward option, considering body weight as the dependent variable and the independent variables obtained from the segmentation.
The model used for the multiple linear regression [19] was Equation:
Yi = β0 + β1Xi1 + β2Xi2 + …+ βpXin + e
where Y represents the dependent variable, which is the explanatory variable (constant); βp is the coefficient of each independent variable, and represents the random (residual) experimental error.
To do this, all possible combinations between the independent variables previously selected by the Stepwise procedure were tested, and the VIF values and coefficients of determination (R2) were assessed in the models containing two and three variables. Based on these criteria, the model with the absence of multicollinearity (VIF ≤ 1) and the highest R2 was selected, ensuring greater explanatory capacity and statistical robustness. The fit of the validation data to the model obtained was checked, the residual analysis was also carried out, and the predicted values were obtained and compared to the observed values using the regression model [19]:
Y = β0 +β1X,
H0: β0 = 0 and β1 = 1
Ha: not H0
where Y represents observed values, X represents predicted values, β0: intercept of the equation, and β1: angular coefficient of the equation. The regression was evaluated according to the following statistical hypotheses [16].
To better understand the relationship and importance of the variables, principal component analysis and correlation analysis were conducted on the validation database and the predicted value. The analysis was carried out using the computer packages corrplot, factoextra, FactoMineR, MVar.pt, stats, and tidyverse from the R computer program (version 4.4.1; R Core Team, 2024).

3. Results

Training the neural network for segmentation showed that the trained model obtained mAP 99.5%, precision 99.9%, and recall 100%. The model obtained using the Stepwise procedure with the Backward option was Y = 17.7677 + 0.00075-area − 0.0848 − MA–0.1083-SA + 0.00345-CX, showing a high coefficient of determination (R2 = 0.99), which indicates excellent explanatory power (Table 1). However, analysis of the variance inflation factors (VIF) revealed excessively high values for the variables area (VIF = 116.85), MA (VIF = 39.25), and SA (VIF = 47.75), showing strong multicollinearity. This compromises the stability of the estimated coefficients and may affect the reliability of the individual inferences for these variables, despite the overall good fit of the model.
After evaluating all the possible combinations between the independent variables based on the VIF values, and starting from the initial model generated by the Stepwise procedure, a more parsimonious model was obtained, with less collinearity between the predictors: Y = −28.83 + 0.0004618-area + 0.004234-CX. In this model, the VIF values for both the area and CX variables were equal to 1.0057, indicating no multicollinearity. This reformulation preserves the explanatory power of the model while improving the stability of the estimates, making it more robust for predictive and inferential purposes.
Table 1 shows the adjusted model for the test set, considering the same variables, with the respective coefficients, standard errors, confidence intervals, and the coefficient of determination. The models generated by the Stepwise procedure and the final model showed no significant differences between the estimated parameters and the validated models. All the parameters were significant, and both models had coefficients of determination of 0.99.
The fit test Y = β0 + β1X was performed only for the final model. showed that there was no difference between the predicted value and the actual value (H0: β0 = 0 and β1 = 1), with a coefficient of determination of 0.99 (R2), a root mean square error (RMSE) of 2.52 and a mean absolute error (MAE) of 1.42 g.
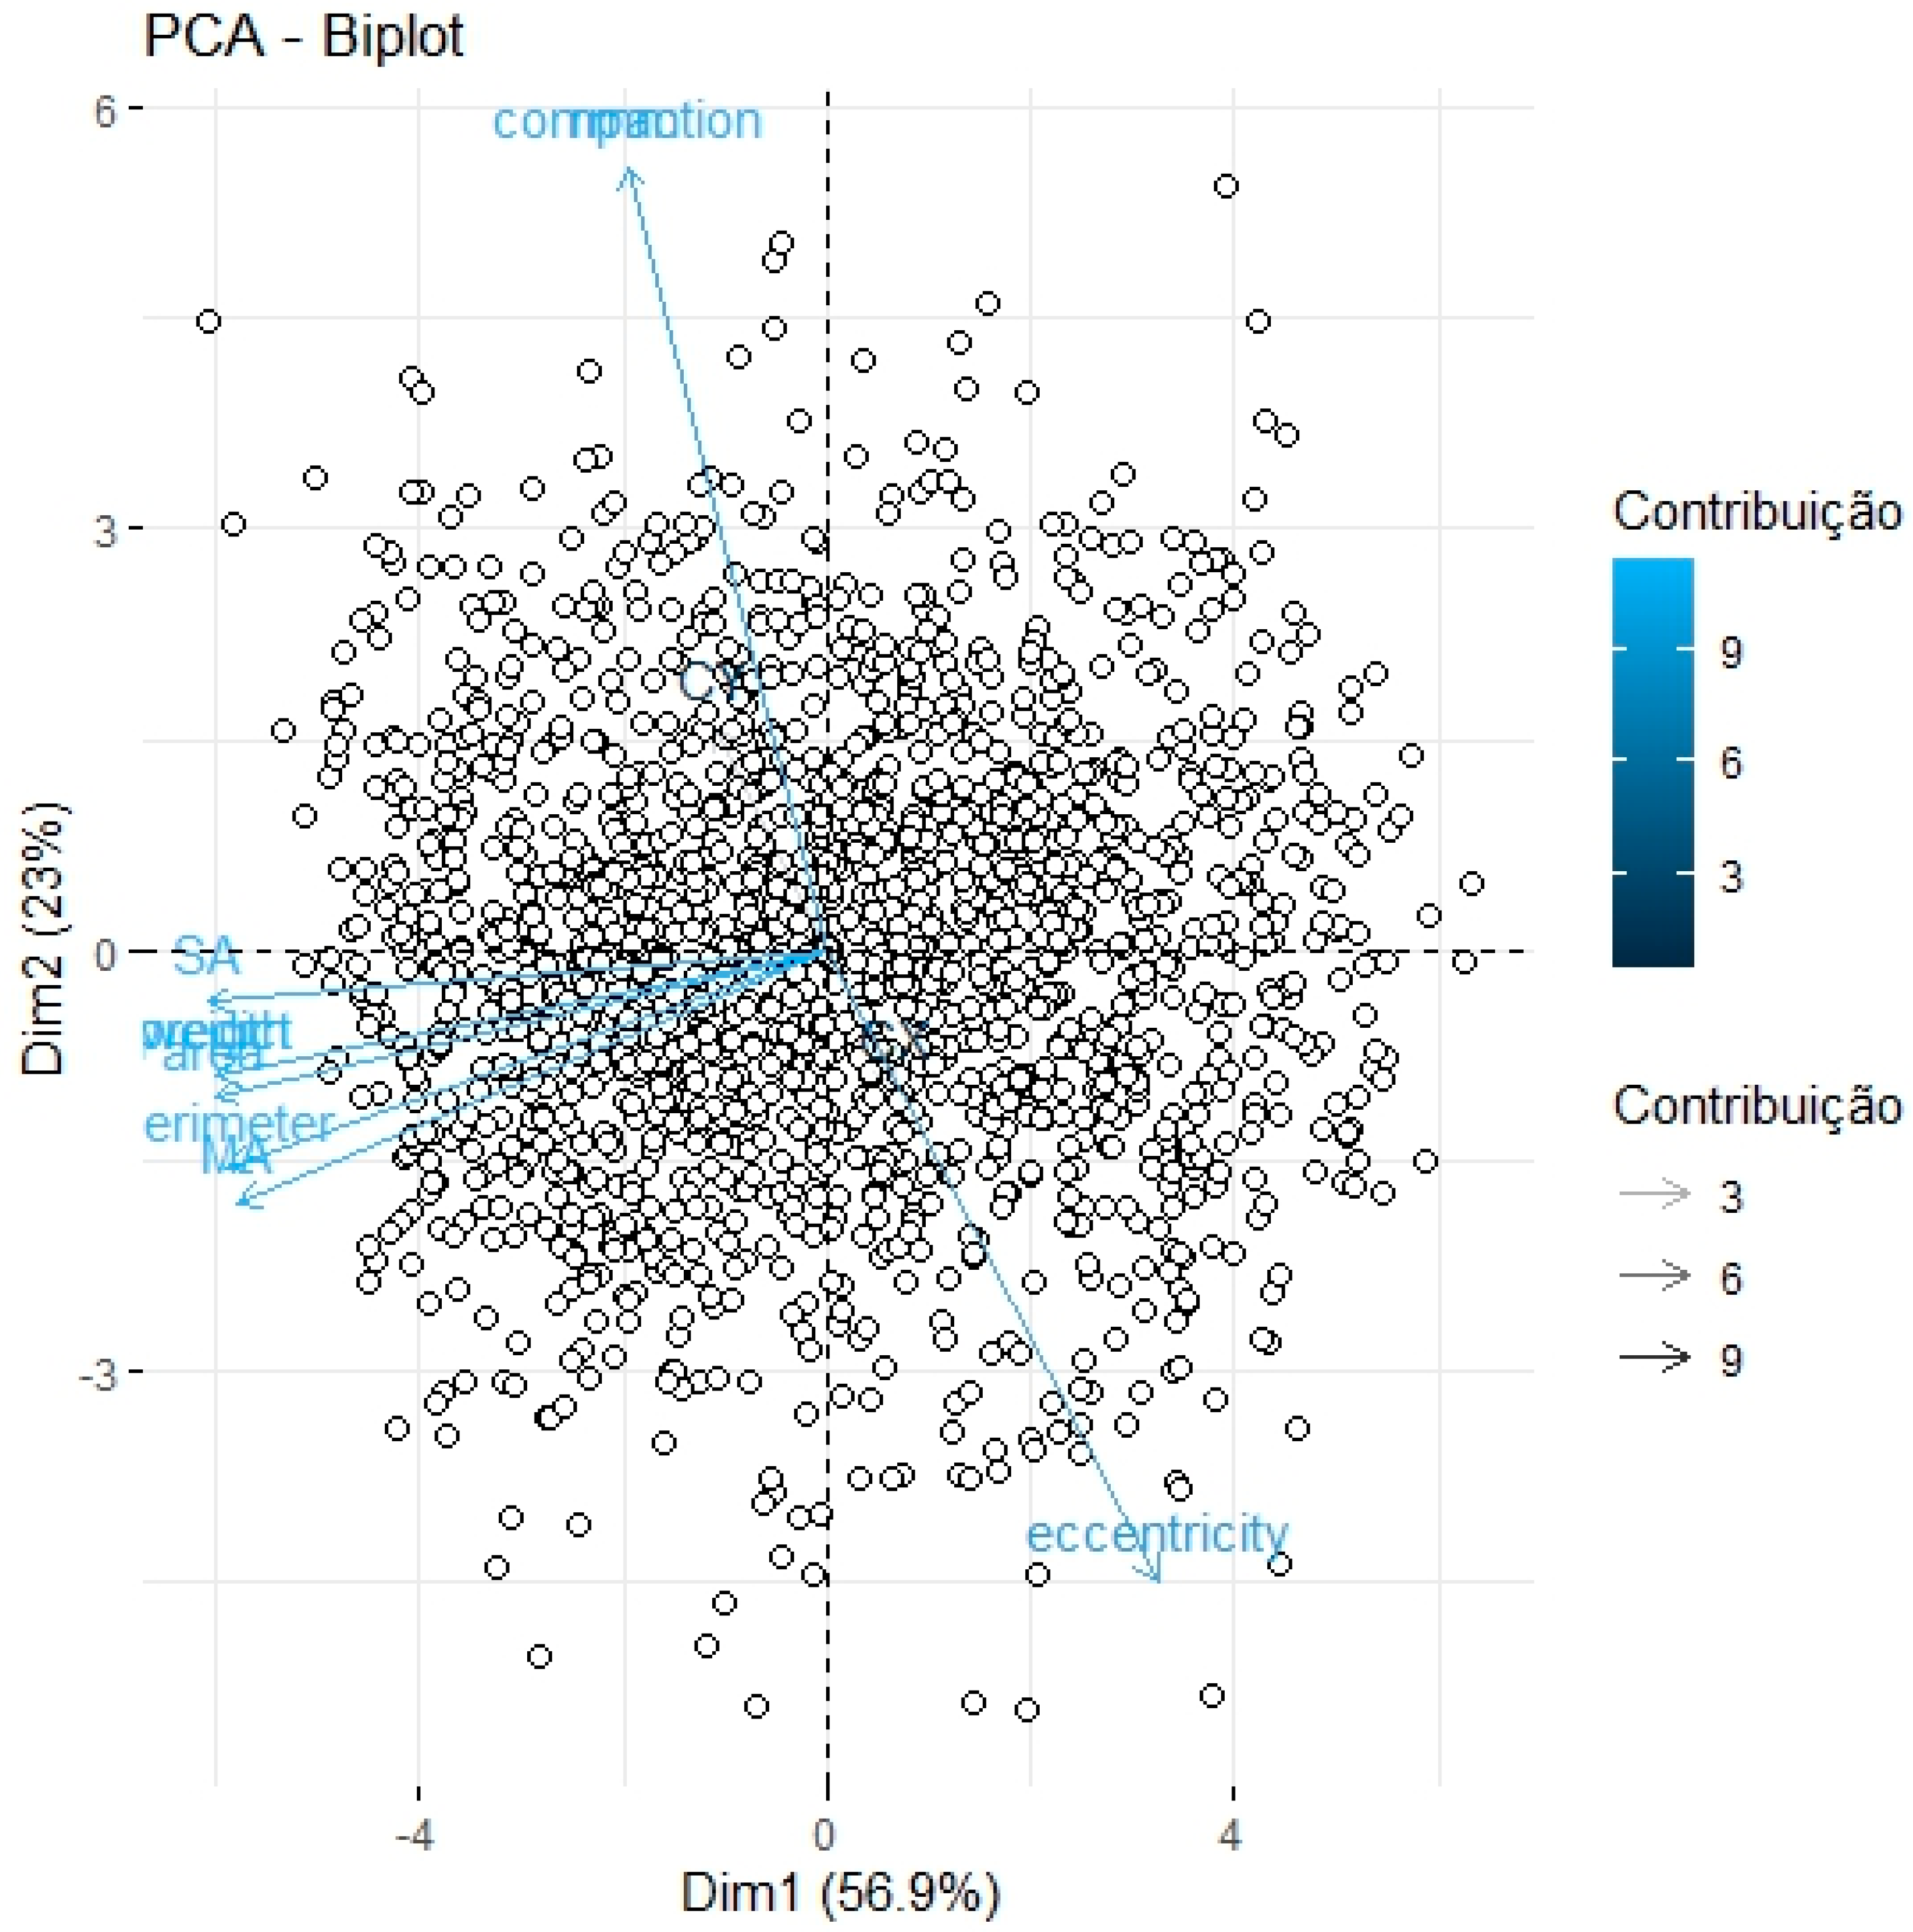
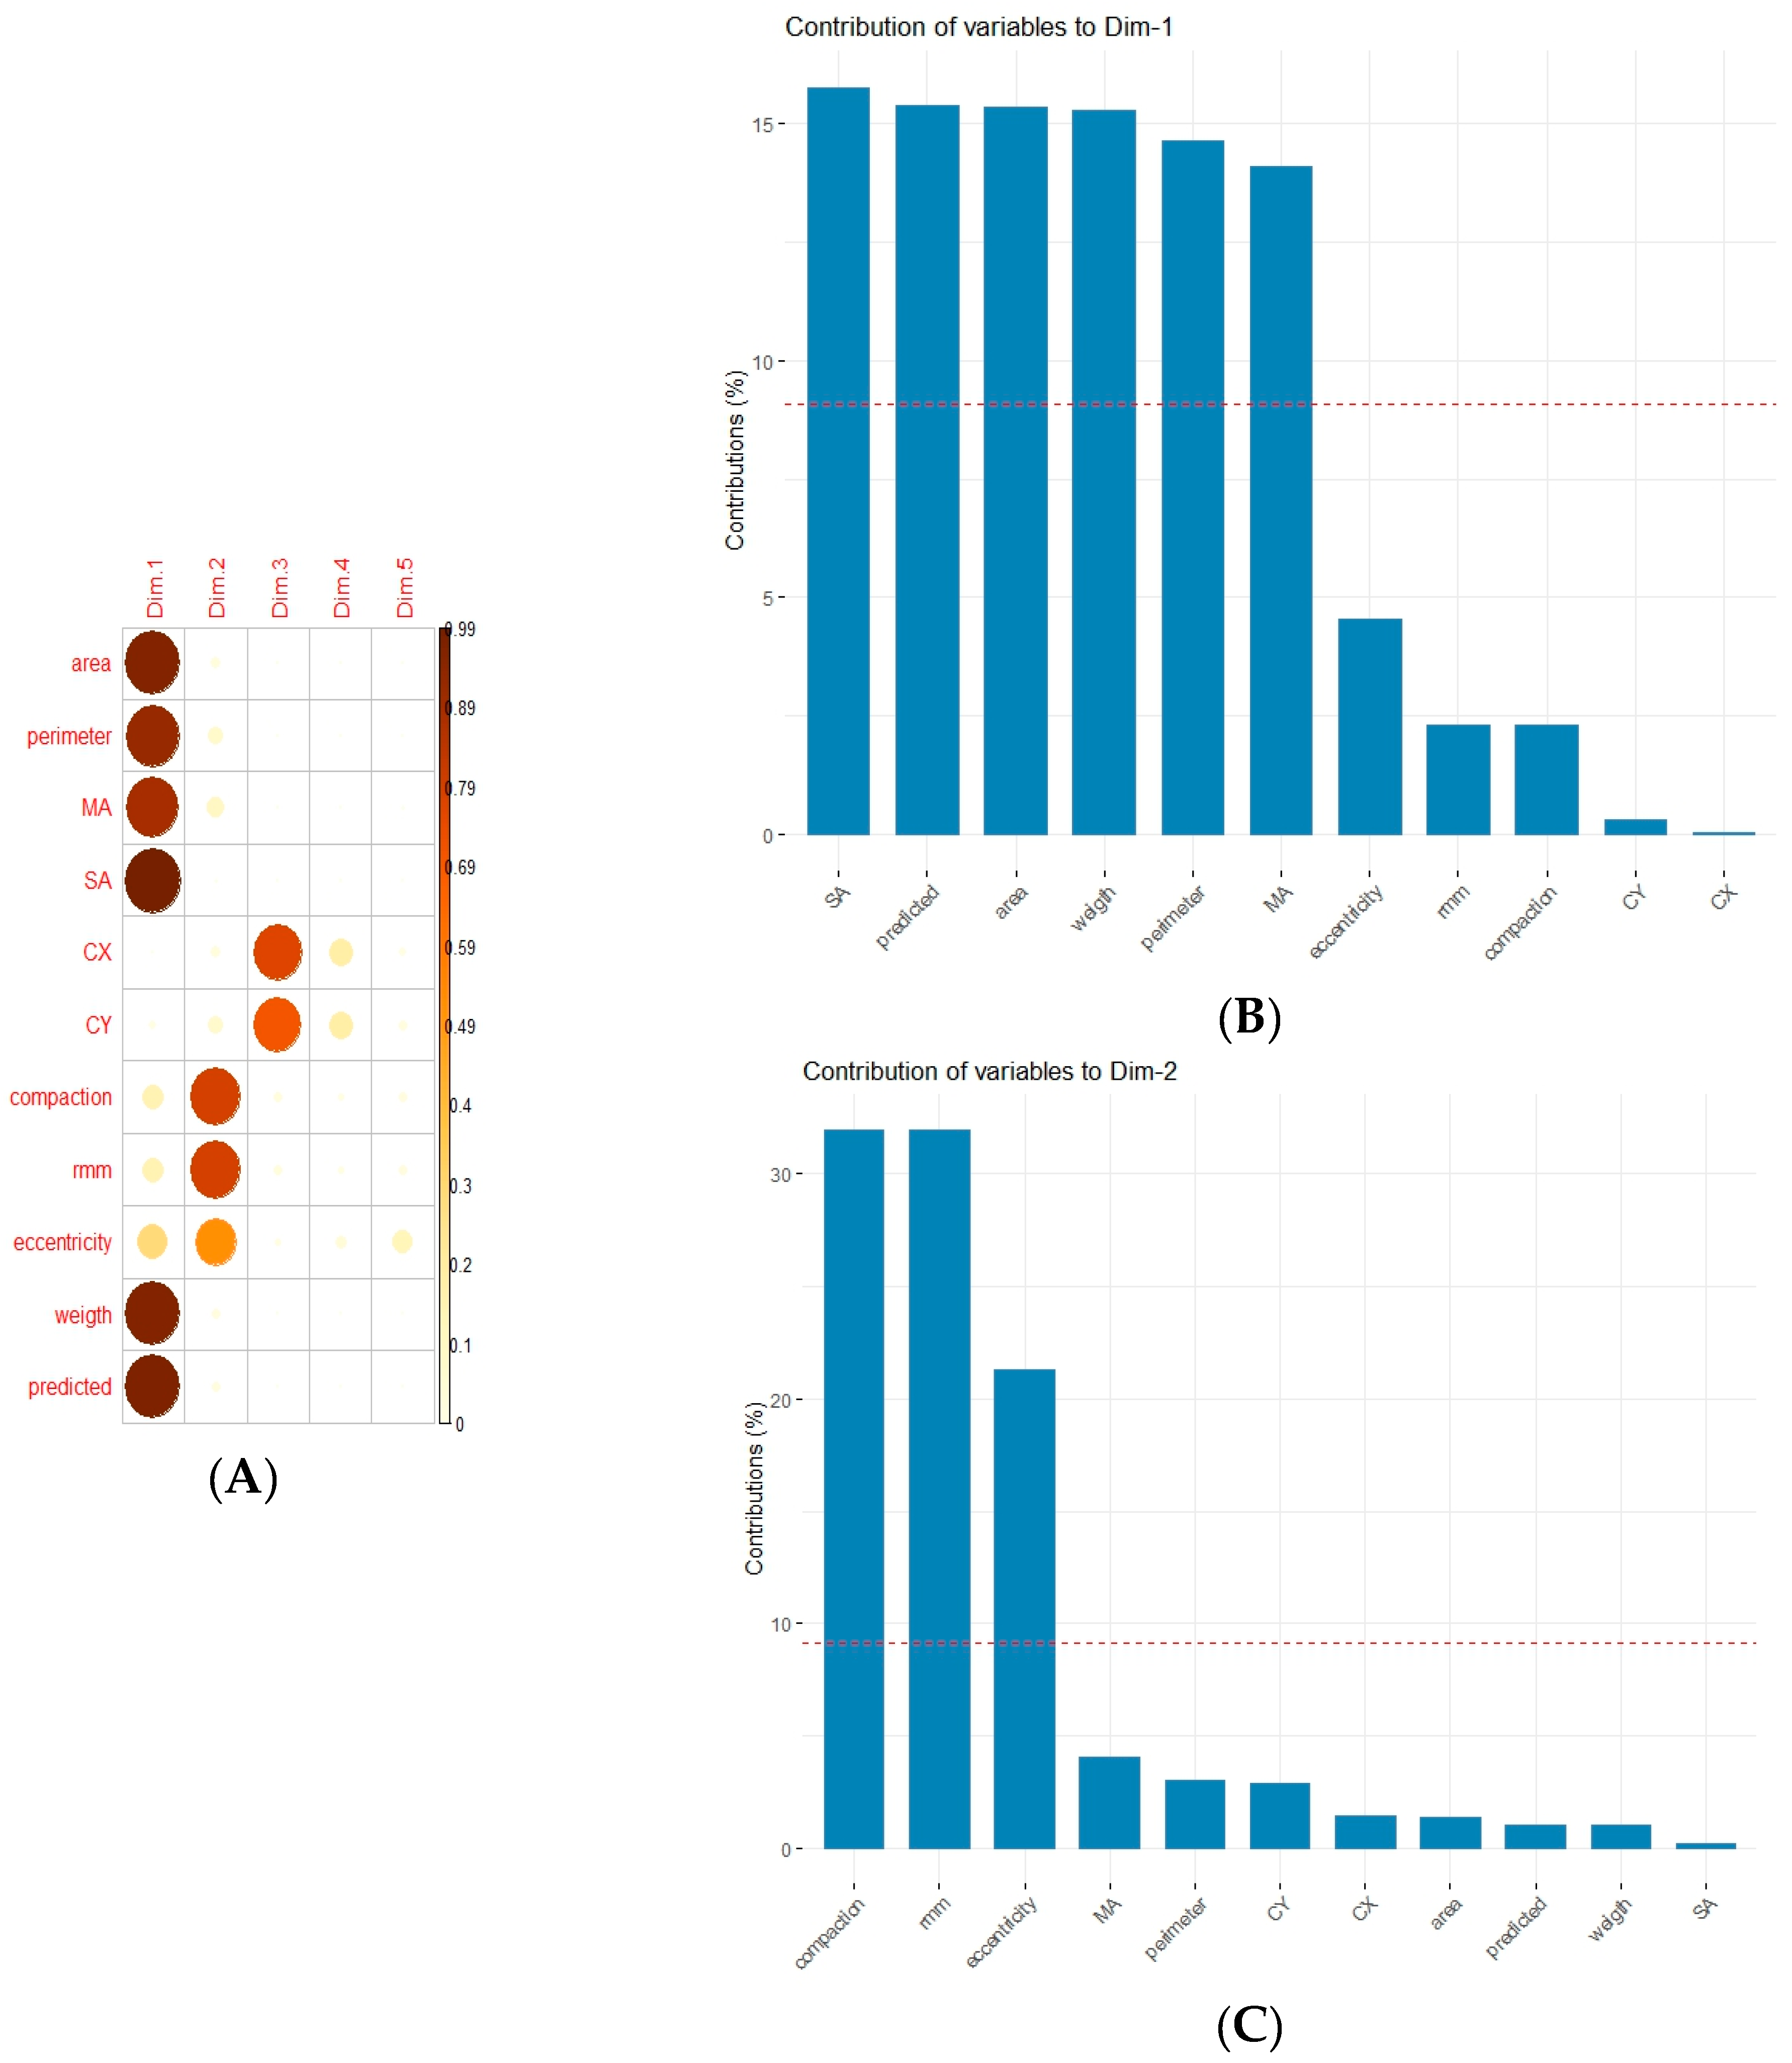
Principal component analysis showed that the first and second components explained 79.9% of the total variation in the data (Figure 3). The first component explained 56.9%, with a high and positive correlation with the variables area, perimeter, major axis, minor axis, observed body weight, and predicted body weight. The second component explained 23% of the total variation in the data, correlating positively and highly with compaction and RMM. The second component showed a high and negative correlation with eccentricity. The importance of the variables in each principal component is shown in Figure 4.
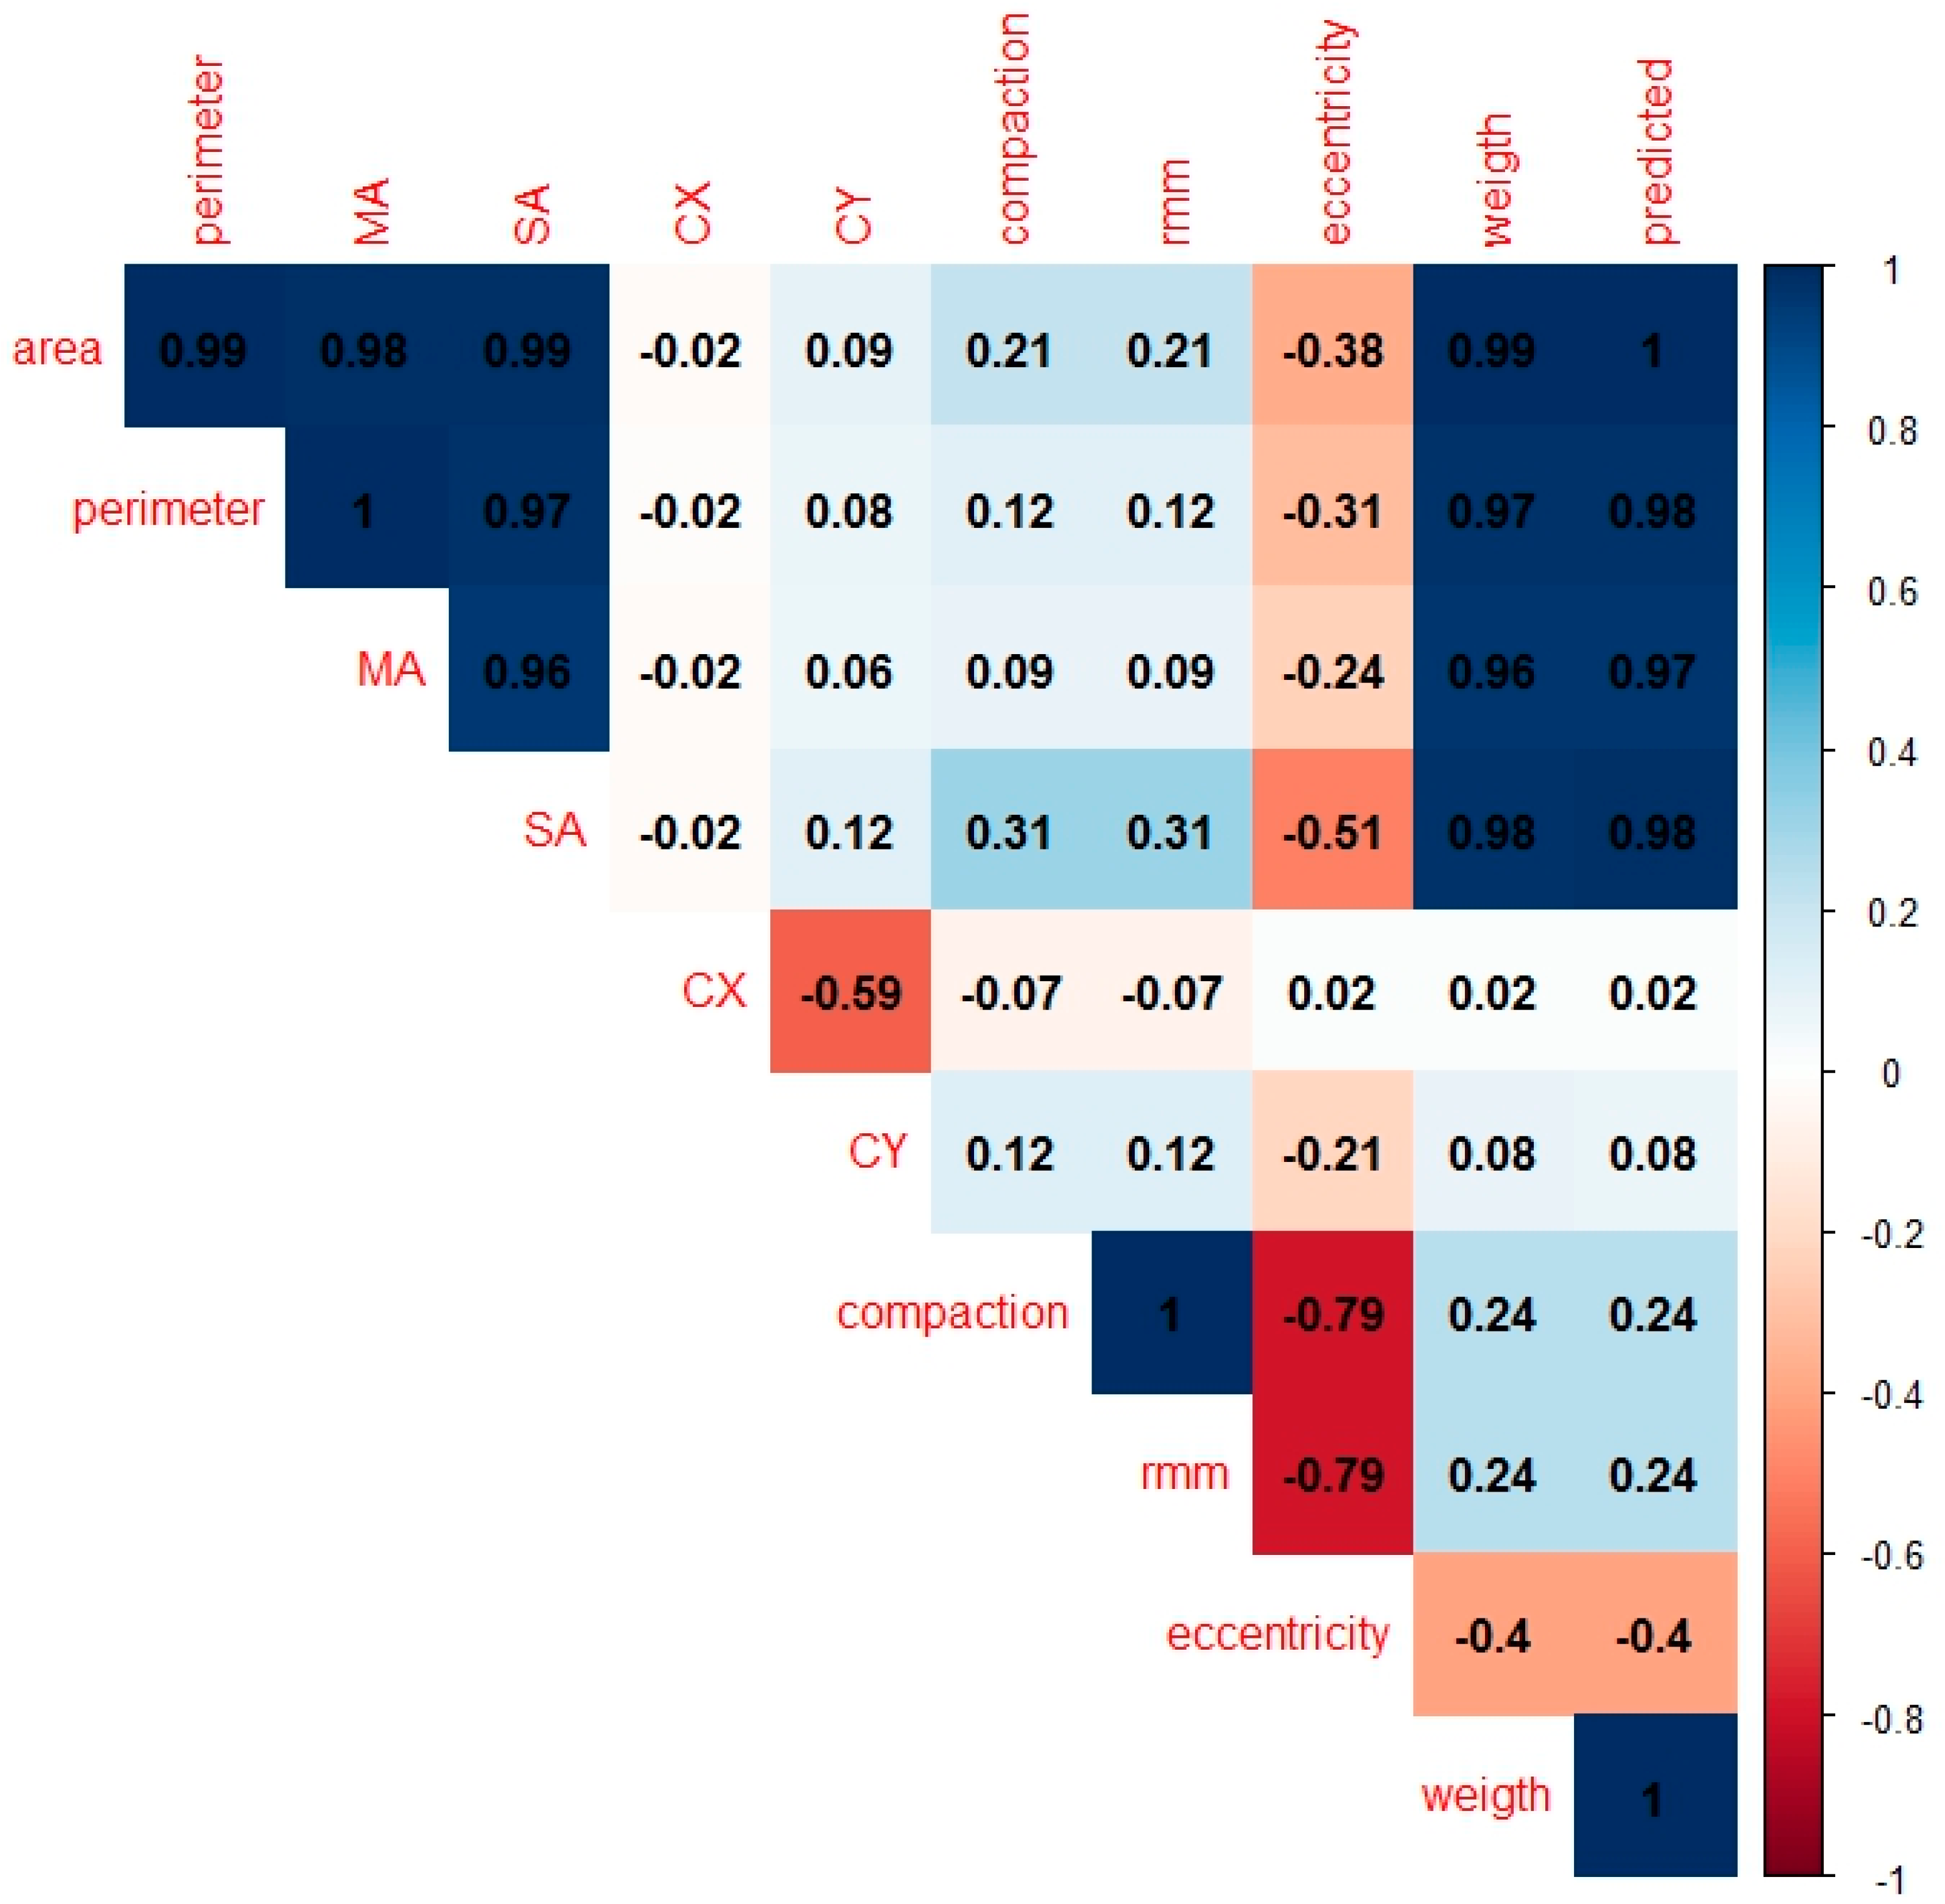
It was observed that SA, MA, weight, area, observed, and predicted body weight showed high and positive correlations with each other (Figure 5). Compaction showed a high and positive correlation with RMM, and these variables showed high and negative correlations with Eccentricity.

4. Discussion

It was found that the neural network used to segment the images was effective, as the metrics (mAP, precision, and Recall) obtained were above 99% mAP, precision, and Recall. To the author’s knowledge, there is no research that defines the minimum value for these metrics to classify/qualify the neural network; however, this value usually varies between 0 and 100 (personal observation). The higher these metrics are, the more effective the neural network is in machine learning.
Neural networks have also been used to segment images in aquatic camera environments with various species of fish, with results of over 90% with 2000 images [20]. In images collected all with an in-water camera, accuracy is expected to be lower due to various factors such as the complexity of the marine environment, water turbidity, color contrasts, lack of focus, and fish movement.
Image segmentation has also been carried out on Pintado Real® catfish fingerling (Pseudoplatystoma corruscans) without anesthesia, resulting in mAP below 50% [21]. This low accuracy is due to the quality of the images, as the fish were constantly moving during collection, causing different body shapes and orientations in the images, as well as a reduction in focus.
The automation of image segmentation using neural networks in this study proved to be effective due to the high mAP. This high mAP is due to the way the images were collected, since the fish were anaesthetized (immobile), out of the water, and considering only the body of the fish, not the fins (body appendage).
Fernandes et al. reported in their work with tilapia that segmenting the fins is a challenge, due to the smaller number of pixels, the difficulty in differentiating the edges of the fins from the body and the background of the image [12]. The authors reported that image segmentation can indirectly influence fish weight. This was not observed in this study with tilapia fry to juveniles. Another difficulty in considering the fins is the way they are arranged in the image, especially the dorsal and caudal fins (tilted, lowered, or turned).
Tilapia fins have a low yield, ranging from 1 to 3% [22]. This variation is due to the genetic variation of the trait itself. The fact that the fins are not considered when segmenting is justified because the fins can be lost or damaged by conflicts between the fish or even by aquaculture management activities. In addition, since fins are positioned in the extremities, they can have lesions due to common aquatic pathogens, such as Flavobacterium spp.
Automating segmentation using neural networks offered several advantages in this work, including: (a) Increased accuracy by reducing human errors that can occur due to fatigue or subjectivity; (b) Improved consistency, as the trained algorithm provides more consistent results, where uniformity is essential; (c) Faster processing and scalability, as automated systems can process a lot of data in less time than a human, improving productivity; (d) Reduced labor costs.
Through multiple regression analysis using the Stepwise procedure with the Backward option, an initial model with high explanatory power (R2 = 0.99) was obtained, composed of the variables area, MA, SA, and CX. All these variables showed statistically significant coefficients, indicating a relevant contribution to the prediction of body weight. However, the variance inflation factor (VIF) analysis revealed high levels of multicollinearity among the predictors area (VIF = 116.85), MA (VIF = 39.25), and SA (VIF = 47.75), which compromises the stability and interpretation of the estimated coefficients, despite the overall quality of the fit.
Given this limitation, new combinations of variables were evaluated based on the VIF values in order to obtain a more parsimonious model. Based on the initial model generated by the Stepwise procedure, a final version was created consisting only of the area and CX variables, both statistically significant and with VIF values equal to 1.0057, indicating no multicollinearity.
This reformulated model maintained its high coefficient of determination (R2 = 0.99), demonstrating that the exclusion of collinear variables did not compromise the model’s predictive capacity. In addition, simplification favors data collection, reduces computational effort, and improves statistical robustness, making it more suitable for practical applications in production contexts, such as estimating the body weight of tilapia fry.
Maintaining the statistical significance of the variables in the final model reinforces their relevance in explaining body weight variation, while eliminating multicollinearity increases the reliability of inferences. Therefore, the final model represents a balanced solution between complexity, performance, and interpretability [23,24,25].
The high coefficients of determination found in the adjustment and validation models, using the variables extracted through segmentation, showed the importance of these variables in predicting body weight. This was also observed when modeling weight as a function of the predicted value. According to [2], it is recommended that the coefficient of determination should be greater than 0.70; in other words, that it should be able to explain at least 70% of the total variation of the data.
The equality of the parameters obtained in the adjusted and validation models indicates that the adjusted model does not differ from the model obtained from the validation database. This indicates that the model can be used to estimate the weight of tilapia fry. This was also confirmed when adjusting body weight as a function of the predicted value.
Model validation is essential to ensure the reliability of predictions and the generalizability of results [23]. The equality of the parameters between the fitted model and the validation model indicates that the fitted model is capable of providing accurate estimates when estimating the weight of tilapia fry. In addition, the high association between the actual value and the predicted value of body weight, together with the significant correlations with other morphological variables, reinforces the validity and usefulness of the model for further analysis and decision-making in aquaculture.
The correlation and principal component analysis showed a high positive association between the actual value and the predicted value of body weight, which were high and significant with area, perimeter, MA, and SA. These positive correlations were to be expected, as weight increases, so do body shape characteristics such as area, perimeter, major axis, and minor axis.
Although the use of high-resolution images taken under controlled conditions (with anaesthetized fish, a fixed distance from the camera, and a standardized background) provided excellent quality data for training the model, it is recognized that this approach may limit its direct applicability in real aquaculture production systems. In commercial environments, operating conditions tend to be more variable, with challenges such as irregular lighting, spontaneous fish movement, different depths, and greater visual complexity in the background of the images.
However, the methodology adopted in this study was carefully structured to automate a classic fish farming operation: manual weighing or biometrics, often carried out on trays in sorting and grading processes. The proposed system, with the camera fixed to the top of the containment structure, was designed to simulate this operating environment, offering an automated, accurate, and easy-to-implement alternative with the potential to replace the conventional method without the need for significant changes to the production routine.
In addition, the conditions under which the images were taken were deliberately kept simple and adaptable to the reality of the field, in order to make it easier to replicate the system in different production units. It should be noted that the only source of light used was the cell phone’s own flashlight, without the need for reflectors, auxiliary equipment, or strict lighting control. This aspect demonstrates the viability of the system even in environments with basic infrastructure, maintaining the quality required for effective segmentation and reliable prediction of body weight.
The main benefits associated with adopting this automated system include: a reduction in human errors when weighing and recording data, standardized measurements, faster information processing, and the possibility of integration with digital aquaculture management platforms, contributing to a more efficient, traceable, and technically sustainable production process.
To enhance model applicability, future studies should consider image acquisition under actual farming conditions, without requiring anesthesia, aiming to train more variation-resistant models. Furthermore, data augmentation techniques can simulate environmental variations during training to improve generalization—an approach implemented in the current study. Other promising strategies include object detection or semantic segmentation algorithms capable of operating in noisier environments, along with deployment of real-time multisensor systems for automated monitoring in commercial tanks.
Model validation using only an internal dataset, without testing on independent data or under real operational conditions, represents a limitation for the generalizability of the results. Techniques such as k-fold cross-validation could be incorporated in future studies, as this method may reduce overfitting and provide reliable estimates of model performance. However, it does not fully replace the need for evaluation using external datasets [24,26].
Thus, the lack of validation in diverse environments (e.g., different aquaculture farms, variable lighting conditions, or distinct growth stages) may limit the model’s practical applicability, especially in commercial production systems where variability is significantly higher [25,27]. To address this limitation, future studies should prioritize collecting and evaluating independent datasets obtained under real farming conditions. Collaboration with different production units would allow testing the model’s robustness against uncontrolled variations, such as changes in water quality, stocking density, and fish behavior.
Furthermore, implementing techniques such as transfer learning or federated models could improve adaptation to new environments, ensuring the tool maintains high accuracy even when applied outside its initial development context. These advancements could further contribute to transforming the tested model into a reliable solution for precision aquaculture [26,27,28,29,30].
Another point is the weight of the juvenile tilapia evaluated in this study, which ranged from 10 g to 100 g. The reason for choosing this range was due to the critical importance of this stage for aquaculture productivity. At this stage, small variations in weight have a direct impact on feed efficiency and batch uniformity, which are relevant economic factors in production [30,31]. In addition, models for juveniles may require different parameters, such as metabolic rate and feed conversion, compared to adults, given the non-linearity of growth [32,33,34].
We recognize that the models evaluated were not tested on adult tilapia, so future studies will evaluate the weight range above 100 g, as well as validating other production species, such as specimens that include the Serrasalmidae family, such as pacu and tambaqui, which are also economically important fish, especially in Latin America.

5. Conclusions

It can be concluded that the body weight of tilapia fingerlings and juveniles can be effectively predicted using a multiple linear regression model with vision data obtained by segmenting images using computer vision. Future work evaluating different technologies for implementing the model in real time should be conducted to better understand the feasibility of such a technique in an aquaculture setting.

Author Contributions

Conceptualization, supervision, validation, formal analysis, project administration, and funding acquisition, A.C.C.; methodology and data curation, L.d.C.L., A.C.C., A.S.S., G.A.F.d.M., V.d.V.K. and G.R.L.; software, H.F.d.C.F. and B.M.V.; investigation e resources, L.d.C.L., A.C.C., A.S.S., G.A.F.d.M., V.d.V.K., G.R.L., L.M.d.S., H.F.d.C.F., R.V.R.N. and S.M.L.d.O.M.; writing—original draft preparation, L.d.C.L., P.H.V., R.V.R.N., S.M.L.d.O.M. and B.M.V. writing—review and editing, A.C.C., L.M.d.S. and K.A.d.P.C., visualization, A.C.C. and L.M.d.S. All authors have read and agreed to the published version of the manuscript.

Funding

We thank IF Goiano, Goiás State Research Support Foundation (FAPEG), National Council for Scientific and Technological Development (CNPq), National Council for Scientific and Technological Development (CAPES) for funding the project. We are grateful to Alevinos Rio Verde for helping with development.

Institutional Review Board Statement

This research is in accordance with the ethical principles of animal experimentation adopted by the Animal Use Committee of the Instituto Federal Goiano (CEUA/IF Goiano), Goiás, Brazil (Protocol 6002300124, February 2024).

Informed Consent Statement

Not applicable.

Data Availability Statement

Data is contained within the article.

Acknowledgments

We would like to thank Alevinos Rio Verde for providing the Tilapia fingerlings used in this research. To the Instituto Federal Goiano, Rio Verde Campus, the National Council for Scientific and Technological Development (CNPq), the Goiás State Research Support Foundation (FAPEG), and the Centre of Excellence in Exponential Agriculture (CEAGRE), for their partnership in the research project.

Conflicts of Interest

The authors declare no conflicts of interest.

Abbreviations

The following abbreviations are used in this manuscript:
SAMinor Axis
CEUAEthics Committee on the Use of Animals
CXX Centroid
CYY Centroid
JPGJoint Photographic Experts Group
LCDLiquid Crystal Display
LILower Limit
LSUpper Limit
MAMajor Axis
mAPMean Average Precision
RMMMajor-Minor Axis Ratio
OpenCVOpen Source Computer Vision Library
RMSERoot Mean Square Error

References

  1. Owatari, M.S.; da Silva, L.R.; Ferreira, G.B.; Rodhermel, J.C.B.; de Andrade, J.I.A.; Dartora, A.; Jatobá, A. Body yield, growth performance, and haematological evaluation of Nile tilapia fed a diet supplemented with Saccharomyces cerevisiae. Anim. Feed. Sci. Technol. 2022, 293, 115453. [Google Scholar] [CrossRef]
  2. Lima, A.R.; Booms, E.M.; Lopes, A.R.; Martins-Cardoso, S.; Novais, S.C.; Lemos, M.F.; Ribeiro, L.; Castanho, S.; Candeis-Mendes, A.; Pousão-Ferreira, P.; et al. Early life stage mechanisms of an active fish species to cope with ocean warming and hypoxia as interacting stressors. Environ. Pollut. 2024, 341, 122989. [Google Scholar] [CrossRef] [PubMed]
  3. Wolff, F.C.; Salladarré, F.; Baranger, L. A classification of buyers in first-sale fish markets: Evidence from France. Fish. Res. 2024, 275, 107022. [Google Scholar] [CrossRef]
  4. Zhang, H.; Li, W.; Qi, Y.; Liu, H.; Li, Z. Dynamic fry counting based on multi-object tracking and one-stage detection. Comput. Electron. Agric. 2023, 209, 107871. [Google Scholar] [CrossRef]
  5. Robichaud, J.A.; Piczak, M.L.; LaRochelle, L.; Reid, J.L.; Chhor, A.D.; Holder, P.E.; Nowell, L.B.; Brownscombe, J.W.; Danylchuck, A.J.; Cooke, S.J. Interactive effects of fish handling and water temperature on reflex impairment of angled Rainbow Trout. Fish. Res. 2024, 274, 106993. [Google Scholar] [CrossRef]
  6. Shibata, Y.; Iwahara, Y.; Manano, M.; Kanaya, A.; Sone, R.; Tamura, S.; Kakuta, N.; Nishino, T.; Ishihara, A.; Kugai, S. Length estimation of fish detected as non-occluded using a smartphone application and deep learning method. Fish. Res. 2024, 273, 106970. [Google Scholar] [CrossRef]
  7. Gamage, A.; Gangahagedara, R.; Gamage, J.; Jayasinghe, N.; Kodikara, N.; Suraweera, P.; Merah, O. Role of organic farming for achieving sustainability in agriculture. Farming Syst. 2023, 1, 100005. [Google Scholar] [CrossRef]
  8. Prakash, C.; Singh, L.P.; Gupta, A.; Lohan, S.K. Advancements in smart farming: A comprehensive review of IoT, wireless communication, sensors, and hardware for agricultural automation. Sens. Actuators A Phys. 2023, 362, 114605. [Google Scholar] [CrossRef]
  9. Fernandes, M.P.; Costa, A.C.; França, H.F.C.; Souza, A.S.; Viadanna, P.H.O.; Lima, L.C.; Horn, L.D.; Pierozan, M.B.; Rezende, I.R.; Medeiros, R.M.S.; et al. Convolutional Neural Networks in the Inspection of Serrasalmids (Characiformes) Fingerlings. Animals 2024, 14, 606. [Google Scholar] [CrossRef]
  10. Zhao, Y.; Xiao, Q.; Li, J.; Tian, K.; Yang, L.; Shan, P.; Lv, X.; Li, L.; Zhan, Z. Review on image-based animals weight weighing. Comput. Electron. Agric. 2023, 215, 108456. [Google Scholar] [CrossRef]
  11. İşgüzar, S.; Türkoğlu, M.; Ateşşahin, T.; Dürrani, Ö. FishAgePredictioNet: A multi-stage fish age prediction framework based on segmentation, deep convolution network, and Gaussian process regression with otolith images. Fish. Res. 2024, 271, 106916. [Google Scholar] [CrossRef]
  12. Fernandes, A.F.; Turra, E.M.; de Alvarenga, É.R.; Passafaro, T.L.; Lopes, F.B.; Alves, G.F.; Singh, V.; Rosa, G.J. Deep Learning image segmentation for extraction of fish body measurements and prediction of body weight and carcass traits in Nile tilapia. Comput. Electron. Agric. 2020, 170, 105274. [Google Scholar] [CrossRef]
  13. Pache, M.C.B.; Sant’Ana, D.A.; Rezende, F.P.C.; Porto, J.V.A.; Rozales, J.V.A.; Weber, V.A.M.; Oliveira Junior, A.S.; Garcia, V.; Naka, M.H.; Pistori, H. Non-intrusive estimation of live body biomass of Pintado Real® fingerlings: A trait selection approach. Ecol. Inform. 2022, 68, 101509. [Google Scholar] [CrossRef]
  14. Pache, M.C.B.; Sant’Ana, D.A.; Rozales, J.V.A.; Weber, V.A.M.; Oliveira Junior, A.S.; Garcia, V.; Pistori, H.; Naka, M.H. Prediction of fingerling biomass with deep learning. Ecol. Inform. 2022, 71, 101785. [Google Scholar] [CrossRef]
  15. Peixebr. Brazilian Fish Farming Yearbook PEIXE BR 2024. Tilapia Reaches 579,080 t and Represents 65% of Brazilian Production. 2024. Rua Claudio Soares, 72-cj. 417-Pinheiros-São Paulo/SP-Brazil-CEP 05422-030. Available online: https://www.peixebr.com.br/anuario-2024/ (accessed on 2 April 2025).
  16. Kutner, M.H.; Nachtsheim, C.J.; Neter, J.; Li, W. Applied Linear Statistical Models. 2004. Available online: https://d1b10bmlvqabco.cloudfront.net/attach/is282rqc4001vv/is6ccr3fl0e37q/iwfnjvgvl53z/Michael_H_Kutner_Christopher_J._Nachtsheim_JohnBookFi.org.pdf (accessed on 12 April 2025).
  17. Russ, J.C. The Image Processing Handbook; CRC Press: Boca Raton, FL, USA, 2006. [Google Scholar]
  18. Li, W.; Goodchild, M.F.; Church, R. An efficient measure of compactness for two-dimensional shapes and its application in regionalization problems. Int. J. Geogr. Inf. Sci. 2013, 27, 1227–1250. [Google Scholar] [CrossRef]
  19. Palomares, M.L.; Pauly, D. A multiple regression model for prediction the food consumption of marine fish populations. Mar. Freshw. Res. 1989, 40, 259–273. [Google Scholar] [CrossRef]
  20. Li, D.; Yang, Y.; Zhao, S.; Yang, H. A fish image segmentation methodology in aquaculture environment based on multi-feature fusion model. Mar. Environ. Res. 2023, 190, 106085. [Google Scholar] [CrossRef]
  21. Oliveira Junior, A.S.; Sant’Ana, D.A.; Pache, M.C.B.; Garcia, V.; Weber, V.A.M.; Astolfi, G.W.F.L.; Menezes, G.V.; Menezes, G.K.; Albuquerque, P.L.F.; Costa, C.S.; et al. Fingerlings mass estimation: A comparison between deep and shallow learning algorithms. Smart Agric. Technol. 2021, 1, 100020. [Google Scholar] [CrossRef]
  22. Silva, F.V.; Sarmento, N.L.A.F.; Vieira, J.S.; Tessitore, A.J.A.; Oliveira, L.L.S.; Saraiva, E.P. Característicasmorfométricas, rendimentos de carcaça, filé, vísceras e resíduosemtilápias-do-niloemdiferentesfaixas de peso. Ver. Bras. Zootec. 2009, 38, 1407–1412. [Google Scholar] [CrossRef]
  23. Hair, J.F.; Black, W.C.; Babin, B.J.; Anderson, R.E.; Tatham, R.L. Multivariate Data Analysis; Cengage Learning: Hampshire, UK, 2019. [Google Scholar]
  24. Melo, C.C.V.; Reis Neto, R.V.; Costa, A.C.; Freitas, R.T.F.; Freato, T.A.; Souza, U.N. Direct and indirect effects of measures and reasons morphometric on the body yield of Nile tilapia, Oreochromis niloticus. Acta Sci. Anim. Sci. 2013, 35, 357–363. [Google Scholar] [CrossRef]
  25. Reis Neto, R.V.; Freitas, R.T.F.; Serafini, M.A.; Costa, A.C.; Freato, T.A.; Rosa, P.V.; Allaman, I.B. Interrelationships between morphometric variables and rounded fish body yields evaluated by path analysis. Rev. Bras. Zootec. 2012, 41, 1576–1582. [Google Scholar] [CrossRef]
  26. Collins, G.S.; Groot, J.A.; Dutton, S.; Omar, O.; Shanyinde, M.; Tajar, A.; Voysey, M.; Wharton, R.; Yu, L.M.; Moons, K.; et al. External validation of multivariable prediction models: A systematic review of methodological pipelines and reports. BMC Med. Res. Methodol. 2014, 14, 1–11. [Google Scholar] [CrossRef] [PubMed]
  27. Roberts, D.R.; Bahn, V.; Ciuti, S.; Boyce, M.S.; Elith, J.; Guillera-Arroita, G.; Hauenstein, S.; Lahoz-Monfort, J.J.; Schröder, B.; Thuiller, W.; et al. Cross-validation strategies for data with temporal, spatial, hierarchical, or phylogenetic structure. Ecography 2017, 40, 913–929. [Google Scholar] [CrossRef]
  28. Gladju, J.; Kamalam, B.S.; Kanagaraj, A. Applications of data mining and machine learning framework in aquaculture and fisheries: A review. Smart Agric. Technol. 2022, 2, 100061. [Google Scholar] [CrossRef]
  29. Gao, Z.; Huang, J.; Chen, J.; Shao, T.; Ni, H.; Cai, H. Deep transfer learning-based computer vision for real-time harvest period classification and impurity detection of Porphyra haitnensis. Aquac. Int. 2024, 32, 5171–5198. [Google Scholar] [CrossRef]
  30. Dembani, R.; Karvelas, I.; Akbar, N.A.; Rizou, S.; Tegolo, D.; Fountas, S. Agricultural data privacy and federated learning: A review of challenges and opportunities. Comput. Electron. Agric. 2025, 232, 110048. [Google Scholar] [CrossRef]
  31. Silva, E.T.L.D.; Pedreira, M.M.; Moura, G.D.S.; Pereira, D.K.A.; Otoni, C.J. Larval culture of Nile tilapia lineages at different storage densities. Rev. Caatinga 2016, 29, 709–715. [Google Scholar] [CrossRef]
  32. Fujimura, K.; Okada, N. Development of the embryo, larva and early juvenile of Nile tilapia Oreochromis niloticus (Pisces: Cichlidae). Developmental staging system. Dev. Growth Differ. 2007, 49, 301–324. [Google Scholar] [CrossRef]
  33. Lazzari, R.; Peixoto, N.; Hermes, L.; Villes, V.; Durigon, E.; Uczay, J. Feeding rates affect growth, metabolism and oxidative status of Nile tilapia rearing in a biofloc system. Trop. Anim. Health Prod. 2024, 56, 208. [Google Scholar] [CrossRef]
  34. Peres, H.; Oliva-Teles, A.; Pezzato, L.; Furuya, W.; Freitas, J.; Satori, M.; Barros, M.; Carvalho, P. Growth performance and metabolic responses of Nile tilapia fed diets with different protein to energy ratios. Aquaculture 2022, 547, 737493. [Google Scholar] [CrossRef]
Figure 1. (A) Fish image collection platform; (B) Image of the fish in the bounding box; (C) Contour image of the fish body; (D) Neural Network segmented fish. Source: Own authorship.
Fishes 10 00371 g001
Figure 2. Data augmentation techniques in the generalization of the Machine Learning algorithm. Source: Own authorship.
Fishes 10 00371 g002
Figure 3. Biplot–Principal Component Analysis was performed based on the morphometric characteristics of the fish. The graph displays the distribution of individuals (black dots) relative to the first two principal components, Dim1 (56.9%) and Dim2 (23%), which collectively explain 79.9% of the total data variability. The blue arrows represent the morphometric variables used in the analysis, indicating their direction and contribution to data separation. Arrow length correlates with each variable’s importance (also represented by color intensity–see contribution scale on the right). Variables with greater length and intensity contribute more significantly to dimensional variation. The labels ‘C1’, ‘C2’, etc., denote centroids of the identified clusters. The proximity between variables and groups suggests an association between morphometric characteristics and individual clustering patterns. Source: Own authorship.
Fishes 10 00371 g003
Figure 4. The importance of the Variables in each Principal Component (AC). Source: Own authorship. MA: major axis; SA: minor axis, RMM: major minor axis ratio, CX: X centroid, and CY: Y centroid.
Fishes 10 00371 g004
Figure 5. Correlation between the variables extracted in the segmentation of body weight and predicted body weight. Source: Own authorship. MA: major axis; SA: minor axis, RMM: major minor axis ratio, CX: X centroid, and CY: Y centroid.
Fishes 10 00371 g005
Table 1. Parameters, estimates, standard error, lower limit (LI), upper limit (LS), and coefficient of determination (R2) of the models obtained and validated.
ModelsParameterEstimateStandard ErrorLILSR2
Model Stepwise
ObtainedIntercepto17.7601.70214.43221.1030.99
Area0.000750.0000110.0007329280.000774872
MA−0.08480.002712−0.090146016−0.079514584
SA−0.10830.007221−0.122491848−0.094184352
CX0.003450.0002480.0029627360.003936464
ValidationIntercepto23.5674.20015.33531.7990.99
Area0.00080.0000260.0007496580.000853342
MA−0.09740.006705−0.1105229−0.0842393
SA−0.12810.01735−0.16209−0.094078
CX0.004360.00060.0031848960.005536504
Final Model
ObtainedIntercepto−28.830.5742−29.53−27.70.99
Area0.0004620.000012430.000459370.00046427
CX0.0042340.0003870.00362870.004839
ValidationIntercepto−28.860.6946−29.81−27.090.99
Area0.0004620.000015140.000459760.0004657
CX0.0039170.00037390.0031837550.004650813
LI: lower limit; LS: upper limit; R2: coefficient of determination; MA: major axis; SA: minor axis; CX: X centroid.
Disclaimer/Publisher’s Note: The statements, opinions and data contained in all publications are solely those of the individual author(s) and contributor(s) and not of MDPI and/or the editor(s). MDPI and/or the editor(s) disclaim responsibility for any injury to people or property resulting from any ideas, methods, instructions or products referred to in the content.