Article

YOLO-DFAM-Based Onboard Intelligent Sorting System for Portunus trituberculatus

1
Key Laboratory of Fisheries Remote Sensing Ministry of Agriculture and Rural Affairs, East China Sea Fisheries Research Institute, Chinese Academy of Fishery Sciences, Shanghai 200090, China
2
School of Navigation and Naval Architecture, Dalian Ocean University, Dalian 116023, China
3
School of Information Engineering, Huzhou University, Huzhou 313000, China
4
Laoshan Laboratory, Qingdao 266237, China
*
Authors to whom correspondence should be addressed.
Fishes 2025, 10(8), 364; https://doi.org/10.3390/fishes10080364
Submission received: 25 June 2025 / Revised: 21 July 2025 / Accepted: 23 July 2025 / Published: 25 July 2025

Abstract

This study addresses the challenges of manual measurement bias and low robustness in detecting small, occluded targets in complex marine environments during real-time onboard sorting of Portunus trituberculatus. We propose YOLO-DFAM, an enhanced YOLOv11n-based model that replaces the global average pooling in the Focal Modulation module with a spatial–channel dual-attention mechanism and incorporates the ASF-YOLO cross-scale fusion strategy to improve feature representation across varying target sizes. These enhancements significantly boost detection, achieving an mAP@50 of 98.0% and precision of 94.6%, outperforming RetinaNet-CSL and Rotated Faster R-CNN by up to 6.3% while maintaining real-time inference at 180.3 FPS with only 7.2 GFLOPs. Unlike prior static-scene approaches, our unified framework integrates attention-guided detection, scale-adaptive tracking, and lightweight weight estimation for dynamic marine conditions. A ByteTrack-based tracking module with dynamic scale calibration, EMA filtering, and optical flow compensation ensures stable multi-frame tracking. Additionally, a region-specific allometric weight estimation model (R2 = 0.9856) reduces dimensional errors by 85.7% and maintains prediction errors below 4.7% using only 12 spline-interpolated calibration sets. YOLO-DFAM provides an accurate, efficient solution for intelligent onboard fishery monitoring.
Key Contribution: Proposing YOLO-DFAM with dual-attention gating and ASF-YOLO fusion. This work achieves 98.0% mAP@50 for real-time crab detection in marine environments. The resource-scalable system (<7.2 GFLOPs) integrates dynamic calibration-enabled tracking (R2 = 0.9856 weight modeling), providing an approach designed to support future onboard monitoring of fishery resource dynamics.

1. Introduction

Due to the diminishing global fisheries resources and the pressing necessity for sustainable ocean development, there is an imperative for transformative improvements in marine biomass monitoring technology [1]. Portunus trituberculatus is a significant species within the family Portunidae [2]. The management of its resources is of standard importance. Data indicate that the yearly harvest of Portunus trituberculatus in China surpasses 500,000 tons [3]. The East China Sea, being the principal producing region for Chinese pike crabs, contributes 50% of the national yearly output [4]. Historical catch statistics indicate that the output of Portunus trituberculatus has undergone substantial phase alterations during the 1980s. Since 1980, the annual catches of Portunus trituberculatus in Zhejiang Province, China, have consistently risen, peaking at 200,000 tons in the East China Sea before progressively declining and then stabilizing at 150,000 tons [3]. Fishery evaluations indicate that Portunus trituberculatus in the East China Sea requires more rational harvesting strategies [5]. During the same timeframe, the 2024 pike catch rose by 0.74% relative to 2023 [6]. The information asymmetry between resource assessment and fishing intensity demonstrates that real-time biomass monitoring during fishing operations is closely correlated with the precision of resource assessment and the efficacy of quota management system implementation. Simultaneously, per-capita fish consumption in China has consistently risen since 2017, reaching a zenith of 15.2 kg in 2023 [7]. The implementation of a singular stringent quota fishing system may fail to meet the escalating consumer demand and might also diminish fishermen’s revenue. Consequently, it is essential to investigate the inherent factors influencing the variability of pike crab resources and to formulate methods for their sustainable utilization. A real-time sorting and monitoring system designed for potential onboard deployment is urgently needed to automatically document catch quantities and biological metrics, such as pike crab weight and carapace width, and transmit this refined data to the management department. This will facilitate dynamic quota adjustments based on current pike crab demand and resource quality in each marine region, thereby enhancing operational efficiency for fishermen in high-quality fisheries while ensuring the sustainable utilization of pike crab resources. The practical issue with the existing technique is that the conventional manual measuring method exhibits statistical bias and fails to provide a precise classification of catch quality. Compared to automated detection systems and electronic monitoring, manual measurement methods suffer from observer subjectivity, low repeatability, and poor efficiency, especially in high-throughput operations onboard vessels. Traditional tools such as rulers or callipers require human intervention, which is labor-intensive and error-prone under dynamic lighting, vibration, and wet conditions. In contrast, vision-based automated detection systems—powered by deep learning—enable real-time, objective, and high-frequency measurements of biological indicators (e.g., size, weight), supporting quota-based fisheries management with greater reliability. Moreover, electronic monitoring systems have shown success in other sectors such as prawn and pelagic fisheries, but high-value crustaceans like pike crabs still lack robust, quality-based grading tools adaptable to real-sea scenarios. In recent years, automated detection systems utilizing computer vision are progressively supplanting manual measuring [8]. Electronic monitors have been implemented to supplant conventional manual monitoring in the assessment of fishing effort for aquatic goods, including prawns and fish [9]. Nonetheless, there is an absence of sophisticated grading methods predicated on quality (e.g., weight, size) for high-value species like pike crabs. Current deep-learning weight measuring techniques for pike crabs are mostly developed and evaluated in controlled laboratory settings. These methods fail to adjust to authentic fishing situations. In actual applications, the conveyor belt of the fishing vessel is subject to intricate backdrops and dynamic alterations, including waves and variations in lighting, which impose elevated demands on the model’s durability and accuracy. Consequently, the successful application of deep-learning models to real-world fishing scenarios and the resolution of tiny target recognition issues inside complicated backgrounds has emerged as a prominent and challenging focus in contemporary research. Several recent studies have applied deep-learning models to the detection and classification of crustaceans, but they still fall short under dynamic real-sea environments. Zhang et al. [10] proposed a lightweight YOLOv5-based detection network for marine organisms, incorporating GhostBottleneck modules and CBAM attention mechanisms to improve feature discrimination in underwater scenes. Their method achieved an mAP@0.5 of 82.8% at 48.5 FPS and was tested in aquaculture tanks under controlled lighting and water conditions. However, their model lacks adaptability to multi-scale targets and provides no support for real-time tracking or weight estimation on moving conveyor belts onboard vessels.
Similarly, Zhou et al. [11] introduced a YOLOF-based soft-shell crab detection algorithm enhanced with mixed convolution (MConv), CARAFE feature upsampling, and explicit visual center (EVC) mechanisms. Although they reported a 5.4% mAP improvement over baseline YOLOv5s in laboratory experiments, their model only classifies molt stages and does not perform continuous monitoring, scale calibration, or weight prediction—functions that are essential in practical fishery operations.
These studies highlight two common limitations: (1) a strong reliance on static, controlled environments for evaluation, and (2) a lack of real-time multi-tasking capacity, such as integrated tracking, calibration, and estimation under variable sea-surface conditions. These gaps directly motivate the design of our proposed model YOLO-DFAM, which is developed to perform real-time multi-object detection, size-weight estimation, and robust tracking under complex and noisy marine backgrounds. It addresses both the technical and operational challenges overlooked in prior works.
The primary local and international technical methods for detecting fishing operations encompass background extraction [12]. Conventional image processing techniques, including edge detection [13] and morphological processing [14], typically exhibit low accuracy, are susceptible to interference from ambient light and noise, and often fail to detect or misidentify small targets (e.g., pikes and crabs) in intricate environments. The alternative is a deep-learning technique exemplified by convolutional neural networks (CNNs), which can provide precise detection and tracking of fishing items, demonstrating a substantial increase in accuracy relative to conventional approaches. This work proposes an enhanced YOLOv11 model to augment the detection and tracking precision of crab bodies on a conveyor belt aboard a pike crab fishing vessel. By combining the optimized Focal Modulation [15] module and ASF-YOLO architecture [16], the model structure was improved, and the detection accuracy was enhanced. The model not only accurately counts pike crabs of various sizes but also calculates their body weights, assesses fishing intensity and resource abundance, and provides technical support for the realization of automated systems in the future. In addition, this study realizes real-time monitoring under the complex sea surface background, which promotes the development of fishing operation automation and small target detection technology.
The main contributions of this study are summarized as follows:
  • We propose YOLO-DFAM, an enhanced YOLOv11n-based model that integrates a spatial-channel dual-attention gating mechanism to improve feature discrimination under complex marine conditions.
  • We introduce an attentional scale fusion (ASF-YOLO) module that enhances multi-scale feature aggregation, enabling accurate detection of varying-size targets such as Portunus trituberculatus.
  • We develop a real-time tracking pipeline based on ByteTrack, augmented by dynamic scale calibration, EMA filtering, and optical flow compensation, which significantly improves tracking robustness during vessel motion.
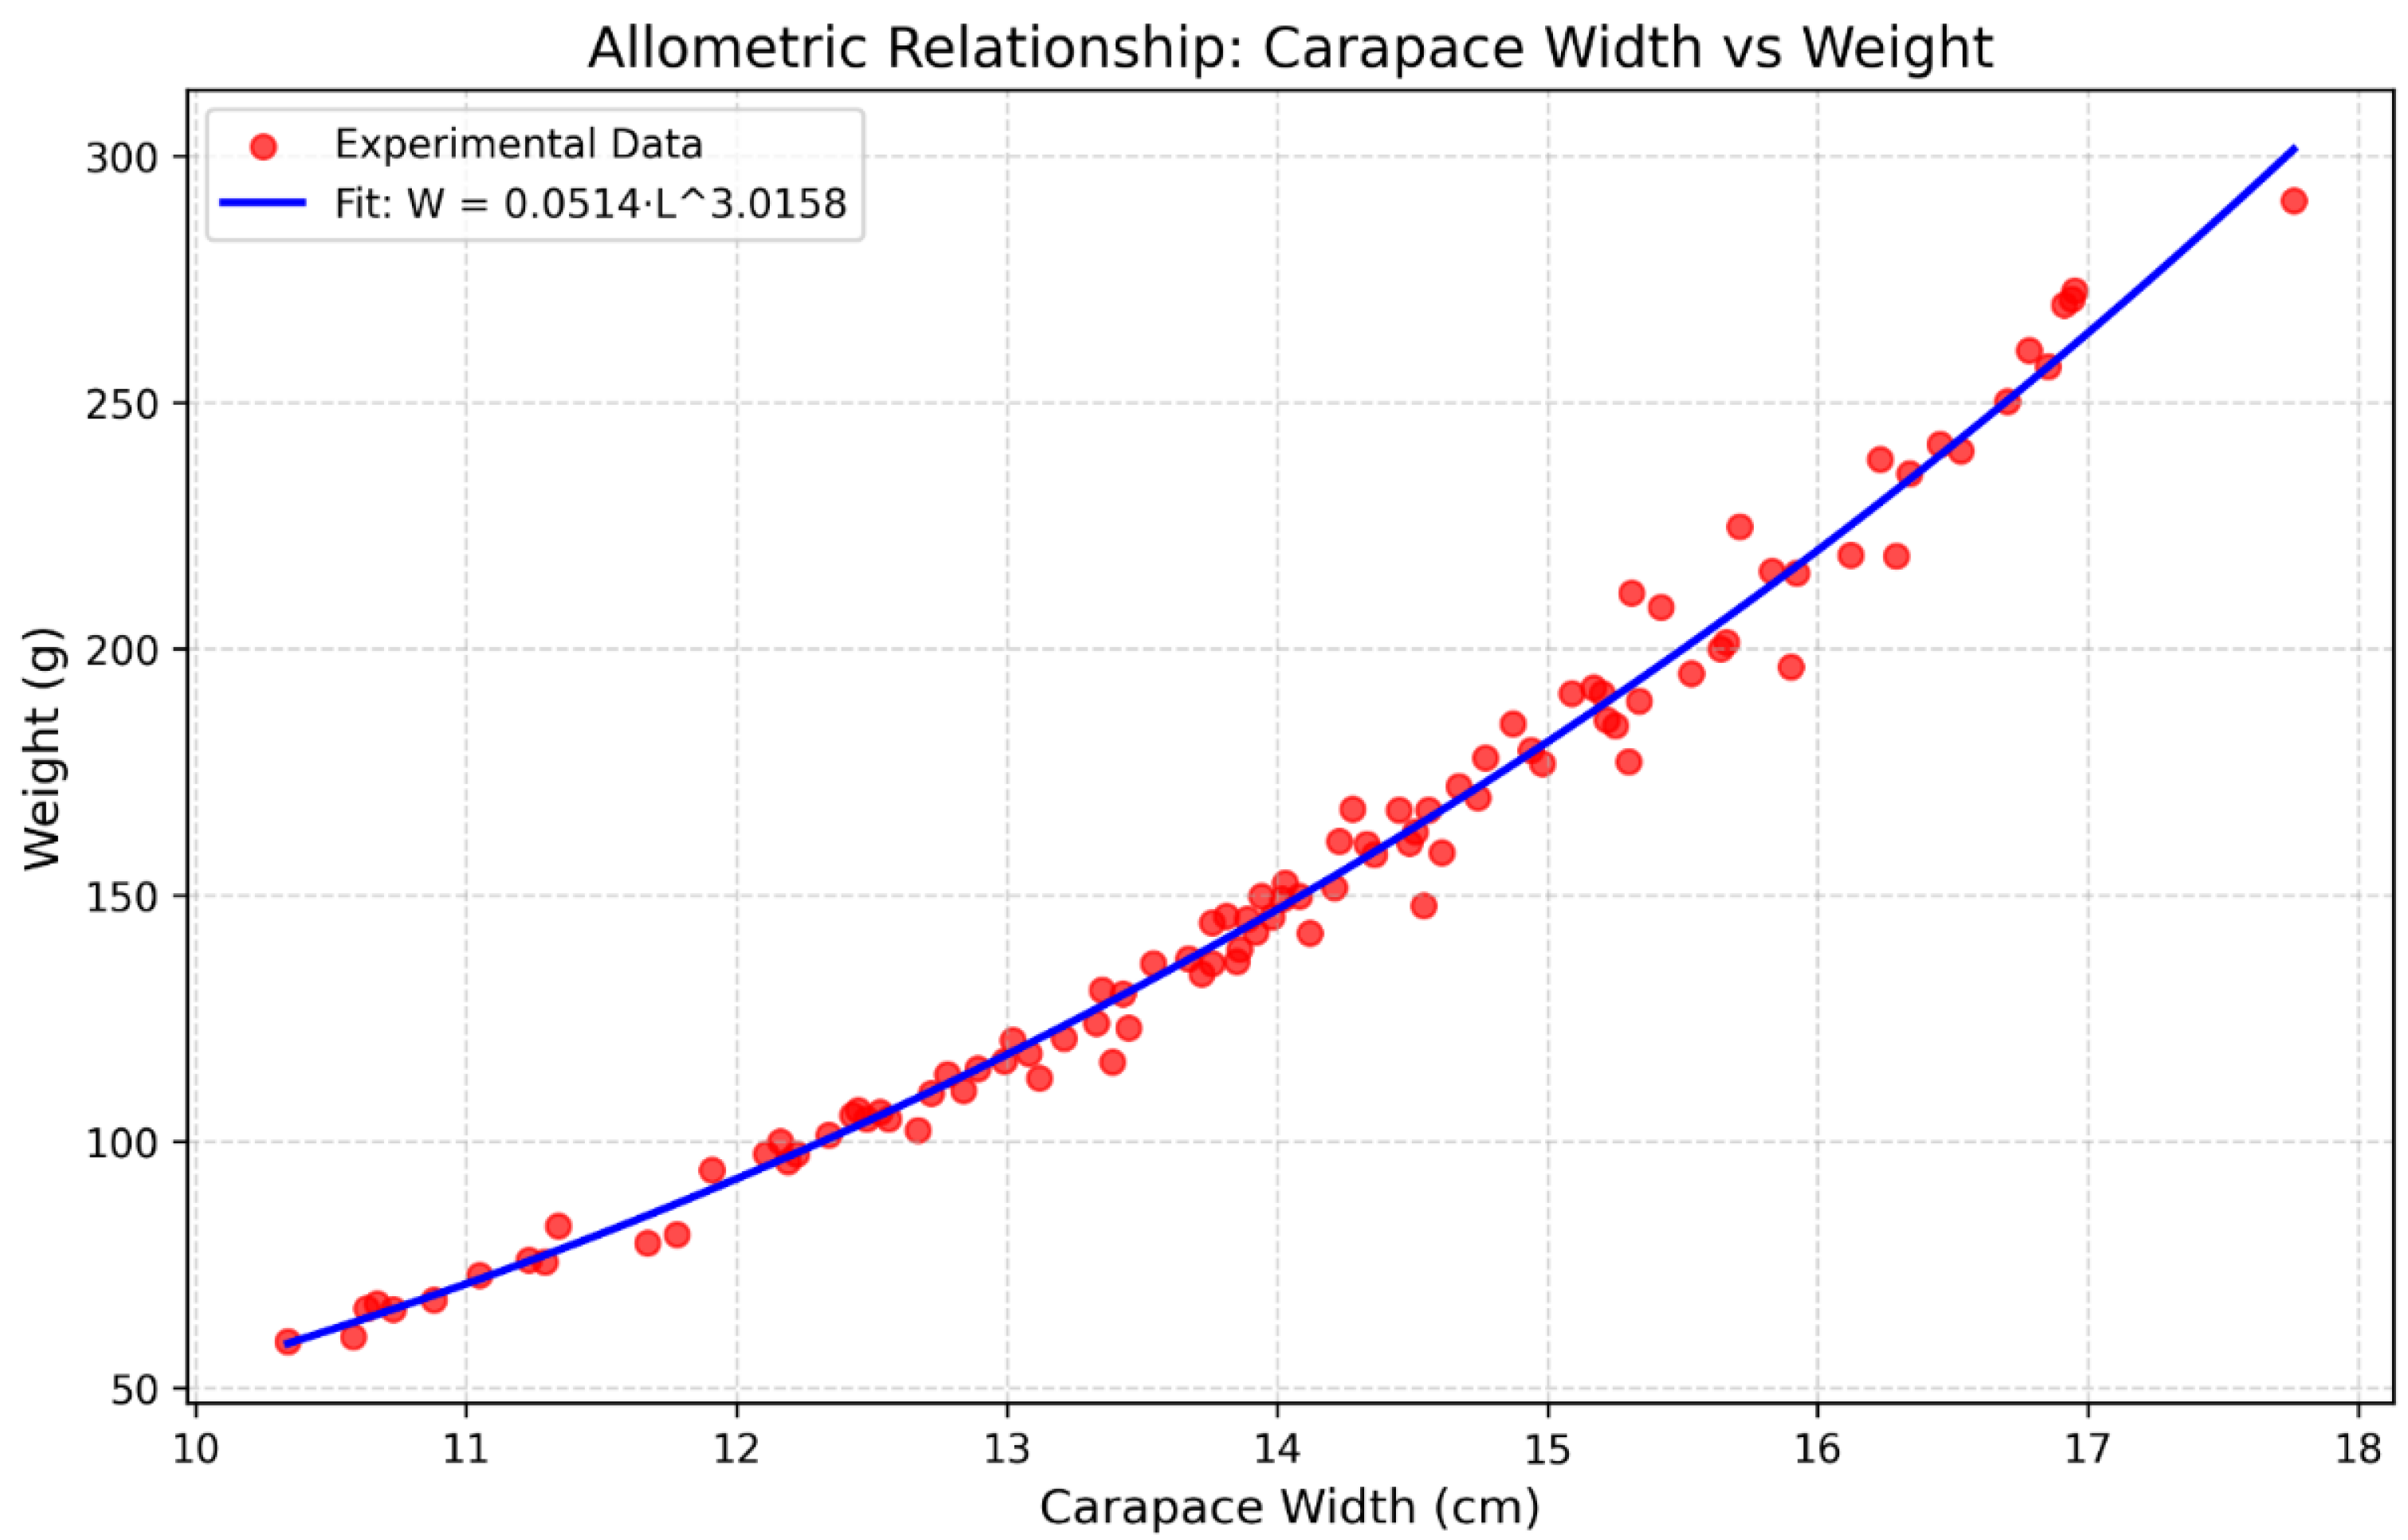
  • We design a lightweight region-specific allometric weight estimation model (R2 = 0.9856) that achieves ≤4.7% prediction error using only 12 spline-interpolation calibration sets.
  • The proposed model outperforms state-of-the-art detectors (YOLOv8n, RetinaNet-CSL, Rotated Faster R-CNN) in precision (+2.8%) while maintaining real-time inference (180.3 FPS at 7.2 GFLOPs), offering a deployable solution for intelligent fishery monitoring onboard.

2. Data and Methodology
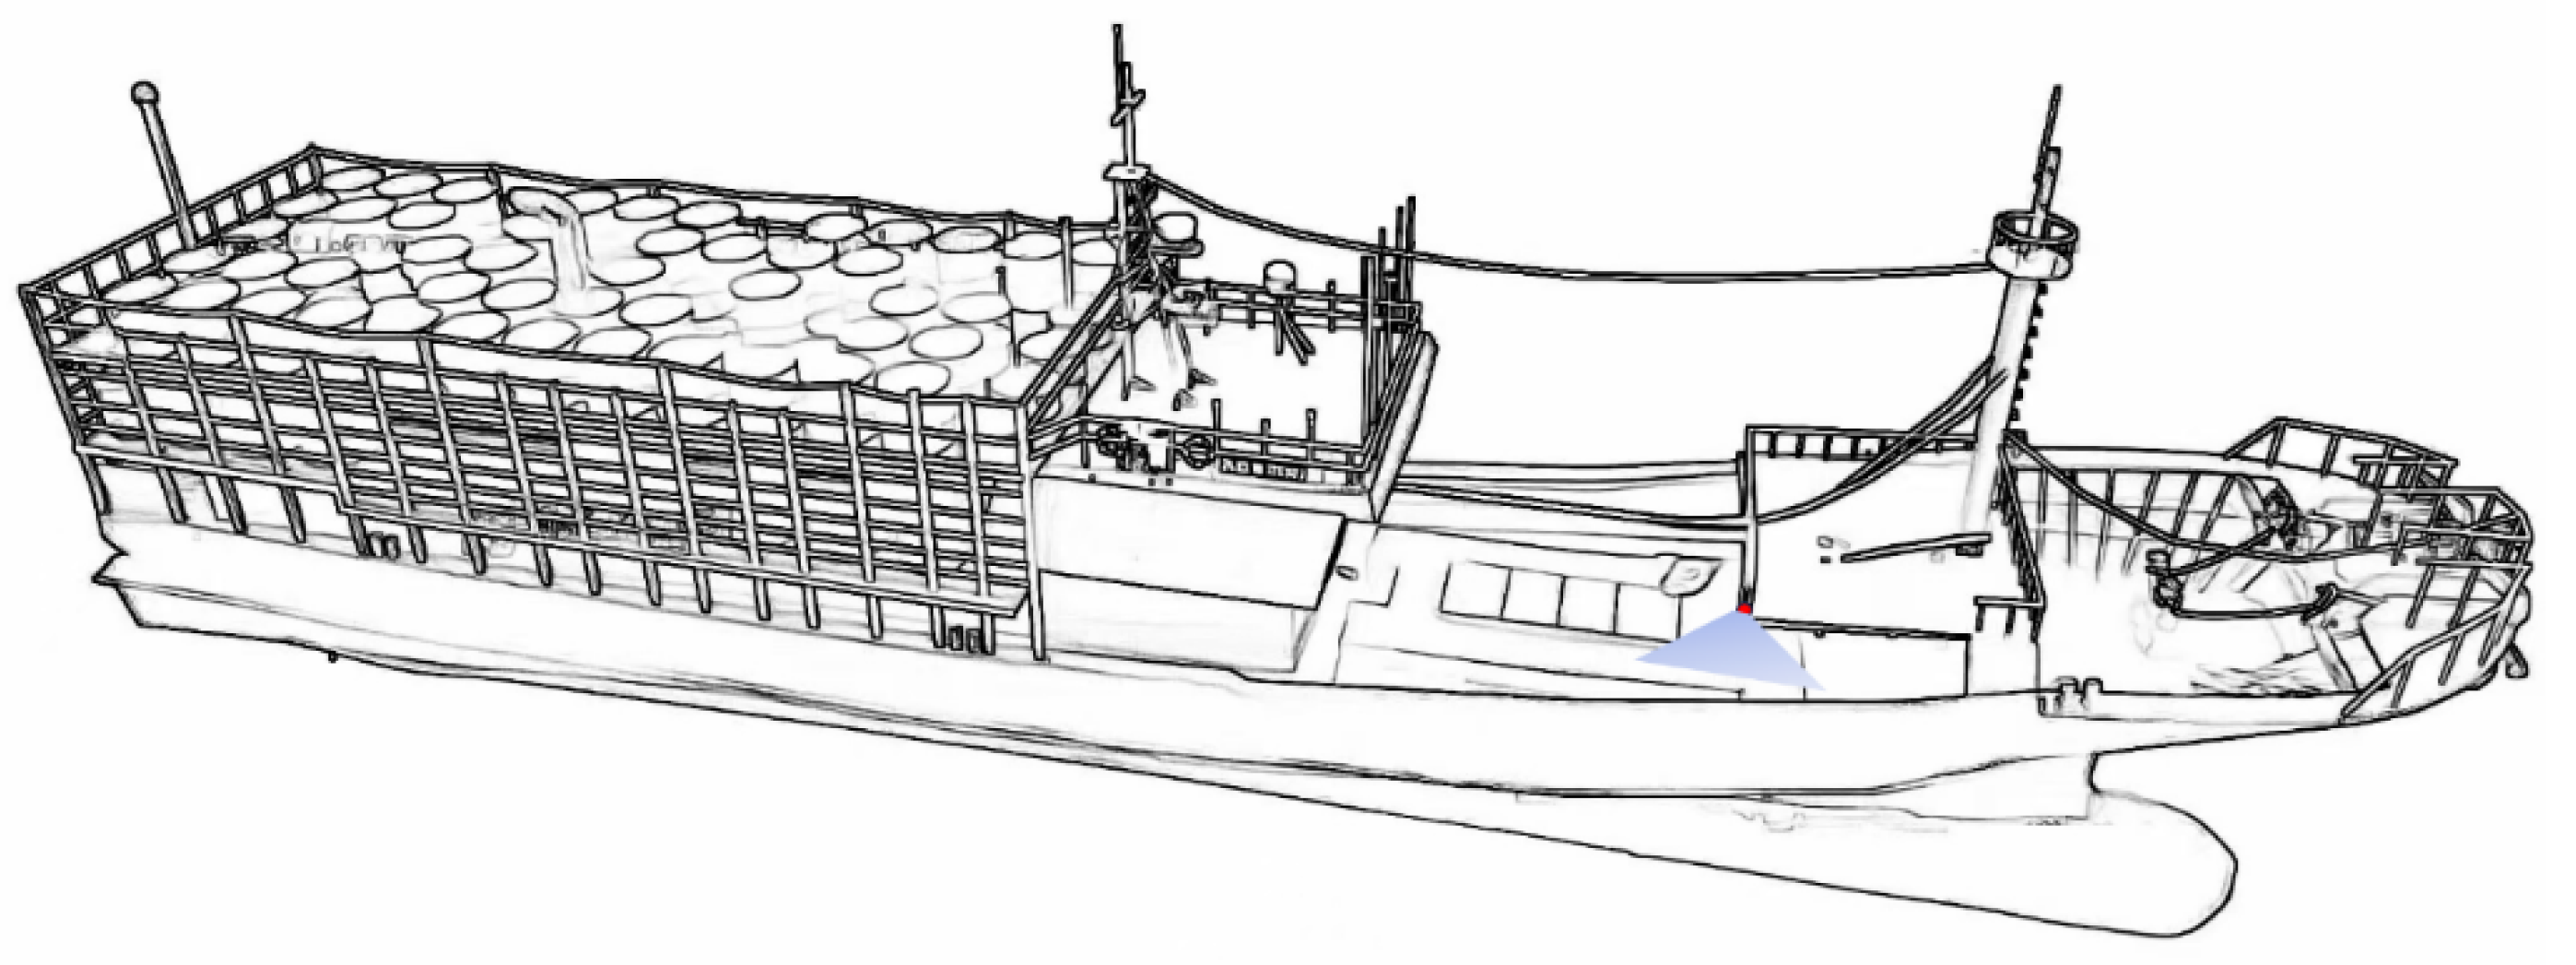
2.1. Data Sources

The movie was recorded with a 40-megapixel motion camera, including digital zoom, an f/2.8 aperture, a focal range from 0.35 m to infinity, electronic stabilization, wide-angle aberration correction, and a 3840 × 2160 pixel resolution at a frame rate of 60 fps. Following the examination and evaluation of the positioning of the current security cameras on the crab boat, a camera was chosen to be installed directly above one-third of the pike conveyor belt. The camera was affixed to the upper third of the pike conveyor belt. The installation procedure involves affixing the camera to a magnetic base and adjusting its angle appropriately by securing it to the designated cabin scaffolding. The red dots in Figure 1 denote the camera’s mounting location, while the blue region illustrates the camera’s shooting angle.

2.2. Production of Datasets

To accurately capture the real-world sorting scenarios of Portunus trituberculatus, a dataset was constructed based on video footage collected from crab trawlers operating in Daishan, Zhejiang Province—an important production area known for its representative fishing methods. Raw footage from multiple vessels was manually filtered to exclude low-quality or redundant segments. Approximately 10 min of footage per vessel were selected, and frames were extracted using PotPlayer software v.231113 (1.7.22038). A total of 419 high-quality images were obtained and manually annotated using the x-anylabelImg tool (X-AnyLabeling-CPU-2.3), where each crab was labeled with the class “crab.” Although the number of images is relatively small, each image contains over 45 crab instances on average, resulting in a total of 18,837 labeled targets. These targets exhibit significant diversity in appearance, scale, and occlusion, providing sufficient variability for training.
The dataset was partitioned into training, validation, and test sets in a 6:2:2 ratio and converted to COCO format to facilitate reproducibility and future model benchmarking. Due to the labor-intensive nature of fine-grained annotation under dense target distribution, this dataset prioritizes target richness and quality over sheer volume. The image selection and labeling strategy were carefully designed to ensure that the data accurately reflects real operating conditions and supports reliable model development. The labeled images of the dataset are shown in Figure 2.
Although data augmentation techniques (e.g., flipping, rotation, and color jitter) were initially tested, they provided limited performance gains and sometimes reduced the distinguishability of our model improvements compared to the baseline. Therefore, to maintain consistency and fairness in the evaluation process, data augmentation was not applied in the final training phase. This choice ensures that the performance differences stem primarily from architectural enhancements rather than external data manipulations.

2.3. Research Methodology

This work employs a deep-learning approach to provide target recognition of pike crab states using video data from pike crab fishing vessel operations. The video data from the pike crab sorting procedure are obtained using strategically positioned HD cameras. Video clips are analyzed, essential pictures depicting changes in the status of pike crabs are extracted, and these images are further classified and labeled after the video is examined pixel by frame to create the dataset. Upon completion of the labeling, the data are sent to the server via a detachable hard drive. The assembled target detection dataset is sent into the YOLO-DFAM network model for training. Considering the dataset’s attributes and the specific fishing needs, the original model is refined by using the updated FocalModulation module to augment its capacity for detecting tiny targets and differentiating dense targets in intricate environments. The enhanced model can more quickly ascertain the status of pike crabs and serve as a detector for their identification only. The recorded and analyzed videos of crab-capturing activities are input into the trained YOLOv11n-DFAM model for detection and integrated with the ByteTrack algorithm [17] for tracking detection counts. The evaluation of pike crab target identification and tracking findings is conducted to ascertain the feasibility and precision of the suggested methodology. Figure 3 shows the weight detection process of the swimming crab.

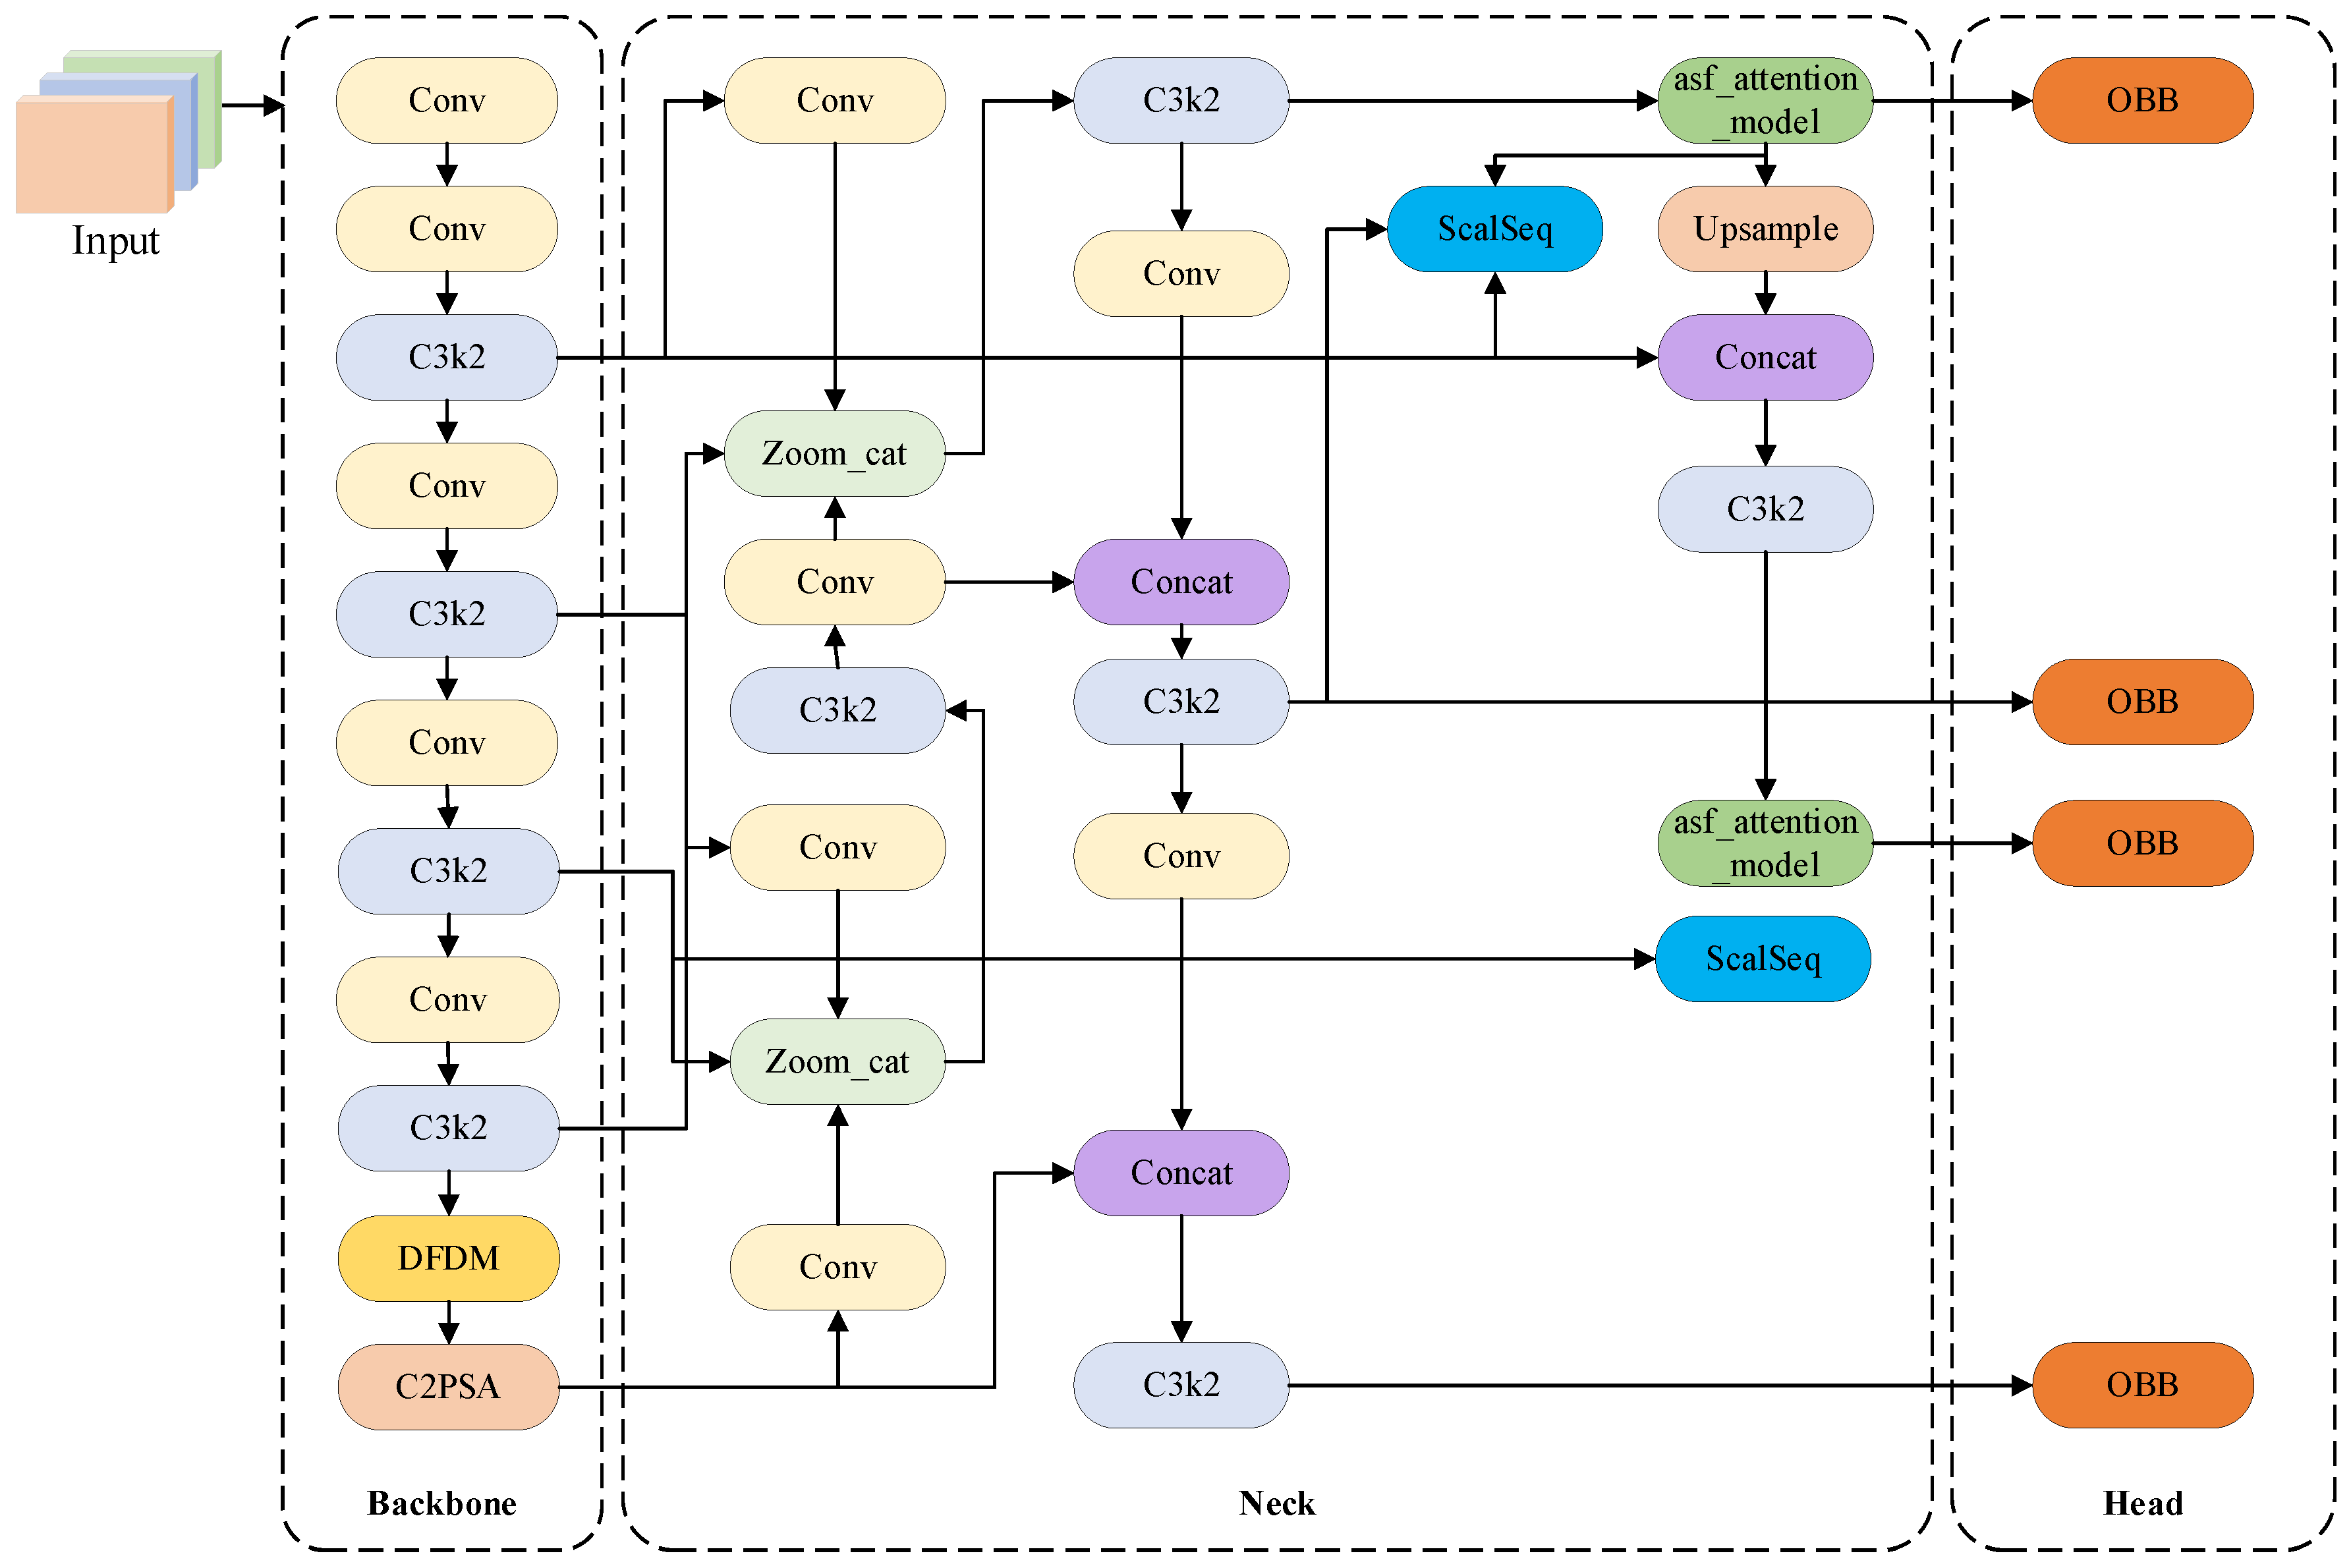
2.4. The YOLOv11 Network Model and Its Improvements

2.4.1. YOLOv11 Improvement Method

To balance detection accuracy and onboard computational efficiency, we adopt YOLOv11n as the base model. Compared with other lightweight models such as YOLOv8n, YOLOv11n offers better small-target localization and faster convergence while maintaining a lower computational load. Its modular design also facilitates the integration of attention mechanisms and multi-scale fusion, making it more adaptable to complex marine environments. However, in practical onboard scenarios, detection performance is often hindered by factors such as mutual occlusion, changes in lighting conditions, background clutter, and significant size variation of crabs. These challenges lead to missed detections, localization errors, and reduced robustness, especially when dealing with dense crab clusters or overlapping targets. Increasing model size to compensate would incur higher computational costs, which is unsuitable for deployment on fishing vessels with limited processing resources. To address these issues while preserving real-time performance, we introduce two key enhancements. First, the traditional pooling operation in the Focal Modulation module is replaced with a spatial–channel dual-attention gating mechanism to help the network focus more effectively on dense regions and suppress interference from irrelevant backgrounds like the sea surface. Second, the ASF-YOLO structure is integrated to strengthen the model’s ability to handle targets of varying sizes and alleviate occlusion by adaptively fusing multi-scale features. These enhancements are implemented with minimal increase in model complexity, forming YOLO-DFAM, a detection framework optimized for challenging marine environments. Figure 4 illustrates the enhanced model architecture.

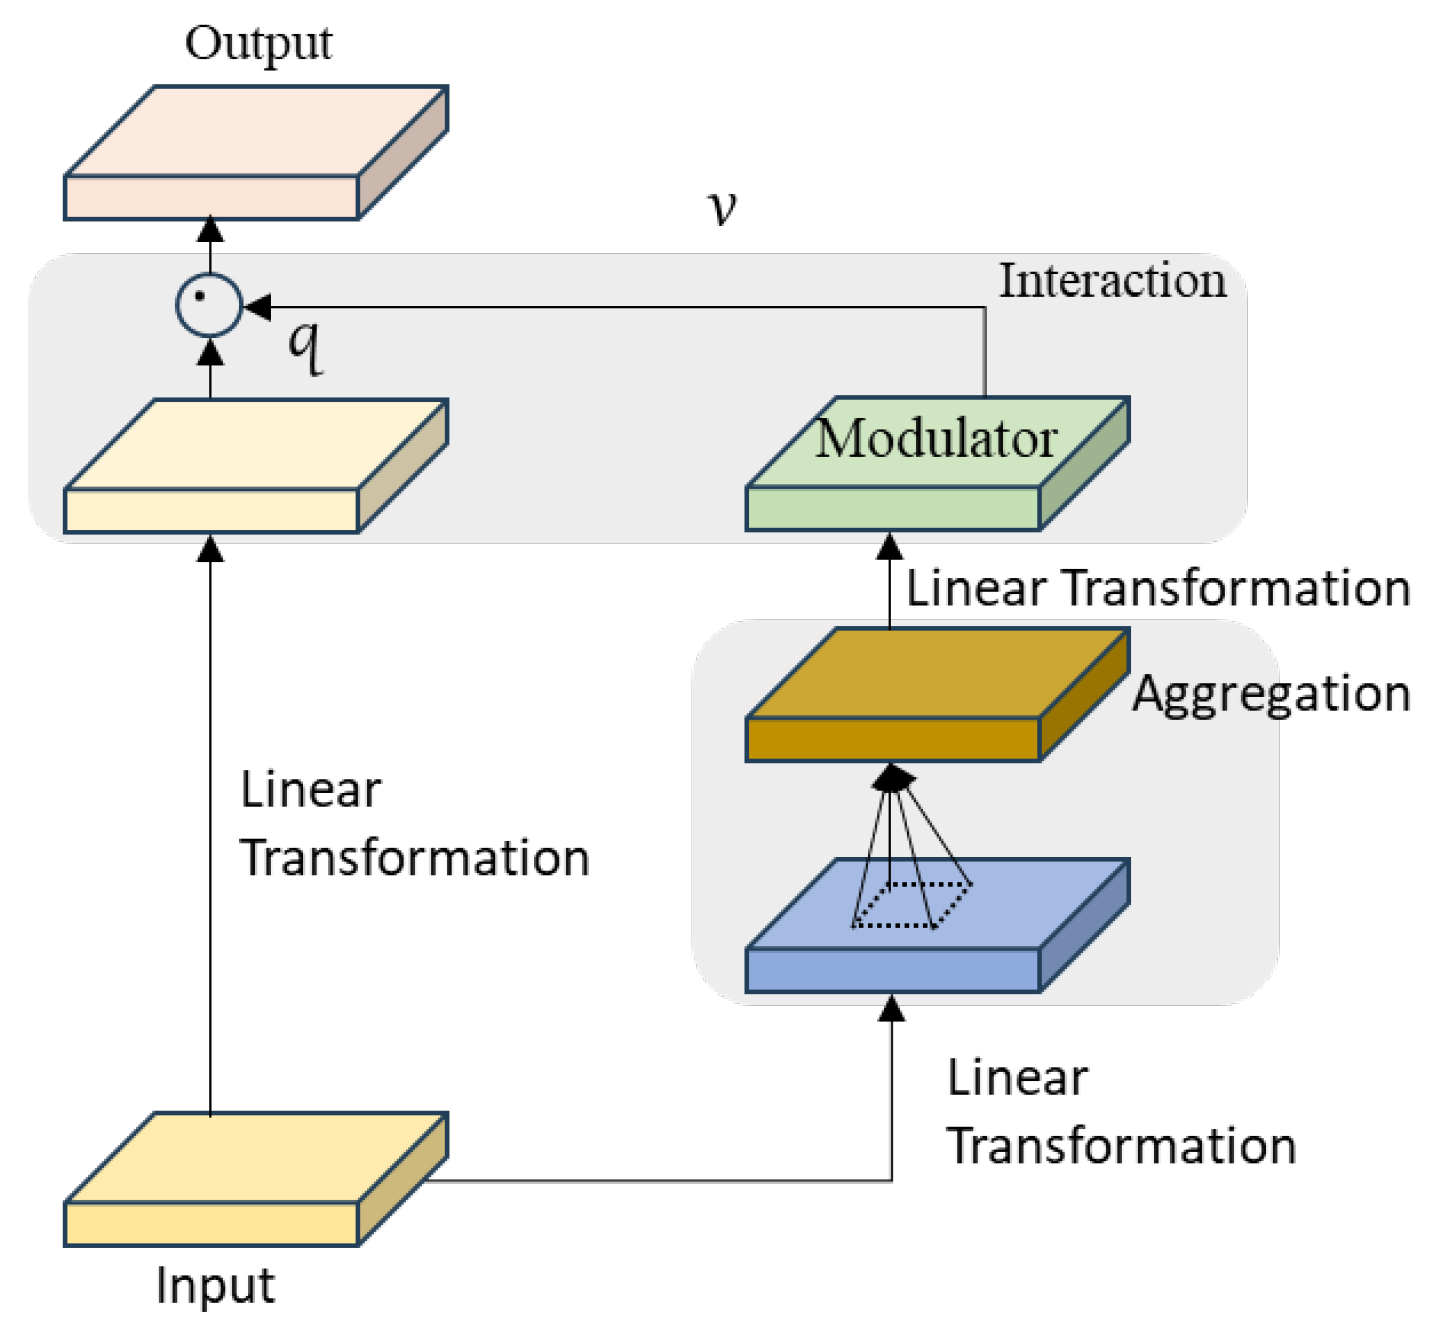
2.4.2. DualFocus Dynamic Modulation (DFDM)
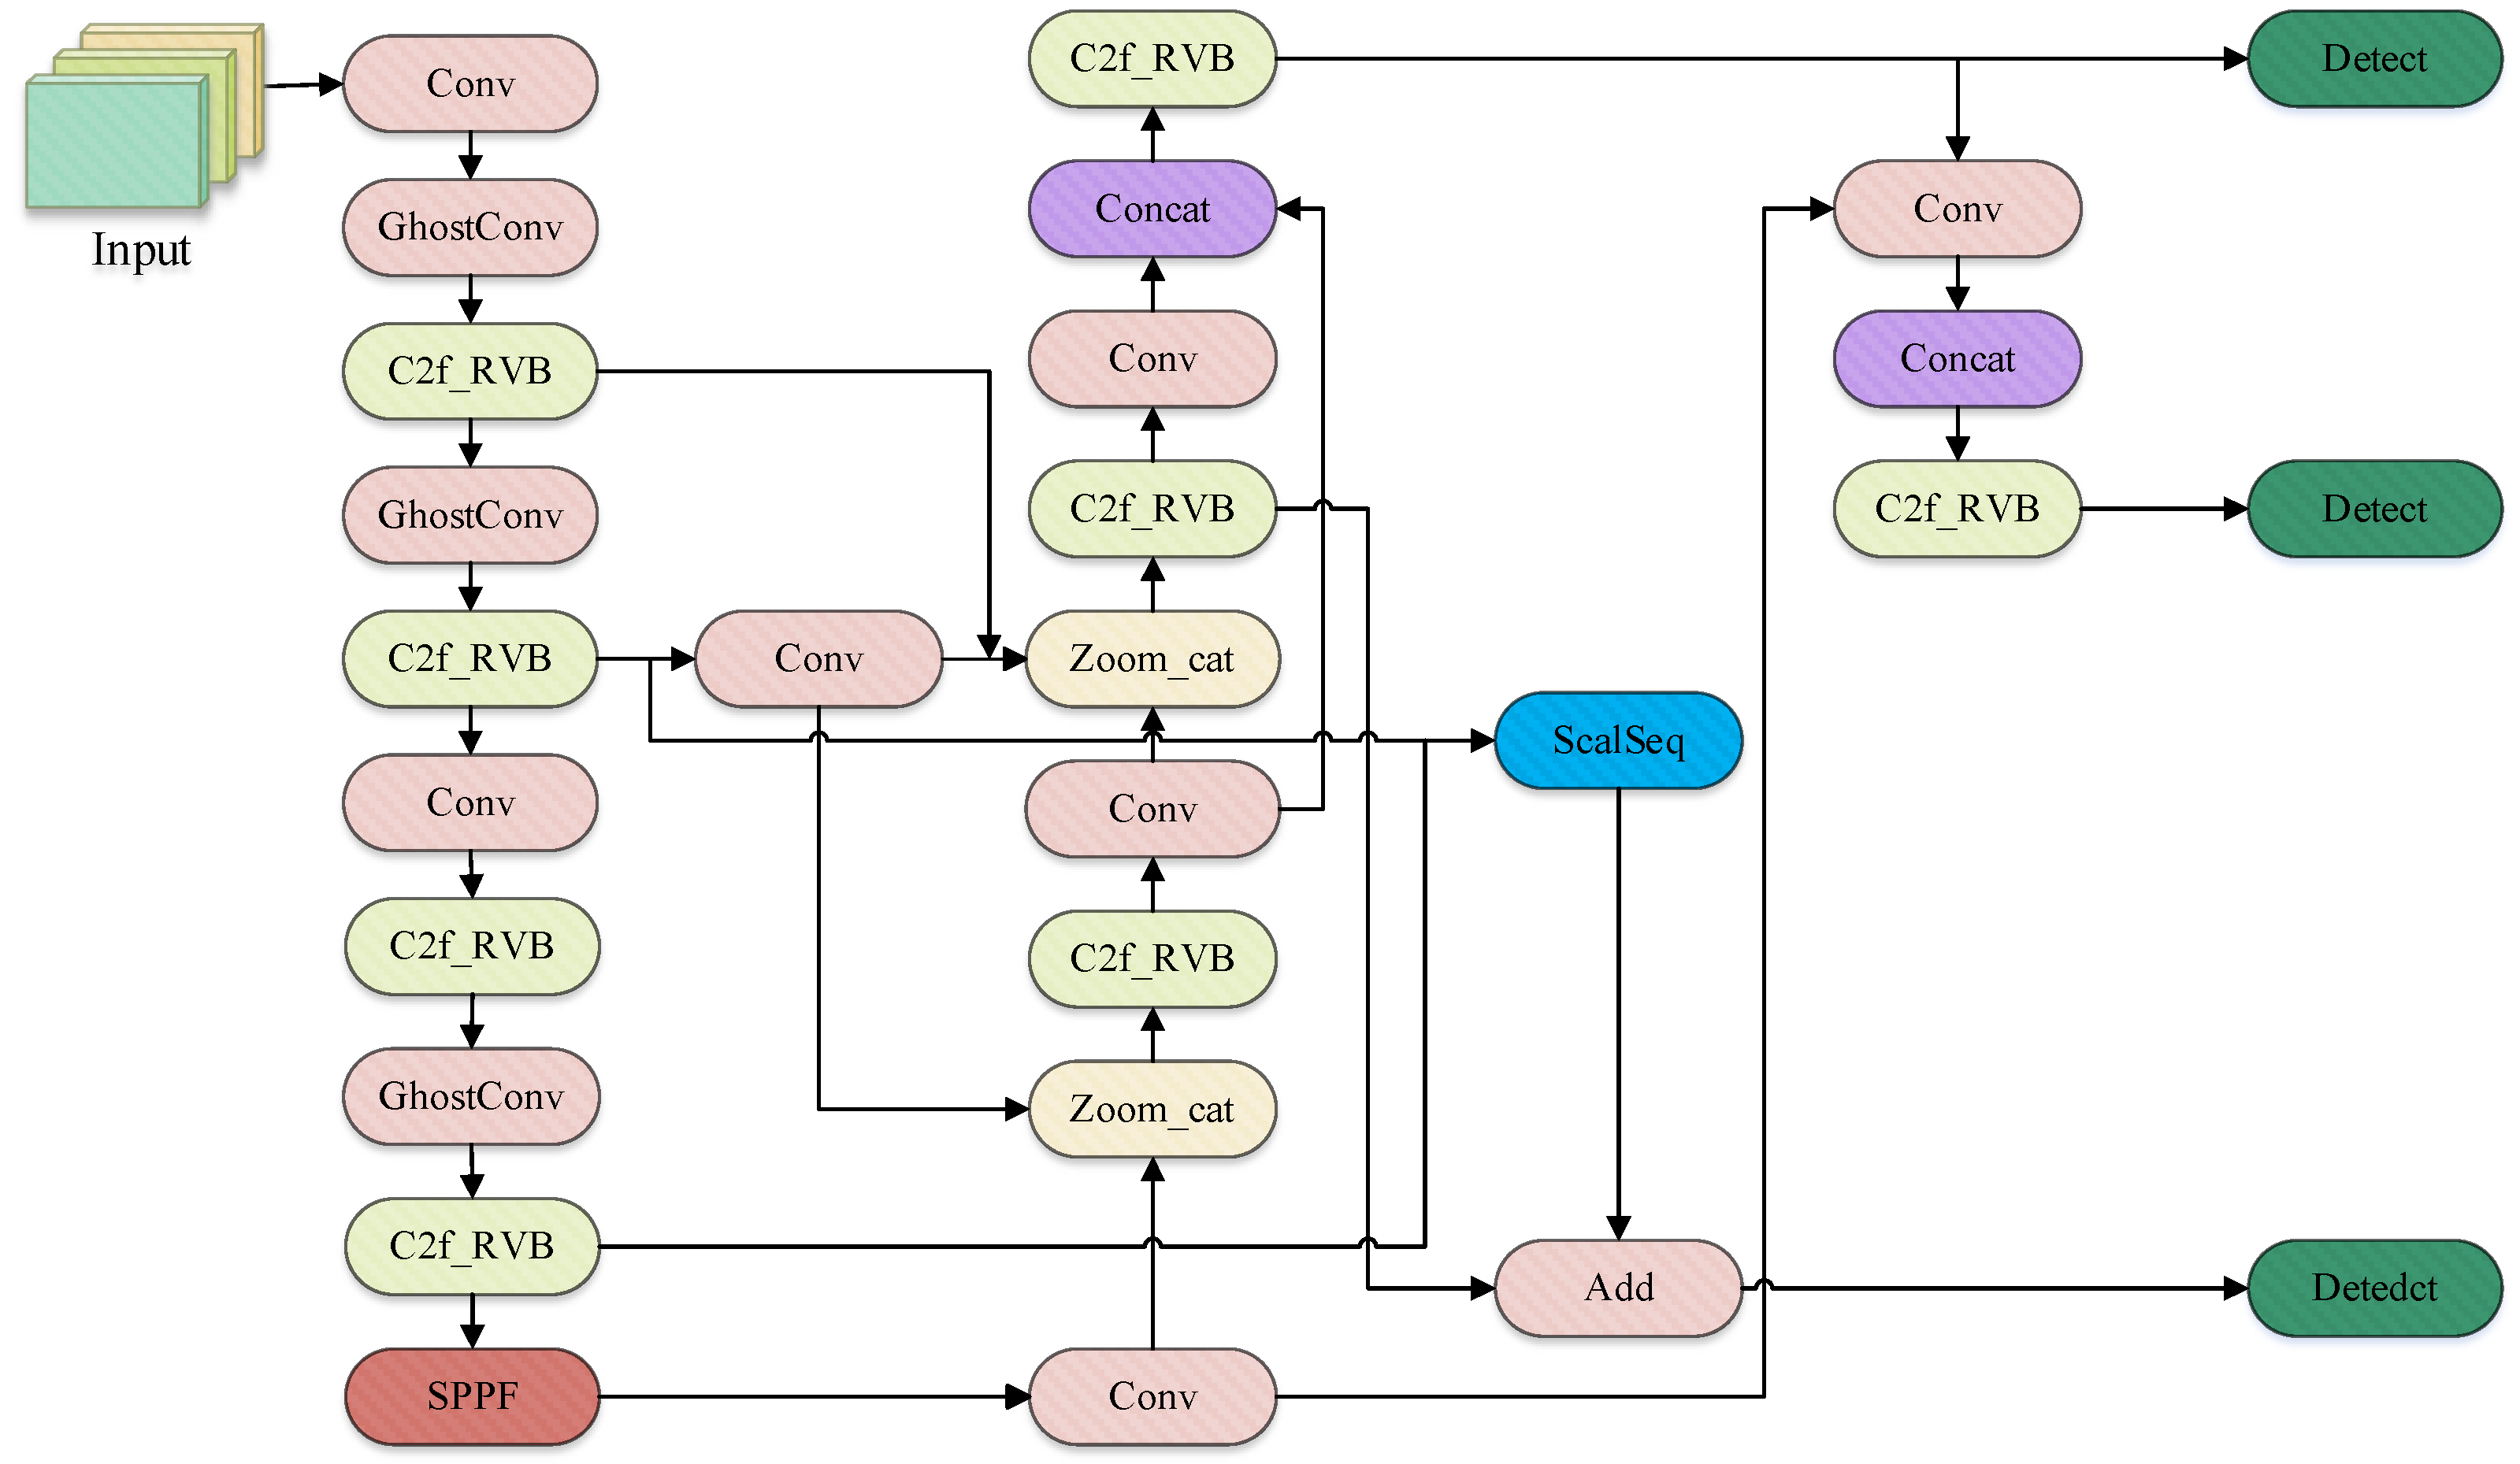
The original Global Average Pooling (GAP) mechanism is widely used in CNNs to reduce parameter count, enhance feature abstraction, and prevent overfitting. However, it suffers from insufficient sensitivity to spatial details. This paper proposes replacing GAP with a spatial-channel dual-attention gating mechanism to improve model localization capability for small targets in complex backgrounds. By introducing spatial attention to strengthen geometric pattern recognition and channel attention to boost feature discriminability in occluded environments, this mechanism enhances both detection precision and robustness. FocalModulation transforms the conventional attention paradigm by a three-stage process of “focal contextualization-gated aggregation-affine transformation.” In contrast to the comprehensive connectivity of the self-attention mechanism, FocalModulation initially employs multi-scale deep convolution (focal_level hierarchy) to extract contextual features from local details to global semantics, thereby creating a pyramidal multi-granularity representation. Subsequently, it achieves adaptive fusion of cross-scale features via DynamicGateGenerator, which produces soft selection weights informed by a spatial-channel dual-attention mechanism, allowing the model to concentrate on contextual features. Employ a dual-attention mechanism to produce soft selection weights, enabling the model to concentrate on critical regions; ultimately, the adjusted context is integrated into the original features via element-wise affine transformation to attain a balance between computational efficiency and modeling proficiency. This method eliminates the computational barrier associated with Q-K-V interaction, preserves the modeling capacity for orientation sensitivity to spinning objects, and decreases graphics memory use. This work presents the novel implementation of spatial-channel dual-attention gating inside the core module of FocalModulation for marine life detection applications. In contrast to the global average pooling gating of the original scheme, the enhanced DynamicGateGenerator realizes three improvements via parallel spatial attention branching (3 × 3 convolution for local geometric pattern recognition) and channel attention branching (adaptive rescaling for semantic weight calibration): (1) Spatial attention enhances the localization precision of rotationally sensitive features, including crab body edges and cheliped orientations. (2) Channel attention improves the localization accuracy of these features via dynamic feature channels. Channel attention preserves feature discriminative capability in occlusion situations (e.g., when a crab’s body is obscured by fishing nets) via dynamic filtering of feature channels; (3) Softmax normalization is employed in the gating fusion phase rather than Sigmoid, allowing for competitive adjustment of multi-scale feature weights, which better aligns with actual fishery detection requirements. FocalModulation network results are presented in Figure 5, and the architecture of the DynamicGateGenerator network is depicted in Figure 6.

2.4.3. ASF-YOLO

ASF-YOLO (A novel YOLO model including attentional scale sequence fusion for cell instance segmentation) is a methodology that combines attentional scale fusion (ASF) into the YOLOv11n framework, enhancing detection capabilities. ASF-YOLO adeptly captures the multi-scale attributes of pike crabs in the intricate deck environment, including the intricacies of the pike’s back armor in close-up perspectives and the outline of the crab’s body from afar, utilizing the scaled sequence fusion (SSFF) module. It integrates deep and shallow features through the triple feature encoder (TFE) module to bolster resilience against degraded information, such as crab leg fractures and texture blurring of the armor. The primary invention, Channel-Position Attention Mechanism (CPAM), dynamically concentrates on the distinctive greenish-gray carapace region and essential joints of pike crabs, facilitating precise target localization despite the presence of shells, seaweeds, and detritus. ASF-YOLO architecture is depicted in Figure 7.

3. Experimental Methods and Results

3.1. Experimental Environment

All model testing and performance evaluation were conducted in a laboratory environment using real-world video data captured onboard fishing vessels with a DJI Action 5 Pro camera. The system was deployed on a workstation running Ubuntu 18.04, with Python 3.10.11, PyTorch 1.8.2, CUDA 12.0, an AMD R5-7500F CPU, and an NVIDIA GeForce RTX 4070 Ti SUPER GPU. The model was trained using the Stochastic Gradient Descent (SGD) optimizer with an initial learning rate of 0.01, a batch size of 16, and 300 iterations. This setup enabled real-time simulation and performance evaluation using real-world marine video data, while actual onboard deployment remains a target for future work.

3.2. Experimental Evaluation Indicators

To evaluate model performance, (Precision, P), (Recall, R), model parameters, Precision-Recall (P-R) curves, and F1-score curves were utilized to measure the efficacy of the object identification model.
The calculation formulas for Precision (P) and Recall (R) are defined as follows, with values ranging from 0 to 1:
P = X T P X T P + X F P
R = X T P X T P + X F N
In the above formulas, Precision measures the proportion of actual positive samples among those predicted as positive by the model, reflecting the model’s accuracy. Recall measures the proportion of actual positive samples correctly identified by the model among all positive samples, reflecting the model’s detection capability. XTP refers to the number of successfully identified Portunus trituberculatus, XFP refers to the number of non-crab targets identified as crabs, and XFN refers to the number of crab targets erroneously identified as other targets, all in counts.
Floating point operations (FLOPs) represent the computational load of a model, measured in the number of floating-point operations, where the magnitude reflects model complexity.
As shown in Figure 8, the YOLO-DFAM model maintains a high level of precision across a broad range of recall values, indicating strong detection robustness under varying confidence thresholds. The shape and area under the P-R curve further support the reliability of the model in complex real-sea detection scenarios. The region beneath the curve signifies the mean Average Precision (mAP@50). An elevated mAP@50 value signifies enhanced model proficiency in object localization, whilst a substantial mAP@50–95 value reflects the model’s commendable accuracy throughout diverse settings. Both measurements span from 0 to 1 and function as essential evaluative markers in this investigation. Their computational formulae are presented here:
m A P @ 50 = 1 m 0 1 P ( R ) d R
m A P @ 50 95 = 1 10 j = 1 10 0 1 P ( R ) d R
FLOPs signify floating-point operations, suggesting computational complexity; mAP@50 and mAP@50–95 are dimensionless measures reflecting detection performance over varying IoU (Intersection over Union) thresholds.

3.3. Model Training Results and Analysis

3.3.1. YOLO-DFAM Model

The YOLO-DFAM model attained 94.6% accuracy, 93.4% recall, 98.0% mAP@50, and 74.4% mAP@50–95 in the detection of Portunus trituberculatus, exhibiting a processing time of 0.6 s per frame, a computational cost of 7.2 GFLOPs, and including 2,610,654 parameters. Figure 9 illustrates the outcomes of our enhanced YOLOv11-DFAM model on the dataset.

3.3.2. Ablation Experiment

To assess the efficacy and efficiency of the proposed enhancements, we conducted ablation experiments by incrementally adding FocalModulation, ASF-P2, and DFDM modules to the baseline YOLOv11n. As shown in Table 1, both the ASF-YOLO structure and the spatial–channel dual-attention FocalModulation module improved detection performance, with the final YOLO-DFAM achieving a 2.3% increase in precision, a 0.2% gain in mAP@50, and a 0.3% improvement in mAP@50–95 over the baseline. To verify the consistency and robustness of performance gains, we conducted four repeated trials for both the baseline model (N1) and the final model (N6). The averaged results, along with standard deviations, are reported in Table 1. The proposed YOLO-DFAM model (N6) achieved the highest mAP@50 (98.0 ± 0.06) and precision (94.6 ± 0.11) with low variability, indicating strong performance stability. A paired t-test between N1 and N6 confirmed that the observed improvements in mAP@50 were statistically significant (p < 0.05), supporting the reliability of the proposed enhancements. In terms of computational cost, the model size increased modestly from 6.6 GFLOPs to 7.2 GFLOPs, indicating that the accuracy improvements were achieved with minimal overhead, making the model suitable for real-time onboard deployment.
In Table 1, FocalModulation refers to the replacement of the global average pooling gate with the focal modulation attention mechanism. ASF-P2 denotes the integration of the attentional scale fusion module on the P2-level feature map branch to enhance small-object detection. DFDM represents the dual-fusion detection module used to improve multi-scale prediction robustness. The evaluation metrics are defined as follows: P (%) stands for precision (i.e., the ratio of true positives to all predicted positives); R (%) indicates recall (i.e., the ratio of true positives to all actual positives); mAP@50 (%) is the mean average precision at 0.5 IoU threshold; and mAP@50–95 (%) denotes the average precision across multiple IoU thresholds ranging from 0.5 to 0.95 in 0.05 increments; and GFLOPS (Giga Floating-Point Operations) denotes the computational complexity of the model, measured as the number of floating-point operations required for inference in billions. Bold text denotes optimal performance among comparative models. Underlined values with ±standard deviation indicate fluctuation ranges measured across 5 independent test runs, confirming the statistical significance and non-randomness of performance improvements.

3.3.3. Detection Performance of Different Models

This research utilizes the YOLOv11n model from the YOLO family for object detection. To verify the effectiveness of our enhanced YOLO-DFAM model in detecting Portunus trituberculatus in crab fishing vessels, we compared its performance with YOLOv10n and YOLOv8n, as well as two rotating target detection algorithms: RetinaNet (CSL-Based) and Rotated Faster R-CNN. All models were trained on the same dataset under identical environmental conditions, and their performance was evaluated on a consistent test dataset. We further evaluated YOLOv10n, YOLOv8n, RetinaNet (CSL-Based), and Rotated Faster R-CNN, with comparative findings presented in Table 2. The results reveal that the enhanced YOLO-DFAM surpasses YOLOv8n by 2.8% in precision (P), 1.8% in recall (R), 1.1% in mAP50, and 1.7% in mAP50–95 for the crab category. Compared to YOLOv10n, it demonstrates a 2.7% enhancement in precision (P), a 1.7% rise in recall (R), a 1.3% advancement in mAP@50, and a 1.3% growth in mAP50–95. Moreover, YOLO-DFAM achieves higher precision, recall, and mAP@50 than RetinaNet (CSL-Based) and Rotated Faster R-CNN, with improvements of up to 6.3% in precision, 6.4% in recall, and 7.4% in mAP@50. YOLO-DFAM achieved 180.3 fps (tested at 1920 × 1024, bs = 32, RTX 4070 Ti SUPER), outperforming all comparators in precision while maintaining real-time capability and offering a significant speed advantage over Rotated Faster R-CNN. The results validate that the improved YOLO-DFAM model is highly effective for detecting Portunus trituberculatus in crab fishing vessels. Bold text denotes optimal performance among comparative models.

4. Portunus Trituberculatus Detection and Tracking Counting

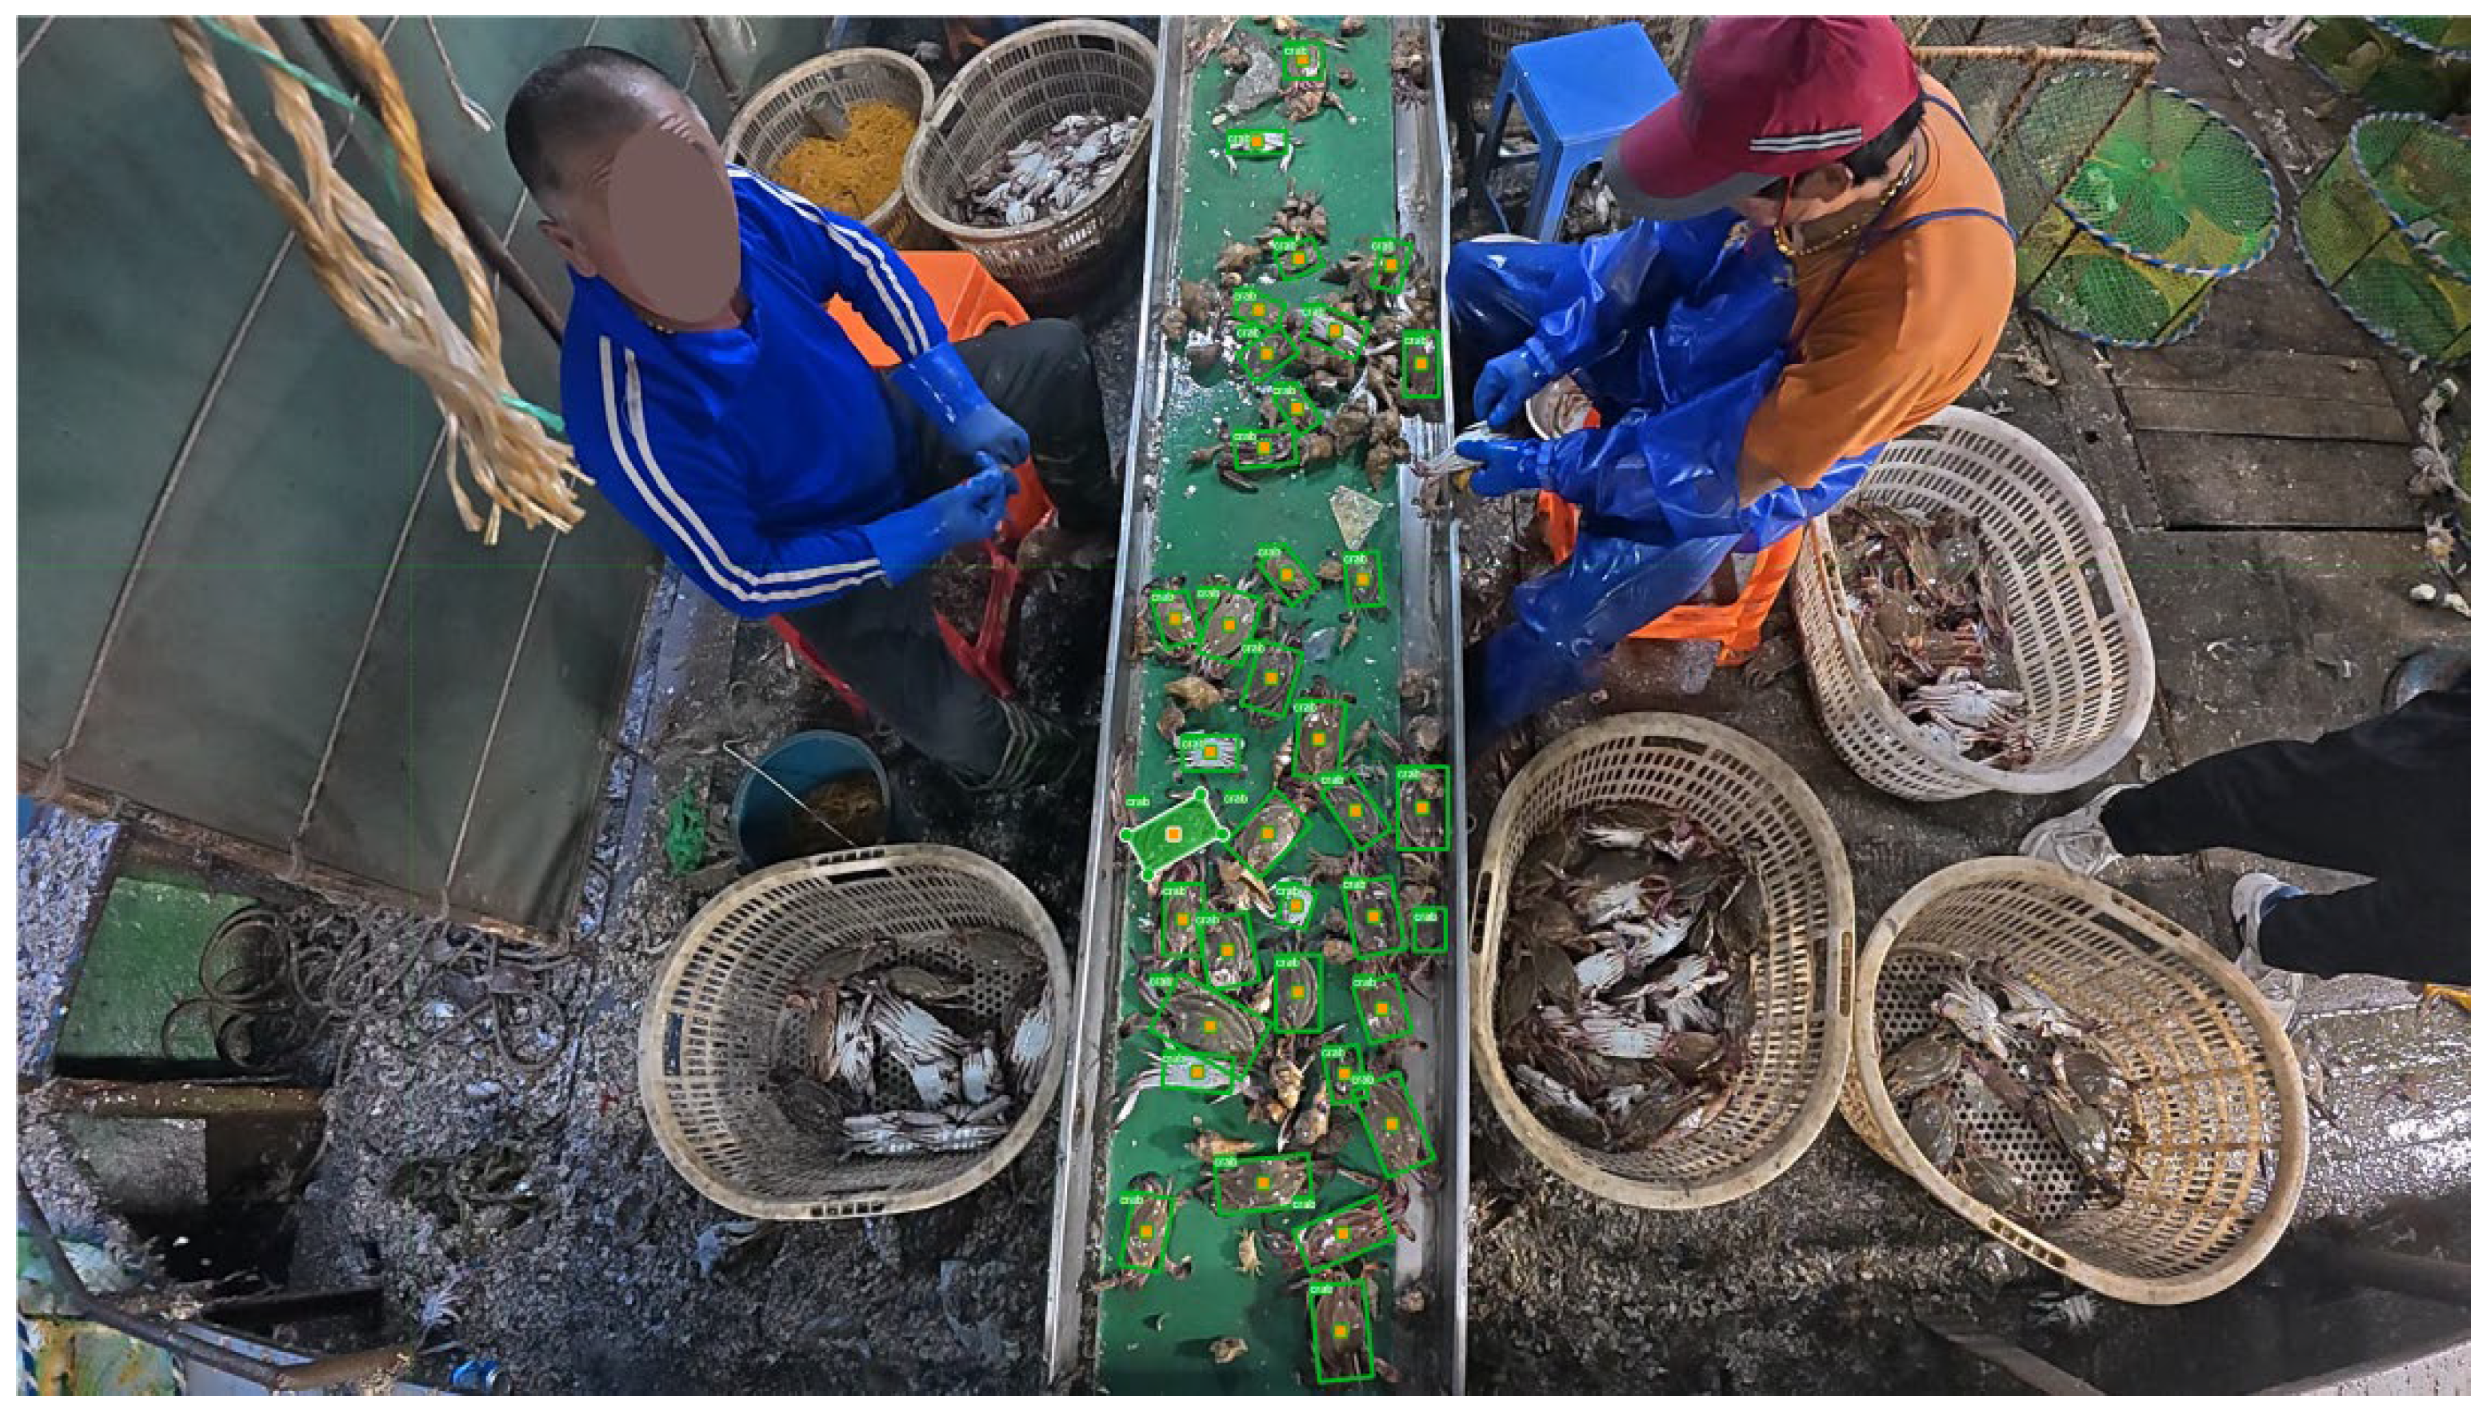
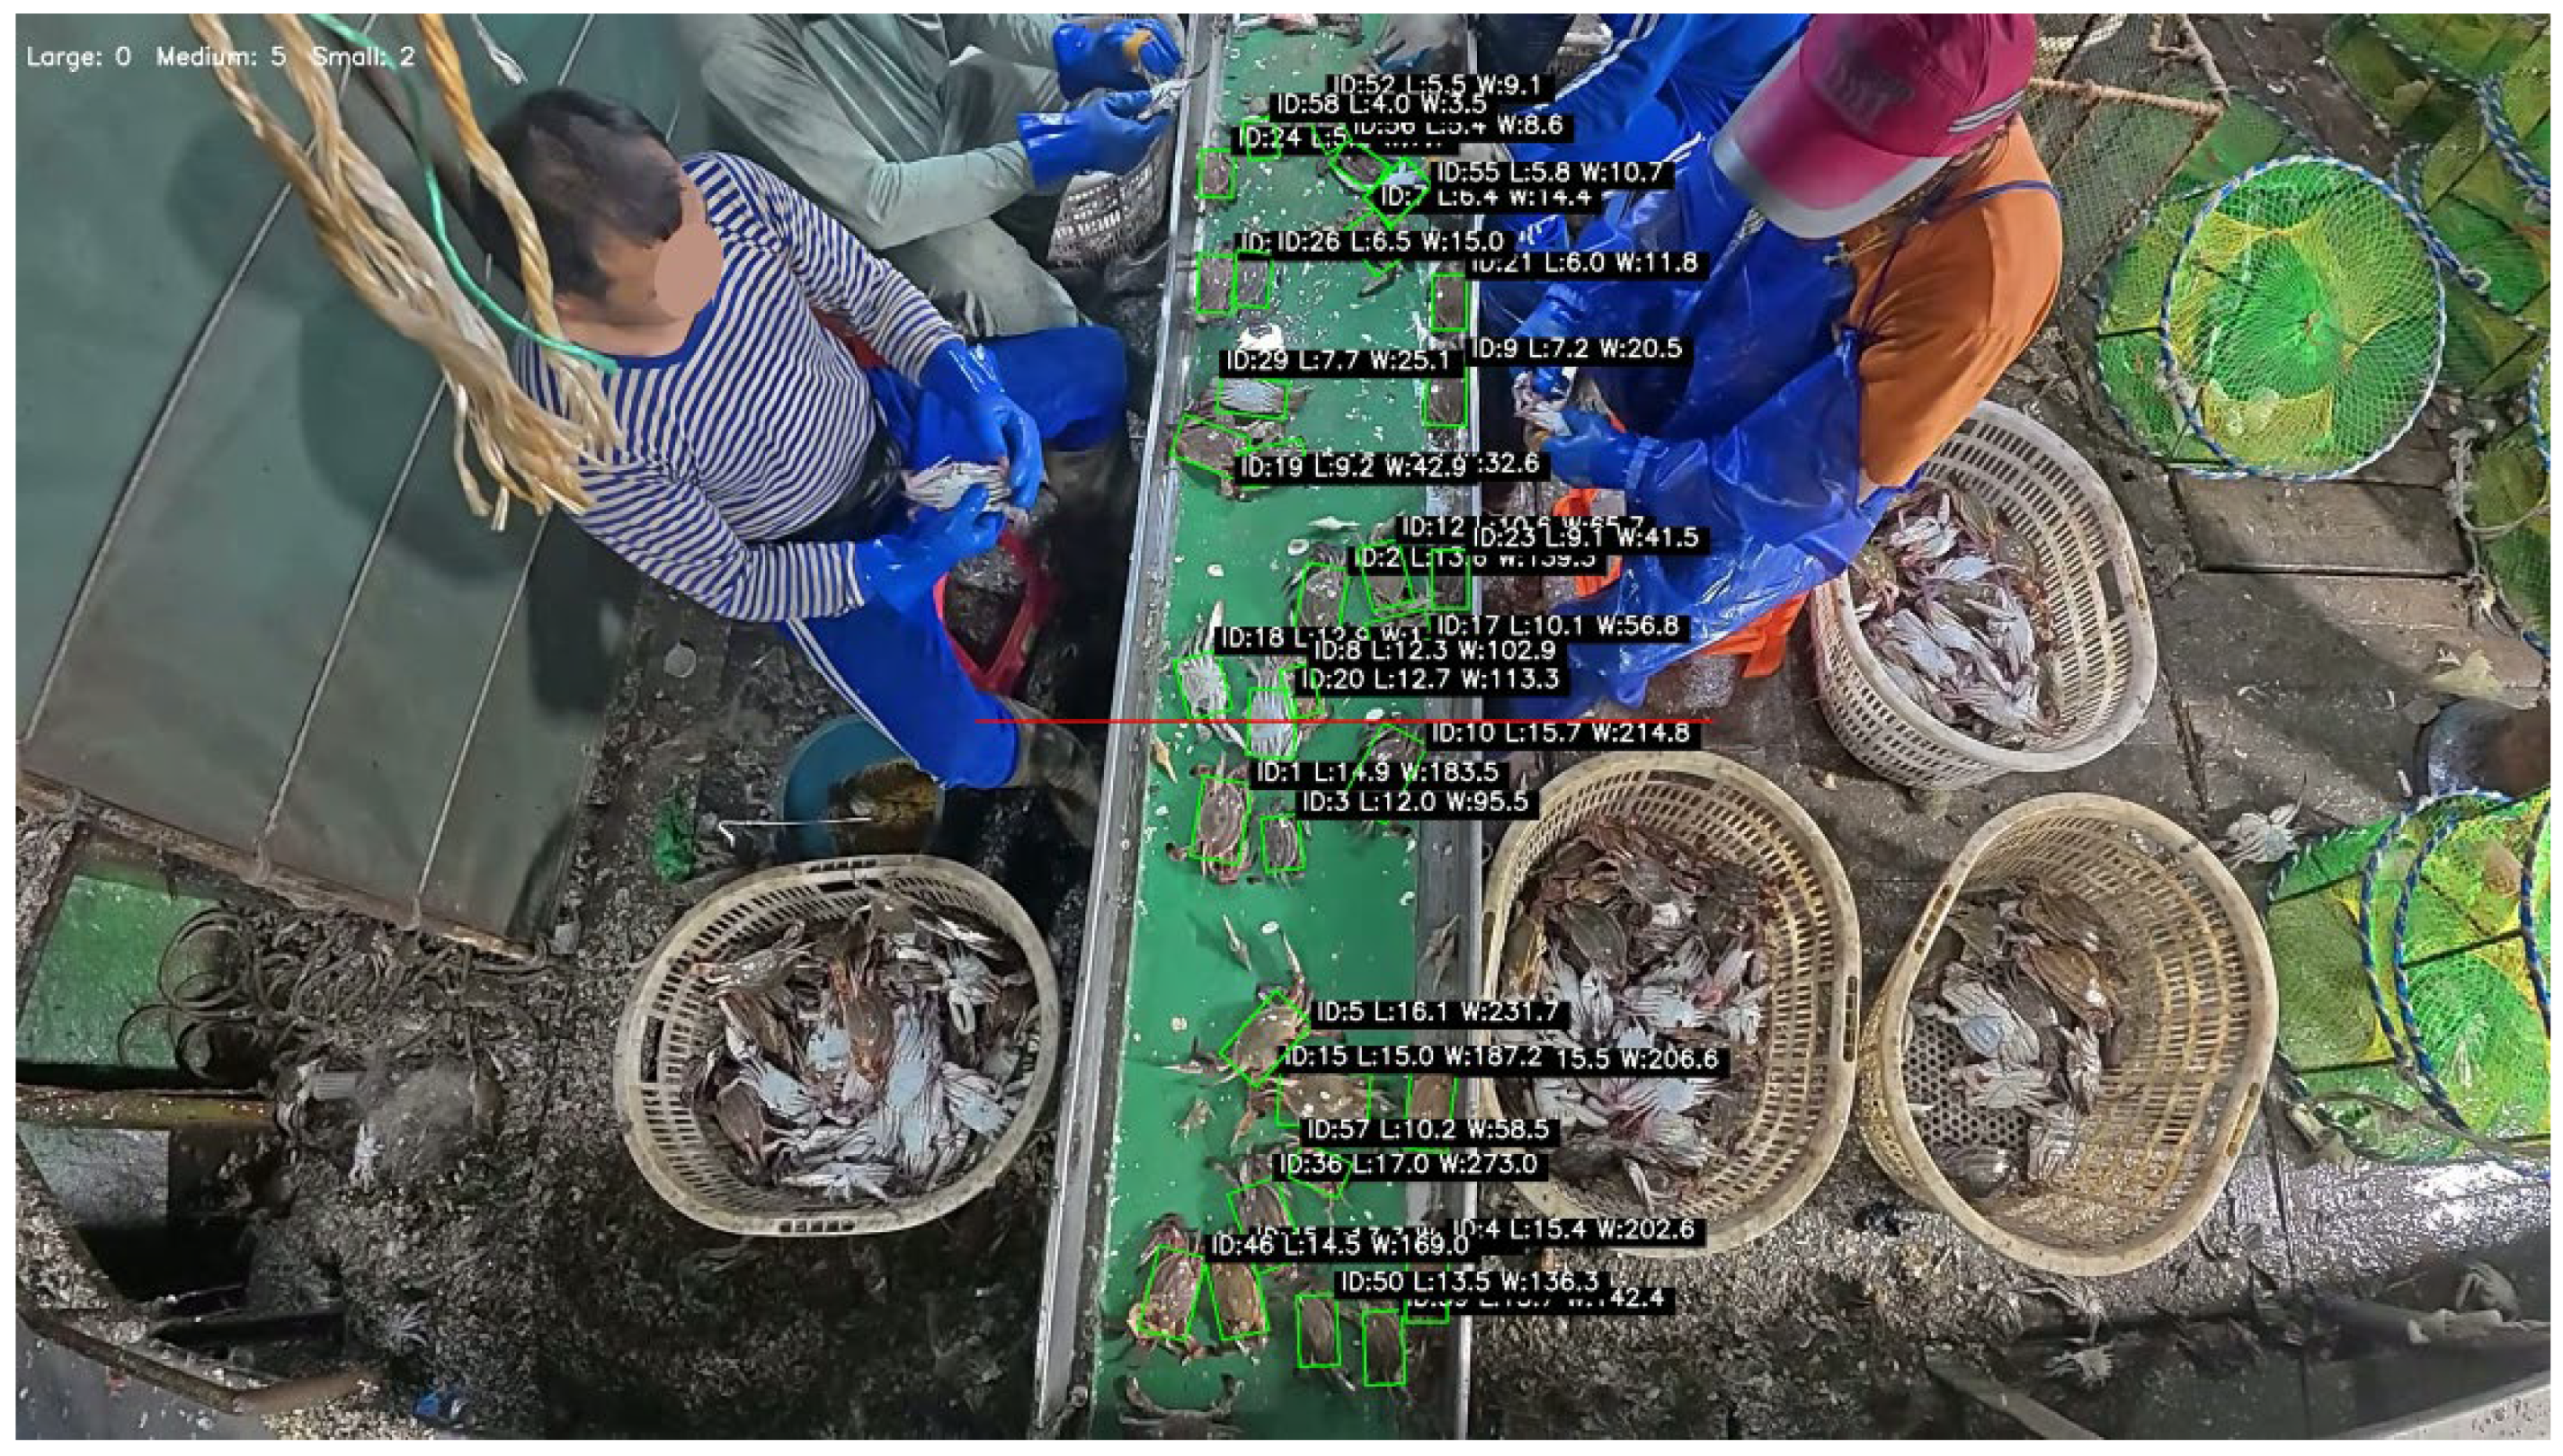
4.1. Portunus Trituberculatus Detection

This study implements the swimming crab detection system during the pre-sorting phase of crab fishing operations, namely at the starting section of the sorting conveyor belt, as seen in Figure 10. The conveyor system utilizes a tiered sorting protocol: (1) Initial operators evaluate female Portunus trituberculatus for ecological release, (2) whereas following stations utilize tactile sensation to categorize Portunus trituberculatus specimens into three weight classifications: >150 g, 100–150 g, and <100 g.
Integrating a computerized weight-estimation technology into the grading process enables non-contact biomass evaluation by linking morphological features with mass. This enhanced measuring methodology has two advantages. Ecologically, accurate size-based sorting retains juvenile specimens that do not meet commercial size requirements, protecting the population’s reproductive foundation. Standardized grading economically increases the percentage of market-grade crabs and reduces losses from misclassification. Experimental findings indicate that a computer-vision-based weight-grading system efficiently reconciles sustainable resource utilization with enhanced fisheries profitability. The tracking and detection results of YOLO-DFAM for the crab trap target are shown in Figure 11.

4.2. Precision Biomass Estimation System for Swimming Crab Grading: Integrating Allometric Modeling, Dynamic Calibration and Multi-Modal Verification

4.2.1. Nonlinear Allometric Modeling for Precision Crab Biomass Estimation in Coastal Aquaculture

Generalized formulae for estimating crab mass demonstrate morphological variability between regional populations. The allometric growth relationship of Portunus trituberculatus in Zhoushan waters exhibits variances in coefficient a and exponent b from generic values, caused by local hydrographic factors and food composition. The development characteristics of crustaceans exhibit significant sensitivity to environmental conditions such as temperature and salinity [18]. The distinctive thermohaline characteristics in this area arise from the convergence of the Taiwan Warm Current and adjacent coastal currents: In autumn, the surface water temperature attains 22.89 °C, accompanied by salinity gradients of 33.74–33.74 PSU [19]. Increased temperatures expedite metabolic activities, modifying allometric patterns of carapace calcification and muscle accumulation. This requires region-specific modeling to guarantee the precision of biomass estimation. Our research utilizes the body length–weight power function modeling approach for Portunus trituberculatus in the East China Sea, as reported by Kai et al. [20]. According to Froese [21], the relationship between weight and length of a fish can be described by a power function:
W = a × L b
Samples were obtained via crab cage traps in the ocean at coordinates 31.06 N 123.18 W on 31 March 2025. One hundred individual male pike crabs, characterized by complete and fresh specimens, were selected from the screened samples. The whole nail width and wet weight of these samples were measured using vernier calipers and an electronic balance to recalibrate the localization parameters. This study employed an independent nail width–weight model developed using the nonlinear least squares approach, intricately linked to the unique ecological features of offshore Zhejiang. The b-value of male crabs in this sea, 3.016, exceeds the values of 2.899 in Bohai Bay [22] and 2.599 in the northern Yellow Sea [23], as determined by the analysis of measured data. Using a standard 15 cm nail width sample, the direct application of the Bohai Bay model results in a 12.7% underestimation of body weight (theoretical value of 189.5 g versus measured mean value of 217.3 g). This cross-sea parameter application error can induce kiloton discrepancies in population biomass estimation. Through iterative optimization, the final model parameters were established as: a = 0.0514 ± 0.0008 (95% confidence interval) and b = 3.0158 ± 0.0123 (95% confidence interval), with a coefficient of determination R2 = 0.9856. This outcome indicates a robust power–function correlation between nail width and body weight, demonstrating that the model effectively explains body weight fluctuation with considerable statistical significance. From a biological perspective, the parameter a functions as a conditioning factor, indicating the extent of nutritional reserves and fattening in individual pike crabs. The value obtained in this study, 0.0514, fell within the conventional range of historical research data for the East China Sea, yet it exhibited systematic discrepancies when compared to reported values in Bohai Bay and the northern Yellow Sea, potentially attributable to variations in ecological factors such as bait abundance and water temperature gradients across these marine regions. The parameter b representing the anisotropic growth index was approximately 3 (b = 3.016), suggesting that the body weight growth of pike in the studied waters was positively correlated with the cube of the nail width, consistent with the theoretical expectations of anisotropic growth in crustaceans [24].
The error analysis indicated that the confidence interval ranges for parameters a and b were maintained within ±0.08% and ±1.23%, respectively, demonstrating that the measurement accuracy and model stability of the dataset satisfied the specification criteria for resource assessment. This study assessed the reliability of the method by comparing log-linear regression with nonlinear least squares fitting. The log-linear regression yielded a = 0.0509 and b = 3.031 after logarithmic transformation of the data, with R2 = 0.9856 and p < 0.001. The elevated b-value may stem from systematic bias introduced by the logarithmic transformation. The nonlinear fitting result is ultimately selected as it is directly derived from the reduced residuals of the original data, hence preventing information loss throughout the conversion process. Figure 12 illustrates the fitted curve representing the anisotropic growth relationship between carapace width and body weight of Portunus trituberculatus, derived from an established model based on 100 tail samples (nail width 10.34–17.76 cm) from the East China Sea. The mathematical expression is provided below:
R 2 = 1 i = 1 n ( W o b s , i W ¯ ) 2 i = 1 n ( W o b s , i W ¯ m o d e l ) 2
W = 0.0514 L 3.0158 with R 2 = 0.9856 a = 0.0514 ± 0.0008 ( 95 % CI ) b = 3.0158 ± 0.0123 ( 95 % CI ) n = 100 , carapace   width   range :   10.34 17.76 cm
In this context, W denotes body weight (g), L signifies the width of the carapace (cm), and R2, the coefficient of determination, serves as the principal metric for evaluating the explanatory efficacy of the regression model, with a value of R2 = 0.9856. Wobs refers to the weight of pike obtained from actual measurements, W indicates the model’s predicted output, and Wmodel represents the average weight of the pike derived from actual measurements. The b value approximates 3, suggesting that the population exhibits a standard isometric growth pattern. A value of b around 3 signifies that the population exhibits a standard isometric development pattern, wherein the organism’s morphology (armor width) and energy storage (body weight) preserve geometric proportionality and coordination. The elevated R2 value signifies that the growth of pike crabs in this region is very predictable, mirroring biological attributes such as a stable habitat, homogeneous food resource distribution, and high genetic homogeneity within the population.

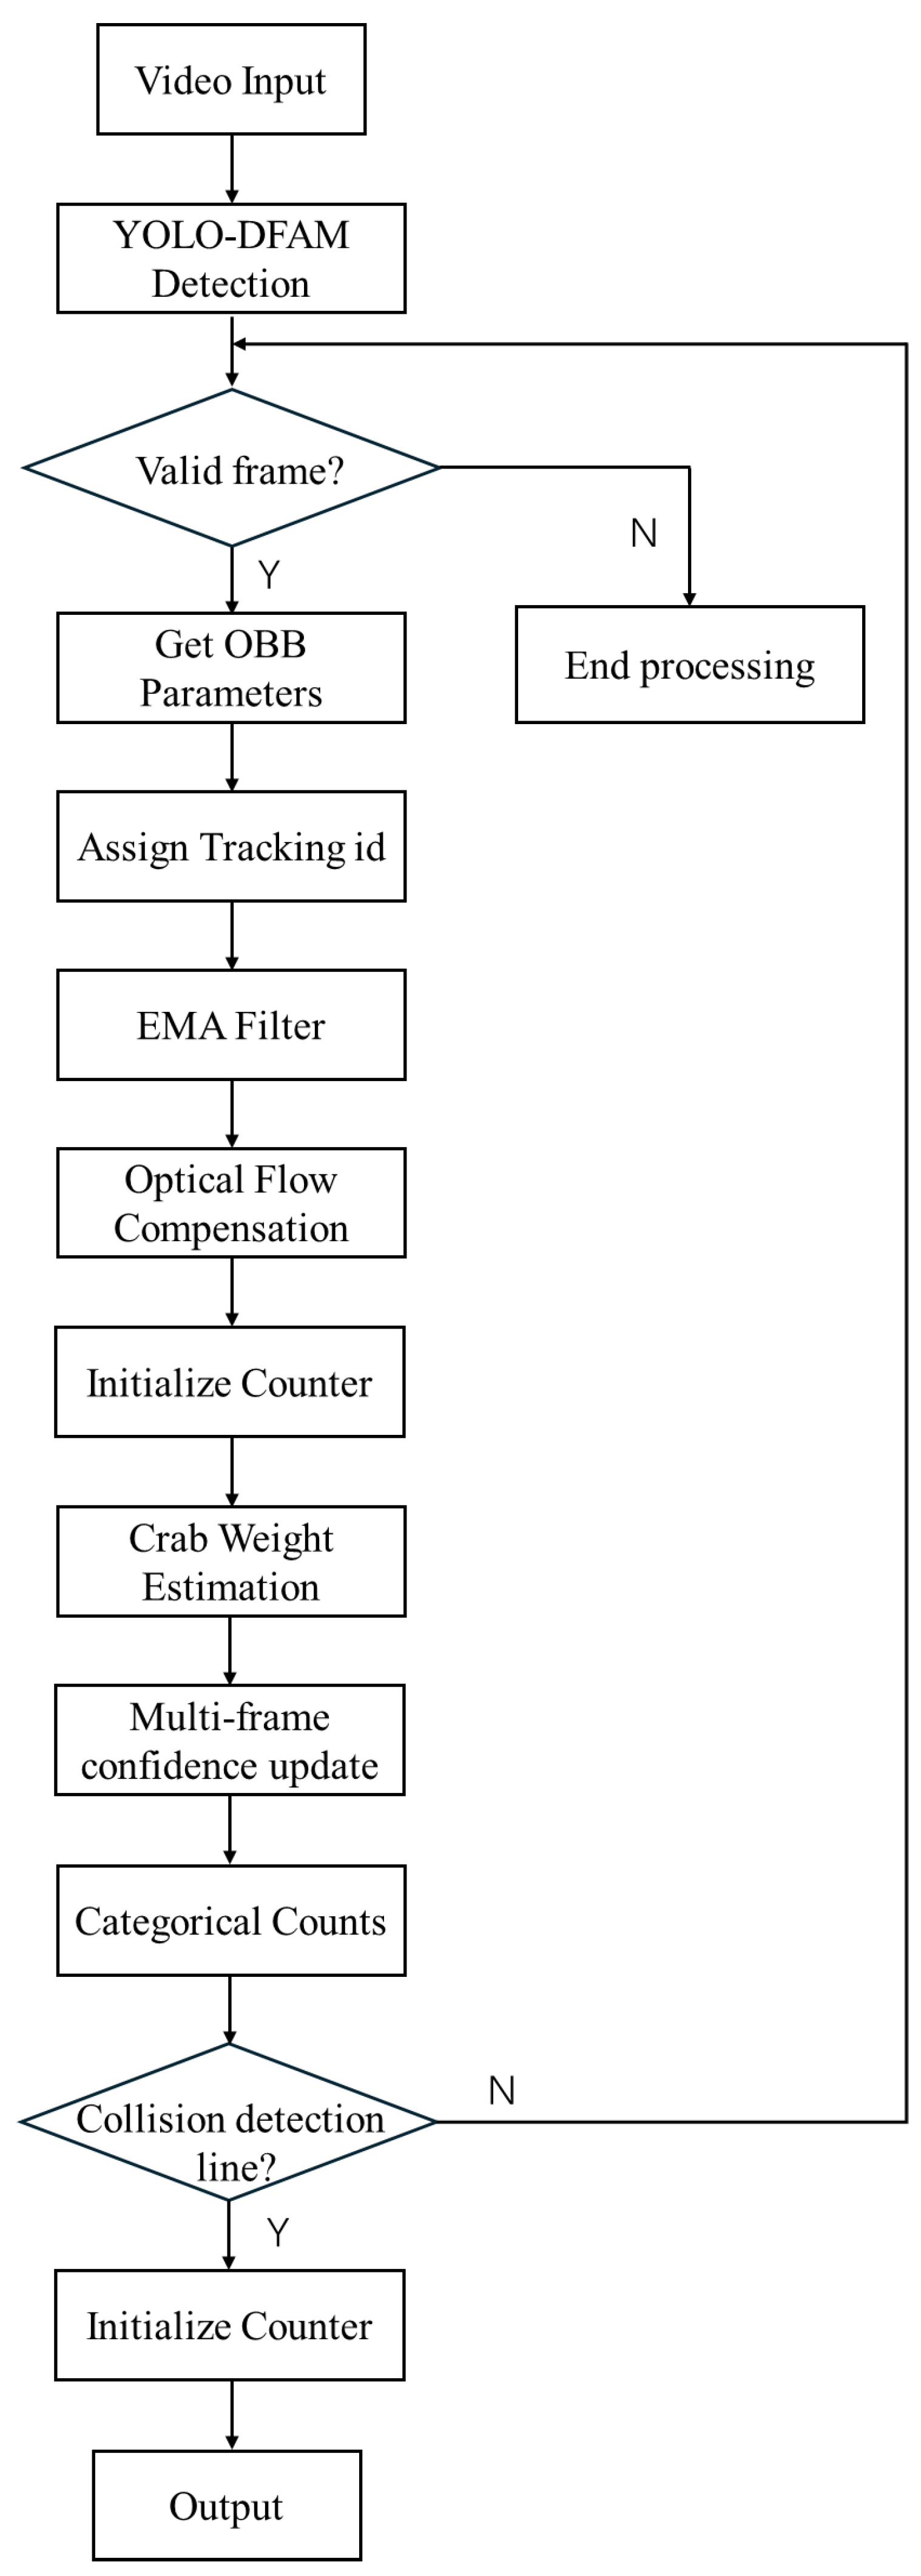
4.2.2. Real-Time Biomass Calculation Architecture: Spatial Scaling Correction and Multi-Frame Confidence Fusion

A real-time weight measurement device for pike crabs, utilizing machine vision and dynamic calibration technologies to achieve high precision. The technology enhances measurement accuracy via two components: the dynamic scale calibration module and the multi-frame confidence update mechanism.
(1)
Real-time spatial scale reconstruction utilizing visual sensors:
During picture acquisition on the swimming crab sorting conveyor, perspective distortion results in changes in carapace length between proximal and distal crabs in relation to the camera. A spatial scaling system was created by vertically positioning 12 calibration markers (y-axis: 830–1507 pixels) to develop cubic spline interpolation algorithms. Marker validation utilizes two verification processes: (1) rejecting incorrect spans when x_right is less than or equal to x_left, (2) removing outliers that exceed boundaries. The pixel/cm conversion function demonstrates vertical nonlinearity: 0.098 cm/px in upper regions (y > 1400 px), increasing to 0.152 cm/px in lower zones (y < 500 px), successfully accounting for perspective-induced scaling variation. This system employs a conveyor structure to dynamically modify measurement baselines across belt segments, facilitating real-time pixel–centimeter conversion that adjusts to variations in crab size during transit. The formula is as follows:
S ( y i ) = 75 Δ x i ( cm / px ) Δ x i = x r ( i ) x l ( i )
Cubic spline interpolation models calibration markers into a continuous spatial scaling function:
S ( y ˜ ) = c 10 + c 11 ( y ˜ y ˜ 1 ) + c 12 ( y ˜ y ˜ 1 ) 2 + c 13 ( y ˜ y ˜ 1 ) 3 , y ˜ [ y ˜ 1 , y ˜ 2 ) c 20 + c 21 ( y ˜ y ˜ 2 ) + c 22 ( y ˜ y ˜ 2 ) 2 + c 23 ( y ˜ y ˜ 2 ) 3 , y ˜ [ y ˜ 2 , y ˜ 3 ) c ( n 1 ) 0 + c ( n 1 ) 1 ( y ˜ y ˜ n 1 ) + c ( n 1 ) 2 ( y ˜ y ˜ n 1 ) 2 + c ( n 1 ) 3 ( y ˜ y ˜ n 1 ) 3 , y ˜ [ y ˜ n 1 , y ˜ n ]
Boundary restrictions (S(0) = 0.153, S(H) = 0.102, H = image height) guarantee extrapolation stability. Validated testing revealed a reduction in vertical dimensional measurement error from 12.6 mm (fixed scaling) to 1.8 mm, resulting in an 85.7% decrease in inaccuracy. Dynamic y-axis calibration rectifies trapezoidal distortion caused by the camera’s oblique viewing angle.
(2)
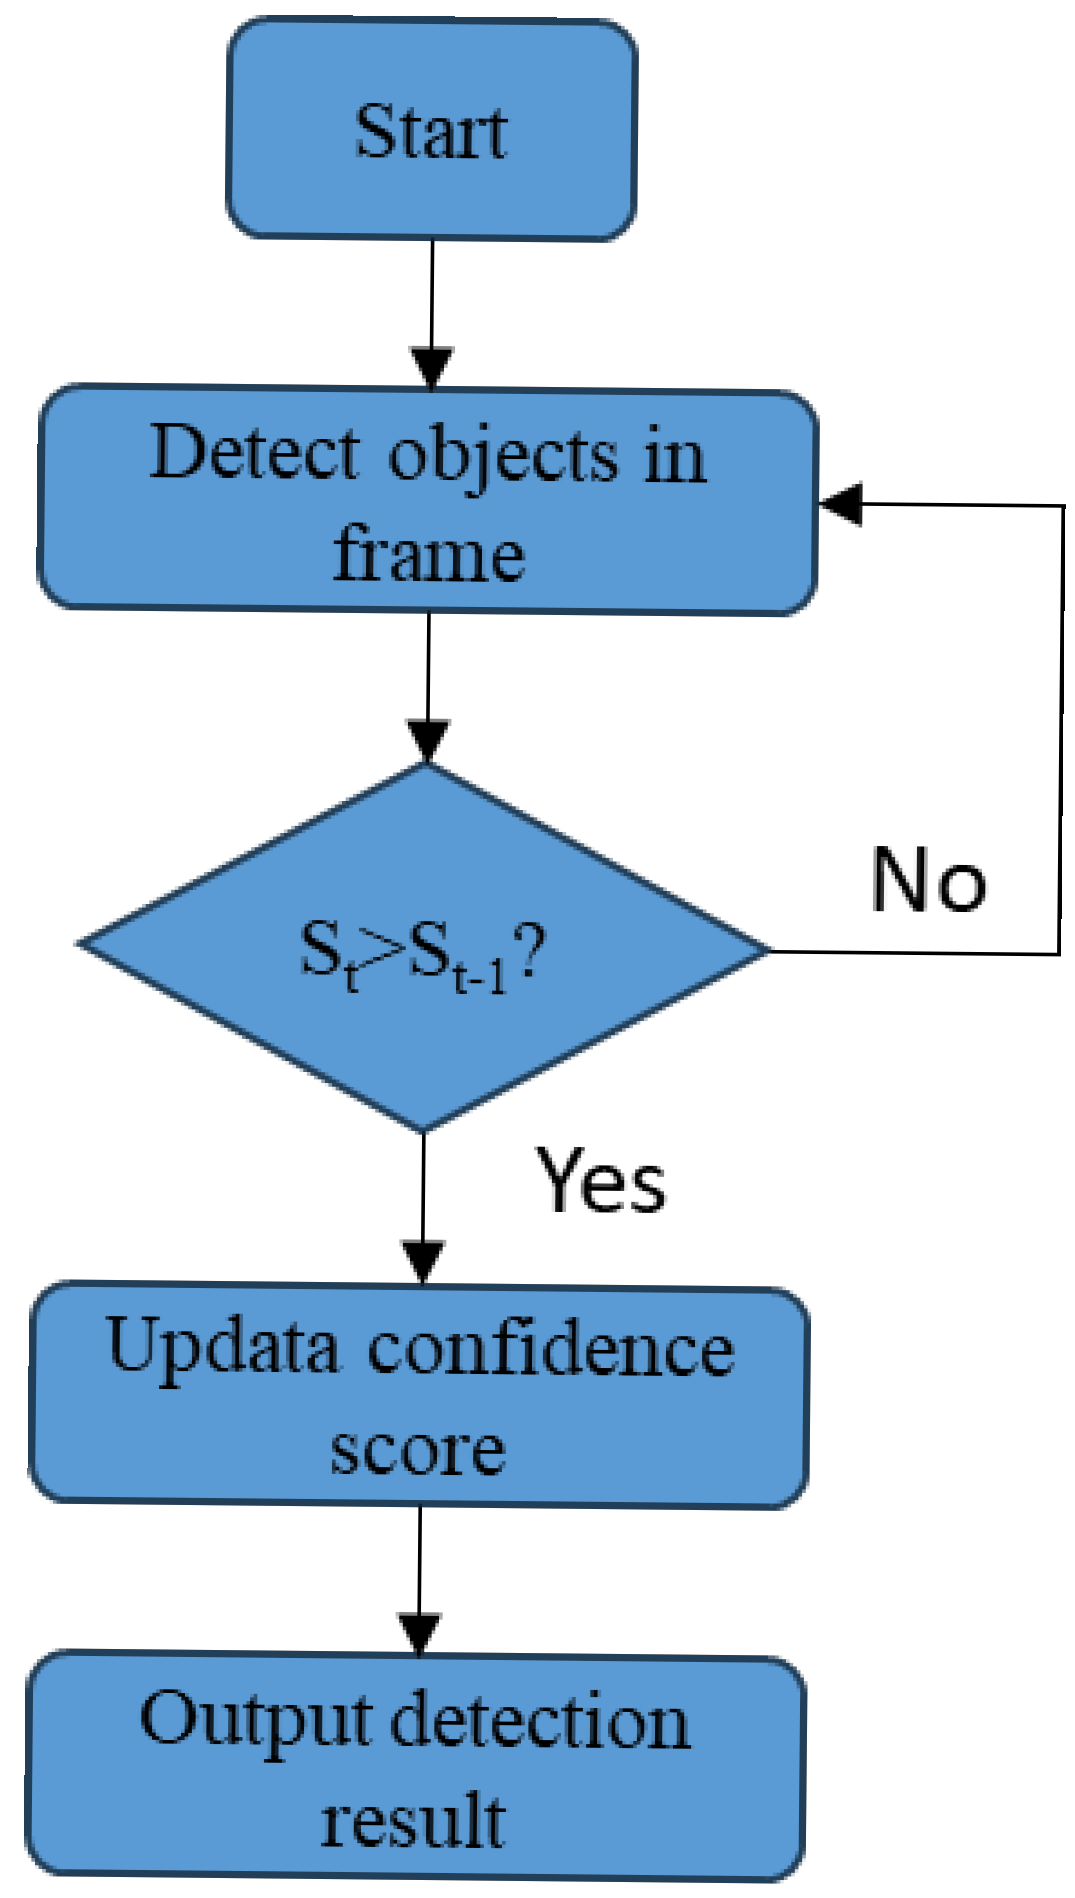
Comprehensive measurement method for crab classification with multi-frame confidence dynamic optimization
The multi-frame confidence update mechanism is a proposed solution for the real-time measurement system in swimming crab sorting, notably targeting prevalent issues such as noise, motion blur, and occlusion in deep-sea fishing vessel situations. The theory of its execution relies on the continuous tracking of each identified target across successive video frames, providing a confidence score to the detection outcomes of each frame. This score indicates the dependability of the existing measurement data (e.g., carapace width and orientation angle). In real applications, the movement of crabs on the conveyor belt, variations in posture, and unpredictable lighting conditions typically result in data fluctuations or inaccuracies in single-frame recognition due to imaging angles or transient interference. To guarantee the precision of final measurement data, this mechanism employs an updating strategy: for the same target, the system contrasts data over successive frames and revises the measurement information solely when the detection confidence of a new frame surpasses that of previously recorded data. This technique autonomously eliminates erroneous measurements resulting from partial occlusion, motion blur, or other confounding variables, guaranteeing that the recorded data accurately reflect optimal detection instances. The system attains seamless data transitions and improved resilience via multi-frame information fusion, preventing single-frame aberrations from contaminating overall measurements. The system concurrently utilises the intrinsic redundancy of video data, markedly reducing mistakes in situations with strong target detection continuity. This offers more steady and reliable data support for later mathematical models predicting body weight based on carapace width. The multi-frame confidence update technique provides the real-time crab weight computation system with significant dynamic adaptability and accuracy. By employing frame-by-frame updates instead of cumulative averaging, the system continuously preserves optimal detection instances while mitigating instability factors such as lateral flipping and partial occlusion resulting from low-confidence frames. Figure 13 shows the multi-frame confidence update mechanism.

4.2.3. Validation of Performance for the Co-Optimization of Dynamic Scaling and EMA Filtering in Crab Sorting Weight Estimate

This study chose 100 randomly picked Portunus trituberculatus for a thorough assessment of model performance in real sorting settings. Each specimen was measured using precision electronic vernier calipers for carapace width (accuracy 0.05 mm) and a high-precision electronic scale for actual body weight (accuracy 0.1 g). During picture measurement, the pre-calibrated dynamic scale reference transformed OBB-detected pixel dimensions into centimeters. The shell width measurements of each crab over 50 consecutive frames were smoothed using exponential moving average (EMA) filtering (α = 0.7) to mitigate irregular illumination fluctuations and occlusion interference. The filtered shell widths were subsequently inserted into the fitted power model to derive the projected weights Wpred,i. Relative errors εi were computed by comparing with the genuine weights Wtrue,i, and their distribution was subjected to statistical analysis.
ε i = W pred , i W true , i W true , i × 100 %
Table 3 illustrates that the mean absolute error (MAE) for shell width measurement was 0.18 cm, with a mean relative error of 4.7% for weight prediction; the greatest relative error was 5.4% in exceptionally small samples, while the smallest relative error was as low as 1.2%. The 95% confidence intervals, derived from the relative errors, were estimated as [3.8%, 5.6%], indicating that the model demonstrates substantial stability and repeatability across samples of varying body sizes and occlusion levels. The aforementioned findings conclusively demonstrate that, following precise calibration, EMA smoothing, and dynamic scale correction, this technique can achieve a weight estimate within ±5%, hence satisfying the application criteria for intelligent sorting and yield prediction.

4.3. Rotational Smoothing and Local Motion Compensation Together Enhance Target Tracking Stability in Aquatic Sorting Environments

This study utilises an enhanced ByteTrack tracking algorithm to accurately count Portunus trituberculatus categorised by weight classes (large: >150 g, medium: 100–150 g, small: <100 g) through comprehensive kinematic modelling of their movement across conveyor belt collision detection lines. During detection, conventional approaches demonstrate variations in bounding box size and location instability due to repeated leg or claw movements following entry. To resolve these concerns, we implement an Exponentially Weighted Moving Average (EMA) filtering technique that combines current detection results with smoothed estimates from previous frames utilising predetermined smoothing parameters. This procedure consistently updates the coordinates of the target centroid, as well as its breadth and height, hence minimising detection noise and sudden fluctuations induced by local motion. Simultaneously, to alleviate significant angular variations of detection boxes during swift crab movement, we implement multi-frame smoothing methods for rotation angles. This entails the processing of angular data through rolling windows or Exponential Moving Average (EMA) techniques, averting abrupt fluctuations in detection box angles between 0° and 360° and ensuring steady and continuous bounding boxes. Within our system, oriented bounding box (OBB) data—comprising centroid coordinates, width, height, and angles—are retrieved and processed via the previously indicated methods for each frame prior to its application in subsequent data association and visualisation. This method markedly improves the resilience of tracking matches, hence minimising ID switches and trajectory fragmentation.
This study combines particle filtering with optical-flow-based local motion correction to alleviate the negative impacts of occlusion, motion blur, and low-confidence detections on tracking continuity. The particle filter initially produces numerous state hypotheses derived from the target’s past trajectory and allocates weights according to current-frame data, subsequently forecasting the target’s position in the subsequent frame. This method facilitates successful route completion during temporary detection failures, maintaining continuity across short occlusions. Secondly, local motion correction employs an image-processing algorithm to ascertain the precise pixel displacement of the target area between consecutive frames, dynamically adjusting bounding-box positions and mitigating discrepancies induced by swift motion or partial obstruction. Furthermore, to rectify missed detections of diminutive or overlapping targets—typically linked to low confidence scores—we developed a dynamic confidence-threshold adjustment technique that utilises target size and local density measurements. During extraction, each identified object is labelled with category information, and retention requirements are adaptively adjusted by integrating its dimensions and neighbourhood density. This guarantees precise documentation of all quality classifications of Portunus trituberculatus. Collectively, these improvements significantly stabilise the position and dimensions of detection boxes across frames: the average trajectory coordinate variation decreases from 77,523 pixels to 2294 pixels, and the count of continuous trajectories rises from 28 to 39. These enhancements provide robust data support for the high-precision quality sorting of Portunus trituberculatus and offer a dependable technological platform for intelligent fisheries management. Table 4 shows the effect on the tracked objects after each improvement is added. Figure 14 demonstrates the effect of the modified tracking algorithm for tracking and counting pike crabs. Table 4 includes the Results of Tracking Algorithm Improvements.

5. Discussion

5.1. The Effect of Different Interpolation Algorithms on Dynamic Scale Construction

In the machine-vision-based dynamic weighing system for Portunus trituberculatus, the establishment of a dynamic scale is essential for guaranteeing measurement precision. A dynamic scale is necessary due to the geometric perspective effects associated with the conveyor-belt configuration: as crabs traverse the belt, their perceived size fluctuates considerably with their proximity to the camera—appearing larger at the near end (closer to the camera) and progressively diminishing in size towards the far end due to perspective projection. Experimental data at 1080 P resolution indicate that along a stationary 75 cm belt edge, the pixel span at the bottom of the image is 490 px (about 0.153 cm/px), while at the top, it attains 735 px (approximately 0.102 cm/px), resulting in a discrepancy of up to 50%. Employing a constant scale factor would consequently result in inaccuracies over 30% for distant targets, significantly undermining the precision of weight estimation. When choosing an interpolation method for dynamic-scale building, many algorithms significantly differ in their engineering application. Linear interpolation, esteemed for its computational efficiency and rapidity [25], is appropriate for uniformly distributed, smoothly varying data. Yet, it produces non-smooth fits that fail to accurately represent nonlinear perspective distortion. Nearest-neighbor interpolation maintains sudden calibration variations [26] but results in staircase-like approximations and significant measurement inaccuracies, rendering it more suitable for discrete classification. (Cubic Spline Interpolation) Cubic-spline interpolation generates C2-continuous curves for high-precision nonlinear data fitting [27]; despite its elevated processing demands, its smooth curvature effectively mitigates geometric distortion in precision measurement contexts. Standard spline interpolation has less computational effort than cubic splines [28] but only ensures C1 continuity, which may lead to curvature discontinuities and restricts its use to applications of moderate precision. This study eventually employs cubic–spline interpolation, as it provides a continuously smooth dynamic scale while accurately rectifying conveyor-belt perspective distortion, thus fulfilling the millimeter-level precision requirements of shipboard weighing situations.

5.2. Impact Analysis of Enhanced Detection Accuracy of Portunus Trituberculatus on Yield Estimation and Fisheries Resource Management

The precise identification of Portunus trituberculatus is essential for yield assessment, especially with fisheries resource management and sustainable harvesting strategies. Preliminary research has underscored the difficulties of real-time object detection in underwater settings, such as fluctuations in lighting, occlusion, and motion blur. Cao et al. [29] introduced a real-time detection approach utilising Faster MSSDLite, attaining a recall rate of 85% in intricate marine environments, thereby demonstrating the viability of deep learning for underwater crustacean detection. Chen et al. [30] incorporated a keypoint detection module into YOLOv8, minimising the error in carapace size measurement to within ±3 mm, thereby establishing a dependable basis for high-precision size distribution analysis. Traditional yield estimation approaches predominantly depend on onboard sampling and statistical models, which may have error margins surpassing 20%, hence amplifying uncertainty in resource evaluation and harvest planning. Hoyle et al. [31], in their assessment of diverse CPUE (Catch Per Unit Effort) standardisation models, highlighted the inconsistency of empirical estimation techniques across various fishing areas and temporal contexts, underscoring the necessity for more objective data sources. In 2015, comparative analyses indicated that conventional algorithms, including neural networks and decision trees, were inadequate in capturing the nonlinear dynamics of marine ecosystems. Muhammad Iftikhar et al. [32] were pioneers in utilising a single-stage YOLO model for the real-time identification of lobsters and crabs, attaining mAP scores of 99.2% and 95.2%, respectively, through the implementation of custom anchor boxes and multi-scale feature fusion to enhance detection and estimation accuracy. Tang et al. [33] augmented YOLOv3 with a refined loss function and resampling method, facilitating the accurate detection of crab moulting stages and illustrating the scalability of deep-learning models across several developmental periods. Zhong et al. [34] utilised satellite-based LiDAR data for spatial fitting of catch volumes in CPUE estimation, resulting in a 12% reduction in the standard error of CPUE. Kunimatsu et al. [35] integrated spatiotemporal machine-learning models to diminish the density estimation error for chub mackerel and other species to 8%, providing a methodological standard for vision-based CPUE prediction. Li et al. [36] incorporated marine environmental factors into CPUE standardisation models, demonstrating that environmental–biological coupling can substantially enhance the precision of fisheries resource evaluations. Accurate identification and estimation mitigate economic losses from supply-demand discrepancies in the fisheries sector and provide reliable data for insurance valuation and financial strategizing. Den Boer [37] indicated that a significant aquaculture enterprise decreased operational expenses by 7% through the enhancement of live bait quality evaluation via a vision-based detection system. NOAA [38] similarly emphasised in official case studies that machine-vision technology can deliver more prompt monitoring data to guide scientific quota allocation.
In conclusion, prior research has advanced notably in real-time detection algorithms, CPUE standardisation, and the evaluation of economic and ecological benefits. This paper proposes the YOLO-DFAM model, which combines deep-feature adaptive merging with target size regression. This facilitates the identification of individual P. trituberculatus in practical settings and enables for accurate size estimation, minimising measurement error to within ±2 mm and enhancing the efficiency and precision of fisheries resource assessment.

5.3. Multidimensional Collaborative Enhancement Strategies for High-Density Portunus Trituberculatus Sorting and Detection

Target overlap has always posed a significant challenge in object detection. During the sorting phase of Portunus trituberculatus, several individuals congregate on conveyor belts, resulting in significant congestion and overlap. This not only markedly diminishes the velocity of mechanical sorting but also considerably undermines the precision of visual detection regarding object localisation and size measurement. This stacking presents three primary challenges: first, significant occlusion of target objects, where foreground individuals are partially or wholly obscured by others of the same type, resulting in a marked decline in recall for single-stage detectors in high-density scenarios; second, heightened size regression inaccuracies, as the absence of visual features at the occluded edges leads to greater measurement errors of the carapace; and third, motion blur and lighting fluctuations, where rapid stacking alters the posture and illumination of targets instantaneously, further compromising detection stability and resulting in missed detections [39]. Researchers have offered numerous solutions to solve these challenges. Repulsion Loss enhances recollection in dense situations by incorporating a “repulsion” mechanism in bounding box regression, which inhibits detection boxes from encroaching upon adjacent objects [40]. CFIoU Loss (Corner-point and Foreground-area IoU Loss) integrates corner-point constraints and adaptive foreground area data into the regression loss, markedly diminishing size estimation inaccuracies for diminutive objects like crab carapaces [41]. An advanced U-Net deblurring network augments robustness through the incorporation of multi-level attention and frequency-domain reconstruction loss into feature fusion, facilitating effective deblurring in scenarios characterised by motion blur and sudden lighting variations, thus enhancing detection robustness and localisation precision [42].
A dual strategy combining YOLO-DFAM model optimisation and equipment augmentation is offered to resolve the target stacking issue in the sorting of P. trituberculatus. Attention methods and multi-scale feature fusion are employed to augment detection efficacy in congested environments with small targets, minimising both missed and erroneous detections while enhancing resilience and real-time performance. On the hardware front, the installation of baffles or grates at the conveyor belt input can organise crabs into single-layer or low-density configurations prior to reaching the detecting zone, thereby significantly reducing occlusion and preventing stacking at the origin. This technology is straightforward and economical, and when paired with model enhancements, the hardware-software integrated approach optimises the detection capabilities of YOLO-DFAM. It facilitates the dynamic modification of sorting techniques, consequently augmenting sorting efficiency and product quality, expanding the practical utility of onboard intelligent sorting systems, and yielding increased economic benefits for fisheries production.

5.4. Prospects for Enhancement and Research Outlook

Notwithstanding the robust efficacy of the YOLO-DFAM model in detecting and categorising Portunus trituberculatus, certain constraints impede its wider implementation in practical fisheries operations. The existing training dataset inadequately represents the range of fishing settings, including differences in lighting, meteorological conditions, and crab density. This limits the model’s generalisation ability, particularly in difficult conditions characterised by severe occlusion or inadequate lighting, where detection precision and robustness markedly deteriorate, hence impacting the dependability of yield assessment and sorting efficacy. Furthermore, despite the model’s partial lightweight optimisation, real-time deployment continues to pose difficulties for resource-limited onboard systems. Enhanced computing efficiency is required to satisfy the requirements of embedded maritime applications.
Future research should concentrate on improving the model’s generalisation capacity and resilience to overcome these limitations. This entails broadening the dataset to encompass a more extensive array of environmental circumstances and utilising sophisticated data augmentation methods to enhance adaptability to intricate scenarios. Architectural enhancements, such as the use of attention mechanisms or multi-modal sensor fusion, could increase detection in scenarios involving occlusion and fluctuating illumination conditions. To address computational limitations, the exploration of edge computing solutions and hardware acceleration approaches is essential for achieving real-time performance and scalability. In the long term, the integration of YOLO-DFAM with automated sorting and release systems, alongside CPUE monitoring modules, might assess gear efficiency and furnish real-time data to enhance fisheries management. This integration is anticipated to enhance intelligent fisheries and foster sustainable marine resource utilisation.

6. Conclusions

This study seeks to address the technical limitation of real-time monitoring of Portunus trituberculatus in maritime fishing contexts and introduces an enhanced YOLO-DFAM target detection and tracking model. Integrating the FocalModulation module with spatial-channel dual attention gating and the ASF-YOLO framework enhances detection accuracy by 1% and mAP@50–95 by 0.8% while preserving the computational efficiency of YOLOv11n, achieving real-time processing at 0.6 s per frame in a 40-megapixel video stream. The innovative design of a dynamic scale correction system, utilising three-sample value interpolation, effectively addresses the perspective distortion issue of shipborne cameras, diminishing the mean absolute error of shell width measurement to 0.18 cm. The proposed multi-frame confidence update mechanism and EMA filtering algorithm decrease the target tracking trajectory break rate by 58% through temporal information fusion. The developed allometric growth model specific to the East China Sea offers high-precision data support for resource assessment.
Despite the model’s strong performance in standard operational circumstances, identification inconsistencies persist under high illumination and dense accumulation conditions. Future endeavours will concentrate on multimodal data fusion and the optimisation of edge computing, augment the model’s generalisation capacity by broadening multi-sea training datasets, and investigate lightweight deployment options to accommodate a wider array of shipboard equipment. This study presents a technically feasible solution for real-time swimming crab monitoring, with potential for future deployment under vessel-side constraints, while its dynamic scale correction framework and multimodal tracking mechanism hold significant methodological value for the advancement of intelligent sorting systems for crustacean aquatic products.

Author Contributions

Conceptualization, P.L. and S.Z.; methodology, P.L.; software, P.L.; validation, P.L., S.Z., and H.Z. (Hanfeng Zheng); formal analysis, P.L.; investigation, P.L., X.F., and Y.S.; resources, X.F. and Z.W.; data curation, P.L. and Y.S.; writing—original draft preparation, P.L.; writing—review and editing, P.L., S.Z., and H.Z. (Hanfeng Zheng); visualization, P.L. and Z.W.; supervision, S.Z. and H.Z. (Hanfeng Zheng); project administration, S.Z. and H.Z. (Hanfeng Zheng); funding acquisition, H.Z. (Hanfeng Zheng) and H.Z. (Heng Zhang) All authors have read and agreed to the published version of the manuscript.

Funding

This research was funded by Central Public-Interest: Scientific Institution Basal Research Fund, ECSFR, CAFS (2024TD04) and Laoshan: Laboratory, grant number LSKJ202201804.

Institutional Review Board Statement

Not applicable.

Informed Consent Statement

Not applicable.

Data Availability Statement

The data presented in this study are available on request from the corresponding author. The data are not publicly available due to privacy or ethical restrictions.

Conflicts of Interest

The authors have no relevant financial or non-financial interests to disclose.

References

  1. Ryabinin, V.; Barbière, J.; Haugan, P.; Kullenberg, G.; Smith, N.; McLean, C.; Troisi, A.; Fischer, A.; Aricò, S.; Aarup, T. The UN decade of ocean science for sustainable development. Front. Mar. Sci. 2019, 6, 470. [Google Scholar] [CrossRef]
  2. Miers, E.J. XXII.—Descriptions of some new species of Crustacea, chiefly from New Zealand. J. Nat. Hist. 1876, 17, 218–229. [Google Scholar] [CrossRef]
  3. Ministry of Agriculture Fishery of the People’s Republic of China. Chinese Fishery Statistical Yearbook 2023; China Agriculture Press: Beijing, China, 2023. [Google Scholar]
  4. Ya, L.; Jing, W.; Xiaodong, L.; Yingdin, W. Stock Assessment and Management Decision Analysis of Portunus trituberculatus inhabiting Northern East China Sea. Period. Ocean Univ. China 2023, 53, 55–64. [Google Scholar] [CrossRef]
  5. Longtao, Y.; Yibang, W.; Hui, Z.; Weiwei, X. Stock assessment using the LBB method for Portunus trituberculatus collected from the Yangtze Estuary in China. Appl. Sci. 2020, 11, 342. [Google Scholar] [CrossRef]
  6. Dan, W.; Fanxiu, W. China Fishery Statistical Yearbook 2024; China Agriculture Press: Beijing, China, 2024. [Google Scholar]
  7. Yi, K. China Statistical Yearbook; Beijing Shu Tong Dian Zi Chu Ban She: Beijing, China, 2024. [Google Scholar]
  8. Li, P.; Han, H.; Zhang, S.; Fang, H.; Fan, W.; Zhao, F.; Xu, C. Reviews on the development of digital intelligent fisheries technology in aquaculture. Aquac. Int. 2025, 33, 191. [Google Scholar] [CrossRef]
  9. Liang, H.; Song, T. Lightweight marine biological target detection algorithm based on YOLOv5. Front. Mar. Sci. 2023, 10, 1219155. [Google Scholar] [CrossRef]
  10. Zhang, Z.; Liu, F.; He, X.; Wu, X.; Xu, M.; Feng, S. Soft-shell crab detection model based on YOLOF. Aquac. Int. 2024, 32, 5269–5298. [Google Scholar] [CrossRef]
  11. Sun, Y.; Zhang, S.; Shi, Y.; Tang, F.; Chen, J.; Xiong, Y.; Dai, Y.; Li, L. YOLOv7-DCN-SORT: An algorithm for detecting and counting targets on Acetes fishing vessel operation. Fish. Res. 2024, 274, 106983. [Google Scholar] [CrossRef]
  12. Liu, Y.; An, D.; Ren, Y.; Zhao, J.; Zhang, C.; Cheng, J.; Liu, J.; Wei, Y. DP-FishNet: Dual-path Pyramid Vision Transformer-based underwater fish detection network. Expert Syst. Appl. 2024, 238, 122018. [Google Scholar] [CrossRef]
  13. Zheng, T.; Wu, J.; Kong, H.; Zhao, H.; Qu, B.; Liu, L.; Yu, H.; Zhou, C. A video object segmentation-based fish individual recognition method for underwater complex environments. Ecol. Inform. 2024, 82, 102689. [Google Scholar] [CrossRef]
  14. Zhao, Y.; Qin, H.; Xu, L.; Yu, H.; Chen, Y. A review of deep learning-based stereo vision techniques for phenotype feature and behavioral analysis of fish in aquaculture. Artif. Intell. Rev. 2025, 58, 7. [Google Scholar] [CrossRef]
  15. Yang, J.; Li, C.; Dai, X.; Gao, J. Focal modulation networks. Adv. Neural Inf. Process. Syst. 2022, 35, 4203–4217. [Google Scholar]
  16. Kang, M.; Ting, C.-M.; Ting, F.F.; Phan, R.C.-W. ASF-YOLO: A novel YOLO model with attentional scale sequence fusion for cell instance segmentation. Image Vis. Comput. 2024, 147, 105057. [Google Scholar] [CrossRef]
  17. Zhang, Y.; Sun, P.; Jiang, Y.; Yu, D.; Weng, F.; Yuan, Z.; Luo, P.; Liu, W.; Wang, X. Bytetrack: Multi-object tracking by associating every detection box. In Proceedings of the European Conference on Computer Vision (ECCV), Tel Aviv, Israel, 23–27 October 2022; pp. 1–21. [Google Scholar]
  18. Chang, Y.-J.; Sun, C.-L.; Chen, Y.; Yeh, S.-Z. Modelling the growth of crustacean species. Rev. Fish Biol. Fish. 2012, 22, 157–187. [Google Scholar] [CrossRef]
  19. Cungen, Y.; Yongjiu, X.; Lihong, C.; Hengtao, X.; Huijun, W.; Peiyi, Z.; Kun, L. The relationship between distribution of fish abundance and environmental factors in the outer waters of the Zhoushan Islands. Haiyang Xuebao 2020, 42, 80–91. [Google Scholar]
  20. Froese, R. Cube law, condition factor and weight–length relationships: History, meta-analysis and recommendations. J. Appl. Ichthyol. 2006, 22, 241–253. [Google Scholar] [CrossRef]
  21. Kai, Z.; Zhenhua, L.; Yongdong, Z.; Kaida, X.; Wenbin, Z.; Zhongming, W. Growth, mortality parameters and exploitation of the swimming crab Portunus trituberculatus (Miers, 1876) in the East China Sea. Indian J. Fish. 2021, 68, 8–16. [Google Scholar] [CrossRef]
  22. Gang, Y.; Bingqing, X.; Xiuxia, W.; Fan, L.; Xiaonan, Y.; Zhenbo, L. On biological parameters and growth characteristics of Portunus trituberculatus in the Laizhou Bay. Mar. Fish. 2017, 39, 401–410. [Google Scholar] [CrossRef]
  23. Wei, Y.; Xianshi, J.; Xiujuan, S. Population biology relationship with environmental factors of swimming crab in Changjiang River Estuary and adjacent waters. Fish. Sci. 2016, 35, 105–110. [Google Scholar] [CrossRef]
  24. Huber, M.E. Allometric growth of the carapace in Trapezia (Brachyura, Xanthidae). J. Crustac. Biol. 1985, 5, 79–83. [Google Scholar] [CrossRef]
  25. Zhang, N.; Canini, K.; Silva, S.; Gupta, M. Fast linear interpolation. ACM J. Emerg. Technol. Comput. Syst. 2021, 17, 20. [Google Scholar] [CrossRef]
  26. Xing, Y.; Song, Q.; Cheng, G. Benefit of interpolation in nearest neighbor algorithms. SIAM J. Math. Data Sci. 2022, 4, 935–956. [Google Scholar] [CrossRef]
  27. Sun, M.; Lan, L.; Zhu, C.-G.; Lei, F. Cubic spline interpolation with optimal end conditions. J. Comput. Appl. Math. 2023, 425, 115039. [Google Scholar] [CrossRef]
  28. Cuevas, E.; Luque, A.; Escobar, H. Spline interpolation. In Computational Methods with MATLAB®; Springer: Berlin/Heidelberg, Germany, 2023; pp. 151–177. ISBN 978-3-031-40480-1. [Google Scholar]
  29. Cao, S.; Zhao, D.; Liu, X.; Sun, Y. Real-time robust detector for underwater live crabs based on deep learning. Comput. Electron. Agric. 2020, 172, 105339. [Google Scholar] [CrossRef]
  30. Chen, K.; Chen, Z.; Wang, C.; Zhou, Z.; Xiao, M.; Zhu, H.; Li, D.; Liu, W. Improved YOLOv8-Based method for the carapace keypoint detection and size measurement of Chinese mitten crabs. Animals 2025, 15, 941. [Google Scholar] [CrossRef]
  31. Hoyle, S.D.; Campbell, R.A.; Ducharme-Barth, N.D.; Grüss, A.; Moore, B.R.; Thorson, J.T.; Tremblay-Boyer, L.; Winker, H.; Zhou, S.; Maunder, M.N. Catch per unit effort modelling for stock assessment: A summary of good practices. Fish. Res. 2024, 269, 106860. [Google Scholar] [CrossRef]
  32. Iftikhar, M.; Neal, M.; Hold, N.; Dal Toé, S.G.; Tiddeman, B. Detection of crabs and lobsters using a benchmark single-stage detector and novel fisheries dataset. Computers 2024, 13, 119. [Google Scholar] [CrossRef]
  33. Tang, C.; Zhang, G.; Hu, H.; Wei, P.; Duan, Z.; Qian, Y. An improved YOLOv3 algorithm to detect molting in Portunus trituberculatus against a complex background. Aquac. Eng. 2020, 91, 102115. [Google Scholar] [CrossRef]
  34. Zhong, C.; Chen, P.; Zhang, Z.; Sun, M.; Xie, C. CPUE retrieval from spaceborne lidar data: A case study in the Atlantic bigeye tuna fishing area and Antarctica fishing area. Front. Mar. Sci. 2022, 9, 1009620. [Google Scholar] [CrossRef]
  35. Kunimatsu, S.; Kurota, H.; Muko, S.; Ohshimo, S.; Tomiyama, T. Predicting unseen chub mackerel densities through spatiotemporal machine learning: Indications of potential hyperdepletion in catch-per-unit-effort due to fishing ground contraction. Ecol. Inform. 2025, 85, 102944. [Google Scholar] [CrossRef]
  36. Li, G.; Lu, Z.; Cao, Y.; Zou, L.; Chen, X. CPUE estimation and standardization based on VMS: A case study for squid-jigging fishery in the equatorial eastern Pacific Ocean. Fishes 2023, 8, 2. [Google Scholar] [CrossRef]
  37. den Boer, R. Machine vision tool assesses quality of live feed. Laser Focus. World 2024, 60, 40–42. [Google Scholar]
  38. Yadav, V.K.; Jahageerdar, S.; Ramasubramanian, V.; Bharti, V.S.; Adinarayana, J. Use of different approaches to model catch per unit effort (CPUE) abundance of fish. Indian J. Geo-Mar. Sci. 2016, 45, 1677–1687. Available online: https://www.researchgate.net/profile/Vinod-Yadav-15/publication/314116423_Use_of_different_approaches_to_model_catch_per_unit_effort_CPUE_abundance_of_fish/links/58b65d3faca27261e5166593/Use-of-different-approaches-to-model-catch-per-unit-effort-CPUE-abundance-of-fish.pdf (accessed on 20 May 2024).
  39. Ashar, A.A.K.; Abrar, A.; Liu, J. A survey on object detection and recognition for blurred and low-quality images: Handling, deblurring, and reconstruction. In Proceedings of the 2024 8th International Conference on Information System and Data Mining, Los Angeles, CA, USA, 24–26 June 2024. [Google Scholar] [CrossRef]
  40. Wang, X.; Xiao, T.; Jiang, Y.; Shao, S.; Sun, J.; Shen, C. Repulsion loss: Detecting pedestrians in a crowd. In Proceedings of the IEEE Conference on Computer Vision and Pattern Recognition (CVPR), Salt Lake City, UT, USA, 18–22 June 2018; pp. 7774–7783. [Google Scholar]
  41. Cai, D.; Zhang, Z.; Zhang, Z. Corner-point and foreground-area IoU loss: Better localization of small objects in bounding box regression. Sensors 2023, 23, 4961. [Google Scholar] [CrossRef]
  42. Lian, Z.; Wang, H. An image deblurring method using improved U-Net model based on multilayer fusion and attention mechanism. Sci. Rep. 2023, 13, 21402. [Google Scholar] [CrossRef]
Figure 1. Schematic representation of camera positions and angles on a crab boat.
Fishes 10 00364 g001
Figure 2. Dataset-labeled images.
Fishes 10 00364 g002
Figure 3. Flow chart of weight detection of Portunus trituberculatus.
Fishes 10 00364 g003
Figure 4. YOLO-DFAM network structure.
Fishes 10 00364 g004
Figure 5. FocalModulation network structure.
Fishes 10 00364 g005
Figure 6. DynamicGateGenerator network structure.
Fishes 10 00364 g006
Figure 7. ASF-YOLO module architecture.
Fishes 10 00364 g007
Figure 8. Precision–Recall curve of YOLO-DFAM on the test dataset.
Fishes 10 00364 g008
Figure 9. YOLO-DFAM model target detection results.
Fishes 10 00364 g009
Figure 10. Schematic Diagram of Camera Positions and Angles on the Crab Catching Boat.
Fishes 10 00364 g010
Figure 11. YOLO-DFAM ‘s tracking and detecting results of crab trap targets.
Fishes 10 00364 g011
Figure 12. Portunus trituberculatus carapace width–weight allometric curve in East China Sea.
Fishes 10 00364 g012
Figure 13. Multi-frame confidence update mechanism flow chart.
Fishes 10 00364 g013
Figure 14. YOLO-DFAM’s tracking and counting results of crab trap targets.
Fishes 10 00364 g014
Table 1. Results of ablation experiment.
ModuleFocalModulationASF-P2DFDMP/%R/%mAP@50/%mAP@50–95/%GFLOPS
N1 92.3 ± 0.1394.1 ± 0.0597.8 ± 0.0874.1 ± 0.026.6
N2 93.694.097.774.36.6
N3 93.093.897.975.07.1
N4 94.192.997.974.36.6
N5 93.893.297.774.27.2
N6 94.6 ± 0.1193.4 ± 0.0398.0 ± 0.0674.4 ± 0.037.2
Table 2. Detection performance of different models.
ModelsP%R/%mAP@50/%mAP@50-95/%GFLOPSDetectionspeed (Fps)
Rotated Faster R-CNN88.387.090.685.068.48.7
RetinaNet (CSL-Based)88.587.290.785.381.5272.2
YOLOv5n-obb89.688.795.770.66.0203.0
YOLOv6n-obb88.788.594.868.011.6105.4
YOLOv8n-obb91.891.696.972.77.1193.2
YOLOv10n-obb91.991.796.773.16.8201.5
YOLOv11n-obb92.394.197.874.16.6198.6
YOLO-DFAM94.693.498.074.47.2180.3
Table 3. Weight measurement verification results of Portunus trituberculatus crab.
MetricSample Size (N)Carapace Width MAEMean Relative Error (Weight Prediction)Max Relative Error (Weight Prediction)Min Relative Error (Weight Prediction95% Confidence Interval
Value1000.18 cm4.7%5.4%1.2%[3.8%, 5.6%]
Table 4. Tracking algorithm improvement effects.
Improvement StrategiesSame Time EffectClarification
UnchangedFishes 10 00364 i001
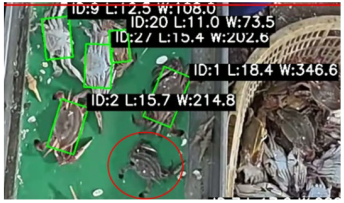
The preliminary tracking data indicated that smaller Portunus trituberculatus specimens inside the red-circled regions were not monitored, and the carapace width and weight measurements linked to other identifiers were inconsistent.
Dynamic confidence thresholding, a multi-frame confidence update mechanism, and local optical flow compensation were introduced.Fishes 10 00364 i002
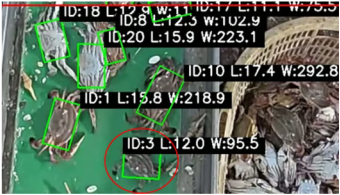
Following the enhancements, instances of missed detections and discontinuities in trajectories were rectified. Nonetheless, angular deviation and irregular variations in detection box dimensions were not addressed.
An exponential weighted moving average (EMA) filtering mechanism was introduced.Fishes 10 00364 i003The erratic fluctuations in detection box size were resolved, but when Portunus trituberculatus rotates, a delay in the adjustment of the detection angle occurs.
Continuous frame smoothing technology was introduced.Fishes 10 00364 i004The delay in detection-angle adjustment during Portunus trituberculatus rotation has been resolved.
Disclaimer/Publisher’s Note: The statements, opinions and data contained in all publications are solely those of the individual author(s) and contributor(s) and not of MDPI and/or the editor(s). MDPI and/or the editor(s) disclaim responsibility for any injury to people or property resulting from any ideas, methods, instructions or products referred to in the content.

