Article

Molecular Mechanisms of Low-Temperature Stress Response in the Muscle of Yellowtail Kingfish (Seriola aureovittata)

1
College of Fisheries and Life Science, Dalian Ocean University, Dalian 116023, China
2
College of Marine Science and Environment Engineering, Dalian Ocean University, Dalian 116023, China
3
Key Laboratory of Mariculture & Stock Enhancement in North China’s Sea, Ministry of Agriculture, Dalian Ocean University, Dalian 116023, China
4
Key Laboratory of Pufferfish Breeding and Culture in Liaoning Province, Dalian Ocean University, Dalian 116023, China
*
Author to whom correspondence should be addressed.
These authors contributed equally to this work.
Fishes 2025, 10(7), 355; https://doi.org/10.3390/fishes10070355
Submission received: 25 June 2025 / Revised: 14 July 2025 / Accepted: 16 July 2025 / Published: 18 July 2025
(This article belongs to the Special Issue Environmental Physiology of Aquatic Animals)

Abstract

The yellowtail kingfish (Seriola aureovittata), a commercially important marine species, encounters significant survival challenges under low-temperature conditions during winter aquaculture. To elucidate its molecular adaptation mechanisms, this study employed RNA-Seq to analyze transcriptional responses in juvenile muscle tissues under acute cold stress (10 °C) at 0, 6, 12, and 24 h. Differential gene expression analysis revealed time-dependent patterns, with 269, 863, and 984 differentially expressed genes (DEGs) identified at 6, 12, and 24 h, respectively. Key pathways were identified, including lipid metabolism, carbohydrate metabolism, and stress response. Sestrin3 upregulation implicated AMPK-mediated energy homeostasis in cold adaptation. These findings provide novel insights into the molecular strategies underlying cold adaptation in yellowtail kingfish, offering potential targets for breeding cold-resistant strains and improving aquaculture resilience.
Key Contribution: This study uncovers molecular mechanisms of cold adaptation in yellowtail kingfish via transcriptome analysis, offering insights for breeding cold-resistant strains.

1. Introduction

Water temperature is a pivotal abiotic factor modulating fish growth, development, metabolic functions, and behavioral adaptations, with suboptimal low temperatures provoking immediate physiological disruptions characterized by growth inhibition, metabolic suppression, and behavioral alterations, which may ultimately lead to mortality [1,2,3]. The adaptive capacity of fish to low-temperature environments holds significant implications for both aquaculture and wild fish survival. In recent decades, anthropogenic environmental disturbances have significantly altered global temperature regimes, leading to increased occurrences of extreme low-temperature events that adversely affect fish physiology [4]. Such low-temperature stressors present significant challenges for both aquaculture productivity and wild fisheries sustainability. Thus, understanding fish cold adaptation mechanisms is crucial for enhancing thermal tolerance through breeding, improving aquaculture management, and protecting wild populations in changing climates.
Recent advances in transcriptome sequencing technologies have significantly advanced our understanding of the molecular mechanisms that mediate responses of aquatic organisms to environmental changes [5]. High-throughput RNA sequencing has emerged as a powerful tool for gene identification and regulatory network analysis, particularly in research on stress responses of fish [6]. Transcriptional responses to low-temperature stress have been extensively characterized across multiple fish species [7,8,9,10]. Studies have demonstrated that pufferfish (Takifugu obscurus) [7], gilthead seabream (Sparus aurata) [8], common carp (Cyprinus carpio) [9], and armored catfish (Pterygoplichthys spp.) [10] exhibit enhanced lipid metabolism and elevated blood glucose levels under cold stress conditions, thereby facilitating energy homeostasis and improving cold resistance. Furthermore, beyond transcriptomic investigations, accumulating evidence indicates that most cold-water fish species have evolutionarily acquired plasma antifreeze polypeptides (AFPs), which depress serum freezing points to facilitate ecological adaptation and survival in subzero environments [11]. Moreover, polyunsaturated fatty acids (PUFAs) have also been shown to participate in the cold stress resistance of fish, potentially enhancing their tolerance to temperature fluctuations [12]. Nevertheless, the molecular basis of cold stress resistance in fish remains to be fully elucidated, particularly considering potential interspecific variations in adaptive strategies.
The yellowtail kingfish (Seriola aureovittata), belonging to the order Perciformes, is characterized by a distinct golden-yellow longitudinal stripe extending from the head to the tail, earning it the reputation of “golden yellowtail kingfish” [13]. It is widely distributed across many regions worldwide, including China, Japan, South America (Chile, Mexico), the United States, and New Zealand [14]. The yellowtail kingfish is highly valued for its economic importance and nutritional quality, making it increasingly popular among consumers, with market demand steadily rising year by year. As a result, it has become a significant focus in aquaculture. However, as a fish species with limited cold tolerance, it is prone to high mortality rates during winter in low-temperature farming environments. Therefore, investigating the molecular regulatory mechanisms underlying cold tolerance in yellowtail kingfish is of great importance for developing cold-resistant strains. In this study, transcriptome sequencing was employed to analyze the muscle tissue of yellowtail kingfish under low-temperature stress. Fish muscle offers distinct advantages for this investigation due to its high thermal sensitivity and direct relevance to aquaculture production [15,16]. The aim was to explore the molecular regulatory mechanisms activated in response to cold stress and to provide reference data for breeding cold-tolerant varieties of this species.

2. Materials and Methods

2.1. Ethics Statement

All experimental procedures used in the study were approved by the Animal Care and Use Committee of the Dalian Ocean University (Dalian, China).

2.2. Low-Temperature Treatment and Sample Collection

The yellowtail kingfish were obtained from Dalian Fugu Food Co., Ltd., with a mean body length of 33.06 ± 1.98 cm and a mean body weight of 621.13 ± 63.29 g. Prior to the experiment, 30 fish were acclimated in a 1000 L tank for one week under controlled conditions, with a water temperature of 18.04 ± 0.27 °C. The fish were fed once daily. In this study, the low-temperature stress was set at 10 °C. During the cold stress treatment, the fish were transferred to a 10 °C water tank. Muscle tissues were collected at 0 h (M0, control), 6 h (M6), 12 h (M12), and 24 h (M24) post-exposure. At each time point, six fish were randomly selected. Subsequently, the muscle samples from pairs of fish were mixed to form a pooled sample, resulting in three replicated samples. Before tissue collection, fish were anesthetized in 200 mg/L MS-222, and dissected on ice. Muscle tissues were placed in 1.5 mL tubes, flash-frozen in liquid nitrogen, and stored at −80 °C for further analysis.

2.3. RNA Extraction and Transcriptome Sequencing

RNA extraction from muscle tissues was performed using TRIzol reagent (Promega, Madison, USA) in accordance with the manufacturer’s protocol, followed by DNase I (TaKaRa, Kyoto, Japan) treatment to eliminate residual genomic DNA. RNA purity and integrity were verified using a Bioanalyzer 2100 (Agilent Technologies, Santa Clara, CA, USA). After quality control, 1 μg of RNA was taken from each sample for RNA library preparation. Sequencing libraries were constructed using the NEBNext® UltraTM RNA Library Prep Kit for Illumina® following the manufacturer’s instructions. The prepared libraries were then sequenced on an Illumina HiSeq 2500 platform, generating 150 bp paired-end reads (Genedenovo Biotechnology Co., Ltd., Guangzhou, China). Raw sequencing reads in FASTQ format were processed using in-house Perl scripts to remove low-quality sequences. Data quality metrics, including Q20, Q30, GC content, and sequence duplication rates, were assessed for the filtered reads. Then, the transcriptome de novo assembly of high-quality sequence read data was achieved with Trinity. The Go, KEGG, eggNOG, NR, and Swiss-Prot databases were then used to perform the gene annotation, using an E-value ≤ 10−5. The Clean Data of each sample were aligned to the assembled Unigene library, and the number of reads mapped to each Unigene was calculated using RSEM (RNASeq by Expectation Maximization). The expression abundance of the corresponding Unigene was then represented by FPKM values, which incorporate the effective length of the Unigene and the total number of mapped reads.

2.4. Differential Gene Expression and Bioinformatics Analysis

To investigate cold-induced transcriptional changes in muscle tissues, comparative transcriptomic analysis was conducted across four yellowtail kingfish species using DESeq2. Read count data served as input, with differentially expressed genes (DEGs) identified at a significance threshold of adjusted p < 0.05. Additionally, Gene Ontology (GO) analysis was conducted to classify gene functions, while the Kyoto Encyclopedia of Genes and Genomes (KEGG) database was used to identify significantly enriched biological pathways. These analyses provided insights into the biological roles and pathway associations of the DEGs under cold stress.

2.5. Quantitative PCR Validation of RNA-Seq Results

To confirm the accuracy of transcriptome sequencing results, ten highly expressed differentially expressed genes (atgl, sesn4, gcdha, gapdhs, dnaja, hspa4a, gk, acsl3a, CBF, and hsp90b1) were randomly selected for quantitative real-time PCR validation. Gene-specific primers were designed using Primer 5.0 software (Table 1). The ribosomal 18S gene served as an endogenous reference for normalizing target gene expression levels. RNA samples were converted to cDNA using the PrimeScriptTM RT Reagent Kit (TaKaRa, Japan) following the recommended protocol. Quantitative PCR amplification was carried out in 10 μL reactions containing SYBR Premix Ex TaqTM II (TliRNaseH Plus) (TaKaRa, Kyoto, Japan) under the following thermal cycling parameters: 30 s at 95 °C for initial denaturation, then 40 cycles of 15 s at 95 °C and 30 s at 60 °C. Gene expression quantification was performed using the comparative CT method (2−ΔΔCT), with statistical analysis conducted through independent t-tests in SPSS (version 29), considering p values below 0.05 as statistically significant.

3. Result

3.1. Sequencing and Read Mapping

Muscle tissue transcriptomes from 12 samples were sequenced on an Illumina platform following exposure to varying durations of low-temperature stress. Following quality control filtration, approximately 264.38 million clean reads, corresponding to an average of 22.03 million clean reads per sample, were obtained for analysis (Table 2). All samples showed high sequencing quality, with Q30 base quality surpassing 94.91% and GC content maintained within the range of 51.77% to 52.92%. Reads were successfully mapped at an average of 19.52 million per sample (over 234 million reads in total), and the minimum mapping ratio observed was 87.1%. Furthermore, assembly and annotation produced 24,708 unigenes (averaging 976 bp in length), of which 24,416 (98.82%) were successfully annotated in the Nr database, demonstrating high annotation completeness (Supplementary Table S1). These results collectively confirm that the sequencing data are reliable for subsequent analyses.

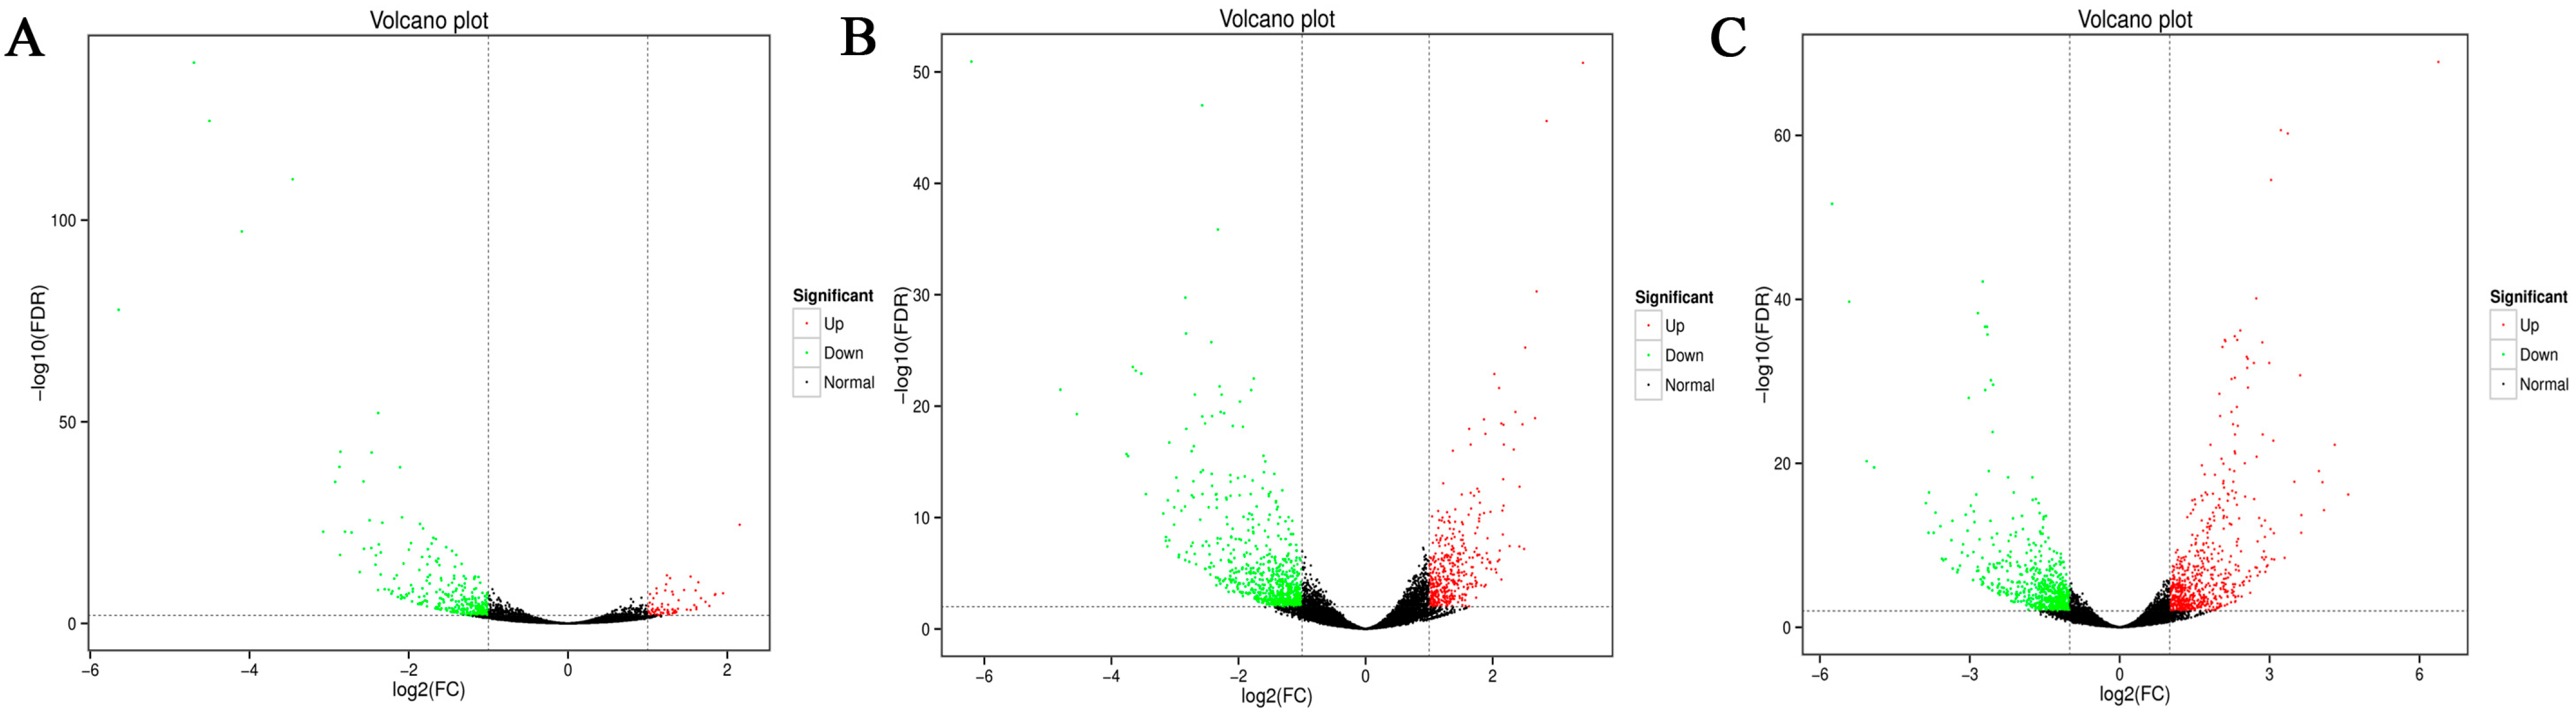
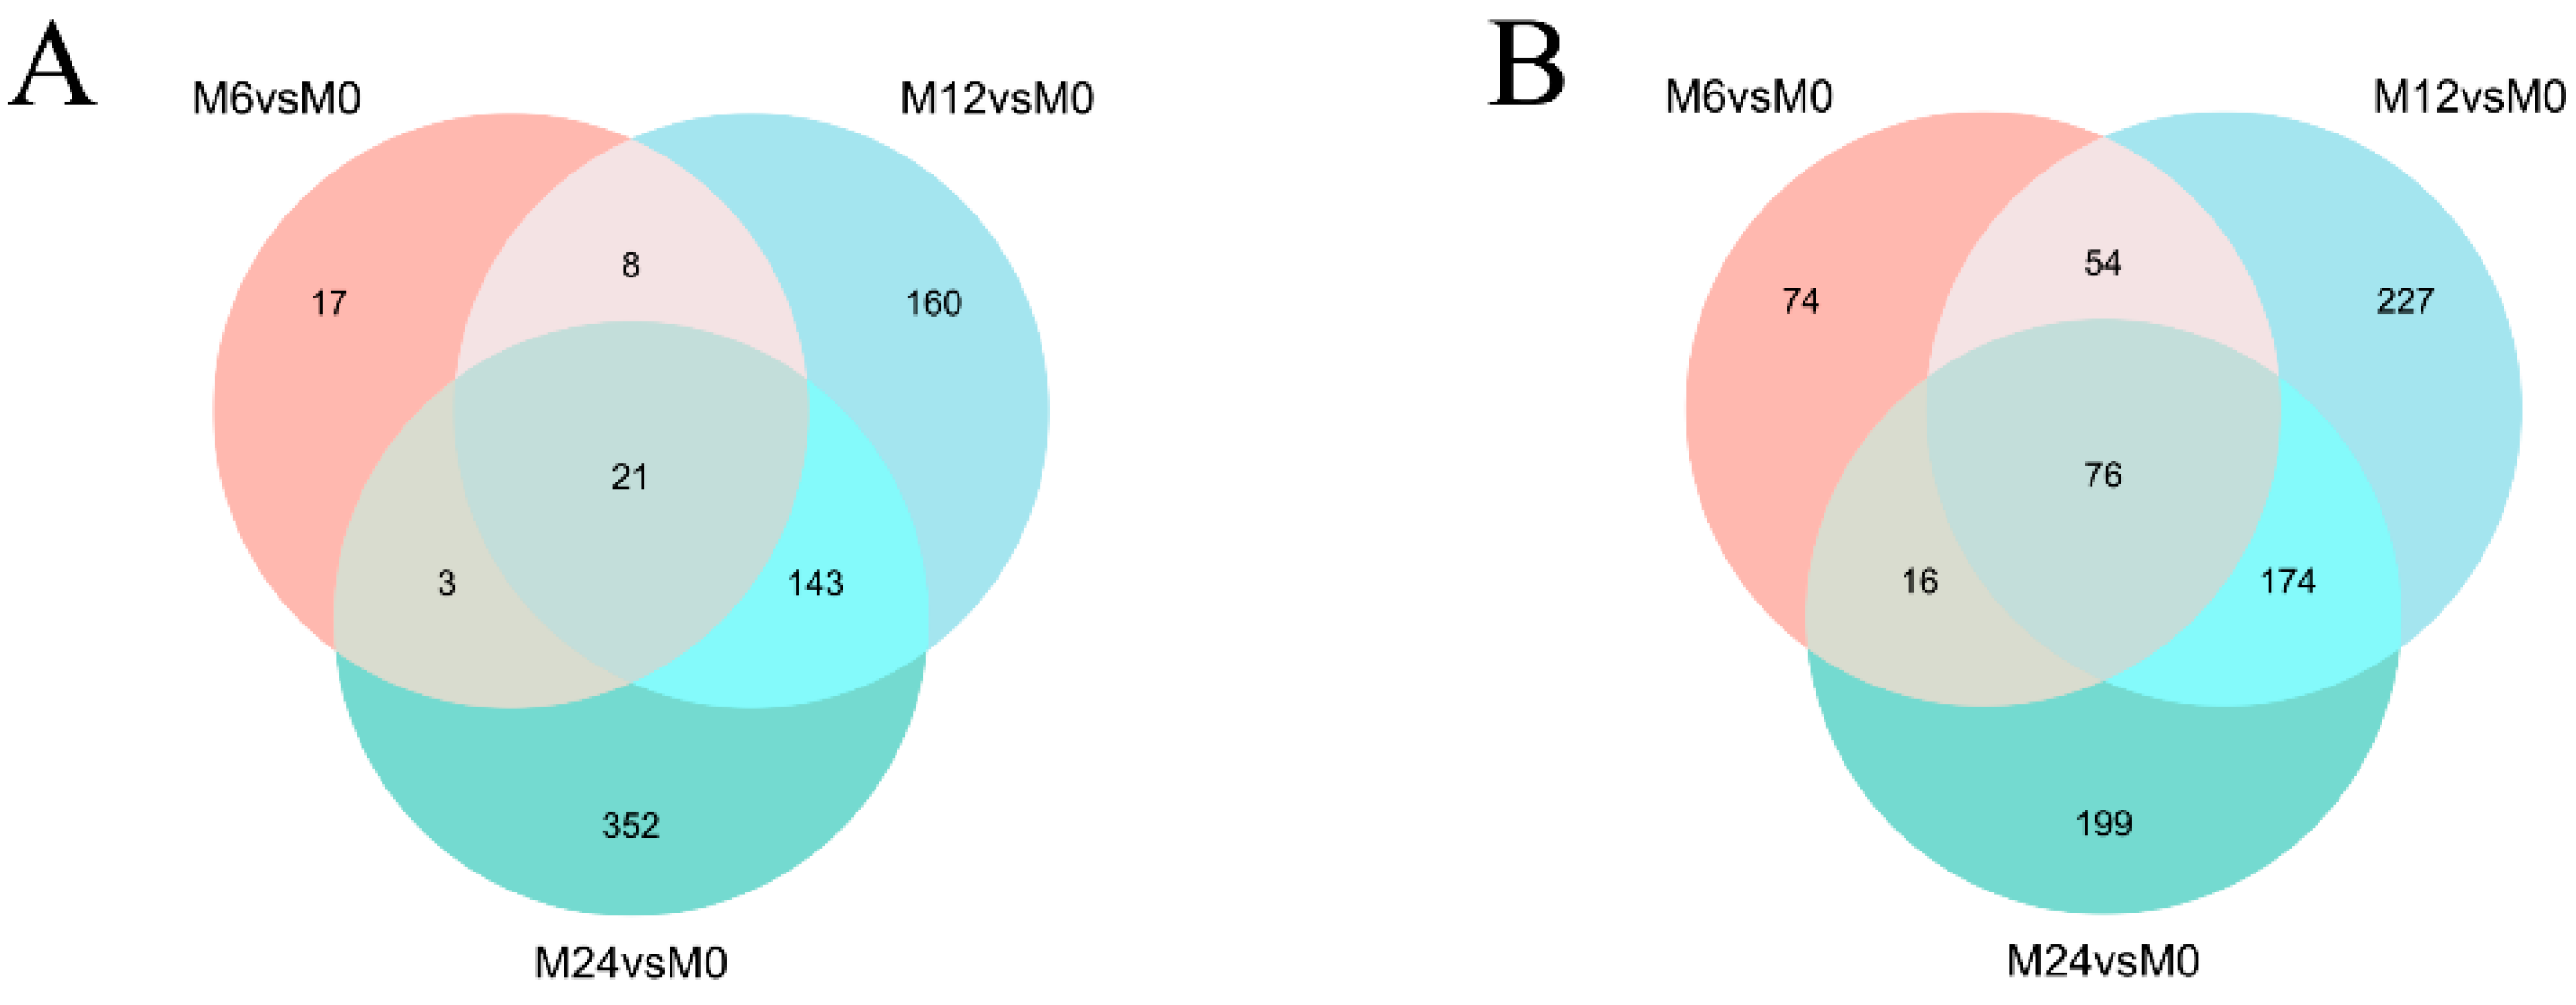
3.2. Analysis of Gene Expression Differences

Transcriptomic profiling of muscle tissues revealed dynamic gene expression patterns in response to cold stress exposure. Using the initial time point (0 h) as the control, we identified DEGs at three time points (6 h, 12 h, and 24 h) by applying stringent thresholds (|log2FC| > 1, p-value < 0.05, FDR < 0.05). The number of DEGs increased progressively with prolonged cold exposure: 269 (49 upregulated, 220 downregulated) at 6 h, 863 (332 upregulated, 531 downregulated) at 12 h, and 984 (519 upregulated, 465 downregulated) at 24 h. These quantitative differences are shown in the volcano plot (Figure 1).
An overlapping examination of the twelve experimental datasets uncovered 97 DEGs that were commonly regulated across all three comparative groups under low-temperature stress conditions. Among these conserved DEGs, 21 exhibited up-regulation patterns, particularly adhesion G-protein-coupled receptor G5-like, zinc finger protein 395-like isoform X1, interferon-induced protein 44-like, and thrombospondin-1-like. Conversely, 76 genes showed down-regulation, including zinc finger protein Eos isoform X1, heat shock 70 kDa protein 4-like, zinc finger protein 40, G protein-coupled receptor kinase 5-like, 78 kDa glucose-regulated protein, and phosphoserine aminotransferase (Figure 2). This core set of temperature-responsive genes suggests fundamental molecular adaptations to cold stress.

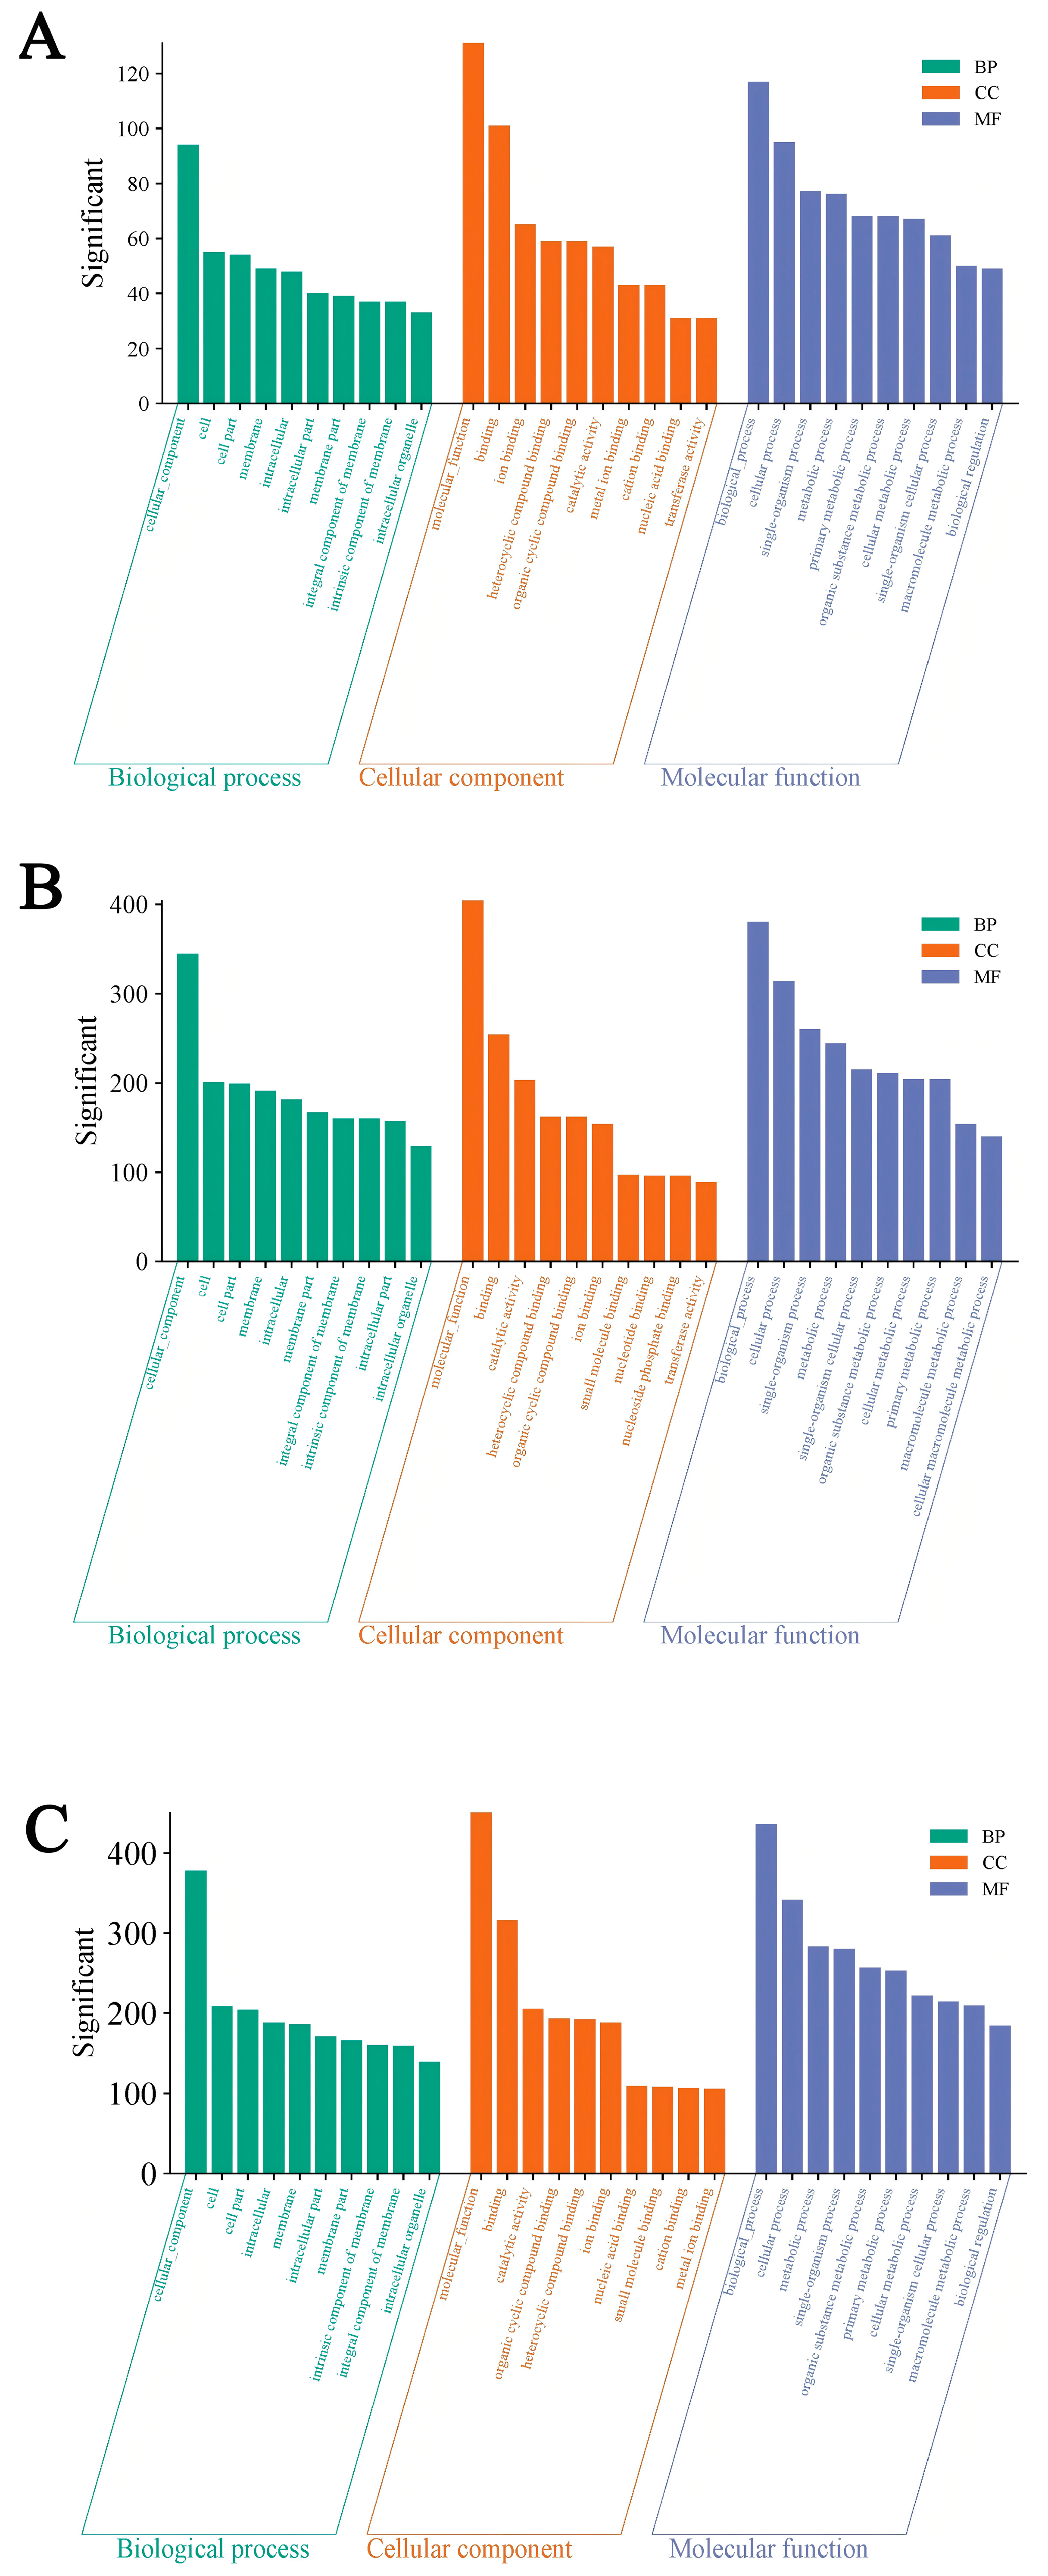
3.3. GO Enrichment Analysis of the DEGs

GO analysis was employed to characterize the functional attributes of DEGs, which were systematically classified into three principal categories: biological processes, molecular functions, and cellular components. The analysis demonstrated that in the biological process category, the most prominent DEGs were associated with cellular process, single-organism process, metabolic process, biological regulation, and response to stimulus. Within cellular components, the predominant GO terms comprised cell, cell part, membrane, organelle, and macromolecular complex. Molecular function analysis identified key roles for DEGs in binding, catalytic activity, transporter activity, signal transducer activity, and nucleic acid binding transcription factor activity (Figure 3).

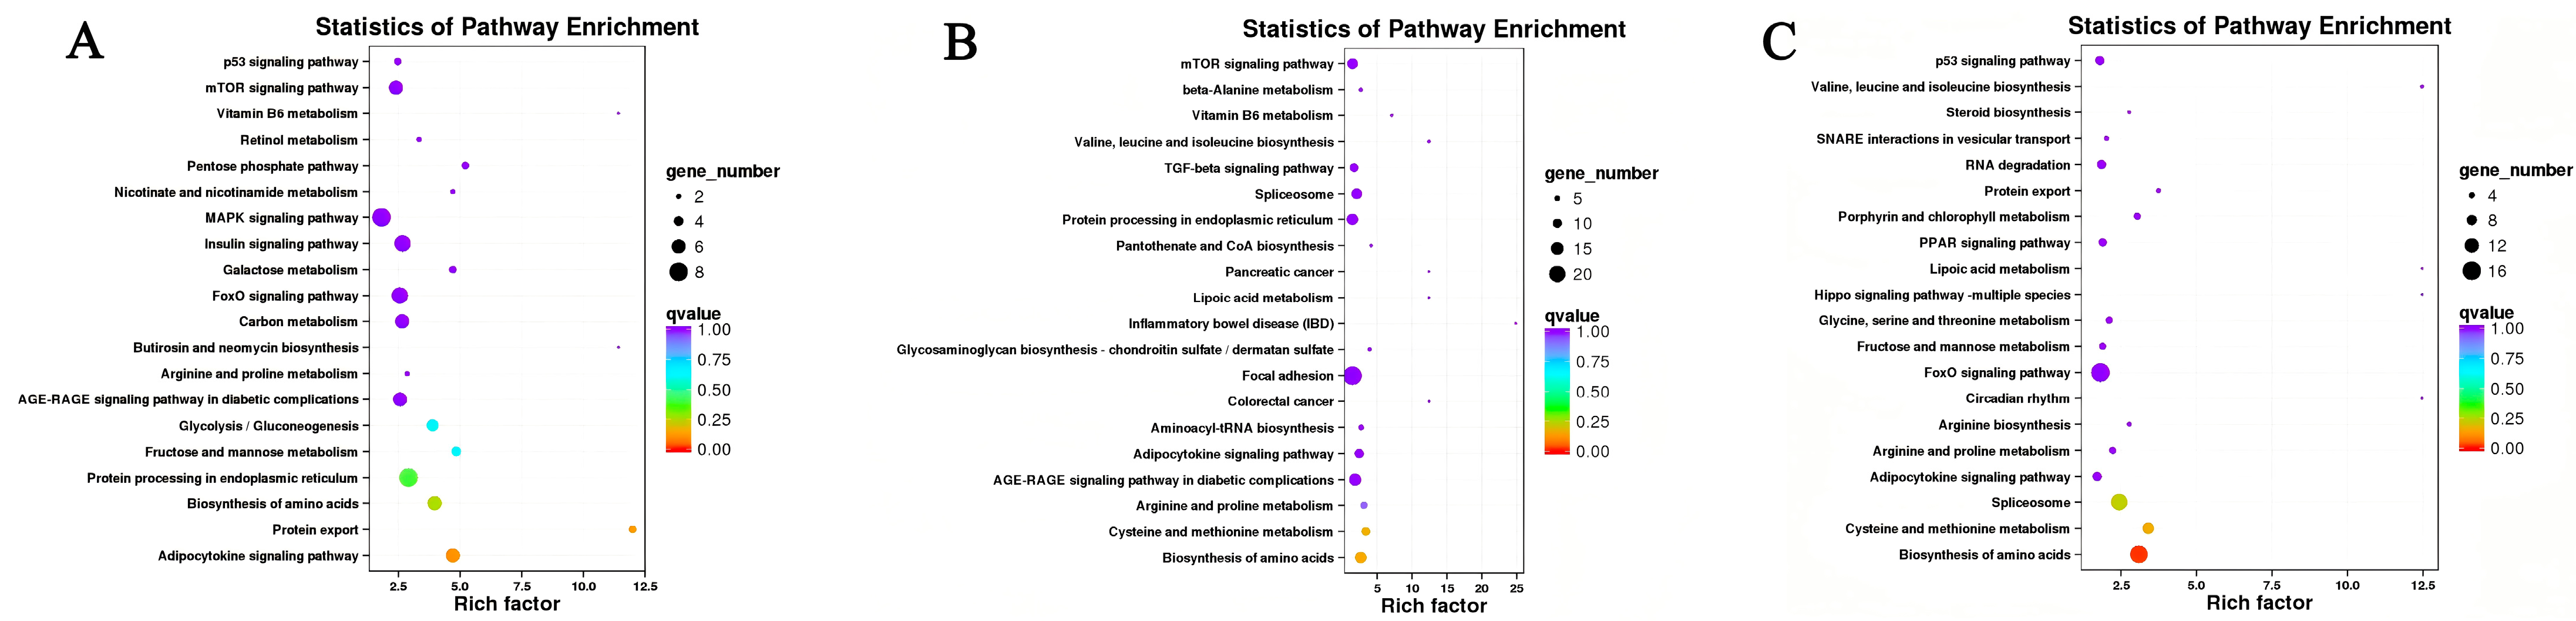
3.4. KEGG Pathway Enrichment Analysis of the DEGs

KEGG pathway analysis was conducted to investigate the potential biological functions and molecular interaction networks of the identified DEGs. The top 20 enriched pathways are presented in Figure 4. Notably, in the comparisons of M6 vs. M0 and M12 vs. M0, no significant KEGG enrichment was observed (Figure 4A,B). However, in the 24 h treatment group, only the “Biosynthesis of amino acids” pathway showed significance (Figure 4C). This indicates that the “Biosynthesis of amino acids” pathway plays a crucial regulatory role in fish muscle tissues after 24 h of exposure to low-temperature conditions.

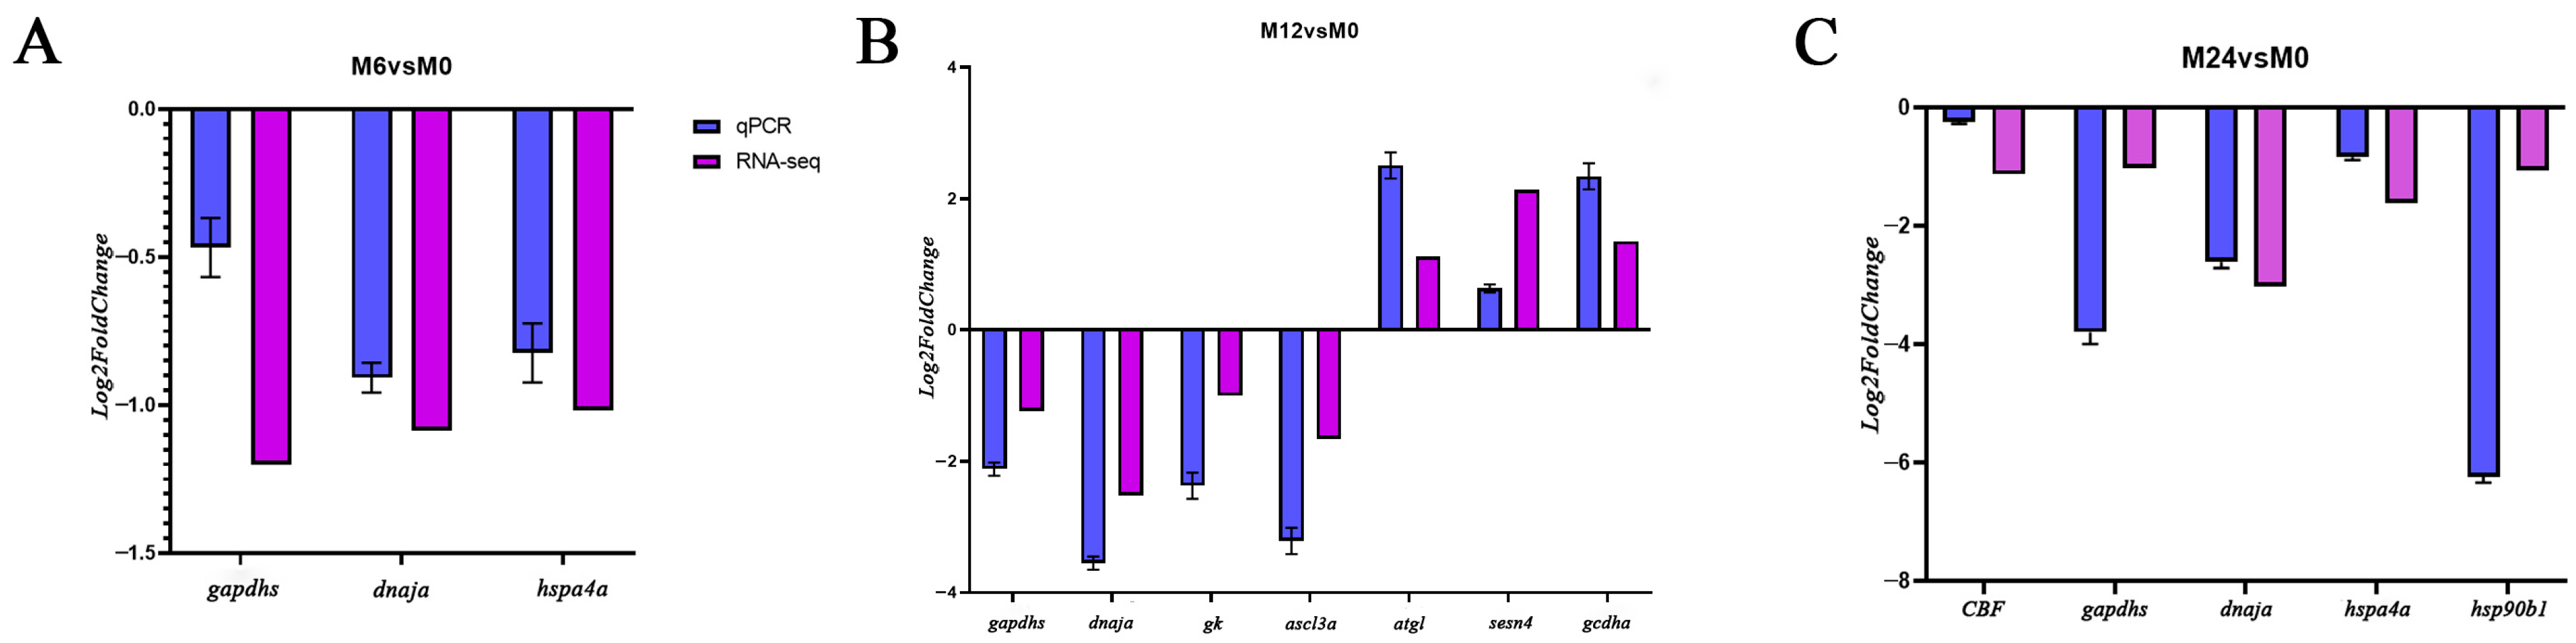
3.5. qPCR Validation of RNA-Seq Data

To assess the reproducibility of the RNA sequencing data, quantitative PCR validation was performed on 10 randomly selected differentially expressed genes. The qPCR analysis revealed significant upregulation of three genes, including atgl, sesn4, and gcdha, under cold stress conditions, whereas gapdhs, dnaja, hspa4a, gk, acsl3a, CBF, and hsp90b1 exhibited downregulated expression patterns (Figure 5). The strong agreement between qPCR validation and RNA-seq data strongly supports the robustness of our transcriptomic analysis.

4. Discussion

The yellowtail kingfish, an economically important marine fish species in aquaculture, exhibits high susceptibility to low-temperature stress during winter cultivation, often resulting in substantial mortality. To elucidate the molecular adaptation mechanisms underlying its cold stress response, we conducted transcriptome profiling by constructing cDNA libraries from muscle tissues under varying temperature regimes, followed by de novo assembly and comprehensive bioinformatic analyses. Our investigation revealed significant differential expression of genes associated with critical metabolic pathways, including lipid metabolism, carbohydrate metabolism, and glutathione metabolism, providing valuable insights into the molecular regulatory networks involved in low-temperature adaptation in this commercially significant species.
Low temperature typically affects cellular membrane fluidity in fish, and maintaining appropriate membrane fluidity becomes essential for their survival during temperature fluctuations [17,18,19]. Under low-temperature conditions, fish adapt to cold stress and enhance cold tolerance by modulating the expression of fatty acid metabolism-related genes, thereby altering the composition of fatty acids in cell membranes across various tissues [17,20,21,22]. Among these components, unsaturated fatty acids serve as the primary determinants of membrane lipid fluidity. Farkas et al. [23] demonstrated that low-temperature stress significantly increases the content of unsaturated fatty acids in lipid membranes. In this study, we observed that the expression of acyl-CoA thioesterase 1 (ACOT1), a key enzyme involved in fatty acid elongation, was significantly upregulated in the muscle tissue of yellowtail kingfish after 12 h of exposure to low-temperature conditions. ACOT1 is known to promote the biosynthesis of the unsaturated fatty acid docosahexaenoic acid (DHA) [24,25]. Previous studies have demonstrated that upon esterification into phospholipids, DHA can profoundly alter fundamental membrane properties, including fluidity [26,27]. Thus, we hypothesize that the upregulation of ACOT1 gene expression in yellowtail kingfish muscle under low-temperature conditions may enhance membrane fluidity through increased DHA production. Moreover, ACOT1 catalyzes the conversion of acyl-CoAs to fatty acids (FAs) and coenzyme A [28], suggesting that its upregulation in muscle tissue would consequently increase intracellular FA levels. These FAs serve as ligands for peroxisome proliferator-activated receptors (PPARs), which play a pivotal role in regulating energy metabolism by modulating fatty acid and glucose homeostasis [29,30]. However, whether ACOT1-mediated regulation contributes to thermal adaptation in yellowtail kingfish muscle remains to be further elucidated.
In teleost fishes, the central nervous system mediates stress responses by activating the brain–sympathetic–chromaffin cell (BSC) axis to release catecholamine hormones (mainly adrenaline and noradrenaline) while simultaneously stimulating the hypothalamic–pituitary–interrenal (HPI) axis to secrete cortisol into the circulatory system, collectively coordinating the primary stress response [31,32]. During this adaptive process, muscle tissue serves as the primary site of energy metabolism. In cellular energy metabolism, 5′-adenosine monophosphate-activated protein kinase (AMPK) serves as a critical metabolic regulator [33]. AMPK coordinates energy homeostasis by simultaneously activating ATP-producing catabolic pathways while suppressing ATP-consuming anabolic processes, including glycogen synthesis, lipid biogenesis, and protein translation [34,35]. Notably, AMPK activation is mechanistically dependent on regulation by Sestrin family proteins [36,37]. We observed significant upregulation of Sestrin3 expression in yellowtail kingfish muscle following 12 and 24 h cold exposure, suggesting its potential role in mediating AMPK-dependent metabolic adaptation to low-temperature stress.
Glyceraldehyde-3-phosphate dehydrogenase (GAPDH), a key glycolytic enzyme that catalyzes the oxidation of glyceraldehyde-3-phosphate to 1,3-bisphosphoglycerate, plays crucial roles in gluconeogenesis and blood glucose homeostasis [38]. In this study, GAPDH expression was consistently downregulated across all three experimental groups. This downregulation directly inhibited glycolytic activity, resulting in metabolic flux redirection toward the pentose phosphate pathway [39]. Notably, activation of the pentose phosphate pathway significantly enhanced NADPH production [40]. NADPH is essential for the reductive synthesis of membrane lipids and helps maintain cell structural integrity [41]. The downregulation of GAPDH expression under low-temperature conditions suggests that yellowtail kingfish muscle tissue may enhance NADPH production to preserve cellular integrity as an adaptive response to cold stress.
Furthermore, KEGG analysis of DEGs revealed that the “Biosynthesis of amino acids” pathway was significantly enriched in the M24 vs. M0 comparison group (Figure 4C), indicating its crucial regulatory role in fish after 24 h cold water exposure. Amino acid biosynthesis primarily depends on key metabolic pathways including glycolysis, the tricarboxylic acid (TCA) cycle, and the pentose phosphate pathway [42,43,44], with nitrogen incorporation mainly occurring through transamination reactions involving glutamate and glutamine [45]. Notably, glycolysis leads to ATP production, and this energy is overused to endure low temperatures. However, as mentioned above, the expression level of the GAPDH gene in muscle tissue is downregulated under low-temperature conditions, resulting in suppressed glycolytic activity. This suppression promotes the pentose phosphate pathway, thereby generating precursors for amino acid synthesis and ultimately facilitating amino acid production. This finding aligns with the enrichment of DEGs in the amino acid biosynthesis pathway. Furthermore, the enhanced amino acid biosynthetic capacity in muscle tissue under low-temperature conditions may support the synthesis of actin and myosin-two proteins crucial for muscle contraction. Moreover, given that amino acids can also generate pyruvate or acetyl-CoA through deamination and enter the TCA cycle to produce energy [46], the observed enhancement of the amino acid biosynthesis pathway in the muscle tissue of yellowtail kingfish under cold-water conditions in this study suggests that fish may maintain normal physiological functions by upregulating amino acid levels and utilizing ATP generated from the metabolism of surplus amino acids to compensate for the energy deficit caused by suppressed glycolysis.
Heat shock proteins (HSPs) are a class of highly conserved molecules that play diverse roles in various biological processes, including inhibiting apoptosis, modulating immune responses, and enhancing cellular stress resistance [47,48,49]. Previous studies have demonstrated that the expression of HSP genes is influenced by environmental factors such as temperature [50,51,52]. They inhibit the accumulation of denatured proteins, facilitate the breakdown of misfolded or aggregated proteins, and support the proper refolding of proteins, thus reducing the harmful impacts of environmental stresses and improving cellular resilience to stress [53,54]. In this study, HSP70 was found to be highly expressed in yellowtail kingfish after 12 h of cold exposure, whereas HSP90b1 showed significantly lower expression at 24 h. This expression pattern is consistent with that observed in Takifugu fasciatus under low-temperature conditions [52], suggesting that HSPs play a crucial role in maintaining cellular homeostasis and structural integrity in the muscle tissues of yellowtail kingfish during cold stress.

5. Conclusions

This study provides comprehensive insights into the molecular mechanisms underlying cold stress adaptation in yellowtail kingfish. Transcriptomic analysis revealed dynamic changes in gene expression associated with lipid metabolism, carbohydrate metabolism, and stress response pathways under low-temperature conditions. Key findings revealed the upregulation of ACOT1, potentially involved in membrane fluidity maintenance, along with the induction of HSP70 and Sestrin3, implicating their respective roles in protein stabilization and energy homeostasis regulation. The activation of the pentose phosphate pathway further indicates a shift in energy metabolism to cope with cold stress. These results not only enhance our understanding of cold adaptation in yellowtail kingfish but also provide valuable targets for future breeding programs aimed at improving cold tolerance in this economically important species.

Supplementary Materials

The following supporting information can be downloaded at: https://www.mdpi.com/article/10.3390/fishes10070355/s1, Table S1: Summary of transcriptome assembly and annotation statistics.

Author Contributions

Y.T.: Writing—original draft, Writing—review and editing, Investigation, Formal analysis. R.Z.: Investigation, Formal analysis, Data curation. B.W.: Investigation, Formal analysis. M.J.: Writing—original draft, Validation. X.L.: Visualization. X.C.: Investigation, Formal analysis. C.J.: Conceptualization, Supervision, Project administration, Funding acquisition. All authors have read and agreed to the published version of the manuscript.

Funding

This research was supported by the National Key R&D Program of China (2024YFD2400200), the Joint Fund of Natural Science Foundation of Liaoning Province (2023-MSLH-010, 2023-BSBA-005), and the Basic Scientific Research Fund Project of Liaoning Provincial Department of Education (LJ212410158040, 2024JBQNZ008).

Institutional Review Board Statement

All experimental procedures used in the study were approved by the Animal Care and Use Committee of the Dalian Ocean University (Dalian, China). Approval code: DLOU2023015, Approval Date: 30 December 2023.

Informed Consent Statement

Not applicable.

Data Availability Statement

Data will be made available on request.

Conflicts of Interest

The authors declared that they have no commercial or associative conflicts of interest related to the work submitted.

References

  1. Canosa, L.F.; Bertucci, J.I. The effect of environmental stressors on growth in fish and its endocrine control. Front. Endocrinol. 2023, 14, 1109461. [Google Scholar] [CrossRef] [PubMed]
  2. Soyano, K.; Mushirobira, Y. The mechanism of low-temperature tolerance in fish. Adapt. Mech. Their Appl. 2018, 1081, 149–164. [Google Scholar] [CrossRef]
  3. Refaey, M.M.; Mehrim, A.I.; El-Komy, M.M.; Zenhom, O.A.; Mansour, A.T. Chronic cold-stress induced histopathological changes, oxidative stress, and alterations in liver functions and nutrient composition of hybrid red tilapia and the potential protection of unsaturated fatty acids. Front. Mar. Sci. 2023, 10, 1148978. [Google Scholar] [CrossRef]
  4. Ummenhofer, C.C.; Meehl, G.A. Extreme weather and climate events with ecological relevance: A review. Philos. Trans. R. Soc. B 2017, 372, 20160135. [Google Scholar] [CrossRef] [PubMed]
  5. Wang, Z.; Gerstein, M.; Snyder, M. RNA-Seq: A revolutionary tool for transcriptomics. Nat. Rev. Genet. 2009, 10, 57–63. [Google Scholar] [CrossRef] [PubMed]
  6. Ozsolak, F.; Milos, P.M. RNA sequencing: Advances, challenges and opportunities. Nat. Rev. Genet. 2011, 12, 87–98. [Google Scholar] [CrossRef] [PubMed]
  7. Cheng, C.H.; Ye, C.X.; Guo, Z.X.; Wang, A.-L. Immune and physiological responses of pufferfish (Takifugu obscurus) under cold stress. Fish Shellfish Immunol. 2017, 64, 137–145. [Google Scholar] [CrossRef] [PubMed]
  8. Mateus, A.P.; Costa, R.; Gisbert, E.; Pinto, P.I.; Andree, K.B.; Estévez, A.; Power, D.M. Thermal imprinting modifies bone homeostasis in cold-challenged sea bream (Sparus aurata). J. Exp. Biol. 2017, 220, 3442–3454. [Google Scholar] [CrossRef] [PubMed]
  9. Dietrich, M.A.; Hliwa, P.; Adamek, M.; Steinhagen, D.; Karol, H.; Ciereszko, A. Acclimation to cold and warm temperatures is associated with differential expression of male carp blood proteins involved in acute phase and stress responses, and lipid metabolism. Fish Shellfish Immunol. 2018, 76, 305–315. [Google Scholar] [CrossRef] [PubMed]
  10. Rossi, A.; Bacchetta, C.; Cazenave, J. Effect of thermal stress on metabolic and oxidative stress biomarkers of Hoplosternum littorale (Teleostei, Callichthyidae). Ecol. Indic. 2017, 79, 361–370. [Google Scholar] [CrossRef]
  11. Somero, G.N. The physiology of climate change: How potentials for acclimatization and genetic adaptation will determine ‘winners ’ and ‘losers’. J. Exp. Biol. 2010, 213, 912–920. [Google Scholar] [CrossRef] [PubMed]
  12. Bartolini, T.; Butail, S.; Porfiri, M. Temperature influences sociality and activity of freshwater fish. Environ. Biol. Fishes 2015, 98, 825–832. [Google Scholar] [CrossRef]
  13. Symonds, J.; Walker, S.; Pether, S.; Gublin, Y.; McQueen, D.; King, A.; Irvine, G.; Setiawan, A.; Forsythe, J.; Bruce, M. Developing yellowtail kingfish (Seriola lalandi) and hāpuku (Polyprion oxygeneios) for New Zealand aquaculture. N. Z. J. Mar. Freshw. Res. 2014, 48, 371–384. [Google Scholar] [CrossRef]
  14. Soltanian, S.; Adloo, M.N.; Hafeziyeh, M.; Ghadimi, N. Effect of β-Glucan on cold-stress resistance of striped catfish, Pangasianodon hypophthalmus (Sauvage, 1878). Vet. Med. 2014, 59, 440–446. [Google Scholar] [CrossRef]
  15. Li, Q.; Huang, Y.; Zhang, X.; Zou, C.; Lin, L. Improvement of muscle quality in tilapia (Oreochromis niloticus) with dietary faba bean (Vicia faba L.). Front. Nutr. 2023, 10, 1153323. [Google Scholar] [CrossRef] [PubMed]
  16. Watanabe, Y.Y.; Payne, N.L. Thermal sensitivity of metabolic rate mirrors biogeographic differences between teleosts and elasmobranchs. Nat. Commun. 2023, 14, 2054. [Google Scholar] [CrossRef] [PubMed]
  17. Farkas, T.; Fodor, E.; Kitajka, K.; Halver, J.E. Response of fish membranes to environmental temperature. Aquac. Res. 2001, 32, 645–655. [Google Scholar] [CrossRef]
  18. Abdel-Ghany, H.M.; El-Sayed, A.M.; Ezzat, A.A.; Essa, M.A.; Helal, A.M. Dietary lipid sources affect cold tolerance of Nile tilapia (Oreochromis niloticus). J. Therm. Biol. 2019, 79, 50–55. [Google Scholar] [CrossRef] [PubMed]
  19. Wijekoon, M.P.A.; Parrish, C.C.; Gallardi, D.; Nag, K.; Mansour, A. Diet and temperature affect liver lipids and membrane properties in steelhead trout (Oncorhynchus mykiss). Aquac. Nutr. 2021, 27, 734–746. [Google Scholar] [CrossRef]
  20. Xu, H.; Wang, C.; Zhang, Y.; Wei, Y.; Liang, M. Moderate levels of dietary arachidonic acid reduced lipid accumulation and tended to inhibit cell cycle progression in the liver of Japanese seabass Lateolabrax japonicus. Sci. Rep. 2018, 8, 10682. [Google Scholar] [CrossRef] [PubMed]
  21. Deng, W.; Sun, J.; Chang, Z.; Gou, N.-N.; Wu, W.-Y.; Luo, X.-L.; Zhou, J.-S.; Yu, H.-B.; Ji, H. Energy response and fatty acid metabolism in Onychostoma macrolepis exposed to low-temperature stress. J. Therm. Biol. 2020, 94, 102725. [Google Scholar] [CrossRef] [PubMed]
  22. Winnikoff, J.R.; Haddock, S.H.D.; Budin, I. Depth- and temperature-specific fatty acid adaptations in ctenophores from extreme habitats. J. Exp. Biol. 2021, 224, jeb242800. [Google Scholar] [CrossRef] [PubMed]
  23. Franks, N.P. Structural analysis of hydrated egg lecithin and cholesterol bilayers. I. X-Ray diffraction. J. Mol. Biol. 1976, 100, 345–358. [Google Scholar] [CrossRef] [PubMed]
  24. Liu, Y.; Zeng, L.; Yang, Y.; Chen, C.; Wang, D.; Wang, H. Acyl-CoA thioesterase 1 prevents cardiomyocytes from Doxorubicin-induced ferroptosis via shaping the lipid composition. Cell Death Dis. 2020, 11, 756. [Google Scholar] [CrossRef] [PubMed]
  25. Zhou, K.; Chen, Z.; Qin, J.; Huang, Y.; Du, X.; Zhang, C.; Pan, X.; Lin, Y.; Abdelsalam, M. Effects of salinity on muscle nutrition, fatty acid composition, and substance anabolic metabolism of Blue Tilapia Oreochromis aureus. J. Appl. Ichthyol. 2024, 2024, 5549406. [Google Scholar] [CrossRef]
  26. Stillwell, W.; Wassall, S.R. Docosahexaenoic acid: Membrane properties of a unique fatty acid. Chem. Phys. Lipids 2003, 126, 1–27. [Google Scholar] [CrossRef] [PubMed]
  27. Guixà-González, R.; Javanainen, M.; Gómez-Soler, M.; Cordobilla, B.; Domingo, J.C.; Sanz, F.; Pastor, M.; Ciruela, F.; Martinez-Seara, H.; Selent, J. Membrane omega-3 fatty acids modulate the oligomerisation kinetics of adenosine A2A and dopamine D2 receptors. Sci. Rep. 2016, 6, 19839. [Google Scholar] [CrossRef] [PubMed]
  28. Franklin, M.P.; Sathyanarayan, A.; Mashek, D.G. Acyl-CoA thioesterase 1 (ACOT1) regulates PPARα to couple fatty acid flux with oxidative capacity during fasting. Diabetes 2017, 66, 2112–2123. [Google Scholar] [CrossRef] [PubMed]
  29. Novgorodtseva, T.P.; Karaman, Y.K.; Zhukova, N.V.; Lobanova, E.G.; Antonyuk, M.V.; Kantur, T.A. Composition of fatty acids in plasma and erythrocytes and eicosanoids level in patients with metabolic syndrome. Lipids Health Dis. 2011, 10, 82. [Google Scholar] [CrossRef] [PubMed]
  30. Mason, R.P.; Jacob, R.F.; Shrivastava, S.; Sherratt, S.C.; Chattopadhyay, A. Eicosapentaenoic acid reduces membrane fluidity, inhibits cholesterol domain formation, and normalizes bilayer width in atherosclerotic-like model membranes. Biochim. Biophys. Acta (BBA)-Biomembr. 2016, 1858, 3131–3140. [Google Scholar] [CrossRef] [PubMed]
  31. Skrzynska, A.K.; Maiorano, E.; Bastaroli, M.; Naderi, F.; Míguez, J.M.; Martínez-Rodríguez, G.; Mancera, J.M.; Martos-Sitcha, J.A. Impact of Air Exposure on vasotocinergic and isotocinergic systems in gilthead sea bream (Sparus aurata): New insights on fish stress response. Front. Physiol. 2018, 9, 96. [Google Scholar] [CrossRef] [PubMed]
  32. Alfonso, S.; Gesto, M.; Sadoul, B. Temperature increase and its effects on fish stress physiology in the context of global warming. J. Fish Biol. 2021, 98, 1496–1508. [Google Scholar] [CrossRef] [PubMed]
  33. Garcia, D.; Shaw, R.J. AMPK: Mechanisms of cellular energy sensing and restoration of metabolic balance. Mol. Cell 2017, 66, 789–800. [Google Scholar] [CrossRef] [PubMed]
  34. Ke, R.; Xu, Q.; Li, C.; Luo, L.; Huang, D. Mechanisms of AMPK in the maintenance of ATP balance during energy metabolism. Cell Biol. Int. 2018, 42, 384–392. [Google Scholar] [CrossRef] [PubMed]
  35. Cui, Y.; Chen, J.; Zhang, Z.; Shi, H.; Sun, W.; Yi, Q. The role of AMPK in macrophage metabolism, function and polarisation. J. Transl. Med. 2023, 21, 892. [Google Scholar] [CrossRef] [PubMed]
  36. Budanov, A.V.; Karin, M. p53 target genes sestrin1 and sestrin2 connect genotoxic stress and mTOR signaling. Cell 2008, 134, 451–460. [Google Scholar] [CrossRef] [PubMed]
  37. Kang, X.; Petyaykina, K.; Tao, R.; Xiong, X.; Dong, X.C.; Liangpunsakul, S. The inhibitory effect of ethanol on Sestrin3 in the pathogenesis of ethanol-induced liver injury. Am. J. Physiol.-Gastrointest. Liver Physiol. 2014, 307, G58–G65. [Google Scholar] [CrossRef] [PubMed]
  38. Aghdam, M.S.; Moradi, M.; Razavi, F.; Rabiei, V. Exogenous phenylalanine application promotes chilling tolerance in tomato fruits during cold storage by ensuring supply of NADPH for activation of ROS scavenging systems. Sci. Hortic. 2019, 246, 818–825. [Google Scholar] [CrossRef]
  39. Schreiber, R.; Xie, H.; Schweiger, M. Of mice and men: The physiological role of adipose triglyceride lipase (ATGL). Biochim. Biophys. Acta (BBA)-Mol. Cell Biol. Lipids 2019, 1864, 880–899. [Google Scholar] [CrossRef] [PubMed]
  40. Chen, L.; Zhang, Z.; Hoshino, A.; Zheng, H.D.; Morley, M.; Arany, Z.; Rabinowitz, J.D. NADPH production by the oxidative pentose-phosphate pathway supports folate metabolism. Nat. Metab. 2019, 1, 404–415. [Google Scholar] [CrossRef] [PubMed]
  41. Rufino-Palomares, E.E.; Reyes-Zurita, F.J.; García-Salguero, L.; Peragón, J.; de la Higuera, M.; Lupiáñez, J.A. NADPH production, a growth marker, is stimulated by maslinic acid in gilthead sea bream by increased NADP-IDH and ME expression. Comp. Biochem. Physiol. Part C Toxicol. Pharmacol. 2016, 187, 32–42. [Google Scholar] [CrossRef] [PubMed]
  42. Dienel, G.A. Chapter 3-Energy metabolism in the brain. In From Molecules to Networks, 3rd ed.; Byrne, J.H., Heidelberger, R., Waxham, M.N., Eds.; Academic Press: Boston, MA, USA, 2014; pp. 53–117. [Google Scholar]
  43. Stincone, A.; Prigione, A.; Cramer, T.; Wamelink, M.M.C.; Campbell, K.; Cheung, E.; Olin-Sandoval, V.; Grüning, N.-M.; Krüger, A.; Tauqeer Alam, M.; et al. The return of metabolism: Biochemistry and physiology of the pentose phosphate pathway. Biol. Rev. Camb. Philos. Soc. 2015, 90, 927–963. [Google Scholar] [CrossRef] [PubMed]
  44. Fry, B.; Carter, J.F. Stable carbon isotope diagnostics of mammalian metabolism, a high-resolution isotomics approach using amino acid carboxyl groups. PLoS ONE 2019, 14, e0224297. [Google Scholar] [CrossRef] [PubMed]
  45. Kurmi, K.; Haigis, M.C. Nitrogen Metabolism in Cancer and Immunity. Trends Cell Biol. 2020, 30, 408–424. [Google Scholar] [CrossRef] [PubMed]
  46. Hayamizu, K. 21-Amino acids and energy metabolism: An overview. Sustain. Energy Enhanc. Hum. Funct. Act. 2017, 339–349. Available online: https://www.sciencedirect.com/science/article/abs/pii/B9780128054130000211 (accessed on 14 April 2025).
  47. Robert, J. Evolution of heat shock protein and immunity. Dev. Comp. Immunol. 2003, 27, 449–464. [Google Scholar] [CrossRef] [PubMed]
  48. Takayama, S.; Reed, J.C.; Homma, S. Heat-shock proteins as regulator of apoptosis. Oncogene 2004, 22, 9041–9047. [Google Scholar] [CrossRef] [PubMed]
  49. Hu, C.; Yang, J.; Qi, Z.; Wu, H.; Wang, B.; Zou, F.; Mei, H.; Liu, J.; Wang, W.; Liu, Q. Heat shock proteins: Biological functions, pathological roles, and therapeutic opportunities. MedComm 2020, 3, e161. [Google Scholar] [CrossRef] [PubMed]
  50. Kapila, R.; Pant, R.; Gaur, A.K.; Mahanta, P.C. Effect of low temperature on metabolic enzymes and HSP-70 expression of coldwater fish Barilius bendelisis. Asian Fish. Sci. 2009, 22, 125–136. [Google Scholar] [CrossRef]
  51. Mottola, G.; Nikinmaa, M.; Anttila, K. Hsp70s transcription-translation relationship depends on the heat shock temperature in zebrafish. Comp. Biochem. Physiol. Part A Mol. Integr. Physiol. 2020, 240, 110629. [Google Scholar] [CrossRef] [PubMed]
  52. Zhang, W.; Qian, Z.; Ji, J.; Wang, T.; Yin, S.; Zhang, K. Characterization of HSP70 and HSP90 gene family in Takifugu fasciatus and their expression profiles on biotic and abiotic stresses response. Genes 2024, 15, 1445. [Google Scholar] [CrossRef] [PubMed]
  53. Al-Whaibi, M.H. Plant heat-shock proteins: A mini review. J. King Saud. Univ.-Sci. 2011, 23, 139–150. [Google Scholar] [CrossRef]
  54. Turan, M. Genome-wide analysis and characterization of HSP gene families (HSP20, HSP40, HSP60, HSP70, HSP90) in the yellow fever mosquito (Aedes aegypti) (Diptera: Culicidae). J. Insect Sci. 2023, 23, 27. [Google Scholar] [CrossRef] [PubMed]
Figure 1. Volcano plots of differentially expressed genes (DEGs). (A) M6 vs. M0 group; (B) M12 vs. M0 group; (C) M24 vs. M0 group. In the plots, green and red dots represent genes with significant expression differences, where green indicates downregulated genes, red indicates upregulated genes, and black dots represent genes with no significant expression differences.
Fishes 10 00355 g001
Figure 2. Venn diagram showing the overlapping of DEGs detected among M6 vs. M0, M12 vs. M0, and M24 vs. M0 comparisons. (A): Up-regulated DEGs; (B): down-regulated DEGs.
Fishes 10 00355 g002
Figure 3. Gene Ontology (GO) classification of DEGs across temporal comparison groups: (A) M6 vs. M0, (B) M12 vs. M0, and (C) M24 vs. M0.
Fishes 10 00355 g003
Figure 4. Bubble plot of KEGG enrichment analysis for differentially expressed genes. (A) M6 vs. M0 group; (B) M12 vs. M0 group; (C) M24 vs. M0 group. The X-axis represents the Rich factor, while the Y-axis displays significantly enriched pathways.
Fishes 10 00355 g004
Figure 5. Comparison of qPCR results with transcriptome data. Ten DEGs, atgl, sesn4, gcdha, gapdhs, dnaja, hspa4a, gk, acsl3a, CBF, and hsp90b1, were randomly selected for qPCR analyses. (A) M6 vs. M0; (B) M12 vs. M0; (C) M24 vs. M0.
Fishes 10 00355 g005
Table 1. Primer sequences for real-time quantitative PCR (qPCR).
Primer NamePrimer Sequence (5′–3′)
18SF:TACCACATCCAAAGAAGGCA
R:TCGATCCCGAGATCCAACTA
gcdhaF:GGATATTGCCAGACAAGCCAGAGAC
R:GTATGTGTTGACAGCCTCCAGGTTC
acsl3aF:TCACCTTCCTGCCTTACCACCTC
R:CTCTTGGCTCGCTCCTCCTCTG
gkF:AACGCCAGGAAGGAATAAGAACCAC
R:TCCATCAGCCAGCGAAGTTTCAC
CBFF:CGGCTTGGTACTGGCACAGAATC
R:AGCAGCATCCATGTCCACTCAAAG
hspa4aF:GCCCTTCACCCTTGATGCTTACTAC
R:GACGCCTGAGGAACCACATTCTG
dnajaF:GGAAGAGGCGTACAAGTCAAGGTG
R:GTCCCTGGCAGTCTGAACACATG
sesn4F:CACATAACACGACGACGGTCTCTG
R:TTCTCTCTTCTCACGCTCCTCCTG
gapdhsF:GGCATCTCCCTCAACGACAACTTC
R:GTACATCAGCAGGTCAGCGACAC
hsp90b1F:GAAGACTGTGTGGGATTGGGAACTG
R:ACTCATCCTCCTCAACCTCCTTAGC
atg1F:CATCGTGTCGCCCTACTCTTTAGC
R:TGTCACTGTCCTCCGCTCTGTC
Table 2. Quality control statistics of sequencing data.
SampleClean ReadsClean BasesQ20Q30GC pctMapped ReadsMapped Ratio
M0-120418646611012708098.52%95.37%52.15%1795012887.91%
M0-220870180624432871298.39%95.05%51.85%1827373587.56%
M0-323491560702997841498.42%95.13%52.32%2077901888.45%
M6-121792688651795958298.35%95.02%52.06%1901443087.25%
M6-224179882723839482498.56%95.51%52.06%2168727689.69%
M6-322025406659717222698.51%95.36%52.11%1965915389.26%
M12-125662854767795344898.52%95.35%52.44%2291882789.31%
M12-221675610648816466098.50%95.33%52.92%1935798689.31%
M12-321820189653543044898.42%95.11%52.27%1951947889.46%
M24-120407423611304899298.36%94.91%52.45%1810215588.70%
M24-221918055656316664298.48%95.26%52.17%1951448589.03%
M24-320115769601193651098.46%95.23%51.77%1752166687.10%
Disclaimer/Publisher’s Note: The statements, opinions and data contained in all publications are solely those of the individual author(s) and contributor(s) and not of MDPI and/or the editor(s). MDPI and/or the editor(s) disclaim responsibility for any injury to people or property resulting from any ideas, methods, instructions or products referred to in the content.

