Article

Asparagopsis taxiformis Feed Supplementation as a Tool to Improve the Resilience of Farmed Diplodus sargus to Marine Heatwave Events—A Metabolomics Approach

1
CIIMAR—Interdisciplinary Centre of Marine and Environmental Research, University of Porto, Terminal de Cruzeiros do Porto de Leixões, Avenida General Norton de Matos S/N, 4450-208 Matosinhos, Portugal
2
UCIBIO—Applied Molecular Biosciences Unit, Department of Chemistry, NOVA School of Science and Technology, NOVA University of Lisbon, 2829-516 Caparica, Portugal
3
IPMA DivAV—Division of Aquaculture, Upgrading and Bioprospection, Portuguese Institute for the Sea and Atmosphere, Avenida Doutor Alfredo Magalhães Ramalho, 6, 1495-165 Algés, Portugal
4
Plant Metabolomics Lab Portugal, 1349-017 Lisboa, Portugal
5
Forest Research Centre, Associate Laboratory TERRA, School of Agriculture, University of Lisbon, Tapada da Ajuda, 1349-017 Lisboa, Portugal
6
iBET—Instituto de Biologia Experimental e Tecnológica, Apartado 12, 2781-901 Oeiras, Portugal
7
Associate Laboratory i4HB—Institute for Health and Bioeconomy, NOVA School of Science and Technology, NOVA University of Lisbon, 2829-516 Caparica, Portugal
*
Author to whom correspondence should be addressed.
Fishes 2025, 10(7), 350; https://doi.org/10.3390/fishes10070350
Submission received: 13 June 2025 / Revised: 4 July 2025 / Accepted: 8 July 2025 / Published: 15 July 2025
(This article belongs to the Special Issue Advances in Aquaculture Feed Additives)

Abstract

The need to maximize aquaculture production while addressing environmental and food security challenges posed by climate change has driven research towards the development of functional aquafeeds that enhance performance and immunity in farmed species. However, exposure to dietary and environmental stressors affects marine organisms, altering key metabolic pathways best understood through high-throughput “omics” tools. This study assessed the effects of Asparagopsis taxiformis supplementation on central metabolic pathways by analyzing changes in primary metabolite levels in the liver of farmed Diplodus sargus under optimal and suboptimal temperature conditions. Results showed that seaweed supplementation had a beneficial effect on the fish’s primary metabolome; however, inclusion levels and rearing conditions played a crucial role in determining outcomes. While 1.5% supplementation maintained a balanced primary metabolome under optimal temperature conditions, 3.0% supplementation most effectively mitigated the adverse effects of acute thermal stress during a marine heatwave. These findings highlight the nutritive and functional potential of A. taxiformis supplementation in aquafeeds for marine omnivorous fish species and emphasize the importance of evaluating functional aquafeeds under suboptimal rearing conditions. Overall, our results demonstrate the value of metabolomics in elucidating the molecular basis underlying biological pathways in farmed marine fish and optimizing production through climate-smart dietary strategies.
Key Contribution: Seaweed supplementation and metabolic reprogramming are crucial for the survival of farmed fish during heat stress. Inclusion percentages and rearing conditions play a crucial role in the development of climate-smart feeds.

Graphical Abstract

1. Introduction

Aquaculture’s fast expansion and contribution to global seafood production in the last decades are widely recognized. Currently, more than 300 different finfish species are farmed worldwide [1], each with distinct ecological traits, feeding patterns, and nutritional requirements that must be carefully addressed to maximize productivity. Hence, over the last years, fish nutrition has become one of the most investigated areas in aquaculture, with one of the primary focus being the nutritional value, safety (to both farmed species and consumers) and functionality (in terms of animal growth, performance, immunocompetence and resilience to stress) of aquafeed ingredients [2,3,4]. In parallel, the limited availability and recent surge in prices of raw materials traditionally used as ingredients in fish feed, either from animal (i.e., fishmeals and oils extracted from wild pelagic species) or plant (cereals and vegetable oils) origins, has rushed the aquaculture industry to find alternative ingredients from sustainable sources in a sort of “hunt for gold”. In this sense, marine macroalgae have been recently placed in the spotlight, as this group is a rich source of essential nutrients and bioactive compounds [5,6]. Seaweeds’ reported beneficial effects on farmed fish include the improvement of growth performance and physiological state (e.g., lipid metabolism) [7,8,9], modulation of metabolic rates [10,11], immunostimulatory effects [10,12], genoprotection [13], and enhancement of antimicrobial [14,15,16,17] and antioxidant [10,12,18] responses. Still, many questions remain unanswered regarding the use of seaweeds in aquafeeds. Key uncertainties include the metabolic and nutrient conversion implications, optimal inclusion levels to achieve beneficial outcomes, and the impact of dietary modulation on product nutritional value and safety [9,19,20], all of which hamper the acceptance of these plant-based ingredients by aquafeed and fish producers.
In addition, nowadays, it has also become imperative to validate the effectiveness of any dietary modulation strategy under suboptimal animal rearing conditions, as farmed marine fish are increasingly exposed to sudden and severe environmental shifts caused by extreme weather events linked to climate change, such as marine heatwave (MHW) events [21]. Hobday et al. [22] defined an MHW event as “a prolonged discrete anomalously warm water event that can be described by its duration, intensity, rate of evolution, and spatial extent”. MHW events are increasing in number, intensity, and duration worldwide, particularly in the Mediterranean region, affecting inshore and offshore aquaculture facilities, and thus, strongly defying farmed species’ physiological tolerance [23,24]. Despite the various uncertainties regarding the effects of MHWs in marine organisms/ecosystems, it is fairly well known that these events have devastating impacts on farmed species, making them particularly vulnerable to the various stress factors related to captivity (e.g., stocking density, disease outbreaks, malnutrition) that, in turn, often culminates in massive animal mortality and significant economic losses [25]. Hence, this urgently calls for climate-smart adaptation strategies that can build resilience against the present and future environmental challenges faced by the aquaculture sector. As such, eco-friendly nutritionally based approaches that maximize farmed animals’ growth and welfare under suboptimal rearing conditions represent a valuable opportunity for the sector.
Either to validate the use of a certain ingredient/formula or to assess the metabolic mechanisms underpinning farmed species responses to environmental stressors, growth trials (e.g., performance, feed conversion [26]), biochemical (e.g., body composition, physiological biomarkers [12]) and aerobic scope [27] data are typically the common approaches. However, when a given nutritional strategy is unable to meet fish metabolic requirements, a physiological unbalance occurs, triggering a myriad of cascading effects (at developmental, growth, reproductive, and immune levels, and including gene regulation and the production of numerous metabolites [28,29,30]) that cannot be fully understood through the analysis of conventional zootechnical parameters. As such, metabolomics is a “systems wide” molecular approach that has recently gained attention in aquaculture research [31]. Metabolomics is as a well-established “omics” tool concerned with the study of the organism’s physiological state at the metabolite level by offering means to obtain a comprehensive view of the changes in the levels of numerous low-molecular-weight endogenous metabolites simultaneously (e.g., lipids, sugars, amino acids, organic acids) as well as an holistic view of organisms’ physiological state taking into account the interactions between genetic traits and environmental factors (e.g., dietary changes and/or stressors exposure [32,33]). Often described as the “molecular phenotype” of living organisms [34,35], metabolites are products of cellular processes, and in comparative experiments, metabolomics analyses define significance by the relative changes in metabolite levels that can reveal the integrated response of a given organism. However, metabolomics applications in modern aquaculture research remain relatively recent and are still largely confined to studies in livestock [36,37,38,39,40,41].
In metabolomics analysis, gas chromatography time-of-flight mass spectrometry (GC-TOF-MS) primary metabolite profiling platform can be used for a broad coverage of the primary metabolome, being considered the “gold standard” for the analysis of primary metabolites. GC-TOF-MS offers high chromatographic resolution, reproducibility, and informative fragmentation patterns, making it especially suitable for the analysis of small and polar primary metabolites [42].
In this setting, the current study aims to assess, for the first time, whether metabolomics by means of GC-TOF-MS primary metabolite profiling provides additional functional insights into explaining the effects of dietary supplementation with the red macroalga Asparagopsis taxiformis on farmed juvenile Diplodus sargus primary metabolome, and to explore its effectiveness as a nutritional modulation strategy to overcome the thermal stress prompted by MHWs by highlighting functional central metabolic pathways and relative changes in primary metabolite levels, enhancing a more comprehensive view of these phenomena.

2. Materials and Methods

2.1. Ethical Statement

The present study was performed by researchers with certification in animal experimentation (EU functions A and B). All animal handling and sampling procedures were strictly in accordance with the ARRIVE (Animal Research: Reporting of In Vivo Experiments) guidelines and ethical standards for the care and use of animals were consistently followed. These practices were in line with the recommendations of the Federation of European Laboratory Animal Science Associations (FELASA) and complied with the Portuguese legislation on laboratory animal science (EU Directive 2010/63; Decree-Law No. 113/2013). The research was approved by IPMA’s Animal Welfare and Ethics Body (ORBEA; authorization number 001/2023, 2 November 2023), under the oversight of the National Authority for the use of live animals, also recognized as the Directorate-General for Food and Veterinary (DGAV).

2.2. Seaweed Collection and Experimental Diets

The seaExpert company harvested the gametophyte life stage of the invasive seaweed Asparagopsis taxiformis from rocky substrates at depths between 3 and 5 m through scuba diving in Angústias dock, Faial Island, Azores, Portugal (38°31′45.0′′ N 28°37′09.0′′ W). Subsequently, seaweeds were transported to the processing facility in a controlled environment, ensuring cool and dark conditions. Specially designed boards facilitated water drainage during transportation. To prepare seaweeds for further use, a Black Block solar dryer (BBKW, Lisboa, Portugal) was used, employing a dark setting, and maintaining at a maximum temperature of 40 °C for 2 days. Following the drying process, seaweeds were securely stored in pre-labeled dark plastic bags and sent to SPAROS Lda, a specialized company in Olhão, Portugal, focused on fish feed production. At SPAROS Lda, four distinct diets were meticulously formulated, considering the nutritional requirements of juvenile white seabream (Diplodus sargus) (detailed feed composition is reported in Marmelo et al. [43] and in Table 1). The diets shared similar nutritional compositions, with the key variation being the percentage of powdered dry seaweed incorporated at the expense of wheat meal. The red macroalga A. taxiformis was chosen as feed supplement as it has (i) relatively high protein content and structurally diverse bioactive compounds than the other taxonomic groups of macroalgae (i.e., brown and green macroalgae [44]); and (ii) a cosmopolitan distribution being, in some locations of the Southwestern Mediterranean Sea, undoubtedly invasive and outcompeting indigenous benthic organisms [45]. Thus, its incorporation in feeds may constitute a window of opportunity to mitigate its destructive effects on the ecosystem while being sustainable due to its high availability in the Mediterranean region. The formulated diets were as follows: (i) commercial control diet without seaweed supplementation (0%, CTR); (ii) diet supplemented with 1.5% A. taxiformis (1.5-AT); (iii) diet supplemented with 3.0% A. taxiformis (3.0-AT); and (iv) diet supplemented with 6.0% A. taxiformis (6.0-AT).

2.3. Organisms and Acclimation Period

The white seabream, Diplodus sargus (Linnaeus, 1758), was selected as a biological model because it is an ecologically relevant coastal species [46,47] and an emerging species for aquaculture with high sensitivity to drastic environmental variations, as well as one of the most important species for commercial and recreational fisheries in southern European countries and in the Mediterranean [48,49,50,51]. Specimens of D. sargus (n = 150; for the purposes of the present study, only 30 animals were used in total; i.e., the remaining fish were used in several analyses whose results are reported in other manuscripts of the authors, [43,52]) were reared at the Aquaculture Research Station of the Portuguese Institute for the Sea and Atmosphere (EPPO-IPMA, Olhão, Portugal) until they reached the juvenile stage (total length = 12.2 ± 0.3 cm and weight = 28.5 ± 1.1 g; mean ± standard deviation) in recirculation aquaculture system (RAS), under the following abiotic conditions: (i) temperature: 24.0 ± 0.5 °C; (ii) dissolved oxygen: 7.2 ± 0.2 mg L−1; (iii) salinity: 35.0 ± 0.5 psu; (iv) pH: 8.0 ± 0.1 units; and (v) photoperiod: 12 h light/12 h dark. Specimens were transported to IPMA’s Live Marine Organisms Bioterium (LABVIVOS) in Algés, Portugal. Upon arrival, juvenile fish were distributed into two tanks (660 L total capacity each) for a 3-week quarantine period, during which they were maintained in similar abiotic conditions as those previously described. Throughout the quarantine period, juvenile fish were fed a high-quality commercial diet (control) twice a day, an amount of feed equivalent to 1.5% of their average body weight (bw).

2.4. Experimental Design and Fish Rearing Conditions

For the purposes of the marine heatwave (MHW) event simulation, the average conditions (i.e., peak temperature, ramp temperature rise rate, duration of “plateau” phase at peak temperature) of a MHW category II “Strong” were used as a reference in the experimental design, as this corresponds to the most typically observed scenario in the Mediterranean environment [23], where D. sargus is grown in aquaculture. The other MHW categories include category I “Moderate”; category III “Severe”; and category IV “Extreme” [23].
The trial involved two phases (see Figure A1): Phase 1—Supplementation period for 30 days, during which fish were kept at the optimal temperature of 24 °C (T30); and Phase 2—Marine Heatwave simulation, during which fish were exposed to a category II Mediterranean heatwave, including a ramp temperature increase period of 8 days (+0.5 °C/day) up to 28 °C [53], followed by a 15-day period of exposure to the peak temperature (i.e., 28 °C). After the 3-week quarantine period, D. sargus specimens were randomly and equitably distributed in 15 rectangular experimental glass tanks (200 L total capacity each), with independent RAS. Information regarding the RAS system equipment and functioning is described in detail in Marmelo et al. [43]. Seawater abiotic parameters were adjusted as necessary, with dissolved oxygen maintained at 7.2 ± 0.2 mg L−1, salinity at 35.0 ± 0.5 psu, pH at 8.0 ± 0.1 units, and photoperiod of 12 h light and 12 h dark (12 L:12 D). Ammonia (NH3/NH4+), nitrites (NO2-) and nitrates (NO3) levels were measured on a weekly basis using colorimetric test kits (Salifert, The Netherlands) and maintained below detectable levels (except for nitrates that were kept < 50 mg L−1), by daily water renewals of 25% in each tank.
Five treatments were assigned (each composed by three replicate tanks, Figure A1): (i) Control (CTR)-fish fed with non-supplemented/commercial diet while being exposed to optimal temperature conditions; i.e., 24 °C during the entire trial (53 days in total); (ii) Control+Heatwave (CTR+HW)-fish fed with non-supplemented/commercial diet, and exposed to a category II Mediterranean MHW after a 30-day supplementation period; (iii) 1.5% of A. taxiformis+Heatwave (1.5-AT-HW)-fish fed with the commercial diet supplemented with 1.5% of dried A. taxiformis, and exposed to a category II Mediterranean MHW after a 30-day supplementation period; (iv) 3.0% of A. taxiformis+Heatwave (3.0-AT-HW)-fish fed with the commercial diet supplemented with 3.0% of dried A. taxiformis, and exposed to a category II Mediterranean MHW after a 30-day supplementation period; and (v) 6.0% of A. taxiformis+Heatwave (6.0-AT-HW)-fish fed with the commercial diet supplemented with 6.0% of dried A. taxiformis, and exposed to a category II Mediterranean MHW after a 30-day supplementation period.
On Phase 1 of the trial (Supplementation period), fish were hand-fed twice daily (2.0% bw) with the respective aquafeed in each treatment, while being exposed to 24 °C for 30 consecutive days (Figure A1). Then, on Phase 2 of the trial, a category II (strong) MHW was simulated in all treatments except for the CTR treatment. Seawater temperature was maintained at the peak level of 28 °C for 15 days in a row (corresponding to the heatwave “plateau”; Appendix A, Figure A1). No animal mortality was observed throughout both phases of the trial.

2.5. Fish Sampling

Samplings were conducted after each phase of the trial: Phase 1 (Supplementation period)-T30; i.e., after a 30-day feeding trial (and before the heatwave was simulated); and Phase 2 (Marine Heatwave simulation)-T53; i.e., after 15 days of exposure to the peak marine heatwave temperature (corresponding to 53 days of trial in total; Figure A1).
Fish were fasted for 24 h prior to sampling. Three fish per treatment (i.e., one fish from each replicate tank) were randomly collected and anesthetized by immersion in an overdosed tricaine methanesulfonate solution (2 g L−1 of MS-222, Acros Organics, Geel, Belgium), buffered with sodium bicarbonate (NaHCO3, Sigma-Aldrich, St. Louis, MO, USA), using a ratio of 1:2 of MS-222/sodium bicarbonate to reduce fish stress. Once the anesthetic took effect, fish death was confirmed by cervical cut, and the animals were then dissected. Fish liver was collected, placed in 2 mL tubes, and immediately frozen in liquid nitrogen. Liver samples were freeze-dried at −40 °C and 0.06 mbar for 48 h, weighed, and stored at −80 °C until further analyses.

2.6. Extraction of Primary Metabolites from D. sargus Liver Tissues

Primary metabolites were extracted following a previously described method [54] from 25 to 28 mg dry weight (DW) of finely homogenized D. sargus liver tissues (three biological replicates per treatment) in 700 µL ice-cold methanol (HPLC-grade; Merck, Lisbon, Portugal) containing ribitol as internal standard (0.2 mg mL−1 ribitol in water; Sigma-Aldrich, St. Louis, MO, USA). Samples were vortex-mixed and incubated in a shaker (ThermoMixer, Eppendorf, Hamburg, Germany) for 15 min at 70 °C and 950 rpm and, subsequently, centrifuged at 12,000× g for 10 min. The supernatant was collected, mixed with 370 µL chloroform (Merck) and 750 µL water (HPLC-grade; Merck), and mixed with a vortex. After centrifugation at 2200× g for 15 min, an aliquot of 150 µL of the polar (aqueous/methanol) phase was evaporated to dryness for 3 h at 30 °C using a centrifugal concentrator (Concentrator Plus, Eppendorf, Hamburg, Germany), and stored at −80 °C prior to derivatization and GC-TOF-MS analysis.

2.7. GC-TOF-MS Primary Metabolite Profiling Analysis

Dried polar extracts were derivatized following the Lisec et al. [54] protocol with 40 µL of 20 mg mL−1 methoxyamine hydrochloride (Sigma-Aldrich, St. Louis, MO, USA) in pure pyridine (Merck S.A., Lisbon Portugal), vortex-mixed, and incubated in a shaker (ThermoMixer, Eppendorf, Hamburg, Germany) for 2 h at 37 °C and 950 rpm. Subsequently, 70 µL of N-methyl-N-trimethylsilyltrifluoroacetamide (MSTFA reagent for TMS derivatization; Macherey-Nagel) and 20 µL mL−1 of a mixture of fatty acid methyl esters (FAMES) were added. Sample mixtures were vortex-mixed and, subsequently, incubated in a shaker (ThermoMixer, Eppendorf, Hamburg, Germany) for 30 min at 37 °C and 950 rpm. Biological variations were controlled by analyzing quality control (QC) standards by FAMES internal standard markers and a QC standard solution of 41 pure reference compounds (i.e., the most detected and abundant metabolites) throughout the analysis. Primary metabolite profiling analysis of the derivatized samples (1 µL injection) was performed on an Agilent 6890 N gas chromatograph (Agilent Technologies, Böblingen, Germany) coupled to a LECO Pegasus III TOF-MS running in electron ionization (EI) mode (LECO Instrumente, Mönchengladbach, Germany). The chromatographic separation was performed on a VF-5MS column (Varian Inc., Palo Alto, CA, USA; 30 m length, 0.25 mm inner diameter, and 0.25 mm film thickness). The temperature program was set as follows: isothermal for 2 min at 85 °C, followed by a 15 °C min−1 ramp to 360 °C, and hold at this temperature for 6 min. The injector and transfer line temperatures were set to 230 °C and 250 °C, respectively, and the helium carrier gas flow was set to 2 mL min−1. After a solvent delay of 180 s, mass spectra were scanned from m/z 70 to 600 with an acquisition rate of 20 spectra s−1 and a detector voltage between 1700 and 1850 V.

2.8. Metabolite Data Processing and Statistical Analysis

GC-TOF-MS data were evaluated using AMDIS (Automated Mass Spectral Deconvolution and Identification System) software (version 2.71). Primary metabolites were annotated using the TagFinder 4.0 software [55] and a reference library of ambient mass spectra and retention indices from the Golm Metabolome Database [56,57]. The relative abundance of primary metabolite levels was normalized to the signal intensity of the internal standard (ribitol) and the DW of the samples (see Table S1). Metabolomics statistical analyses were performed in R Studio software (version 1.3-3; MA, USA) [58] using the “agricolae” [59], “gplots” [60], and “mixOmics” [61] packages. One-way ANOVA at a 95% confidence level was used to assess differences between treatments. Subsequently, fold changes were determined and log10-transformed for heatmap plotting. Supervised partial least squares discriminant analysis (PLS-DA) was performed using the leave-one-out cross-validation embedded in the “mixOmics” package. Supplementary Tables S2 and S3 present the VIP scores for each PLS-DA analysis, indicating the relative importance of each metabolite in discriminating between the classes.

3. Results

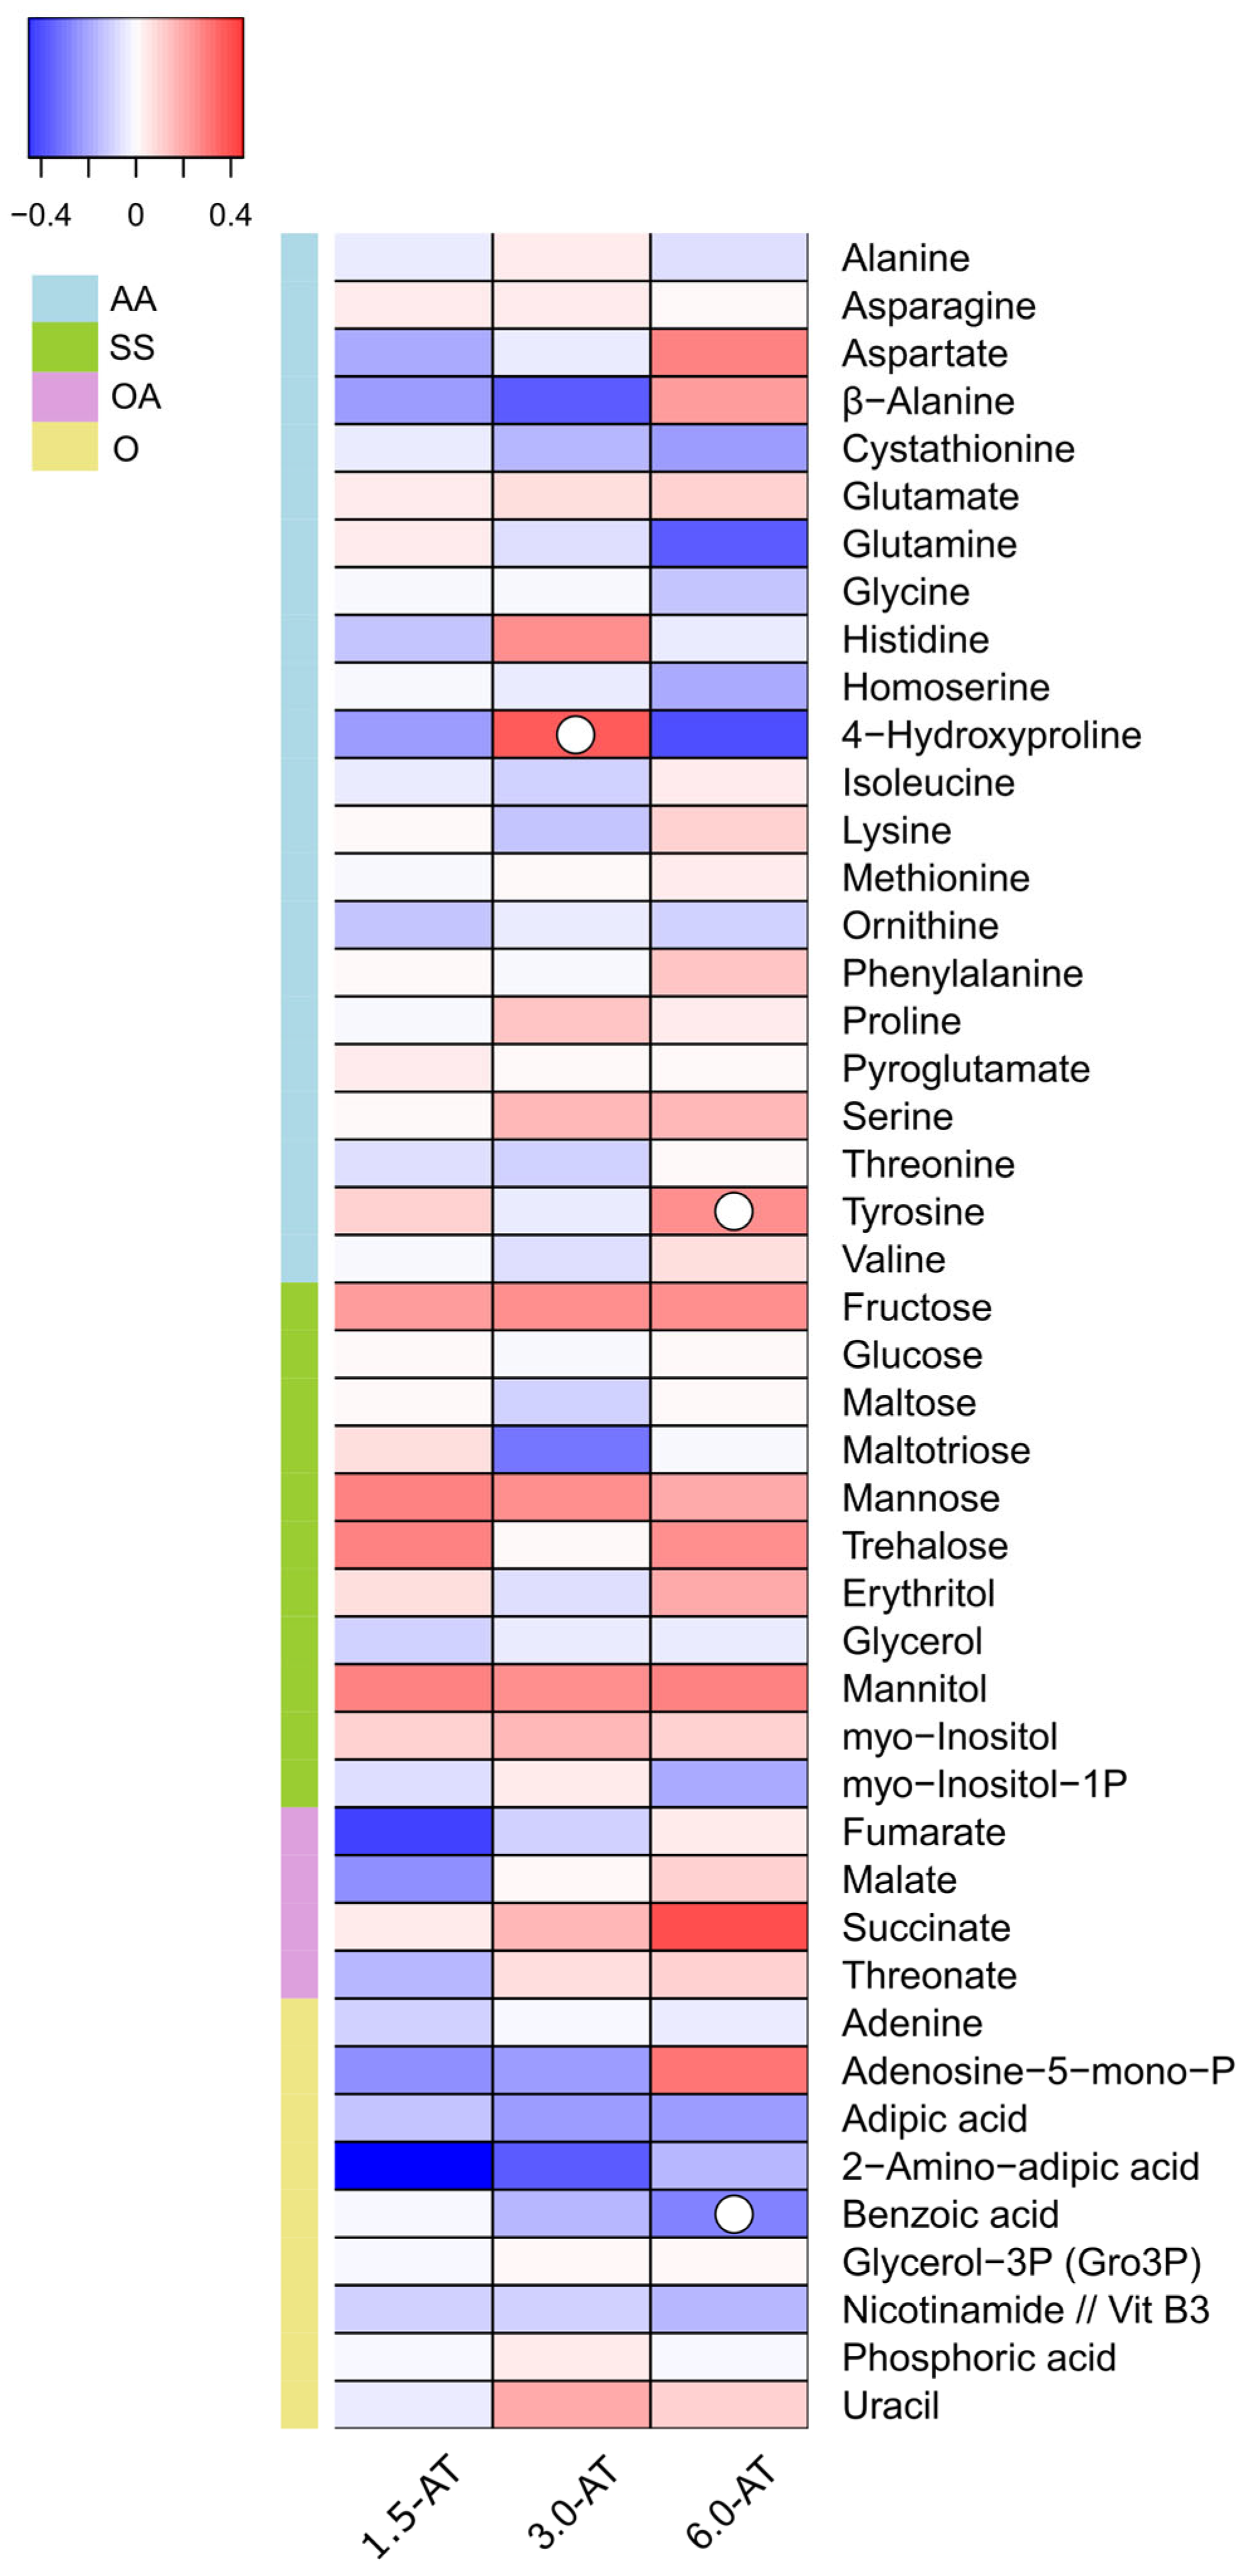
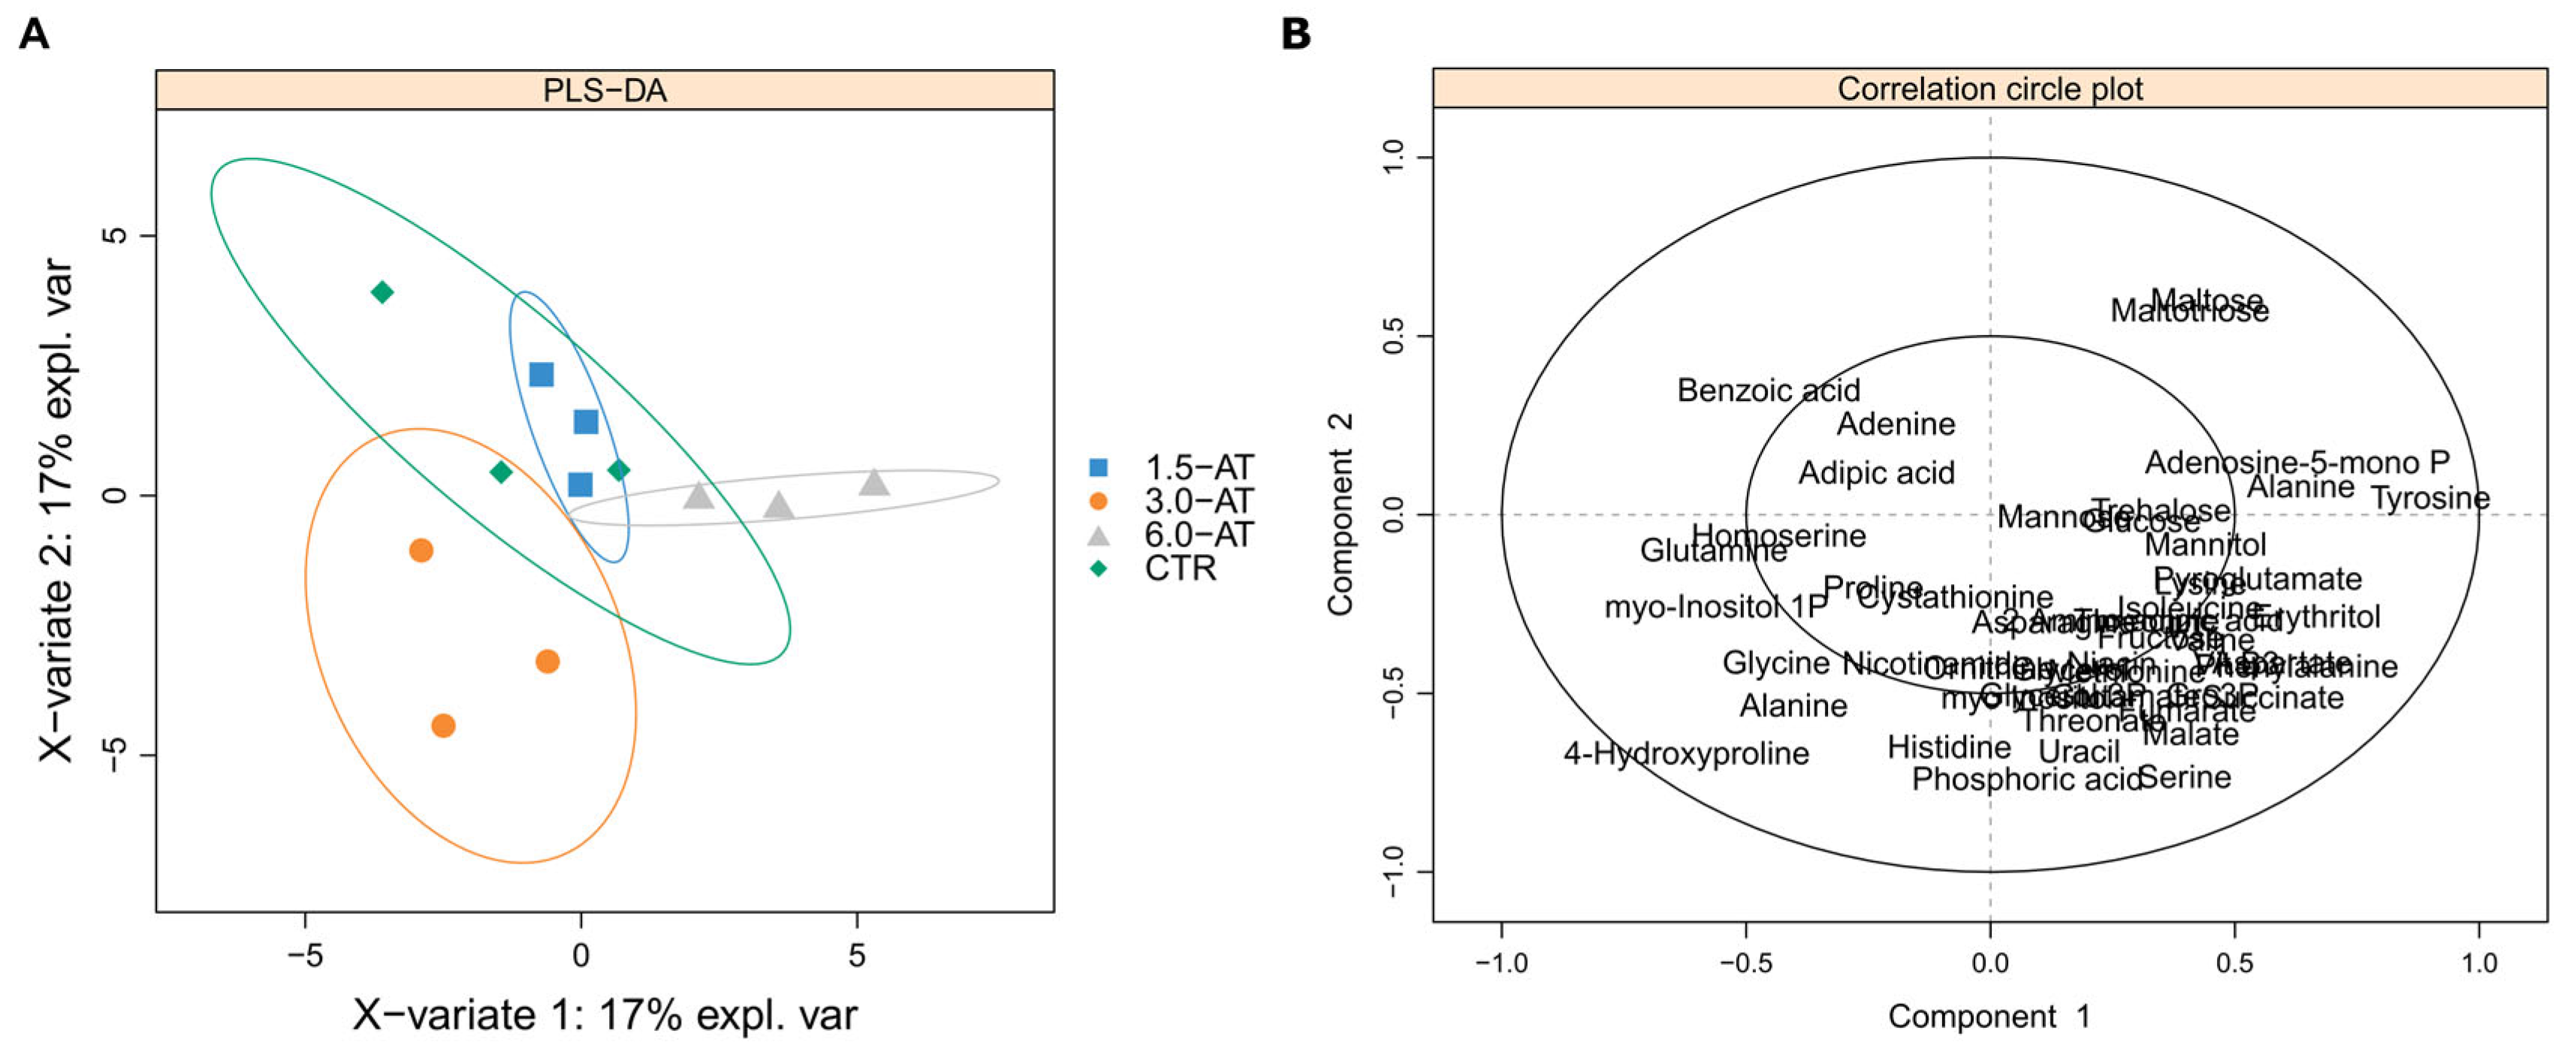
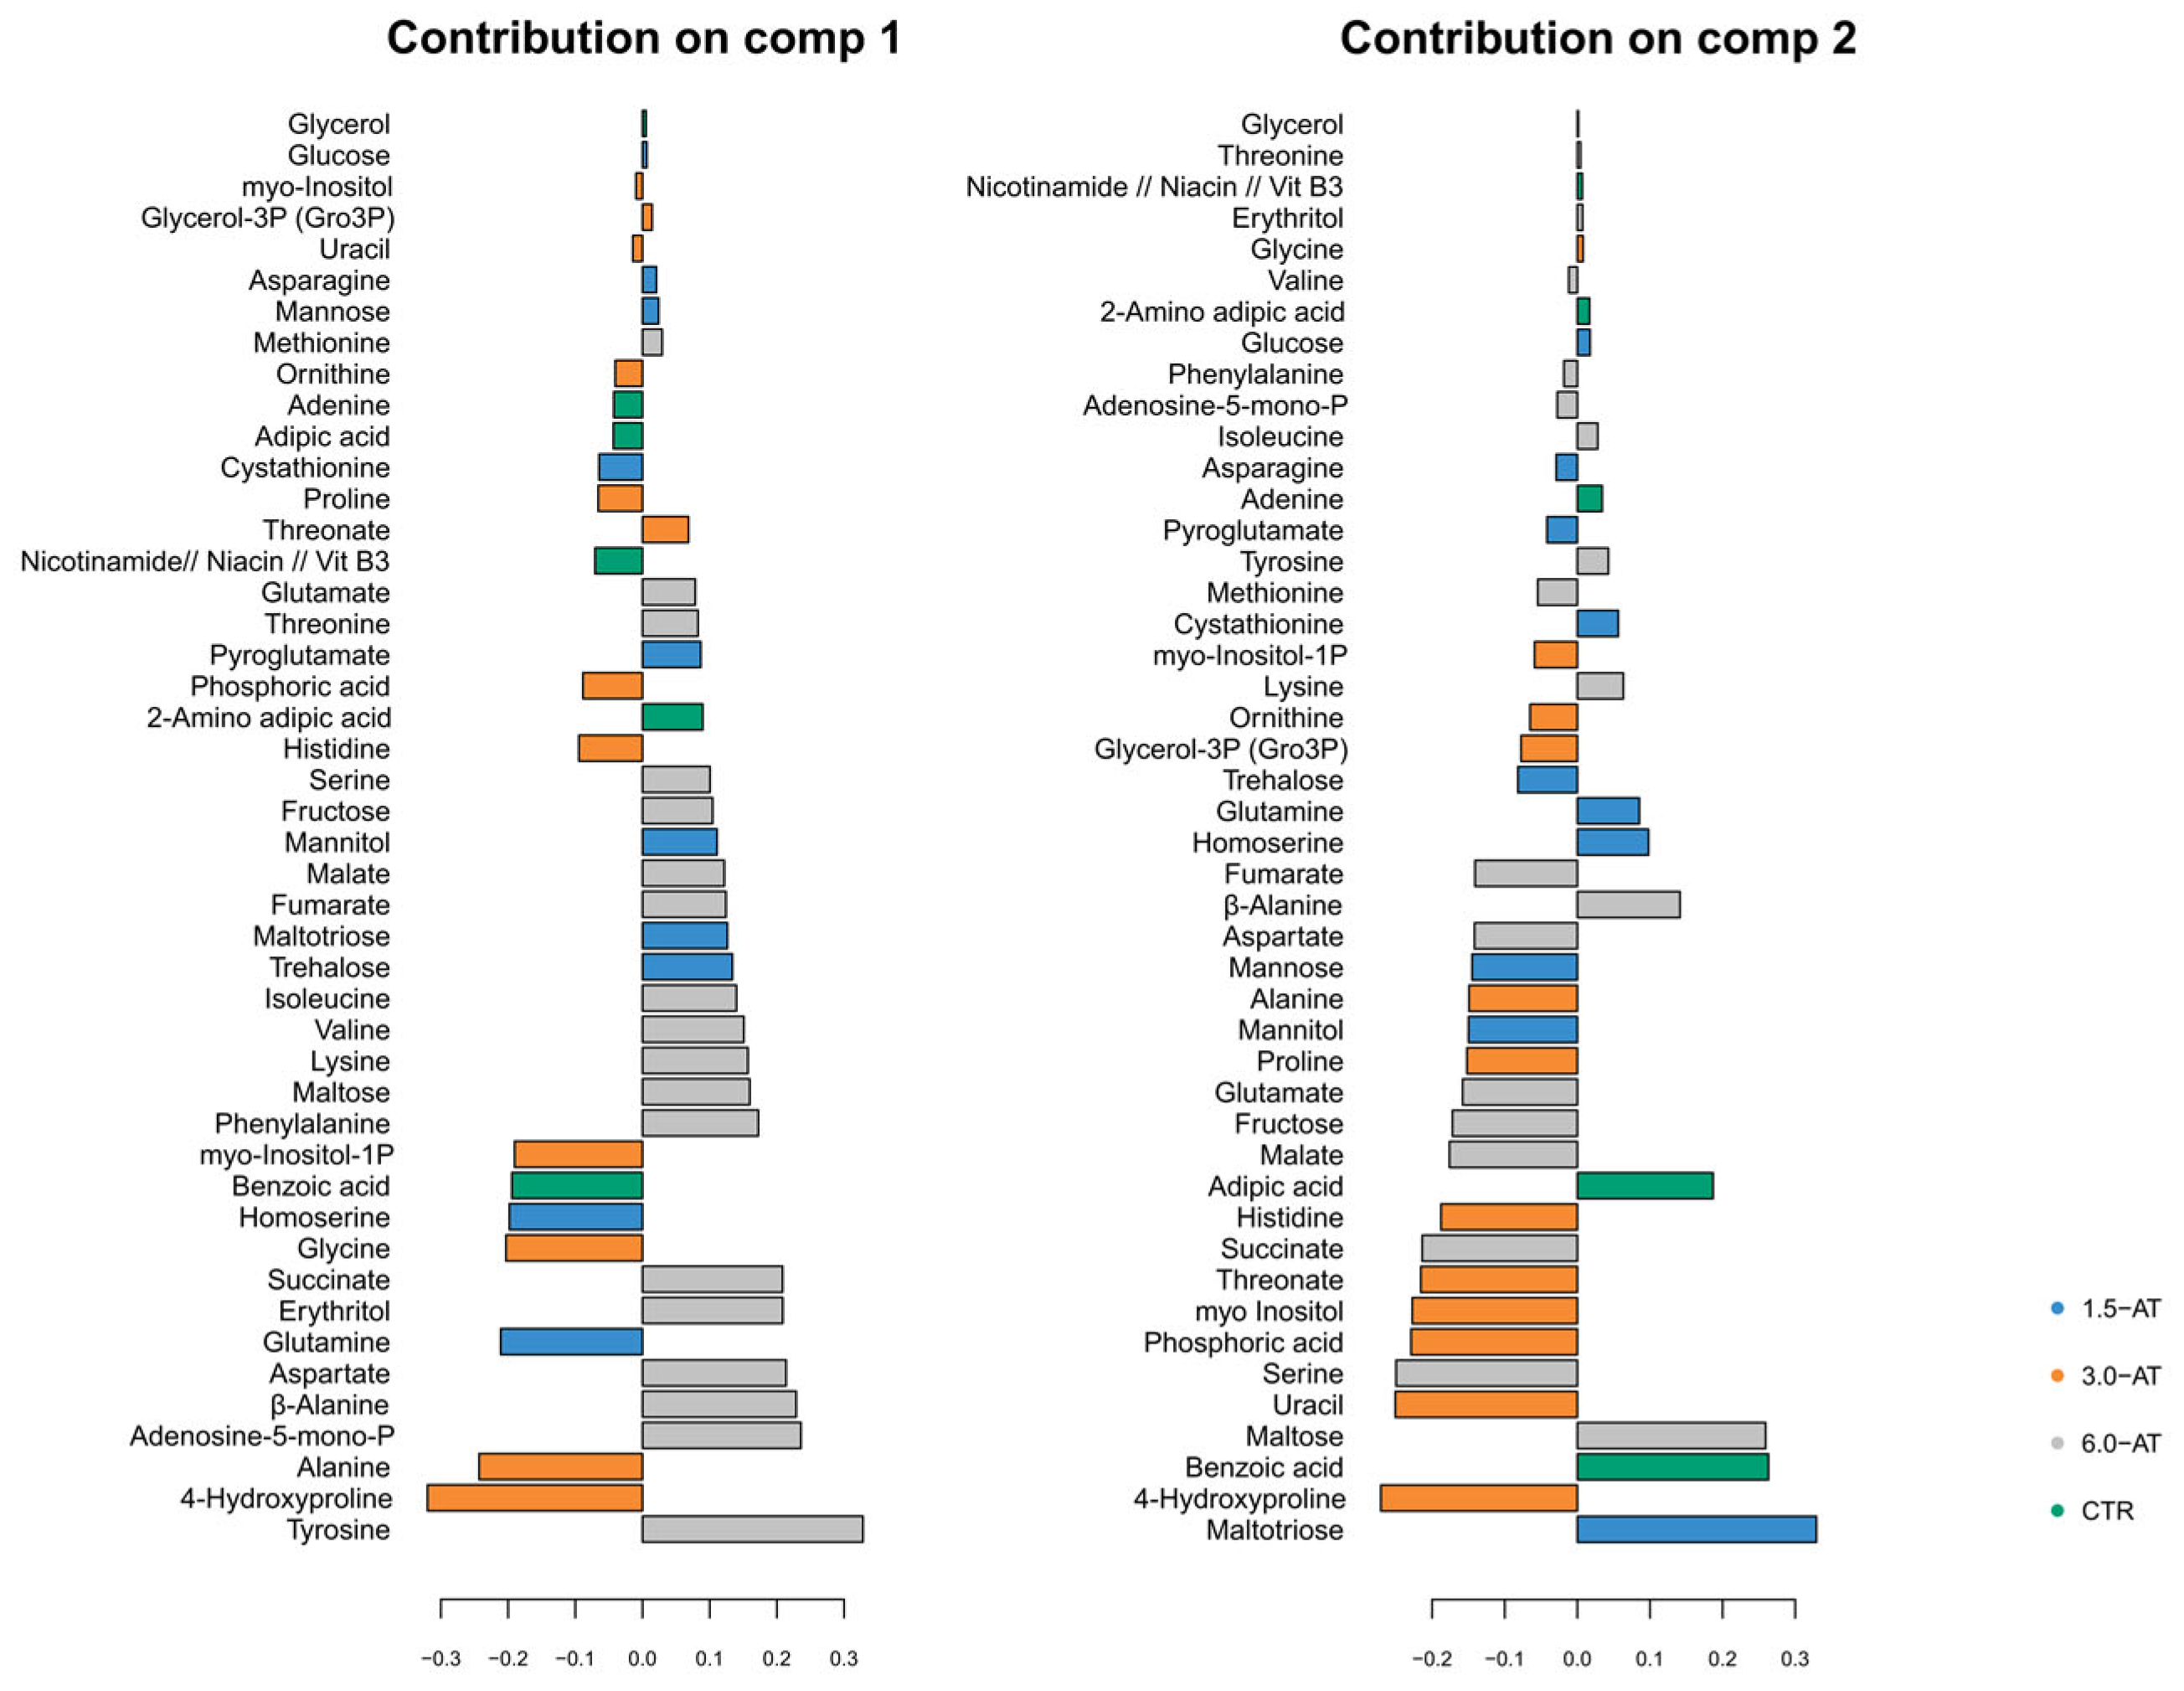
3.1. GC-TOF-MS Primary Metabolite Profiling of Diplodus Sargus Liver Tissues When Supplemented with A. taxiformis

The analysis of fish liver metabolome through GC-TOF-MS allowed us to identify 46 primary metabolites under both optimal and suboptimal growth conditions, including 22 amino acids (AAs) and derivatives, 11 sugars and sugar alcohols, four organic acids, and nine other metabolites.
Primary metabolite profiling revealed that, at optimal growth conditions (Phase 1: 24 °C–T30), liver tissues of supplemented fish were mainly characterized by an increase in the levels of most AAs, sugars, and organic acids, particularly at 3.0-AT and 6.0-AT. Among these, a significant increase in the levels of both the AAs 4-Hydroxiproline (up to 2-fold) at 3.0-AT and tyrosine (up to 1.5-fold) at 6.0-AT was observed (Figure 1, Table S4).
Central metabolic pathways representing the changes in the relative levels of primary metabolites in the liver tissues of D. sargus grown under optimal conditions are represented in Figure S1. In Phase 1, PLS-DA analysis revealed that, while the sample groups corresponding to the 3.0-AT and 6.0-AT were clearly discriminated, CTR and the 1.5-AT sample groups were clustered together (Figure 2A). The correlation circle plot (Figure 2B) identifies the metabolites most responsible for the separation between sample groups. In more detail, the contribution plots (Figure 3) show that among those metabolites, 4-hydroxyproline (which significantly increased, up to 2-fold), alanine, glycine, myo-inositol-1-phosphate (component 1), and uracil, phosphoric acid and myo-inositol (component 2) contributed the most to the discrimination within the 3.0-AT sample group. Tyrosine (which significantly increased, up to 1.5-fold), adenosine-5-mono-phosphate, β-alanine, aspartate, erythritol, succinate, phenylalanine (component 1), and maltose, serine, succinate, malate, and fructose (component 2) contributed the most to the discrimination within the 6.0-AT sample group.

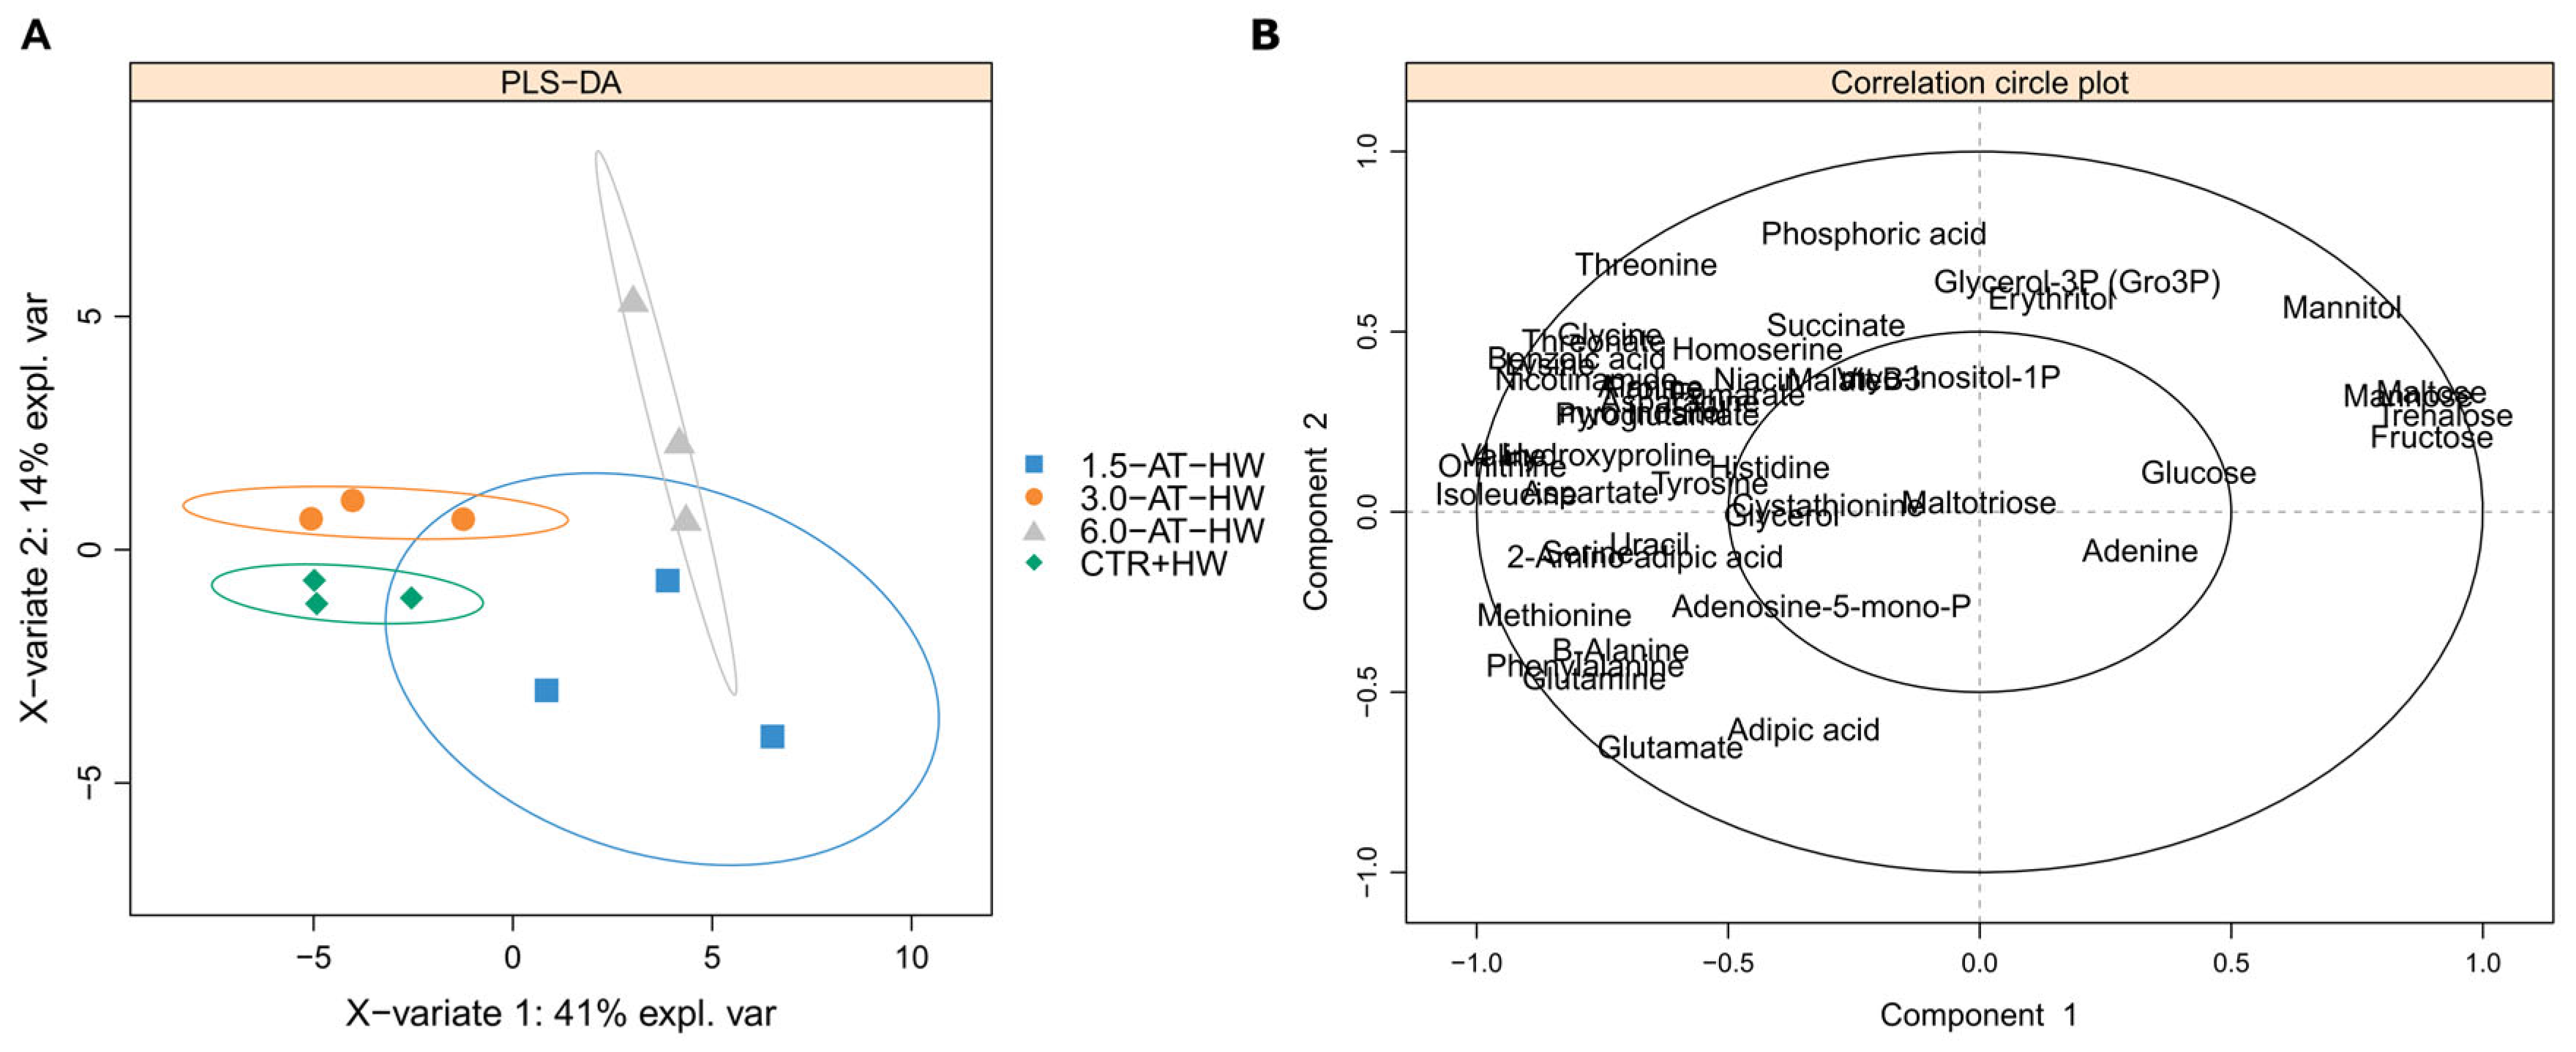
3.2. GC-TOF-MS Primary Metabolite Profiling of Diplodus Sargus Liver Tissues When Exposed to the MHW

During Phase 2 of the study, the effect of increased seawater temperature was assessed in non-supplemented and supplemented fish. Starting with the effect of seawater temperature conditions alone (i.e., supplementation comparisons between CTR and CTR+HW), a general increase in the levels of AAs (glutamine, ornithine, pyroglutamate, and serine, up to 2.6-fold), organic acids (threonate; 2-fold increase), in a sugar alcohol (polyol myo-inositol; 1.8-fold increase), and other metabolites (adenine and nicotinamide; 3-fold and 1.3-fold increase, respectively), as well as a decrease in the levels of some sugars (maltose and trehalose, down to 1.0-fold) was observed in fish exposed to the MHW in relation to those reared under optimal conditions (Figure 4A and Figure S2; Table S5A).
As for the effect of the MHW upon supplementation with A. taxiformis (i.e., comparing CTR+HW against 1.5-AT-HW, 3.0-AT-HW, and 6.0-AT-HW treatments), a higher number of significant changes in most primary metabolite levels was, overall, found in supplemented animals with central metabolic pathways of D. sargus revealing marked differences in the levels of AAs, as well as in carbohydrate metabolism (Figure S3). While the levels of most AAs significantly decreased at 1.5-AT-HW and 6.0-AT-HW, 6.0-AT-HW showed an increased in the levels of most sugars (Figure 4B), namely, fructose (up to 4-fold), maltose (up to 37-fold), mannose (up to 8-fold), trehalose (up to 28-fold), and the sugar alcohol mannitol (up to 3.5-fold) (Table S5B).
Interestingly, in 3.0-AT-HW treatment, only a few metabolites showed altered abundance under suboptimal conditions (Figure 4B); i.e., the AAs alanine, glutamine, and threonine significantly increased up to 1.5-fold (Table S5B), while the levels of other primary metabolites remained largely unchanged.
In Phase 2, PLS-DA analysis revealed clear discrimination between all sample groups (Figure 5A). The correlation circle plot (Figure 5B) identifies the key metabolites most responsible for discriminating between the different sample groups. Among those metabolites, the contribution plots did not highlight key metabolites that contributed the most to the discrimination of the 1.5-AT-HW treatment (Figure 6). However, the contribution plots highlight glutamine, which significantly increased up to 1.5-fold, lysine, proline (component 1), threonine, which also significantly increased up to 1.5-fold, and glycerol-3-phosphate (component 2) as the key metabolites that contributed the most for the discrimination of the 3.0-AT-HW treatment (Figure 6). The most relevant contribution to the cluster of the 6.0-AT-HW treatment was observed for those sugars whose levels were shown to significantly increase, namely, trehalose, fructose, maltose, mannose, and the sugar alcohol mannitol (component 1) (Table S5B), and phosphoric acid, mannitol, and succinate (component 2).

4. Discussion

4.1. Effects of A. taxiformis Supplementation on Fish Liver Primary Metabolome Under an Optimal Temperature Regime (CTR Versus 1.5-AT, 3.0-AT, and 6.0-AT)

Under optimal rearing conditions (i.e., 24 °C), supplementation with 1.5% of A. taxiformis did not significantly affect the primary metabolism of D. sargus. The absence of evident metabolic interferences, together with the maintenance of fish growth performance indicators (i.e., specific growth rate, SGR, and feed conversion ratio, FCR) and the improvement of antioxidant and immune responses reported in our previous studies [43,52] confirms that aquafeeds supplemented with low doses (i.e., 1.5%) of A. taxiformis provide a nutritionally balanced solution with beneficial functional outcomes.
Supplementation with higher levels of A. taxiformis (3.0% or 6.0%) led to notable changes in the primary metabolome of juvenile D. sargus, specifically increasing 4-hydroxyproline (4-Hyp; at 3.0%) and tyrosine (Tyr; at 6.0%). These AAs are not typically abundant in Asparagopsis spp. [62,63,64], and their presence may vary with the seaweed’s harvest location and season [65]. Both 4-Hyp and Tyr have recognized benefits in fish nutrition: 4-Hyp supports collagen synthesis and growth, while Tyr is a precursor for hormones and neurotransmitters involved in metabolism and stress response [66,67,68,69,70,71]. Both play important roles in stress mitigation, redox balance, and cell protection in fish [66,67,68,69,70,71,72,73,74,75]. Therefore, the increased levels of these AAs may help explain the improved antioxidant activity and reduced cell damage observed in fish fed higher doses of A. taxiformis. Hence, the significant increase in 4-Hyp and Tyr might partially explain the increased antioxidant scavenging activity and decreased cell damage in fish supplemented with high doses of A. taxiformis, as previously reported in our studies [43,52].
In parallel, a decrease in the levels of benzoic acid was also observed in fish supplemented with 6.0% of A. taxiformis, most likely, due to the reduction in wheat meal (a major source of this phenolic compound [76]) in these feeds required to guarantee an isoproteic and isolipidic diet. Given the involvement of benzoic acid in various biological pathways (growth, digestion efficiency, immune function, and gut health [77,78,79]), as well as its anti-bacterial and antifungal properties [80], the significant reduction in this compound in fish supplemented with 6.0% of A. taxiformis can be considered an adverse outcome.

4.2. Effects of MHW on Fish Liver Primary Metabolome (CTR Versus CTR+HW)

Heat stress can lead to a wide range of metabolic disruptions in fish species, including increased glycolysis and lipid oxidation, accumulation of stress-related molecules (e.g., reactive oxygen species and heat shock proteins), and shifts in the metabolism of AAs and fatty acids [81,82,83]. The present findings highlight that metabolite profiling offers relevant insights for the early detection and management of stress signs in farmed marine fish, therefore, potentially contributing to the prevention of animal mortality and associated economic losses that often result from extreme weather events, such as MHWs. The acute exposure to increased temperatures prompted by a simulated MHW induced significant changes in the levels of AAs, sugars and sugar alcohols, organic acids, and other primary metabolites. As observed in other studies, the significant increase in AAs (i.e., glutamine—Gln, ornithine—Orn, pyroglutamate—Pyr, and serine—Ser) in fish exposed to the MHW might be related to an enhancement of protein and AA catabolic events to fuel the metabolic reprogramming associated with elevated temperatures [84,85]. In our study, the significant increase in Gln following exposure to MHW may suggest that (i) ammonia generated from AAs catabolism could have accumulated in the fish body, and consequently, the levels of Gln increased in order to reduce ammonia’s toxicity, and/or (ii) a response to oxidative stress occurred, given that Gln is the precursor of glutathione (GSH [72]). Supporting our findings, Liu et al. [86] also observed a significant increase in hepatic Gln after juvenile lenok (Brachymystax lenok) exposure to thermal stress (ΔT = 8 °C for 7 days). Besides Gln, the levels of Orn also increased in response to MHW. Orn is a non-protein AA and an intermediate of the urea cycle [87]. The urea cycle is an endogenous source of arginine that also supports the removal of nitrogenous waste following protein metabolism [88]. Both Orn and urea are products of arginine breakdown by arginase in the fish liver [89]. The obtained Orn can be used to generate proline or polyamines (e.g., putrescine). The increase in Orn in D. sargus liver indicates that the fish needed to excrete nitrogenous waste resulting from protein and AA catabolism. Supporting our results, Jiang et al. [90] found significantly higher levels of Orn and Gln in the liver tissue of Qingtian paddy field carp (Cyprinus carpio var qingtianensis) after acute exposure to heat stress (ΔT = +10 °C for 24 h). Moreover, Pyr was significantly increased under MHW exposure. Pyr is an intermediary in the GSH biosynthesis pathway [91]. In this metabolic pathway, gamma-glutamylcysteine is converted to Pyr by ATP-dependent 5-oxoprolinase, which further converts Pyr into glutamate (Glu) and can restore GSH levels under oxidative stress conditions [91,92]. Thus, the increase in the levels of Pyr and no changes in Glu may indicate the inability to further proceed to GSH synthesis and concomitant oxidative stress and cellular damage. Once again, these results are in accordance with Pereira et al. [52] findings, as oxidative stress and cellular damage (i.e., increased CAT and GST activities, and LPO levels) were observed in non-supplemented fish after exposure to MHW. Alongside, MHW exposure led to an increase in Ser in D. sargus juveniles’ liver tissue. Ser participates in fat digestion and in the one-carbon metabolism pathway [93]. D-serine is related to fish locomotor activity induced by environmental stressors. Aguilar and colleagues [94] observed an increase in D-serine in zebrafish (Danio rerio) after chronic exposure to thermal stress (ΔT = +3.1 °C and +4.6 °C for 270 days). Moreover, it was demonstrated that exogenous Ser promotes the synthesis of GSH, which downregulates ROS to dampen immune responses [95]. Hence, an increase in Ser might be related to the upsurge in metabolism, and consequently, an increase in oxidative stress and locomotor activity.
Besides the increase in AAs, an increase in the levels of the polyol myo-inositol was also observed after exposure to heat stress. This can imply that the TCA cycle was weakened, given that myo-inositol inhibits the activity of succinate dehydrogenase and malate dehydrogenase [95]. This result is supported by Kim et al. [96], where an increase in myo-inositol was also observed in olive flounder (Paralichthys olivaceus) juveniles after exposure to heat stress (ΔT = +4 °C for 7 days). Threonate is an oxidized derivative of ascorbate (vitamin C) [97] and, thus, its increase at higher temperatures further reinforces the statement that heat stress resulted in oxidative stress. Both niacin (vitamin B3) and adenine (vitamin B4) levels were observed to increase at higher temperatures. Tian et al. [98] also observed a significant high abundance of vitamins (B6 and C) following rainbow trout (Oncorhynchus mykiss) chronic exposure to warmer temperatures (ΔT = +4 °C for 56 days), most likely as a result of the fish homeostasis maintenance process. The observed changes in carbohydrate levels elicited by MHW are likely due to increased cellular energy demands prompted by thermal and/or oxidative stress. Noteworthy, the significant decrease in the levels of the maltose and trehalose might have been compensated by the increase in Orn, Gln, and Ser, as these glucogenic AAs serve as important carbon sources for gluconeogenesis (review in Falco et al. [99]). For instance, Zhao et al. [100] stated that Gymnocypris chilianensis specimens can maintain their physiological state under high temperature stress by enhancing glucose metabolism and regulating lipid and AA metabolic pathways. Alongside, in a study on American shad (Alosa sapidissima), it was hypothesized that the metabolism of carbohydrates, proteins, and fatty acids was accelerated under heat stress to ensure sufficient energy allocation towards fish immune responses and homeostasis maintenance [101]. In the dynamic energy budget (DEB) theory presented by Kooijman et al. [102], a certain amount of energy assimilated by organisms is reserved for fast providing the extra energy demand during stress exposure, but this consumption for self-maintenance will compete with other energy provisions for reproduction, development, and growth. The depletion of energy-related compounds, such as sugars, might further affect the self-maintenance, growth, and development of D. sargus juveniles.

4.3. Influence of A. taxiformis Supplementation on Fish Metabolic Responses to MHW (CTR+HW Versus 1.5-AT-HW, 3.0-AT-HW, and 6.0-AT-HW)

Upon exposure to an MHW, supplementation with 3.0% of A. taxiformis did not trigger significant changes in D. sargus primary metabolome, compared to non-supplemented fish; i.e., CTR+HW, except for the increase in the levels of a few beneficial AAs (Ala, Gln, and Thr). Diets enriched with Gln have been reported to improve fish feed efficiency, enhance intestinal function, and bolster innate immune responses [103,104]. Moreover, Ala is used as a substrate for glycogen and/or glucose production in the liver but may also be oxidized in the liver and used as a direct energy source [105], while the key roles of Gln and Thr have been discussed above. Indeed, Pereira et al. [52] reported increased GST and superoxide dismutase (SOD) activity, as well as decreased LPO in the liver of fish from 3.0-AT-HW treatment, therefore, confirming that this level of seaweed inclusion renders a better animal physiological condition. In alignment with these findings, results from this study also show that this intermediate level of supplementation corresponds to a nutritionally balanced feed formulation that meets the higher metabolic requirements of fish exposed to acute thermal stress.
In contrast, the significant reduction in various primary metabolite levels in fish supplemented with 1.5% and 6.0% of A. taxiformis evidence that these feed formulations do not constitute an effective solution to counteract the negative effects prompted by MHWs. In 1.5-AT-HW treatment, a metabolic reprogramming related to stress occurred; i.e., a substantial decrease was observed in the levels of several AAs that play important roles in fish nutrition and metabolism (e.g., aspartate-Asp, 4-Hyp, lysine-Lys, threonine-Thr; [72]). These key roles include the following: (i) major glucogenic precursor and important energy substrate (Asp; [72]); (ii) growth, developmental regulation and reproduction (e.g., Hyp; [68,72]); and (iii) immune responses and gastrointestinal development (e.g., Lys and Thr; [106,107]).
Supplementation with 6.0% of A. taxiformis also resulted in the reduction in several AAs, including Glu, Gln, 4-Hyp, and methionine (Met). Glu, Gln, and Met are functional AAs; i.e., they participate and control vital metabolic pathways in fish associated with health, growth, development, reproduction, antioxidant defenses, and survival [108]. In fish, Gln plays an important role in nutrition and metabolism. It participates in cell signaling, growth and development regulation, immunity, ammonia detoxification, antioxidant defenses, gut development, and stress responses [109]. Regarding Met, it is a glucogenic AA that produces glucose as an energy source, thus having a key role in the one-carbon metabolism pathway [110,111]. Under Met-limiting conditions, an excess of branched chain AAs reduces Met oxidation that will adversely affect gluconeogenesis [110,111,112], being reported to decrease percent weight gain, feed efficiency, and feed intake [113,114,115] as well as deposition of muscle protein [116]. Moreover, previous studies have demonstrated the role of Met in enhancing the fish immune system [117,118,119] and its antioxidant potential [120,121]. In addition to the reduction in several AAs, supplementation with 6.0% of A. taxiformis also caused an increase in the levels of several sugars with important roles in fish metabolism (e.g., fructose, maltose, mannose, trehalose, and mannitol). This result may indicate protection against heat stress, as carbohydrates work as available energy reserves and precursors for the biosynthesis of AAs. Previous studies have already pointed out their beneficial effects in fish fitness; these include increased survival rate and serum resistance against bacterial infection at control and/or suboptimal rearing conditions, as well as alleviation of hepatic cholesterol accumulation [122,123,124,125]. The drastic changes in both AAs and sugars observed in D. sargus’s primary metabolome at 6.0-AT-HW treatment imply that the fish were not physiologically well prepared to deal with thermal stress.
Altogether, data reported in this study coupled to previous studies [43,52] evidence that the optimal, or most-effective, level of seaweed supplementation depends on both: (i) the intended physiological outcome (e.g., improvement of metabolic or nutrient conversion efficiency, immune stimulation, antioxidant capacity enhancement); and (ii) the surrounding environmental conditions (e.g., optimal versus suboptimal). Hence, these findings emphasize the need to address the challenges posed in contemporary aquaculture nutrition from a holistic perspective and to further invest in effective, tailor-made solutions that meet specific animal welfare goals, under specific production contexts.

5. Conclusions

The present study confirmed that (i) A. taxiformis supplementation at low (i.e., 1.5%; under optimal temperature conditions) or intermediate (i.e., 3.0%, under suboptimal temperature conditions) inclusion levels have a beneficial effect in juvenile D. sargus primary metabolome, leading to an increase in the levels of functional AAs, sugars and other primary metabolites; (ii) the thermal stress induced by MHWs results in a general shutdown of central metabolism leading to a reduction in the levels of key primary metabolites; and (iii) the negative outcomes elicited by a MHW can be partially mitigated with A. taxiformis supplementation at an intermediate level of inclusion (3.0%). Yet, it should be noticed that these findings can be limited to the magnitude and duration of the MHW event, as well as to the fish species and life stage.
Although incorporating seaweeds into aquafeed formulations is a promising strategy to enhance the resilience and economic feasibility of the aquaculture sector, the suitability of these eco-innovative diets should first be validated in different contexts (e.g., considering distinct species’ nutritional requirements and climate conditions of specific regions of the planet). Additionally, validation should follow holistic nutrigenomics approaches that assess animal responses at multiple levels of biological organization, including molecular, cellular, tissue, and whole-organism scales.

Supplementary Materials

The following supporting information can be downloaded at https://www.mdpi.com/article/10.3390/fishes10070350/s1, Figure S1: Central metabolic pathways representing the changes in the relative levels of primary metabolites in liver tissues of Diplodus sargus grown under optimal conditions and upon supplementation with Asparagopsis taxiformis; Figure S2: Central metabolic pathways representing the changes in the relative levels of primary metabolites in liver tissues of D. sargus grown under suboptimal temperature conditions; Figure S3: Central metabolic pathways representing the changes in the relative levels of primary metabolites in liver tissues of Diplodus sargus grown under suboptimal temperature conditions and upon supplementation with Asparagopsis taxiformis; Table S1: Normalized raw data (dry weight and internal standard ribitol) obtained in the present study; Table S2: VIP (Variable Importance in Projection) scores for each metabolite across the first and second components of the PLS-DA model, based on the analysis of the primary metabolite profile in fish liver tissues at Phase I; Table S3: VIP (Variable Importance in Projection) scores for each metabolite across the first and second components of the PLS-DA model, based on the analysis of the primary metabolite profile in fish liver tissues at Phase II; Table S4: Fold changes in relative levels of primary metabolites in fish liver tissues, in relation to the respective control (CTR) condition. Fish were kept at the optimal temperature of 24 °C (CTR) and fed a supplemented diet with 1.5, 3.0, and 6.0% Asparagopsis taxiformis for 30 days (1.5-AT, 3.0-AT, and 6.0-AT, respectively). Relative values were normalized to the fresh weight (FW) of the samples and IS ribitol. Data are presented as means ± SE of 3 independent measurements. Significant changes of log10-transformed data using one-way ANOVA (p < 0.05) are presented in bold. Metabolites grouped in amino acids and derivatives (AA), sugars and derivatives (sugar phosphate; sugar alcohol; sugar acid) (SS), organic acids (OA), and others (O); Table S5A: Fold changes in relative levels of primary metabolites in fish liver tissues, after a marine heatwave simulation, during which fish were exposed to a category II Mediterranean heatwave (CTR+HW), including a ramp temperature increase period of 8 days (+0.5 °C/day) up to 28 °C [50], followed by a 15-day period of exposure to the peak temperature (CTR+HW), in relation to the respective control condition at 24 °C (CTR). Relative values were normalized to the fresh weight (FW) of the samples and IS ribitol. Data are presented as means ± SE of 3 independent measurements. Significant changes of log10-transformed data using one-way ANOVA (p < 0.05) are presented in bold. Metabolites grouped in amino acids and derivatives (AA), sugars and derivatives (sugar phosphate; sugar alcohol; sugar acid) (SS), organic acids (OA), and others (O); Table S5B: Fold changes in relative levels of primary metabolites in fish liver tissues. Fish were exposed to a category II Mediterranean marine heatwave after a 30-day supplementation period and fed with a non-supplemented/commercial diet (CTR+HW) or a diet supplemented with 1.5, 3.0, and 6.0% Asparagopsis taxiformis (1.5-AT-HW, 3.0-AT-HW, and 6.0-AT-HW, respectively). Relative values were normalized to the fresh weight (FW) of the samples and IS ribitol. Data are presented as means ± SE of 3 independent measurements. Significant changes of log10-transformed data using one-way ANOVA (p < 0.05) are presented in bold. Metabolites grouped in amino acids and derivatives (AA), sugars and derivatives (sugar phosphate; sugar alcohol; sugar acid) (SS), organic acids (OA), and others (O).

Author Contributions

Conceptualization, A.L.M.; Data curation, C.A., A.M.R. and A.L.M.; Formal analysis, C.A., A.M.R. and A.L.M.; Funding acquisition, M.S.D. and A.L.M.; Investigation, I.M., M.S.D. and A.L.M.; Methodology, M.D., I.M. and A.L.M.; Resources, A.M. and A.L.M.; Software, C.A. and A.M.R.; Supervision, A.L.M.; Validation, A.L.M.; Visualization, M.D. and A.L.M.; Writing—original draft, M.D.; Writing—review and editing, M.D., I.M., C.A., A.M.R., A.M., M.S.D. and A.L.M. All authors have read and agreed to the published version of the manuscript.

Funding

This research was funded by Fundação Portuguesa para a Ciência e a Tecnologia (FCT I.P.), under the framework of the project Aqua-CLIMADAPT (PTDC/CTA-AMB/0592/2021, https://doi.org/10.54499/PTDC/CTA-AMB/0592/2021) and the “Applied Molecular Biosciences Unit” (UCIBIO), which is financed by national funds from FCT/MCTES (UIDB/04378/2020), the project LA/P/0140/2020 of the Associate Laboratory Institute for Health and Bioeconomy—i4HB. The project Aqua-CLIMADAPT (PTDC/CTA-AMB/0592/2021) also supported the research contract of Marta Dias. Isa Marmelo also acknowledges FCT I.P. for PhD grant (2020.04413.BD, https://doi.org/10.54499/2020.04413.BD).

Institutional Review Board Statement

The animal study protocol was approved by the Institutional Review Board (or Ethics Committee) of IPMA’s Animal Welfare and Ethics Body (ORBEA; authorization number 001/2023, 2 November 2023), under the oversight of the National Authority for the use of live animals, also recognized as the Directorate-General for Food and Veterinary (DGAV).

Data Availability Statement

Data is contained within the article or Supplementary Material.

Acknowledgments

The authors acknowledge the team from the Aquaculture Research Station of Olhão (EPPO-IPMA I.P.) for the technical support provided during animal rearing and transplantation, as well as GOPSIS Lda. for supplying the macroalga Asparagopsis taxifomis and SPAROS Lda. for supplying the experimental feeds.

Conflicts of Interest

The authors declare no conflicts of interest. The funders had no role in the design of the study; in the collection, analyses, or interpretation of data; in the writing of the manuscript; or in the decision to publish the results.

Appendix A

Figure A1. Experimental setup and illustration of the category II Mediterranean heatwave simulation. The fish were randomly and equally distributed in 15 tanks (5 treatments in triplicate, n = 10 fish in each tank). The experimental trial involved two phases: Phase 1—Supplementation period for 30 days, during which fish were kept at the optimal temperature of 24 °C (T30); and Phase 2—Marine heatwave simulation, during which fish were exposed to a category II Mediterranean heatwave, including a ramp temperature increase period of 8 days (+0.5 °C/day) up to 28 °C [53], followed by a 15-day period of exposure to the peak temperature (i.e., 28 °C, T53).
Fishes 10 00350 g0a1

References

  1. FAO. The State of World Fisheries and Aquaculture 2022. Towards Blue Transformation; Academic Press: London, UK; San Diego, CA, USA, 2022. [Google Scholar]
  2. Gephart, J.A.; Golden, C.D.; Asche, F.; Belton, B.; Brugere, C.; Froehlich, H.E.; Fry, J.P.; Halpern, B.S.; Hicks, C.C.; Jones, R.C.; et al. Scenarios for Global Aquaculture and Its Role in Human Nutrition. Rev. Fish. Sci. Aquac. 2021, 29, 122–138. [Google Scholar] [CrossRef]
  3. Der Poel, A.F.B.V.; Abdollahi, M.R.; Cheng, H.; Colovic, R.; Den Hartog, L.A.; Miladinovic, D.; Page, G.; Sijssens, K.; Smillie, J.F.; Thomas, M.; et al. Future Directions of Animal Feed Technology Research to Meet the Challenges of a Changing World. Anim. Feed Sci. Technol. 2020, 270, 114692. [Google Scholar] [CrossRef]
  4. Hardy, R.W.; Kaushik, S.J. (Eds.) Fish Nutrition, 4th ed.; Academic Press: London, UK; San Diego, CA, USA; Cambridge, MA, USA; Kidlington, UK, 2022; ISBN 978-0-12-819587-1. [Google Scholar]
  5. Jimenez-Lopez, C.; Pereira, A.G.; Lourenço-Lopes, C.; Garcia-Oliveira, P.; Cassani, L.; Fraga-Corral, M.; Prieto, M.A.; Simal-Gandara, J. Main Bioactive Phenolic Compounds in Marine Algae and Their Mechanisms of Action Supporting Potential Health Benefits. Food Chem. 2021, 341, 128262. [Google Scholar] [CrossRef]
  6. Naiel, M.A.E.; Alagawany, M.; Patra, A.K.; El-Kholy, A.I.; Amer, M.S.; Abd El-Hack, M.E. Beneficial Impacts and Health Benefits of Macroalgae Phenolic Molecules on Fish Production. Aquaculture 2021, 534, 736186. [Google Scholar] [CrossRef]
  7. Stadtlander, T.; Khalil, W.K.B.; Focken, U.; Becker, K. Effects of Low and Medium Levels of Red Alga Nori (Porphyra yezoensis Ueda) in the Diets on Growth, Feed Utilization and Metabolism in Intensively Fed Nile Tilapia, Oreochromis niloticus (L.). Aquacult. Nutr. 2013, 19, 64–73. [Google Scholar] [CrossRef]
  8. Cian, R.E.; Bacchetta, C.; Rossi, A.; Cazenave, J.; Drago, S.R. Red Seaweed Pyropia columbina as Antioxidant Supplement in Feed for Cultured Juvenile Pacú (Piaractus mesopotamicus). J. Appl. Phycol. 2019, 31, 1455–1465. [Google Scholar] [CrossRef]
  9. Xuan, X.; Li, W.; Zhu, W.; Wang, S. Effects of Different Levels of Macroalga Gracilaria lemaneiformis on Growth Performance and Feed Utilization on the Red Sea Bream, Pagrosomus major. J. Appl. Phycol. 2019, 31, 3213–3222. [Google Scholar] [CrossRef]
  10. Peixoto, M.J.; Svendsen, J.C.; Malte, H.; Pereira, L.F.; Carvalho, P.; Pereira, R.; Gonçalves, J.F.M.; Ozório, R.O.A. Diets Supplemented with Seaweed Affect Metabolic Rate, Innate Immune, and Antioxidant Responses, but Not Individual Growth Rate in European Seabass (Dicentrarchus labrax). J. Appl. Phycol. 2016, 28, 2061–2071. [Google Scholar] [CrossRef]
  11. Peixoto, M.J.; Salas-Leitón, E.; Brito, F.; Pereira, L.F.; Svendsen, J.C.; Baptista, T.; Pereira, R.; Abreu, H.; Reis, P.A.; Gonçalves, J.F.M.; et al. Effects of Dietary Gracilaria sp. and Alaria sp. Supplementation on Growth Performance, Metabolic Rates and Health in Meagre (Argyrosomus regius) Subjected to Pathogen Infection. J. Appl. Phycol. 2017, 29, 433–447. [Google Scholar] [CrossRef]
  12. Marmelo, I.; Dias, M.; Grade, A.; Pousão-Ferreira, P.; Diniz, M.S.; Marques, A.; Maulvault, A.L. Immunomodulatory and Antioxidant Effects of Functional Aquafeeds Biofortified with Whole Laminaria digitata in Juvenile Gilthead Seabream (Sparus aurata). Front. Mar. Sci. 2024, 11, 1325244. [Google Scholar] [CrossRef]
  13. Pereira, V.; Marques, A.; Gaivão, I.; Rego, A.; Abreu, H.; Pereira, R.; Santos, M.A.; Guilherme, S.; Pacheco, M. Marine Macroalgae as a Dietary Source of Genoprotection in Gilthead Seabream (Sparus aurata) against Endogenous and Exogenous Challenges. Comp. Biochem. Physiol. C Toxicol. Pharmacol. 2019, 219, 12–24. [Google Scholar] [CrossRef] [PubMed]
  14. Bansemir, A.; Blume, M.; Schröder, S.; Lindequist, U. Screening of Cultivated Seaweeds for Antibacterial Activity against Fish Pathogenic Bacteria. Aquaculture 2006, 252, 79–84. [Google Scholar] [CrossRef]
  15. Vatsos, I.N.; Rebours, C. Seaweed Extracts as Antimicrobial Agents in Aquaculture. J. Appl. Phycol. 2015, 27, 2017–2035. [Google Scholar] [CrossRef]
  16. Lozano, I.; Wacyk, J.M.; Carrasco, J.; Cortez-San Martín, M.A. Red Macroalgae Pyropia columbina and Gracilaria chilensis: Sustainable Feed Additive in the Salmo salar Diet and the Evaluation of Potential Antiviral Activity against Infectious Salmon Anemia Virus. J. Appl. Phycol. 2016, 28, 1343–1351. [Google Scholar] [CrossRef]
  17. Gora, A.H.; Sahu, N.P.; Sahoo, S.; Rehman, S.; Dar, S.A.; Ahmad, I.; Agarwal, D. Effect of Dietary Sargassum wightii and Its Fucoidan-Rich Extract on Growth, Immunity, Disease Resistance and Antimicrobial Peptide Gene Expression in Labeo rohita. Int. Aquat. Res. 2018, 10, 115–131. [Google Scholar] [CrossRef]
  18. Shi, Q.; Rong, H.; Hao, M.; Zhu, D.; Aweya, J.J.; Li, S.; Wen, X. Effects of Dietary Sargassum horneri on Growth Performance, Serum Biochemical Parameters, Hepatic Antioxidant Status, and Immune Responses of Juvenile Black Sea Bream Acanthopagrus schlegelii. J. Appl. Phycol. 2019, 31, 2103–2113. [Google Scholar] [CrossRef]
  19. Xuan, X.; Wen, X.; Li, S.; Zhu, D.; Li, Y. Potential Use of Macro-Algae Gracilaria lemaneiformis in Diets for the Black Sea Bream, Acanthopagrus schlegelii, Juvenile. Aquaculture 2013, 412–413, 167–172. [Google Scholar] [CrossRef]
  20. Kamunde, C.; Sappal, R.; Melegy, T.M. Brown Seaweed (AquaArom) Supplementation Increases Food Intake and Improves Growth, Antioxidant Status and Resistance to Temperature Stress in Atlantic Salmon, Salmo salar. PLoS ONE 2019, 14, e0219792. [Google Scholar] [CrossRef]
  21. Cascarano, M.C.; Stavrakidis-Zachou, O.; Mladineo, I.; Thompson, K.D.; Papandroulakis, N.; Katharios, P. Mediterranean Aquaculture in a Changing Climate: Temperature Effects on Pathogens and Diseases of Three Farmed Fish Species. Pathogens 2021, 10, 1205. [Google Scholar] [CrossRef]
  22. Hobday, A.J.; Alexander, L.V.; Perkins, S.E.; Smale, D.A.; Straub, S.C.; Oliver, E.C.J.; Benthuysen, J.A.; Burrows, M.T.; Donat, M.G.; Feng, M.; et al. A Hierarchical Approach to Defining Marine Heatwaves. Prog. Oceanogr. 2016, 141, 227–238. [Google Scholar] [CrossRef]
  23. Garrabou, J.; Gómez-Gras, D.; Medrano, A.; Cerrano, C.; Ponti, M.; Schlegel, R.; Bensoussan, N.; Turicchia, E.; Sini, M.; Gerovasileiou, V.; et al. Marine Heatwaves Drive Recurrent Mass Mortalities in the Mediterranean Sea. Glob. Change Biol. 2022, 28, 5708–5725. [Google Scholar] [CrossRef] [PubMed]
  24. Martínez, J.; Leonelli, F.E.; García-Ladona, E.; Garrabou, J.; Kersting, D.K.; Bensoussan, N.; Pisano, A. Evolution of Marine Heatwaves in Warming Seas: The Mediterranean Sea Case Study. Front. Mar. Sci. 2023, 10, 1193164. [Google Scholar] [CrossRef]
  25. Islam, M.J.; Kunzmann, A.; Slater, M.J. Responses of Aquaculture Fish to Climate Change-induced Extreme Temperatures: A Review. J. World Aquac. Soc. 2022, 53, 314–366. [Google Scholar] [CrossRef]
  26. Barbosa, V.; Maulvault, A.L.; Anacleto, P.; Santos, M.; Mai, M.; Oliveira, H.; Delgado, I.; Coelho, I.; Barata, M.; Araújo-Luna, R.; et al. Enriched Feeds with Iodine and Selenium from Natural and Sustainable Sources to Modulate Farmed Gilthead Seabream (Sparus aurata) and Common Carp (Cyprinus carpio) Fillets Elemental Nutritional Value. Food Chem. Toxicol. 2020, 140, 111330. [Google Scholar] [CrossRef]
  27. Silva-Brito, F.; Timóteo, F.; Esteves, Â.; Peixoto, M.J.; Ozorio, R.; Magnoni, L. Impact of the Replacement of Dietary Fish Oil by Animal Fats and Environmental Salinity on the Metabolic Response of European Seabass (Dicentrarchus labrax). Comp. Biochem. Physiol. B Biochem. Mol. Biol. 2019, 233, 46–59. [Google Scholar] [CrossRef] [PubMed]
  28. Oliva-Teles, A. Nutrition and Health of Aquaculture Fish. J. Fish Dis. 2012, 35, 83–108. [Google Scholar] [CrossRef]
  29. Hixson, S.H. Fish Nutrition and Current Issues in Aquaculture: The Balance in Providing Safe and Nutritious Seafood, in an Environmentally Sustainable Manner. J. Aquac. Res. Development 2014, 3, 234. [Google Scholar] [CrossRef]
  30. Jobling, M. Fish Nutrition Research: Past, Present and Future. Aquacult. Int. 2016, 24, 767–786. [Google Scholar] [CrossRef]
  31. Mahanty, A.; Yadav, R.P.; Purohit, G.K.; Mohanty, S.; Mohanty, B.P. Metabolomic Response to High Temperature Stress in Murrel Channa striatus and Insights for Designer Feeds. In Outlook of Climate Change and Fish Nutrition; Sinha, A., Kumar, S., Kumari, K., Eds.; Springer Nature: Singapore, 2022; pp. 197–205. ISBN 978-981-19-5499-3. [Google Scholar]
  32. Viant, M.R.; Rosenblum, E.S.; Tjeerdema, R.S. NMR-Based Metabolomics: A Powerful Approach for Characterizing the Effects of Environmental Stressors on Organism Health. Environ. Sci. Technol. 2003, 37, 4982–4989. [Google Scholar] [CrossRef]
  33. Alfaro, A.C.; Young, T. Showcasing Metabolomic Applications in Aquaculture: A Review. Rev. Aquac. 2018, 10, 135–152. [Google Scholar] [CrossRef]
  34. Fiehn, O. Metabolomics—The Link between Genotypes and Phenotypes. In Functional Genomics; Town, C., Ed.; Springer: Dordrecht, The Netherlands, 2002; pp. 155–171. ISBN 978-94-010-3903-1. [Google Scholar]
  35. Fernie, A.R.; Trethewey, R.N.; Krotzky, A.J.; Willmitzer, L. Metabolite Profiling: From Diagnostics to Systems Biology. Nat. Rev. Mol. Cell Biol. 2004, 5, 763–769. [Google Scholar] [CrossRef]
  36. Elolimy, A.; Alharthi, A.; Zeineldin, M.; Parys, C.; Helmbrecht, A.; Loor, J.J. Supply of Methionine During Late-Pregnancy Alters Fecal Microbiota and Metabolome in Neonatal Dairy Calves Without Changes in Daily Feed Intake. Front. Microbiol. 2019, 10, 2159. [Google Scholar] [CrossRef] [PubMed]
  37. Novais, F.J.; Pires, P.R.L.; Alexandre, P.A.; Dromms, R.A.; Iglesias, A.H.; Ferraz, J.B.S.; Styczynski, M.P.-W.; Fukumasu, H. Identification of a Metabolomic Signature Associated with Feed Efficiency in Beef Cattle. BMC Genomics 2019, 20, 8. [Google Scholar] [CrossRef]
  38. Carmelo, V.A.O.; Banerjee, P.; Da Silva Diniz, W.J.; Kadarmideen, H.N. Metabolomic Networks and Pathways Associated with Feed Efficiency and Related-Traits in Duroc and Landrace Pigs. Sci. Rep. 2020, 10, 255. [Google Scholar] [CrossRef] [PubMed]
  39. Clemmons, B.A.; Powers, J.B.; Campagna, S.R.; Seay, T.B.; Embree, M.M.; Myer, P.R. Rumen Fluid Metabolomics of Beef Steers Differing in Feed Efficiency. Metabolomics 2020, 16, 23. [Google Scholar] [CrossRef] [PubMed]
  40. Wu, R.; Chen, J.; Zhang, L.; Wang, X.; Yang, Y.; Ren, X. LC/MS-Based Metabolomics to Evaluate the Milk Composition of Human, Horse, Goat and Cow from China. Eur. Food Res. Technol. 2021, 247, 663–675. [Google Scholar] [CrossRef]
  41. Ye, X.; Zhou, L.; Zhang, Y.; Xue, S.; Gan, Q.F.; Fang, S. Effect of Host Breeds on Gut Microbiome and Serum Metabolome in Meat Rabbits. BMC Vet. Res. 2021, 17, 24. [Google Scholar] [CrossRef]
  42. Fiehn, O. Metabolomics by Gas Chromatography–Mass Spectrometry: Combined Targeted and Untargeted Profiling. Curr. Protoc. Mol. Biol. 2016, 114, 30.4.1–30.4.32. [Google Scholar] [CrossRef]
  43. Marmelo, I.; Lourenço-Marques, C.; Silva, I.A.L.; Soares, F.; Pousão-Ferreira, P.; Mata, L.; Marques, A.; Diniz, M.S.; Maulvault, A.L. Eco-Innovative Aquafeeds Biofortified with Asparagopsis taxiformis to Improve the Resilience of Farmed White Seabream (Diplodus sargus) to Marine Heatwave Events. Heliyon 2024, 10, e35135. [Google Scholar] [CrossRef]
  44. Belghit, I.; Rasinger, J.D.; Heesch, S.; Biancarosa, I.; Liland, N.; Torstensen, B.; Waagbø, R.; Lock, E.-J.; Bruckner, C.G. In-Depth Metabolic Profiling of Marine Macroalgae Confirms Strong Biochemical Differences between Brown, Red and Green Algae. Algal Res. 2017, 26, 240–249. [Google Scholar] [CrossRef]
  45. Mancuso, F.P.; D’Agostaro, R.; Milazzo, M.; Badalamenti, F.; Musco, L.; Mikac, B.; Lo Brutto, S.; Chemello, R. The Invasive Seaweed Asparagopsis taxiformis Erodes the Habitat Structure and Biodiversity of Native Algal Forests in the Mediterranean Sea. Mar. Environ. Res. 2022, 173, 105515. [Google Scholar] [CrossRef]
  46. Vinagre, C.; Madeira, C.; Dias, M.; Narciso, L.; Mendonça, V. Reliance of Coastal Intertidal Food Webs on River Input—Current and Future Perspectives. Ecol. Indic. 2019, 101, 632–639. [Google Scholar] [CrossRef]
  47. Gamito, S.; Quental-Ferreira, H.; Parejo, A.; Aubin, J.; Christensen, V.; Cunha, M. Integrated Multi-Trophic Aquaculture Systems: Energy Transfers and Food Web Organization in Coastal Earthen Ponds. Aquacult. Environ. Interact. 2020, 12, 457–470. [Google Scholar] [CrossRef]
  48. Morales-Nin, B.; Moranta, J.; García, C.; Tugores, M.P.; Grau, A.M.; Riera, F.; Cerdà, M. The Recreational Fishery off Majorca Island (Western Mediterranean): Some Implications for Coastal Resource Management. ICES J. Mar. Sci. 2005, 62, 727–739. [Google Scholar] [CrossRef]
  49. Veiga, P.; Ribeiro, J.; Gonçalves, J.M.S.; Erzini, K. Quantifying Recreational Shore Angling Catch and Harvest in Southern Portugal (North-east Atlantic Ocean): Implications for Conservation and Integrated Fisheries Management. J. Fish Biol. 2010, 76, 2216–2237. [Google Scholar] [CrossRef]
  50. FAO. Fisheries and Aquaculture Department, FAO FishFinder Aquatic Species—Fact Sheets, Diplodus sargus; FAO: Rome, Italy, 2020. [Google Scholar]
  51. Santos, C.; Soares, F.; Candeias-Mendes, A.; Pousão-Ferreira, P.; Dinis, M.T.; Cortes Valente Oliveira, C. Characterization of Spawning Rhythms of a Sparidae Aquaculture Species, the White Seabream (Diplodus sargus), in the South of Portugal. Aquac. Res. 2022, 53, 1424–1434. [Google Scholar] [CrossRef]
  52. Pereira, A.; Marmelo, I.; Dias, M.; Silva, A.C.; Grade, A.C.; Barata, M.; Pousão-Ferreira, P.; Dias, J.; Anacleto, P.; Marques, A.; et al. Asparagopsis taxiformis as a Novel Antioxidant Ingredient for Climate-Smart Aquaculture: Antioxidant, Metabolic and Digestive Modulation in Juvenile White Seabream (Diplodus sargus) Exposed to a Marine Heatwave. Antioxidants 2024, 13, 949. [Google Scholar] [CrossRef]
  53. Hobday, A.J.; Oliver, E.C.; Gupta, A.S.; Benthuysen, J.A.; Burrows, M.T.; Donat, M.G.; Holbrook, N.J.; Moore, P.J.; Thomsen, M.S.; Wernberg, T.; et al. Categorizing and Naming Marine Heatwaves. Oceanography 2018, 31, 162–173. [Google Scholar] [CrossRef]
  54. Lisec, J.; Schauer, N.; Kopka, J.; Willmitzer, L.; Fernie, A.R. Gas Chromatography Mass Spectrometry–Based Metabolite Profiling in Plants. Nat. Protoc. 2006, 1, 387–396. [Google Scholar] [CrossRef]
  55. Luedemann, A.; Strassburg, K.; Erban, A.; Kopka, J. TagFinder for the Quantitative Analysis of Gas Chromatography—Mass Spectrometry (GC-MS)-Based Metabolite Profiling Experiments. Bioinformatics 2008, 24, 732–737. [Google Scholar] [CrossRef]
  56. Kopka, J.; Schauer, N.; Krueger, S.; Birkemeyer, C.; Usadel, B.; Bergmuller, E.; Dormann, P.; Weckwerth, W.; Gibon, Y.; Stitt, M.; et al. GMD@CSB.DB: The Golm Metabolome Database. Bioinformatics 2005, 21, 1635–1638. [Google Scholar] [CrossRef]
  57. Schauer, N.; Steinhauser, D.; Strelkov, S.; Schomburg, D.; Allison, G.; Moritz, T.; Lundgren, K.; Roessner-Tunali, U.; Forbes, M.G.; Willmitzer, L.; et al. GC–MS Libraries for the Rapid Identification of Metabolites in Complex Biological Samples. FEBS Letters 2005, 579, 1332–1337. [Google Scholar] [CrossRef] [PubMed]
  58. RStudio Team. RStudio: Integrated Development for R. RStudio, PBC, Boston, MA, USA. 2020. Available online: http://www.rstudio.com/ (accessed on 8 July 2024).
  59. de Mendiburu, F. Agricolae: Statistical Procedures for Agricultural Research, Version 1.3-3; R Package: Madison, WI, USA, 2020. [Google Scholar]
  60. Warnes, G.R.; Bolker, B.; Bonebakker, L.; Gentleman, R.; Huber, W.; Liaw, A.; Lumley, T.; Maechler, M.; Magnusson, A.; Moeller, S.; et al. Gplots: Various R Programming Tools for Plotting Data. R Package Version 2.12.1. 2020. Available online: http://CRAN.R-project.org/package=gplots (accessed on 13 March 2025).
  61. Rohart, F.; Gautier, B.; Singh, A.; Lê Cao, K.-A. mixOmics: An R Package for ‘omics Feature Selection and Multiple Data Integration. PLoS Comput. Biol. 2017, 13, e1005752. [Google Scholar] [CrossRef]
  62. Machado, M.; Machado, S.; Pimentel, F.B.; Freitas, V.; Alves, R.C.; Oliveira, M.B.P.P. Amino Acid Profile and Protein Quality Assessment of Macroalgae Produced in an Integrated Multi-Trophic Aquaculture System. Foods 2020, 9, 1382. [Google Scholar] [CrossRef] [PubMed]
  63. Félix, R.; Dias, P.; Félix, C.; Cerqueira, T.; Andrade, P.B.; Valentão, P.; Lemos, M.F.L. The Biotechnological Potential of Asparagopsis armata: What Is Known of Its Chemical Composition, Bioactivities and Current Market? Algal Res. 2021, 60, 102534. [Google Scholar] [CrossRef]
  64. De Bhowmick, G.; Hayes, M. In Vitro Protein Digestibility of Selected Seaweeds. Foods 2022, 11, 289. [Google Scholar] [CrossRef]
  65. Zhou, A.Y.; Robertson, J.; Hamid, N.; Ma, Q.; Lu, J. Changes in Total Nitrogen and Amino Acid Composition of New Zealand Undaria pinnatifida with Growth, Location and Plant Parts. Food Chem. 2015, 186, 319–325. [Google Scholar] [CrossRef]
  66. Aksnes, A.; Mundheim, H.; Toppe, J.; Albrektsen, S. The Effect of Dietary Hydroxyproline Supplementation on Salmon (Salmo salar L.) Fed High Plant Protein Diets. Aquaculture 2008, 275, 242–249. [Google Scholar] [CrossRef]
  67. Liu, X.; Mai, K.; Liufu, Z.; Ai, Q. Effects of Dietary Protein and Lipid Levels on Growth, Nutrient Utilization, and the Whole-body Composition of Turbot, Scophthalmus maximus, Linnaeus 1758, at Different Growth Stages. J. World Aquac. Soc. 2014, 45, 355–366. [Google Scholar] [CrossRef]
  68. Rong, H.; Zhang, Y.; Hao, M.; Lin, F.; Zou, W.; Zhang, H.; Yu, C.; Yu, J.; Shi, Q.; Aweya, J.J.; et al. Effect of Hydroxyproline Supplementation on Growth Performance, Body Composition, Amino Acid Profiles, Blood-biochemistry and Collagen Synthesis of Juvenile Chu’s Croaker (Nibea coibor). Aquac. Res. 2020, 51, 1264–1275. [Google Scholar] [CrossRef]
  69. Salamanca, N.; Giráldez, I.; Morales, E.; De La Rosa, I.; Herrera, M. Phenylalanine and Tyrosine as Feed Additives for Reducing Stress and Enhancing Welfare in Gilthead Seabream and Meagre. Animals 2020, 11, 45. [Google Scholar] [CrossRef] [PubMed]
  70. Wu, Z.; Hou, Y.; Dai, Z.; Hu, C.-A.A.; Wu, G. Metabolism, Nutrition, and Redox Signaling of Hydroxyproline. Antioxid. Redox Signal. 2019, 30, 674–682. [Google Scholar] [CrossRef] [PubMed]
  71. Ma, F.; Zhao, L.; Ma, R.; Wang, J.; Du, L. FoxO Signaling and Mitochondria-Related Apoptosis Pathways Mediate Tsinling Lenok Trout (Brachymystax lenok tsinlingensis) Liver Injury under High Temperature Stress. Int. J. Biol. Macromol. 2023, 251, 126404. [Google Scholar] [CrossRef]
  72. Li, P.; Mai, K.; Trushenski, J.; Wu, G. New Developments in Fish Amino Acid Nutrition: Towards Functional and Environmentally Oriented Aquafeeds. Amino Acids 2009, 37, 43–53. [Google Scholar] [CrossRef]
  73. Jasour, M.S.; Wagner, L.; Sundekilde, U.K.; Larsen, B.K.; Greco, I.; Orlien, V.; Olsen, K.; Rasmussen, H.T.; Hjermitslev, N.H.; Hammershøj, M.; et al. A Comprehensive Approach to Assess Feathermeal as an Alternative Protein Source in Aquafeed. J. Agric. Food Chem. 2017, 65, 10673–10684. [Google Scholar] [CrossRef] [PubMed]
  74. Phang, J.M.; Donald, S.P.; Pandhare, J.; Liu, Y. The Metabolism of Proline, a Stress Substrate, Modulates Carcinogenic Pathways. Amino Acids 2008, 35, 681–690. [Google Scholar] [CrossRef]
  75. Hu, S.; He, W.; Wu, G. Hydroxyproline in Animal Metabolism, Nutrition, and Cell Signaling. Amino Acids 2022, 54, 513–528. [Google Scholar] [CrossRef]
  76. Nisar, N.; Mustafa, F.; Tahir, A.; Qadri, R.; Yang, Y.; Khan, M.I.; Wang, F. Proximate Composition, Functional Properties and Quantitative Analysis of Benzoyl Peroxide and Benzoic Acid in Wheat Flour Samples: Effect on Wheat Flour Quality. PeerJ 2020, 8, e8788. [Google Scholar] [CrossRef]
  77. Libanori, M.C.M.; Santos, G.G.; Pereira, S.A.; Lopes, G.R.; Owatari, M.S.; Soligo, T.A.; Yamashita, E.; Pereira, U.P.; Martins, M.L.; Mouriño, J.L.P. Dietary Supplementation with Benzoic Organic Acid Improves the Growth Performance and Survival of Nile Tilapia (Oreochromis niloticus) after Challenge with Streptococcus agalactiae (Group B). Aquaculture 2021, 545, 737204. [Google Scholar] [CrossRef]
  78. Hussein, E.E.; Habiba, M.M.; Ashry, A.M.; Al-Zayat, A.M.; Teiba, I.I.; Shehata, A.I.; Shahin, S.A.; El-Ratel, I.T.; Mzengereza, K.; Tembo, M.; et al. Effects of Dietary Supplementation with Organic Acids Mixture on Growth, Feed Efficiency, Hematobiochemical Parameters, Immunity, and Intestinal Microbiota of Gilthead Seabream (Sparus aurata) Juveniles. Aquac. Rep. 2023, 33, 101846. [Google Scholar] [CrossRef]
  79. Santos, G.G.; Libanori, M.C.M.; Pereira, S.A.; Ferrarezi, J.V.S.; Ferreira, M.B.; Soligo, T.A.; Yamashita, E.; Martins, M.L.; Mouriño, J.L.P. Probiotic Mix of Bacillus spp. and Benzoic Organic Acid as Growth Promoter against Streptococcus agalactiae in Nile Tilapia. Aquaculture 2023, 566, 739212. [Google Scholar] [CrossRef]
  80. Hu, Z.; Zhu, Y.; Chen, J.; Chen, J.; Li, C.; Gao, Z.; Li, J.; Liu, L. Discovery of Novel Bactericides from Aspergillus alabamensis and Their Antibacterial Activity against Fish Pathogens. J. Agric. Food Chem. 2023, 71, 4298–4305. [Google Scholar] [CrossRef]
  81. Long, Z.; Qin, H.; Huang, Z.; Xu, A.; Ye, Y.; Li, Z. Effects of Heat Stress on Physiological Parameters, Biochemical Parameters and Expression of Heat Stress Protein Gene in Lateolabrax maculatus. J. Therm. Biol. 2023, 115, 103606. [Google Scholar] [CrossRef]
  82. Hao, R.; Li, H.; Tian, Y.; Ru, X.; Deng, Q.; Zhu, K.; Yang, T.; Huang, Y.; Zhu, C. The Effect of Heat Stress on Energy Metabolism, Immune Function, and Oxidative Stress of Juvenile Greater Amberjack Seriola dumerili. Aquac. Res. 2024, 2024, 1–9. [Google Scholar] [CrossRef]
  83. Yan, H.; Du, J.; Li, S.; Lei, C.; Zhu, T.; Han, L.; Song, H. Chronic Heat Stress Is Capable of Reducing the Growth Performance, Causing Damage to the Liver Structure, and Altering the Liver Glucose Metabolism and Lipid Metabolism in Largemouth Bass (Micropterus salmoides L.). Fish Physiol. Biochem. 2025, 51, 24. [Google Scholar] [CrossRef]
  84. Currie, S.; Bagatto, B.; DeMille, M.; Learner, A.; LeBlanc, D.; Marks, C.; Ong, K.; Parker, J.; Templeman, N.; Tufts, B.L.; et al. Metabolism, Nitrogen Excretion, and Heat Shock Proteins in the Central Mudminnow (Umbra limi), a Facultative Air-Breathing Fish Living in a Variable Environment. Can. J. Zool. 2010, 88, 43–58. [Google Scholar] [CrossRef]
  85. Song, M.; Zhao, J.; Wen, H.-S.; Li, Y.; Li, J.-F.; Li, L.-M.; Tao, Y.-X. The Impact of Acute Thermal Stress on the Metabolome of the Black Rockfish (Sebastes schlegelii). PLoS ONE 2019, 14, e0217133. [Google Scholar] [CrossRef]
  86. Liu, Y.; Liu, J.; Ye, S.; Bureau, D.P.; Liu, H.; Yin, J.; Mou, Z.; Lin, H.; Hao, F. Global Metabolic Responses of the Lenok (Brachymystax lenok) to Thermal Stress. Comp. Biochem. Physiol. Part D Genomics Proteomics 2019, 29, 308–319. [Google Scholar] [CrossRef]
  87. Hillyer, K.E.; Beale, D.J.; Shima, J.S. Artificial Light at Night Interacts with Predatory Threat to Alter Reef Fish Metabolite Profiles. Sci. Total Environ. 2021, 769, 144482. [Google Scholar] [CrossRef]
  88. Clark, T.C.; Tinsley, J.; Macqueen, D.J.; Martin, S.A.M. Rainbow Trout (Oncorhynchus mykiss) Urea Cycle and Polyamine Synthesis Gene Families Show Dynamic Expression Responses to Inflammation. Fish Shellfish Immunol. 2019, 89, 290–300. [Google Scholar] [CrossRef] [PubMed]
  89. Engelking, L.R. Chapter 10: Urea Cycle (Krebs-Henseleit Ornithine Cycle). In Textbook of Veterinary Physiological Chemistry; Academic Press: Cambridge, MA, USA, 2015; pp. 58–64. ISBN 978-0-12-391909-0. [Google Scholar]
  90. Jiang, Y.; Cheng, X.; Lu, J.; Xu, G.; Liu, Q.; Sun, J. Thermal Stress Induces Metabolic Responses in Juvenile Qingtian Paddy Field Carp Cyprinus carpio var qingtianensis. Animals 2022, 12, 3395. [Google Scholar] [CrossRef] [PubMed]
  91. Rehman, A.; Huang, F.; Zhang, Z.; Habumugisha, T.; Yan, C.; Shaheen, U.; Zhang, X. Nanoplastic Contamination: Impact on Zebrafish Liver Metabolism and Implications for Aquatic Environmental Health. Environ. Int. 2024, 187, 108713. [Google Scholar] [CrossRef]
  92. Gamarra, Y.; Santiago, F.C.; Molina-López, J.; Castaño, J.; Herrera-Quintana, L.; Domínguez, Á.; Planells, E. Pyroglutamic Acidosis by Glutathione Regeneration Blockage in Critical Patients with Septic Shock. Crit. Care 2019, 23, 162. [Google Scholar] [CrossRef]
  93. Fang, Y.-Z.; Yang, S.; Wu, G. Free Radicals, Antioxidants, and Nutrition. Nutrition 2002, 18, 872–879. [Google Scholar] [CrossRef]
  94. Aguilar, A.; Mattos, H.; Carnicero, B.; Sanhueza, N.; Muñoz, D.; Teles, M.; Tort, L.; Boltaña, S. Metabolomic Profiling Reveals Changes in Amino Acid and Energy Metabolism Pathways in Liver, Intestine and Brain of Zebrafish Exposed to Different Thermal Conditions. Front. Mar. Sci. 2022, 9, 835379. [Google Scholar] [CrossRef]
  95. Yang, D.-X.; Yang, M.-J.; Yin, Y.; Kou, T.-S.; Peng, L.-T.; Chen, Z.-G.; Zheng, J.; Peng, B. Serine Metabolism Tunes Immune Responses To Promote Oreochromis niloticus Survival upon Edwardsiella tarda Infection. mSystems 2021, 6, e00426-21. [Google Scholar] [CrossRef] [PubMed]
  96. Kim, S.; Kim, A.; Ma, S.; Lee, W.; Lee, S.; Yoon, D.; Kim, D.-H.; Kim, S. Glutathione Injection Alleviates the Fluctuation of Metabolic Response under Thermal Stress in Olive Flounder, Paralichthys olivaceus. Metabolites 2019, 10, 3. [Google Scholar] [CrossRef]
  97. Adam, A.-C.; Lie, K.K.; Moren, M.; Skjærven, K.H. High Dietary Arachidonic Acid Levels Induce Changes in Complex Lipids and Immune-Related Eicosanoids and Increase Levels of Oxidised Metabolites in Zebrafish (Danio rerio). Br. J. Nutr. 2017, 117, 1075–1085. [Google Scholar] [CrossRef]
  98. Tian, Y.; Wang, W.; Jiang, W.; Zhang, G.; He, J.; Dong, S.; Zhou, Y.; Yang, W.; Tang, Q.; Yu, Y.; et al. Non-Targeted Metabolomics Provides Insights into the Distinct Amino Acid and Lipid Metabolism in Liver Tissues of Rainbow Trout (Oncorhynchus mykiss) Cultured in Seawater at Different Temperatures. Aquaculture 2024, 579, 740188. [Google Scholar] [CrossRef]
  99. Falco, F.; Stincone, P.; Cammarata, M.; Brandelli, A. Amino Acids as the Main Energy Source in Fish Tissues. Aquac. Fish Stud. 2020, 3, 1–11. [Google Scholar] [CrossRef]
  100. Zhao, H.; Ke, H.; Zhang, L.; Zhao, Z.; Lai, J.; Zhou, J.; Huang, Z.; Li, H.; Du, J.; Li, Q. Integrated Analysis about the Effects of Heat Stress on Physiological Responses and Energy Metabolism in Gymnocypris chilianensis. Sci. Total Environ. 2022, 806, 151252. [Google Scholar] [CrossRef] [PubMed]
  101. Luo, M.; Feng, B.; Zhu, W.; Liang, Z.; Xu, W.; Fu, J.; Miao, L.; Dong, Z. Proteomics and Metabolomics Analysis of American Shad (Alosa sapidissima) Liver Responses to Heat Stress. Comp. Biochem. Physiol. A Mol. Integr. Physiol. 2024, 296, 111686. [Google Scholar] [CrossRef]
  102. Kooijman, S.A.L.M.; Baas, J.; Bontje, D.; Broerse, M.; Van Gestel, C.A.M.; Jager, T. Ecotoxicological Applications of Dynamic Energy Budget Theory. In Ecotoxicology Modeling; Devillers, J., Ed.; Emerging Topics in Ecotoxicology; Springer: Boston, MA, USA, 2009; Volume 2, pp. 237–259. ISBN 978-1-4419-0196-5. [Google Scholar]
  103. Yan, L.; Qiu-Zhou, X. Dietary Glutamine Supplementation Improves Structure and Function of Intestine of Juvenile Jian Carp (Cyprinus carpio var. Jian). Aquaculture 2006, 256, 389–394. [Google Scholar] [CrossRef]
  104. Cheng, Z.; Buentello, A.; Gatlin, D.M. Effects of Dietary Arginine and Glutamine on Growth Performance, Immune Responses and Intestinal Structure of Red Drum, Sciaenops ocellatus. Aquaculture 2011, 319, 247–252. [Google Scholar] [CrossRef]
  105. Larsen, T.; Wang, Y.V.; Wan, A.H.L. Tracing the Trophic Fate of Aquafeed Macronutrients With Carbon Isotope Ratios of Amino Acids. Front. Mar. Sci. 2022, 9, 813961. [Google Scholar] [CrossRef]
  106. Zhou, X. Use of Synthetic Lysine in Fish Feeds: A Review on Research and Application. Feed Ind. 2005, 27, 1–7. [Google Scholar]
  107. Ramos-Pinto, L.; Machado, M.; Calduch-Giner, J.; Pérez-Sánchez, J.; Dias, J.; Conceição, L.E.C.; Silva, T.S.; Costas, B. Dietary Histidine, Threonine, or Taurine Supplementation Affects Gilthead Seabream (Sparus aurata) Immune Status. Animals 2021, 11, 1193. [Google Scholar] [CrossRef]
  108. Wu, G. Functional Amino Acids in Nutrition and Health. Amino Acids 2013, 45, 407–411. [Google Scholar] [CrossRef]
  109. Li, X.; Zheng, S.; Wu, G. Nutrition and Metabolism of Glutamate and Glutamine in Fish. Amino Acids 2020, 52, 671–691. [Google Scholar] [CrossRef]
  110. Gillis, T.E.; Ballantyne, J.S. The Effects of Starvation on Plasma Free Amino Acid and Glucose Concentrations in Lake Sturgeon. J. Fish Biol. 1996, 49, 1306–1316. [Google Scholar] [CrossRef]
  111. Hassel, B. Pyruvate Carboxylation in Neurons. J. Neurosci. Res. 2001, 66, 755–762. [Google Scholar] [CrossRef] [PubMed]
  112. Wang, L.; Gao, C.; Wang, B.; Wang, C.; Sagada, G.; Yan, Y. Methionine in Fish Health and Nutrition: Potential Mechanisms, Affecting Factors, and Future Perspectives. Aquaculture 2023, 568, 739310. [Google Scholar] [CrossRef]
  113. Tulli, F.; Messina, M.; Calligaris, M.; Tibaldi, E. Response of European Sea Bass (Dicentrarchus labrax) to Graded Levels of Methionine (Total Sulfur Amino Acids) in Soya Protein-Based Semi-Purified Diets. Br. J. Nutr. 2010, 104, 664–673. [Google Scholar] [CrossRef]
  114. He, J.-Y.; Tian, L.-X.; Lemme, A.; Gao, W.; Yang, H.-J.; Niu, J.; Liang, G.-Y.; Chen, P.-F.; Liu, Y.-J. Methionine and Lysine Requirements for Maintenance and Efficiency of Utilization for Growth of Two Sizes of Tilapia (Oreochromis niloticus). Aquacult. Nutr. 2013, 19, 629–640. [Google Scholar] [CrossRef]
  115. Rolland, M.; Dalsgaard, J.; Holm, J.; Gómez-Requeni, P.; Skov, P.V. Dietary Methionine Level Affects Growth Performance and Hepatic Gene Expression of GH–IGF System and Protein Turnover Regulators in Rainbow Trout (Oncorhynchus mykiss) Fed Plant Protein-Based Diets. Comp. Biochem. Physiol. B Biochem. Mol. Biol. 2015, 181, 33–41. [Google Scholar] [CrossRef] [PubMed]
  116. Belghit, I.; Skiba-Cassy, S.; Geurden, I.; Dias, K.; Surget, A.; Kaushik, S.; Panserat, S.; Seiliez, I. Dietary Methionine Availability Affects the Main Factors Involved in Muscle Protein Turnover in Rainbow Trout (Oncorhynchus mykiss). Br. J. Nutr. 2014, 112, 493–503. [Google Scholar] [CrossRef]
  117. Kuang, S.-Y.; Xiao, W.-W.; Feng, L.; Liu, Y.; Jiang, J.; Jiang, W.-D.; Hu, K.; Li, S.-H.; Tang, L.; Zhou, X.-Q. Effects of Graded Levels of Dietary Methionine Hydroxy Analogue on Immune Response and Antioxidant Status of Immune Organs in Juvenile Jian Carp (Cyprinus carpio var. Jian). Fish Shellfish Immunol. 2012, 32, 629–636. [Google Scholar] [CrossRef]
  118. Machado, M.; Azeredo, R.; Díaz-Rosales, P.; Afonso, A.; Peres, H.; Oliva-Teles, A.; Costas, B. Dietary Tryptophan and Methionine as Modulators of European Seabass (Dicentrarchus labrax) Immune Status and Inflammatory Response. Fish Shellfish Immunol. 2015, 42, 353–362. [Google Scholar] [CrossRef]
  119. Pan, F.-Y.; Feng, L.; Jiang, W.-D.; Jiang, J.; Wu, P.; Kuang, S.-Y.; Tang, L.; Tang, W.-N.; Zhang, Y.-A.; Zhou, X.-Q.; et al. Methionine Hydroxy Analogue Enhanced Fish Immunity via Modulation of NF-κB, TOR, MLCK, MAPKs and Nrf2 Signaling in Young Grass Carp (Ctenopharyngodon idella). Fish Shellfish Immunol. 2016, 56, 208–228. [Google Scholar] [CrossRef]
  120. Elmada, C.Z.; Huang, W.; Jin, M.; Liang, X.; Mai, K.; Zhou, Q. The Effect of Dietary Methionine on Growth, Antioxidant Capacity, Innate Immune Response and Disease Resistance of Juvenile Yellow Catfish (Pelteobagrus fulvidraco). Aquacult. Nutr. 2016, 22, 1163–1173. [Google Scholar] [CrossRef]
  121. Noor, Z.; Noor, M.; Khan, S.A.; Younas, W.; Ualiyeva, D.; Hassan, Z.; Yousafzai, A.M. Dietary Supplementations of Methionine Improve Growth Performances, Innate Immunity, Digestive Enzymes, and Antioxidant Activities of Rohu (Labeo rohita). Fish Physiol. Biochem. 2021, 47, 451–464. [Google Scholar] [CrossRef] [PubMed]
  122. Jiang, M.; Yang, L.-F.; Zheng, J.; Chen, Z.-G.; Peng, B. Maltose Promotes Crucian Carp Survival against Aeromonas sobrial Infection at High Temperature. Virulence 2020, 11, 877–888. [Google Scholar] [CrossRef] [PubMed]
  123. Cao, Y.; Kou, T.; Peng, L.; Munang’andu, H.M.; Peng, B. Fructose Promotes Crucian Carp Survival Against Aeromonas hydrophila Infection. Front. Immunol. 2022, 13, 865560. [Google Scholar] [CrossRef] [PubMed]
  124. Kou, T.; Wu, J.; Chen, X.; Peng, B. Functional Proteomics Identify Mannitol Metabolism in Serum Resistance and Therapeutic Implications in Vibrio alginolyticus. Front. Immunol. 2022, 13, 1010526. [Google Scholar] [CrossRef]
  125. Li, R.-X.; Chen, L.-Y.; Yao, B.; Rahimnejad, S.; Ren, J.; Luo, Y.; Qiao, F.; Zhang, M.-L.; Du, Z.-Y. Trehalose Alleviated Hepatic Cholesterol Accumulation via Inhibiting Transformation from Glucose-Derived Acyl-CoA to Cholesterol Synthesis in Nile Tilapia. Aquaculture 2022, 560, 738600. [Google Scholar] [CrossRef]
Figure 1. Heatmap visualization representing the changes in relative levels of primary metabolites in fish liver tissues at Phase 1—Supplementation period for 30 days, during which fish were kept at the optimal temperature of 24 °C (T30). Relative values (as means of 3 independent measurements) were normalized to the dry weight (DW) of the samples and IS ribitol. False color imaging was performed on log10-transformed GC-TOF-MS metabolite data. Fold changes were calculated in relation to the respective control (CTR) condition. Significant differences in relation to the respective control (CTR) condition using one-way ANOVA are indicated as ○ p < 0.05. Fishes were kept at the optimal temperature of 24 °C (CTR) and fed a supplemented diet with 1.5, 3, and 6.0% Asparagopsis taxiformis for 30 days (1.5-AT, 3.0-AT, and 6.0-AT, respectively). Metabolites grouped in amino acids and derivatives (AA), sugars and derivatives (sugar phosphate; sugar alcohol; sugar acid) (SS), organic acids (OA), and others (O).
Fishes 10 00350 g001
Figure 2. Partial least squares discriminant analysis (PLS-DA) score plot (A) and PLS-DA correlation circle plot (B) of the primary metabolite profile in fish liver tissues at Phase 1—Supplementation period for 30 days, during which fish were kept at the optimal temperature of 24 °C (T30). Abbreviations: CTR-fish fed a non-supplemented/commercial diet for 30 days at optimal temperature; 1.5-AT-fish fed a supplemented diet containing 1.5% of dried Asparagopsis taxiformis for 30 days at optimal temperature; 3.0-AT-fish fed a supplemented diet containing 3.0% of dried A. taxiformis for 30 days at optimal temperature; 6.0-AT-fish fed with supplemented diet containing 6.0% of dried A. taxiformis for 30 days at optimal temperature.
Fishes 10 00350 g002
Figure 3. Partial least squares discriminant analysis (PLS-DA) contribution plot of the primary metabolite profile in fish liver tissues at Phase 1—Supplementation period for 30 days, during which fish were kept at the optimal temperature of 24 °C (T30). Abbreviations: CTR-fish fed a non-supplemented/commercial diet for 30 days at optimal temperature; 1.5-AT-fish fed a supplemented diet containing 1.5% of dried Asparagopsis taxiformis for 30 days at optimal temperature; 3.0-AT-fish fed a supplemented diet containing 3.0% of dried A. taxiformis for 30 days at optimal temperature; 6.0-AT-fish fed with supplemented diet containing 6.0% of dried A. taxiformis for 30 days at optimal temperature.
Fishes 10 00350 g003
Figure 4. Heatmap visualization representing the changes in relative levels of primary metabolites in fish liver tissues at Phase 2—Marine Heatwave simulation, during which fish were exposed to a category II Mediterranean heatwave (CTR+HW), including a ramp temperature increase period of 8 days (+0.5 °C/day) up to 28 °C [53], followed by a 15-day period of exposure to the peak temperature (i.e., 28 °C, CTR+HW, T53). Relative values (as means of 3 independent measurements) were normalized to the dry weight (DW) of the samples and IS ribitol. False color imaging was performed on log10-transformed GC-TOF-MS metabolite data. Fold changes were calculated in relation to the respective control condition at 24 °C (CTR) (A) and the CTR+HW treatment; i.e., fish fed with non-supplemented/commercial diet and exposed to a category II Mediterranean marine heatwave after a 30-day supplementation period (B). Significant differences in relation to the respective control conditions (i.e., CTR in (A) and CTR+HW in (B)) using one-way ANOVA are indicated as ○ p < 0.05. Metabolites were grouped in amino acids and derivatives (AA), sugars and derivatives (sugar phosphate; sugar alcohol; sugar acid) (SS), organic acids (OA), and others (O). Abbreviations: 1.5-AT-HW-fish fed with supplemented diet containing 1.5% of dried Asparagopsis taxiformis, and exposed to a category II Mediterranean marine heatwave after a 30-day supplementation period; 3.0-AT-HW-fish fed with supplemented diet containing 3.0% of dried A. taxiformis, and exposed to a category II Mediterranean marine heatwave after a 30-day supplementation period; 6.0-AT-HW-fish fed with supplemented diet containing 6.0% of dried A. taxiformis, and exposed to a category II Mediterranean marine heatwave after a 30-day supplementation period.
Fishes 10 00350 g004
Figure 5. Partial least squares discriminant analysis (PLS-DA) score plot (A) and PLS-DA correlation circle plot (B) of the primary metabolite profile in fish liver tissues at Phase 2—Marine Heatwave simulation, during which fish were exposed to a category II Mediterranean heatwave (CTR+HW), including a ramp temperature increase period of 8 days (+0.5 °C/day) up to 28 °C [53], followed by a 15-day period of exposure to the peak temperature (i.e., 28 °C, CTR+HW, T53). Abbreviations: CTR+HW-fish fed with non-supplemented/commercial diet and exposed to a category II Mediterranean marine heatwave after a 30-day supplementation period; 1.5-AT-HW-fish fed with supplemented diet containing 1.5% of dried Asparagopsis taxiformis, and exposed to a category II Mediterranean marine heatwave after a 30-day supplementation period; 3.0-AT-HW-fish fed with supplemented diet containing 3.0% of dried A. taxiformis, and exposed to a category II Mediterranean marine heatwave after a 30-day supplementation period; 6.0-AT-HW-fish fed with supplemented diet containing 6.0% of dried A. taxiformis, and exposed to a category II Mediterranean marine heatwave after a 30-day supplementation period.
Fishes 10 00350 g005
Figure 6. Partial least squares discriminant analysis PLS-DA Contribution plot of the primary metabolite profile in fish liver tissues at Phase 2—Marine Heatwave simulation, during which fish were exposed to a category II Mediterranean heatwave (CTR+HW), including a ramp temperature increase period of 8 days (+0.5 °C/day) up to 28 °C [53], followed by a 15-day period of exposure to the peak temperature (i.e., 28 °C, CTR+HW, T53). Abbreviations: CTR+HW-fish fed with non-supplemented/commercial diet and exposed to a category II Mediterranean marine heatwave after a 30-day supplementation period; 1.5-AT-HW-fish fed with supplemented diet containing 1.5% of dried Asparagopsis taxiformis, and exposed to a category II Mediterranean marine heatwave after a 30-day supplementation period; 3.0-AT-HW-fish fed with supplemented diet containing 3.0% of dried A. taxiformis, and exposed to a category II Mediterranean marine heatwave after a 30-day supplementation period; 6.0-AT-HW-fish fed with supplemented diet containing 6.0% of dried A. taxiformis, and exposed to a category II Mediterranean marine heatwave after a 30-day supplementation period.
Fishes 10 00350 g006
Table 1. Formulation and proximate chemical composition (% dry matter, DM) of the four diets fed to Diplodus sargus juveniles during the experimental trial. Abbreviations: CTR-fish fed a non-supplemented/commercial diet; 1.5-AT-fish fed a supplemented diet containing 1.5% of dried Asparagopsis taxiformis; 3.0-AT-fish fed a supplemented diet containing 3.0% of dried A. taxiformis; 6.0-AT-fish fed with supplemented diet containing 6.0% of dried A. taxiformis.
Ingredients (%)CTR1.5-AT3.0-AT6.0-AT
Fishmeal super prime 125.025.025.025.0
Fish protein concentrate 22.02.02.02.0
Soy protein concentrate 310.010.010.010.0
Pea protein concentrate 43.03.03.03.0
Wheat gluten 56.56.56.56.5
Corn gluten meal 610.010.010.010.0
Soybean meal 44 76.06.06.06.0
Rapeseed meal 86.06.06.06.0
Wheat meal 910.89.37.84.8
Faba beans (low tannins) 106.06.06.06.0
Vitamin and mineral premix 111.01.01.01.0
Choline chloride 50% 120.20.20.20.2
Monoammonium phosphate 131.21.21.21.2
Fish oil 145.05.05.05.0
Soybean oil 157.37.37.37.3
Macroalga Asparagopsis taxiformis 1601.53.06.0
Dry matter, DM (%)94.294.093.994.1
Crude protein, %DM46.046.045.945.7
Crude fat, %DM16.016.016.116.1
Fiber, %DM1.81.92.02.1
Starch, %DM13.712.811.89.9
Ash, %DM6.87.17.48.0
Gross energy, MJ kg−121.021.020.920.8
1 Diamante: 66.3% crude protein (CP), 11.5% crude fat (CF), South America, Pesquera Diamante, Peru. 2 CPSP90: 82.6% CP, 9.6% CF, Sopropêche, France. 3 Soycomil P: 62.2% CP, 0.7% CF, ADM, The Netherlands. 4 Lysamine GPS: 78.1% CP, 8.3% CF, Roquette, France. 5 VITAL: 80.4% CP, 5.8% CF, Roquette, France. 6 Corn gluten meal: 61.2% CP, 5.2% CF, COPAM, Portugal. 7 Soybean meal 44: 43.8% CP, 3.5% CF, solvent extracted, Ribeiro & Sousa Lda., Portugal. 8 Rapeseed meal: 34.3% CP, 2.1% CF, solvent extracted, Ribeiro & Sousa Lda., Portugal. 9 Wheat meal: 11.7% CP, 1.6% CF, Molisur, Spain. 10 Faba beans (low tannins): 24.5% CP, 1.7% CF, Ribeiro & Sousa Lda., Portugal. 11 Vitamins (IU or mg kg−1 diet): DL-alphatocopherol acetate, 100 mg; sodium menadione bisulphate, 25 mg; retinyl acetate, 20,000 IU; DL-cholecalciferol, 2000 IU; thiamine, 30 mg; riboflavin, 30 mg; pyridoxine, 20 mg; cyanocobalamin, 0.1 mg; nicotidin acid, 200 mg; folic acid, 15 mg; ascorbic acid, 1000 mg; inositol, 500 mg; biotin, 3 mg; calcium panthotenate, 100 mg; choline chloride, 1000 mg, betaine, 500 mg. Minerals (g or mg kg−1 diet): cobalt carbonate, 0.65 mg; copper sulphate, 9 mg; ferric sulphate, 6 mg; potassium iodide, 0.5 mg; manganese oxide, 9.6 mg; sodium selenite, 0.01 mg; zinc sulphate, 7.5 mg; sodium chloride, 400 mg; calcium carbonate, 1.86 g; excipient wheat middlings. Premix Lda., Portugal. 12 Choline chloride 50%: ORFFA, The Netherlands. 13 Windmill AQUAPHOS: 26% phosphorus, ALIPHOS, The Netherlands. 14 Fish oil: 98.1% CF, 16% EPA, 12% DHA, Sopropêche, France. 15 Soybean oil: 98.6% CF, JC Coimbra, Portugal. 16 Asparagopsis taxiformis: SeaExpert Company, Angústias dock, Faial Island, Azores, Portugal.
Disclaimer/Publisher’s Note: The statements, opinions and data contained in all publications are solely those of the individual author(s) and contributor(s) and not of MDPI and/or the editor(s). MDPI and/or the editor(s) disclaim responsibility for any injury to people or property resulting from any ideas, methods, instructions or products referred to in the content.

