Article

Quantifying Age and Growth Rates of Gray Snapper (Lutjanus griseus) in Mosquito Lagoon, Florida †

1
Department of Biology, University of Central Florida, 4000 Central Florida Blvd., Orlando, FL 32816, USA
2
Fish and Wildlife Research Institute, Florida Fish and Wildlife Conservation Commission, 100 8th Ave. SE, St. Petersburg, FL 33701, USA
*
Author to whom correspondence should be addressed.
This work is a part of the Master of Science thesis of the first author Wei Chen. Master of Science Program at University of Central Florida, Orlando, FL 32816, USA.
Fishes 2025, 10(7), 336; https://doi.org/10.3390/fishes10070336
Submission received: 1 June 2025 / Revised: 26 June 2025 / Accepted: 2 July 2025 / Published: 9 July 2025
(This article belongs to the Special Issue Habitat as a Template for Life Histories of Fish)

Abstract

Gray snapper (Lutjanus griseus; Family: Lutjanidae) local habitat preferences have been assessed, but the biotic and abiotic factors influencing age and growth rates in Mosquito Lagoon, Florida, have not been quantified. To address this knowledge gap, the goal of this study was to estimate mean age and growth rate of gray snapper, and use generalized linear mixed models to investigate if prey and/or other environmental factors (e.g., abiotic/biotic conditions, time, location, or habitat restoration status) impact size at both the lagoon- and habitat-specific scales. Age data were extracted via otolith microstructural analyses, and incorporated with size into a lagoon-scale linear growth model. Based on microstructural analyses, mean age of gray snapper at the lagoon scale was 175 ± 66 days (range = 56–350 days). The results indicate the most common life stage of gray snapper in Mosquito Lagoon is juveniles, with living shoreline habitats having a greater proportion of relatively young juveniles (111 ± 36 days) and oyster reef habitats having a greater proportion of relatively older juveniles (198 ± 58 days). The estimated growth rate was 0.43 mm/day. Body mass and body length were correlated positively with habitat quality and lagged salinity levels. Hence future studies should strive to characterize benthic habitat characteristics, and investigate biotic and abiotic factors that potentially influence gray snapper growth. Collectively, this study increases our understanding of environmental drivers affecting juvenile gray snapper development and shows that the restoration of benthic habitats can produce conditions conducive to gray snapper growth. The age-, size-, and habitat-specific growth rates of juveniles from this study can be incorporated into stock assessments, and thereby be used to refine and develop more effective ecosystem-based management strategies for gray snapper fisheries.
Key Contribution: Gray snapper in Mosquito Lagoon, Florida, are predominantly in the juvenile stage, with mean growth rates of 0.43 mm/day.

1. Introduction

Gray snapper (Lutjanus griseus), also known as mangrove snapper, is a common reef fish found in the western Atlantic Ocean, broadly ranging from North Carolina, USA, south through the Caribbean Sea to Brazil [1]. In the Southeastern United States, spawning occurs in offshore habitats such as coral reefs from June to September, with peak spawning in August [2,3]. Ontogenetic transitions in the gray snapper life cycle are related to size, moving from inshore nursery areas to offshore structured habitats with age [4,5,6]. The planktonic larval duration of L. griseus larvae depends on temperature and local oceanographic currents [7] but is generally around 25 days in length [3,8]. During this time, larvae are dispersed along the eastern coast of the US via the Gulf Stream, eventually settling in inshore benthic habitats such as seagrass meadows to develop as juveniles [2,5]. Within 1–2 years of settlement to inshore benthic habitats, juveniles begin ontogenetic migrations, moving farther offshore to deeper water coral reefs and other hard bottom benthic habitats where they eventually spawn, completing the life cycle [4,8,9]. Sexual maturity occurs at 175–180 mm standard length (SL) or approximately three years of age [10].
Multiple studies have quantified gray snapper growth rates using otoliths [8,11,12]. Gray snapper growth parameters were quantitively similar among studies conducted along the coasts of east Florida, southern Louisiana, and Southeast Texas, suggesting gray snapper growth is relatively consistent across this geographic range [11,13,14]. However, Denit & Sponaugle [3] found that gray snapper grow faster at low latitudes, indicating environmental factors (e.g., water temperature, location, etc.) might affect region-specific gray snapper growth. Juvenile gray snapper collected from seagrass beds support the idea of inshore estuaries as nurseries for juvenile snapper [3,4,8]. A recent study in Texas found adult gray snapper (i.e., individuals 3+ years of age) were more abundant than juvenile gray snapper at offshore reefs and other large structures such as oil rigs, supporting previous findings of adult gray snapper residing in offshore habitats [11,13,14]. Age and growth data are important for stock assessment models to determine catch limits and ensure the long-term stability of regional fish populations; for gray snapper in Mosquito Lagoon, Florida, the SouthEast Data, Assessment, and Review (SEDAR) process is used [15,16].
A number of studies have investigated the effect of environmental factors on snapper (Lutjanidae) size. For common bluestripe snapper (Lutjanus kasmira) otolith morphological development was influenced by environmental factors such as water temperature, depth, and substrate type [17]. In another study, mangrove red snapper (L. argentimaculatus) placed in hard-structured habitats were larger when compared to individuals placed in habitats with no structure [18]. Additionally, juvenile spotted rose snapper (L. guttatus) had reduced metabolic functions (i.e., reduced sizes) when deprived of food in a controlled lab environment [19]. Weight-specific feeding rates and sizes were shown to increase with temperature and salinity for gray snapper [20]. Environmental factors from Wuenschel et al. [20] correspond with Denit & Sponaugle [3], who found gray snapper generally grew faster in coastal habitats at relatively lower latitudes. Together, these studies suggest fish of similar length but different ages may be a result of differences in environmental conditions and prey availability.
In Mosquito Lagoon, Florida, habitat preferences of gray snapper have been studied previously [21,22,23,24]; however, age structure, and the biotic and abiotic factors influencing size and growth in this region have not been quantified. To address this knowledge gap, this study aims to estimate the mean age and growth rate of gray snapper in Mosquito Lagoon, and investigate if prey and/or other environmental factors (abiotic/biotic conditions, time, and location/site status) impact size at the lagoon and habitat-specific scales. Larger or faster growth of individuals could be indicative of greater prey (fish and macroinvertebrate) abundance and/or habitat quality (water temperature, salinity, etc.) [25,26,27,28,29]. Likewise, relatively smaller individuals could be indicative of lower prey abundance and/or habitat quality, such as water parameters that limit optimal size for juvenile gray snapper [25,26,27,28,29]. Overall, the contribution of gray snapper age and growth data from Mosquito Lagoon would fill knowledge gaps in age/size-related transitions for gray snapper populations in this region [3,8,14,23,24]. To investigate these topics, this study addresses the following questions:
  • What are the mean ages and growth rates of gray snapper in Mosquito Lagoon?
  • Do abiotic and biotic factors, time (i.e., sampling date), and location (i.e., site location/habitat type) influence size and growth rates of gray snapper in Mosquito Lagoon, and do these factors differ between oyster reef and living shoreline habitats?

2. Materials and Methods

2.1. Study Area

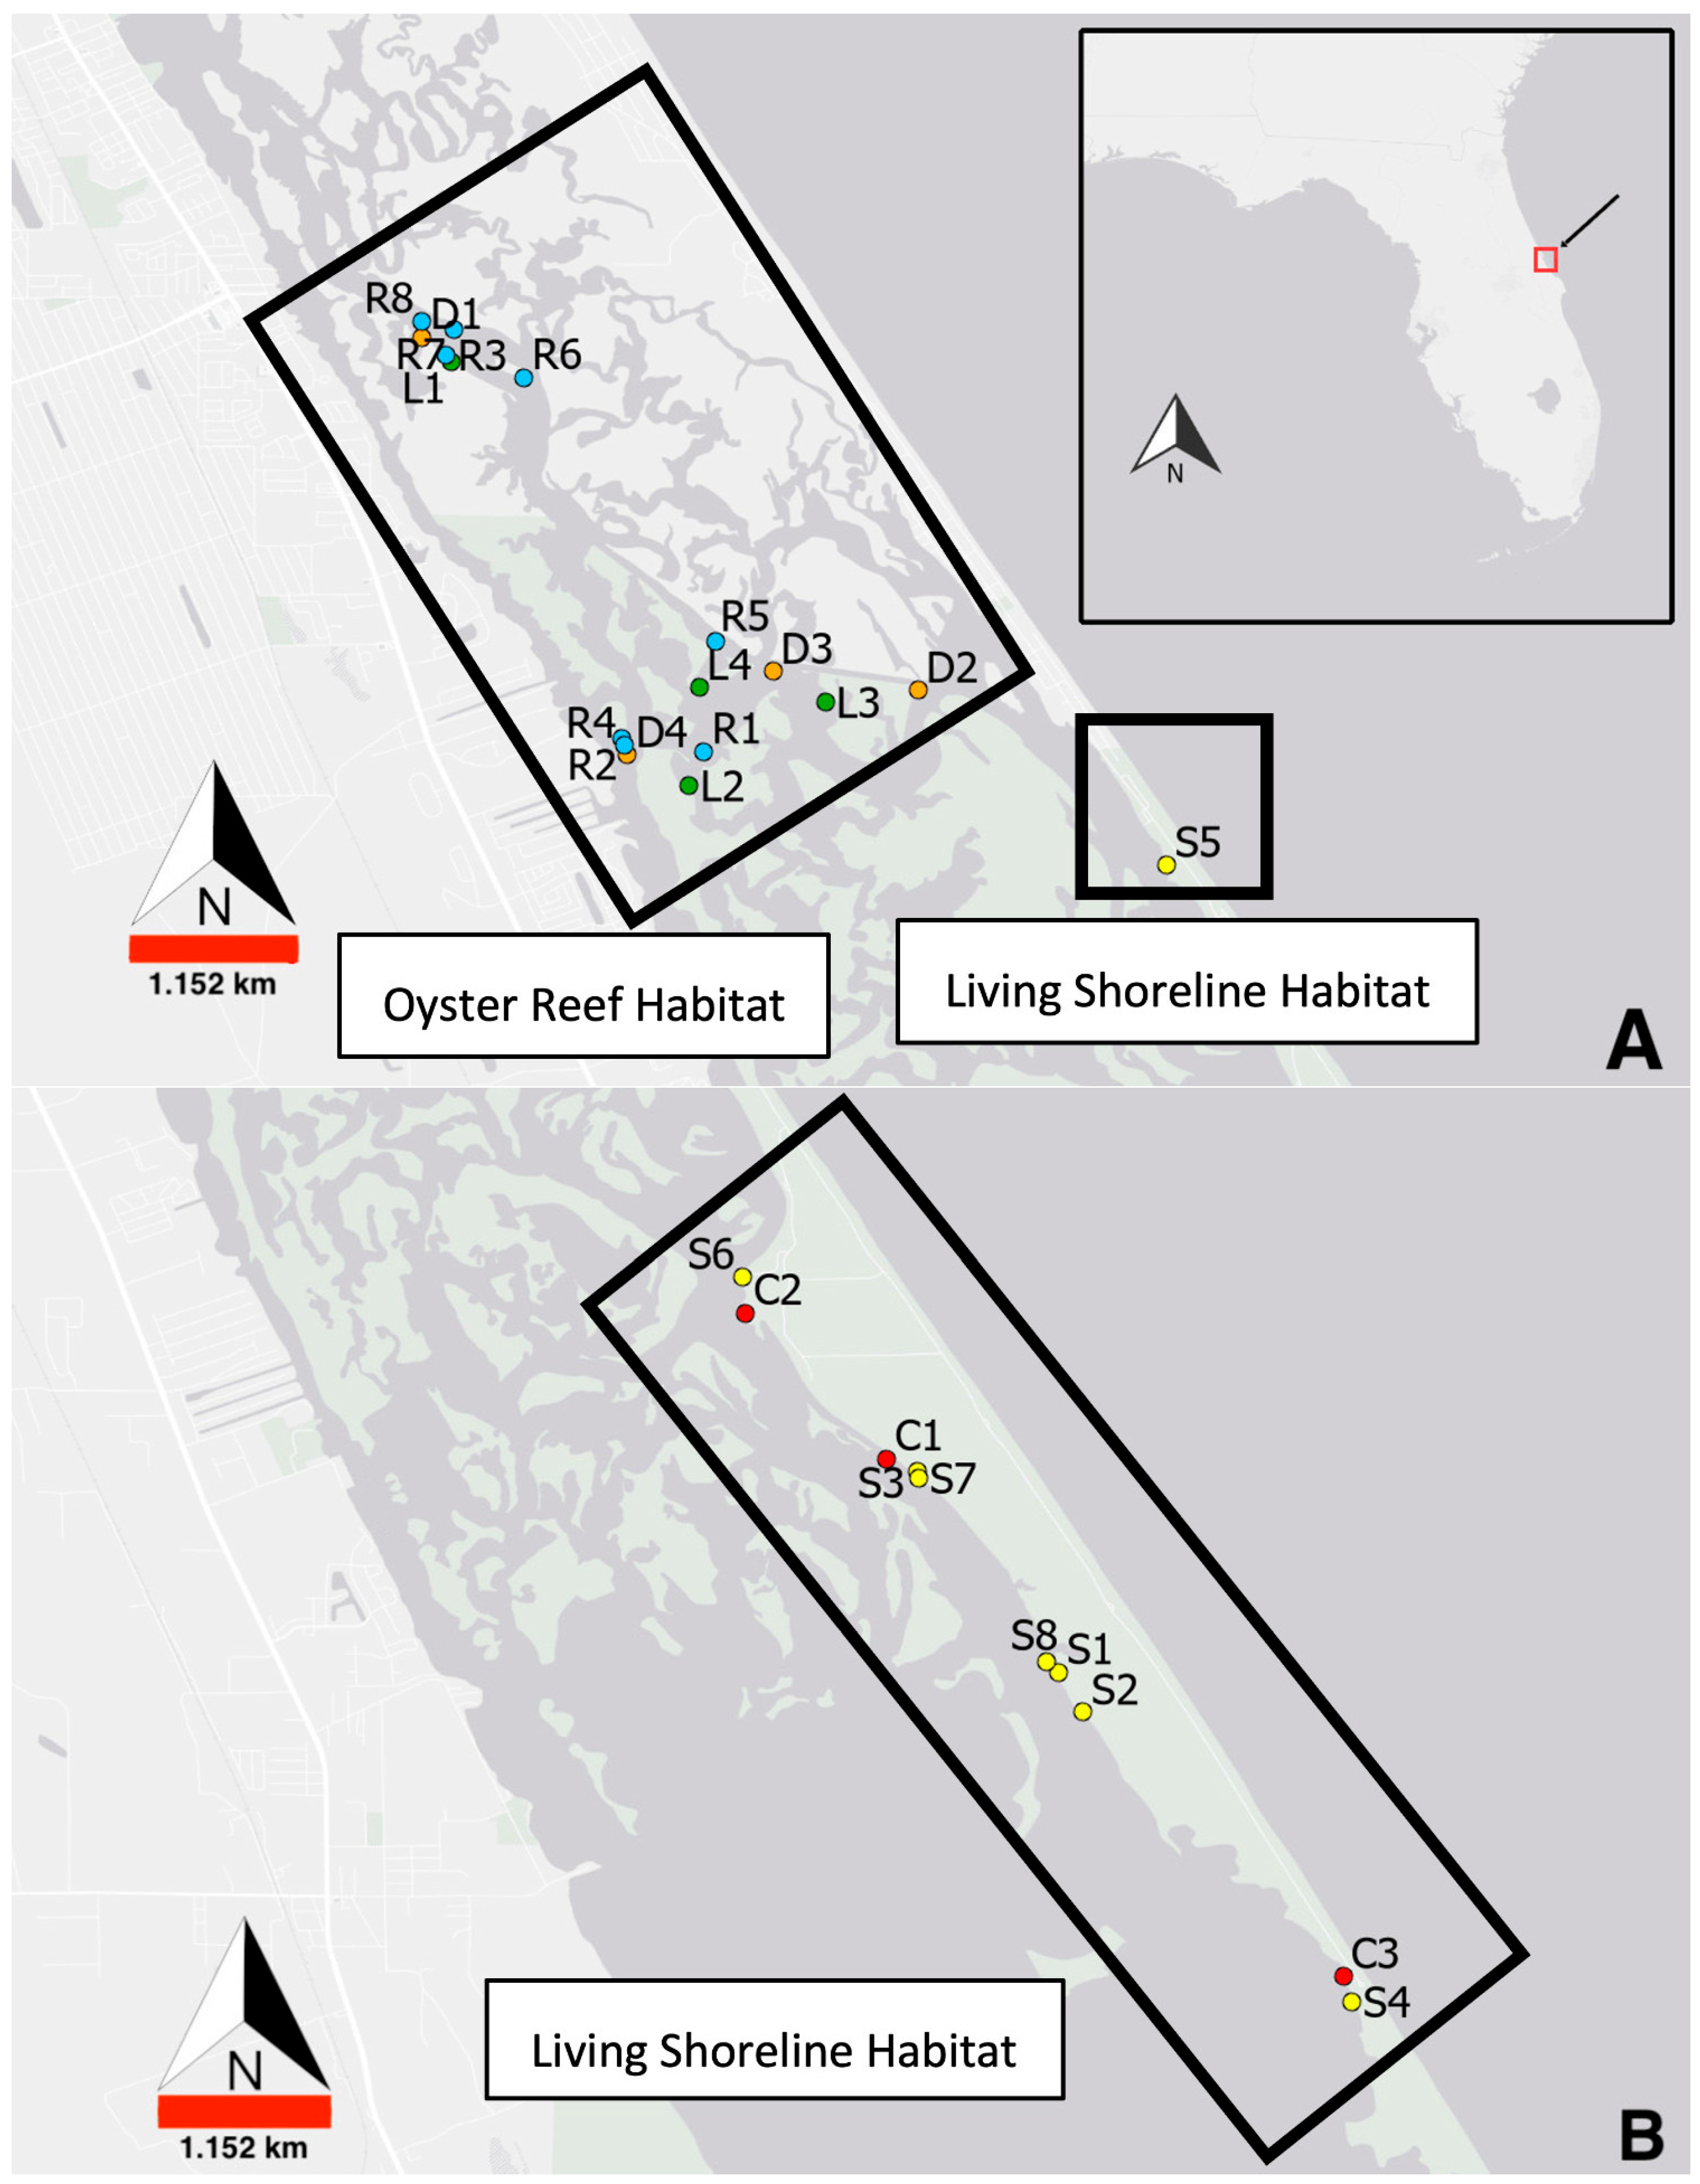
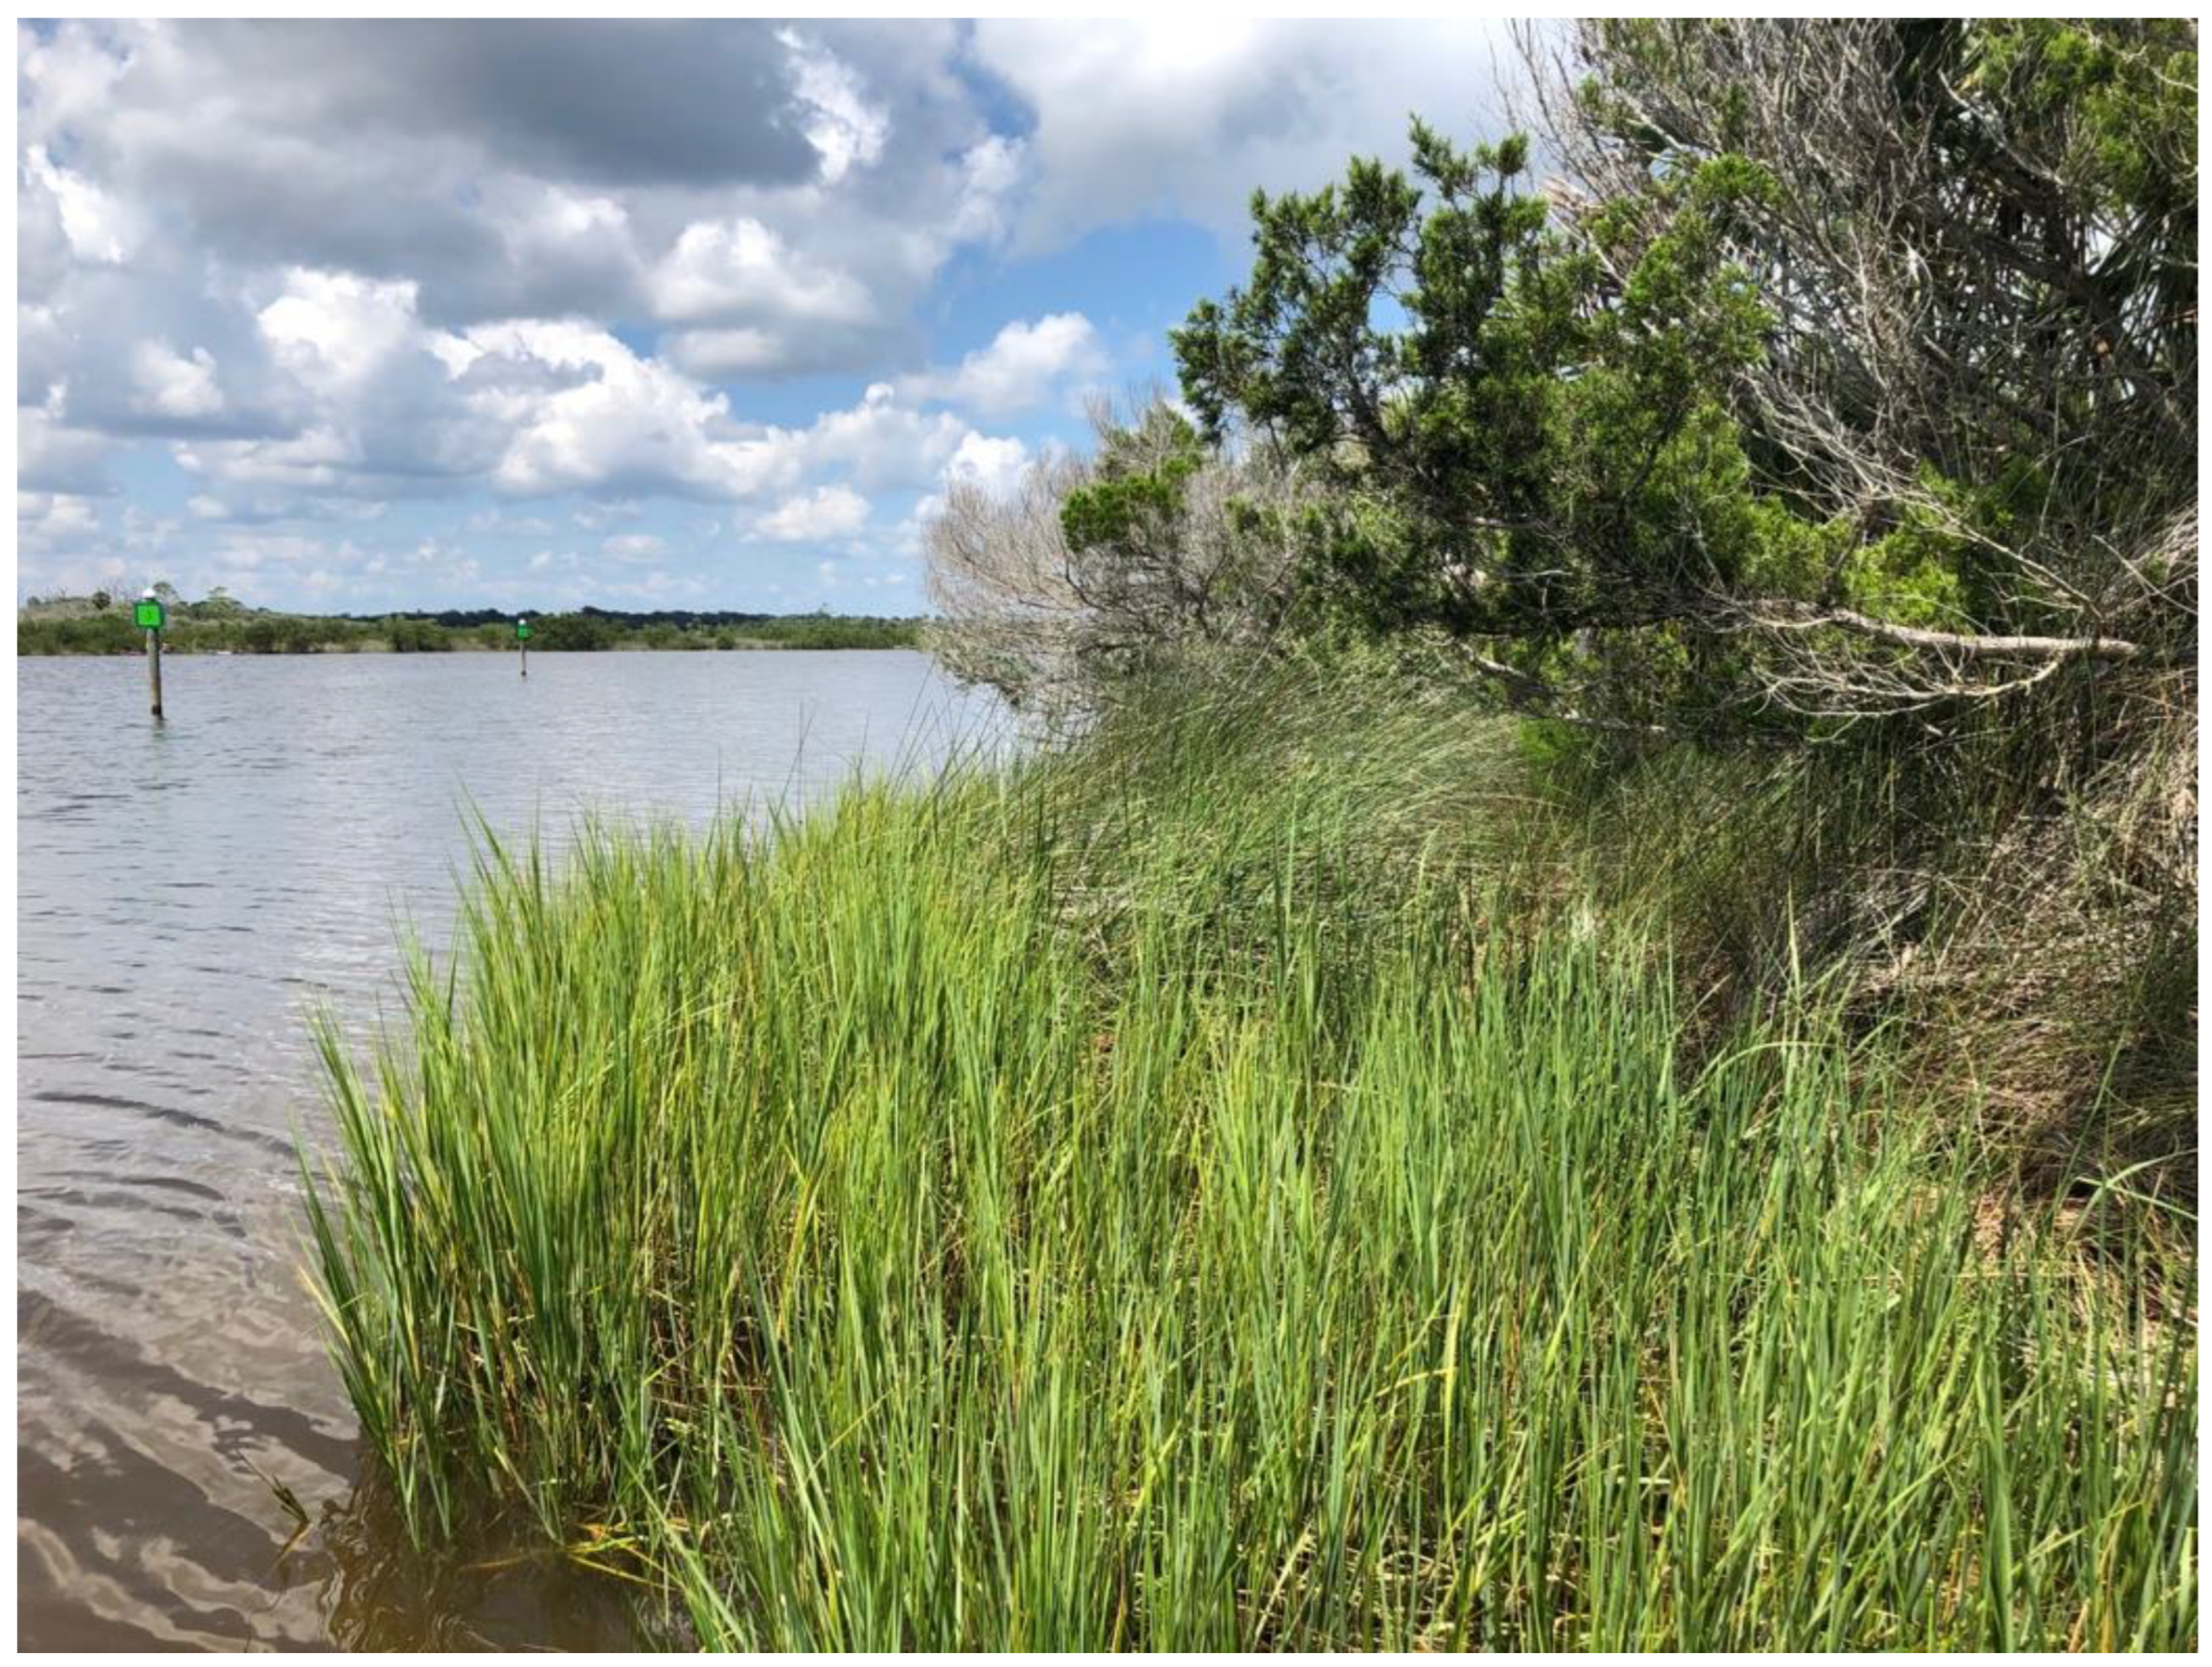
Mosquito Lagoon is a shallow coastal lagoon known for its high biodiversity and variety of aquatic habitats [22,26,29,30,31,32,33]. The lagoon is the northernmost subbasin of Florida’s Indian River Lagoon and is connected directly to the Atlantic Ocean via Ponce de Leon Inlet (Figure 1) [26]. Mean monthly water temperatures range from a winter low of 14.1 °C to a high of 37.7 °C in summer, and salinity ranges from 24 to 45 ppt [26]. Samples were collected as part of a larger study examining the effect of benthic habitat (oyster reef and living shoreline) restoration on macroinvertebrate and fish populations and communities [27,28,34,35]. Oyster reefs (Crassostrea virginica) are intertidal and subtidal habitats that serve as nursery habitat for juvenile fish by supporting prey populations and providing refugia from predators [22,32,33,36]. Oyster reef sites were separated into three categories: “live” reefs (4 positive control/natural oyster reefs), “dead” reefs (4 negative control/oyster shell mounds), and “restored” reefs (8 dead reefs undergoing restoration efforts). Living shorelines are nearshore habitats that combine subtidal breakwaters with native vegetation including marsh grass (Spartina alterniflora) and mangroves (Rhizophora mangle, Laguncularia racemosa, and Avicennia germinans); living shorelines also provide nursery habitat to juvenile fish [22,23,37,38]. Living shoreline sites were separated into two categories: “control” shorelines (3 positive control shoreline sites with no restoration efforts) and “stabilized” living shorelines (8 control shorelines undergoing restoration efforts as described above).

2.2. Sample Collection

Gray snapper were collected following Loch et al. [22], Lewis et al. [26], and Troast et al. [32]. From May 2017 to June 2020, gray snapper were collected from 27 sites in the Indian River Lagoon (Figure 1, Figure 2 and Figure 3). Each snapper was individually weighed (mass in g) and measured (standard length (SL) and total length (TL) in mm). Fish sampling occurred in daylight, was initiated 2 weeks before restoration (May 2017), and continued post-restoration on weeks 1, 2, 4, 6, 8, and 12. After the 12th week, sampling continued every 12 weeks through June 2020 (i.e., quarterly for 2–3 years following restoration; Loch et al. [22]). For each sampling period, fish were collected from all sites within a 12–36 h time window.
Three types of equipment were used to sample the maximum number of fish and macroinvertebrates along a depth gradient spanning oyster reefs and living shorelines. From shallowest to deepest: (1) 0.6 m × 0.6 m square-framed PVC lift nets with 0.5 m deep mesh nets (2 mm mesh size) placed at the low and high tides lines, (2) a 21.3 m × 1.8 m center bag seine with a 3.175 mm mesh targeting the subtidal zone immediately adjacent to the sampling site (i.e., from ~10 cm–1.5 m water depth), and (3) a 2.1 m-wide otter trawl with 33 cm × 50 cm doors, 3.5 m head-rope length, 6 mm heavy delta mesh body, and 2 mm delta mesh in the cod end to sample the relatively deeper subtidal habitat immediately offshore of the area being seined (i.e., waters > 1.5 m deep). For seines, the net was pulled parallel to shore for ~12 m and the inshore pole of the seine was kept 0.5 m from the edge of each oyster reef/living shoreline. Depth-wise, seining occurred in shallow subtidal zones with water depths typically less than 1.2 m. For the relatively deep otter trawl, towing occurred at ~2 m/s as close to the shoreline as possible, trawling length and duration was determined by individual site length. For every sampling event, collected fish and macroinvertebrates were transferred to a sorting tub with natural seawater. After the size and weight of target species (L. griseus) were recorded, they were humanely euthanized, stored on ice, and returned to the lab where they were stored in a −20 °C freezer until further processing. All prey macroinvertebrates (ex. Alpheus heterochaelis, Petrolisthes armatus, etc.) were collected using lift nets, and samples identified and enumerated to calculate macroinvertebrate richness and abundance (following [33]); all prey fish (e.g., Anchoa mitchilli, Diapterus auratus, Harengula jaguana, etc.) collected with seines were identified and tallied to calculate fish species richness and abundance. All samples were collected in accordance with University of Central Florida Institutional Animal Care and Use Committee protocols (IACUC Permit #16-15W).
Abiotic data were collected during each sampling event. A YSI ProDSS multiparameter probe was placed ~0.5 m beneath the water surface at each site, collecting site-specific records of water temperature (°C), dissolved oxygen (DO, mg/L), and salinity (ppt). Secchi depth (m) was used as a proxy for water clarity. Air temperature (°C), barometric pressure (mm Hg), and wind speed (km/h) were collected separately from the nearest National Oceanic and Atmospheric Administration (NOAA) National Center for Environmental Information station, located approximately 15 km north of Mosquito Lagoon (29.05417° N, 80.94833° W). Local tide table data (Packwood Place, FL, USA) and lunar data were taken from NOAA Tides and Currents [39]. Additionally, to investigate if previous environmental conditions affect gray snapper size (following Black et al. [40] and Herdter et al. [41]), historic water property data (water temperature, salinity, and dissolved oxygen) were collected from a National Park Service (NPS) water quality monitoring station in the northeast side of Mosquito Lagoon (28.9268° N, 80.82503° W) [42], and averaged across a 4-week period prior to sampling date. For the few instances where NPS water property data were missing, a simple moving average was used to calculate mean conditions for the data gaps.

2.3. Otolith Processing

Sagittal otolith extraction was completed prior to the start of this study using the open-the-hatch extraction method. Generally, sagittal otoliths were mounted, sectioned and polished following Secor et al. [43] and VanderKooy et al. [44]. One of the sagittal otoliths was randomly selected, marked for their core on the distal side, and embedded in an epoxy resin.
After drying, otoliths were thin-sectioned using a Buehler Isomet low-speed saw, and then mounted to slides. Once mounted, the section was polished on both sides using 320, 400, and 800-grit sandpaper to reveal the otolith’s core and daily growth rings. Specifically, polishing with lower grit sandpaper revealed the general core region of each otolith, and polishing with higher grit sandpaper increased the visibility of each otolith’s core and daily growth rings. When the otolith’s core and daily growth rings became readable, polishing ceased and the section was permanently affixed to the slide. If the sample’s core and rings were deemed unreadable, the otolith sectioning and polishing process was repeated with the other sagittal otolith, if available.

2.4. Otolith Microstructural Analyses

When sectioning and polishing were complete, otolith microstructural analysis was used to estimate age of each gray snapper. Following Denit & Sponaugle [3] and Allman & Grimes [8], otolith increments for pre-reproductive gray snapper were counted in days. Under a Nikon compound microscope (Nikon Corp., Tokyo, Japan) at 40× magnification, daily growth rings were counted from the core to the edge along the dorsal side of each otolith three times by a primary reader (the current study’s first author; Figure 4). To address for quality assurance/quality control (QA/QC) procedures, a secondary reader (the current study’s second author) aged a random subsample of the study collection, and calculated a mean age from three reads. Average percent error (APE) was calculated to assess aging precision for the primary reader and between readers. Mean ages from each reader were shared after the second age was completed to prevent bias in data collection. Both mean values were measured for APE, and the following equation was used to create a final median age, Final Age = |VA + VB|/2, where VA equals Mean Age A and VB equals Mean Age B. A smaller APE indicates higher precision, with an APE of 5% or less indicating highly precise aging (following Beamish & Fournier [45] and Campana [46]). If APE was more than 10% between mean ages, discrepancies were reviewed to reach a consensus final age. Common aging protocol calls for a 20% overlap of the total sample size between readers for QA/QC, with the expectation of a 10% or less APE, thus indicating aging precision and protocol replicability (following Campana [46]).

2.5. Data Analyses

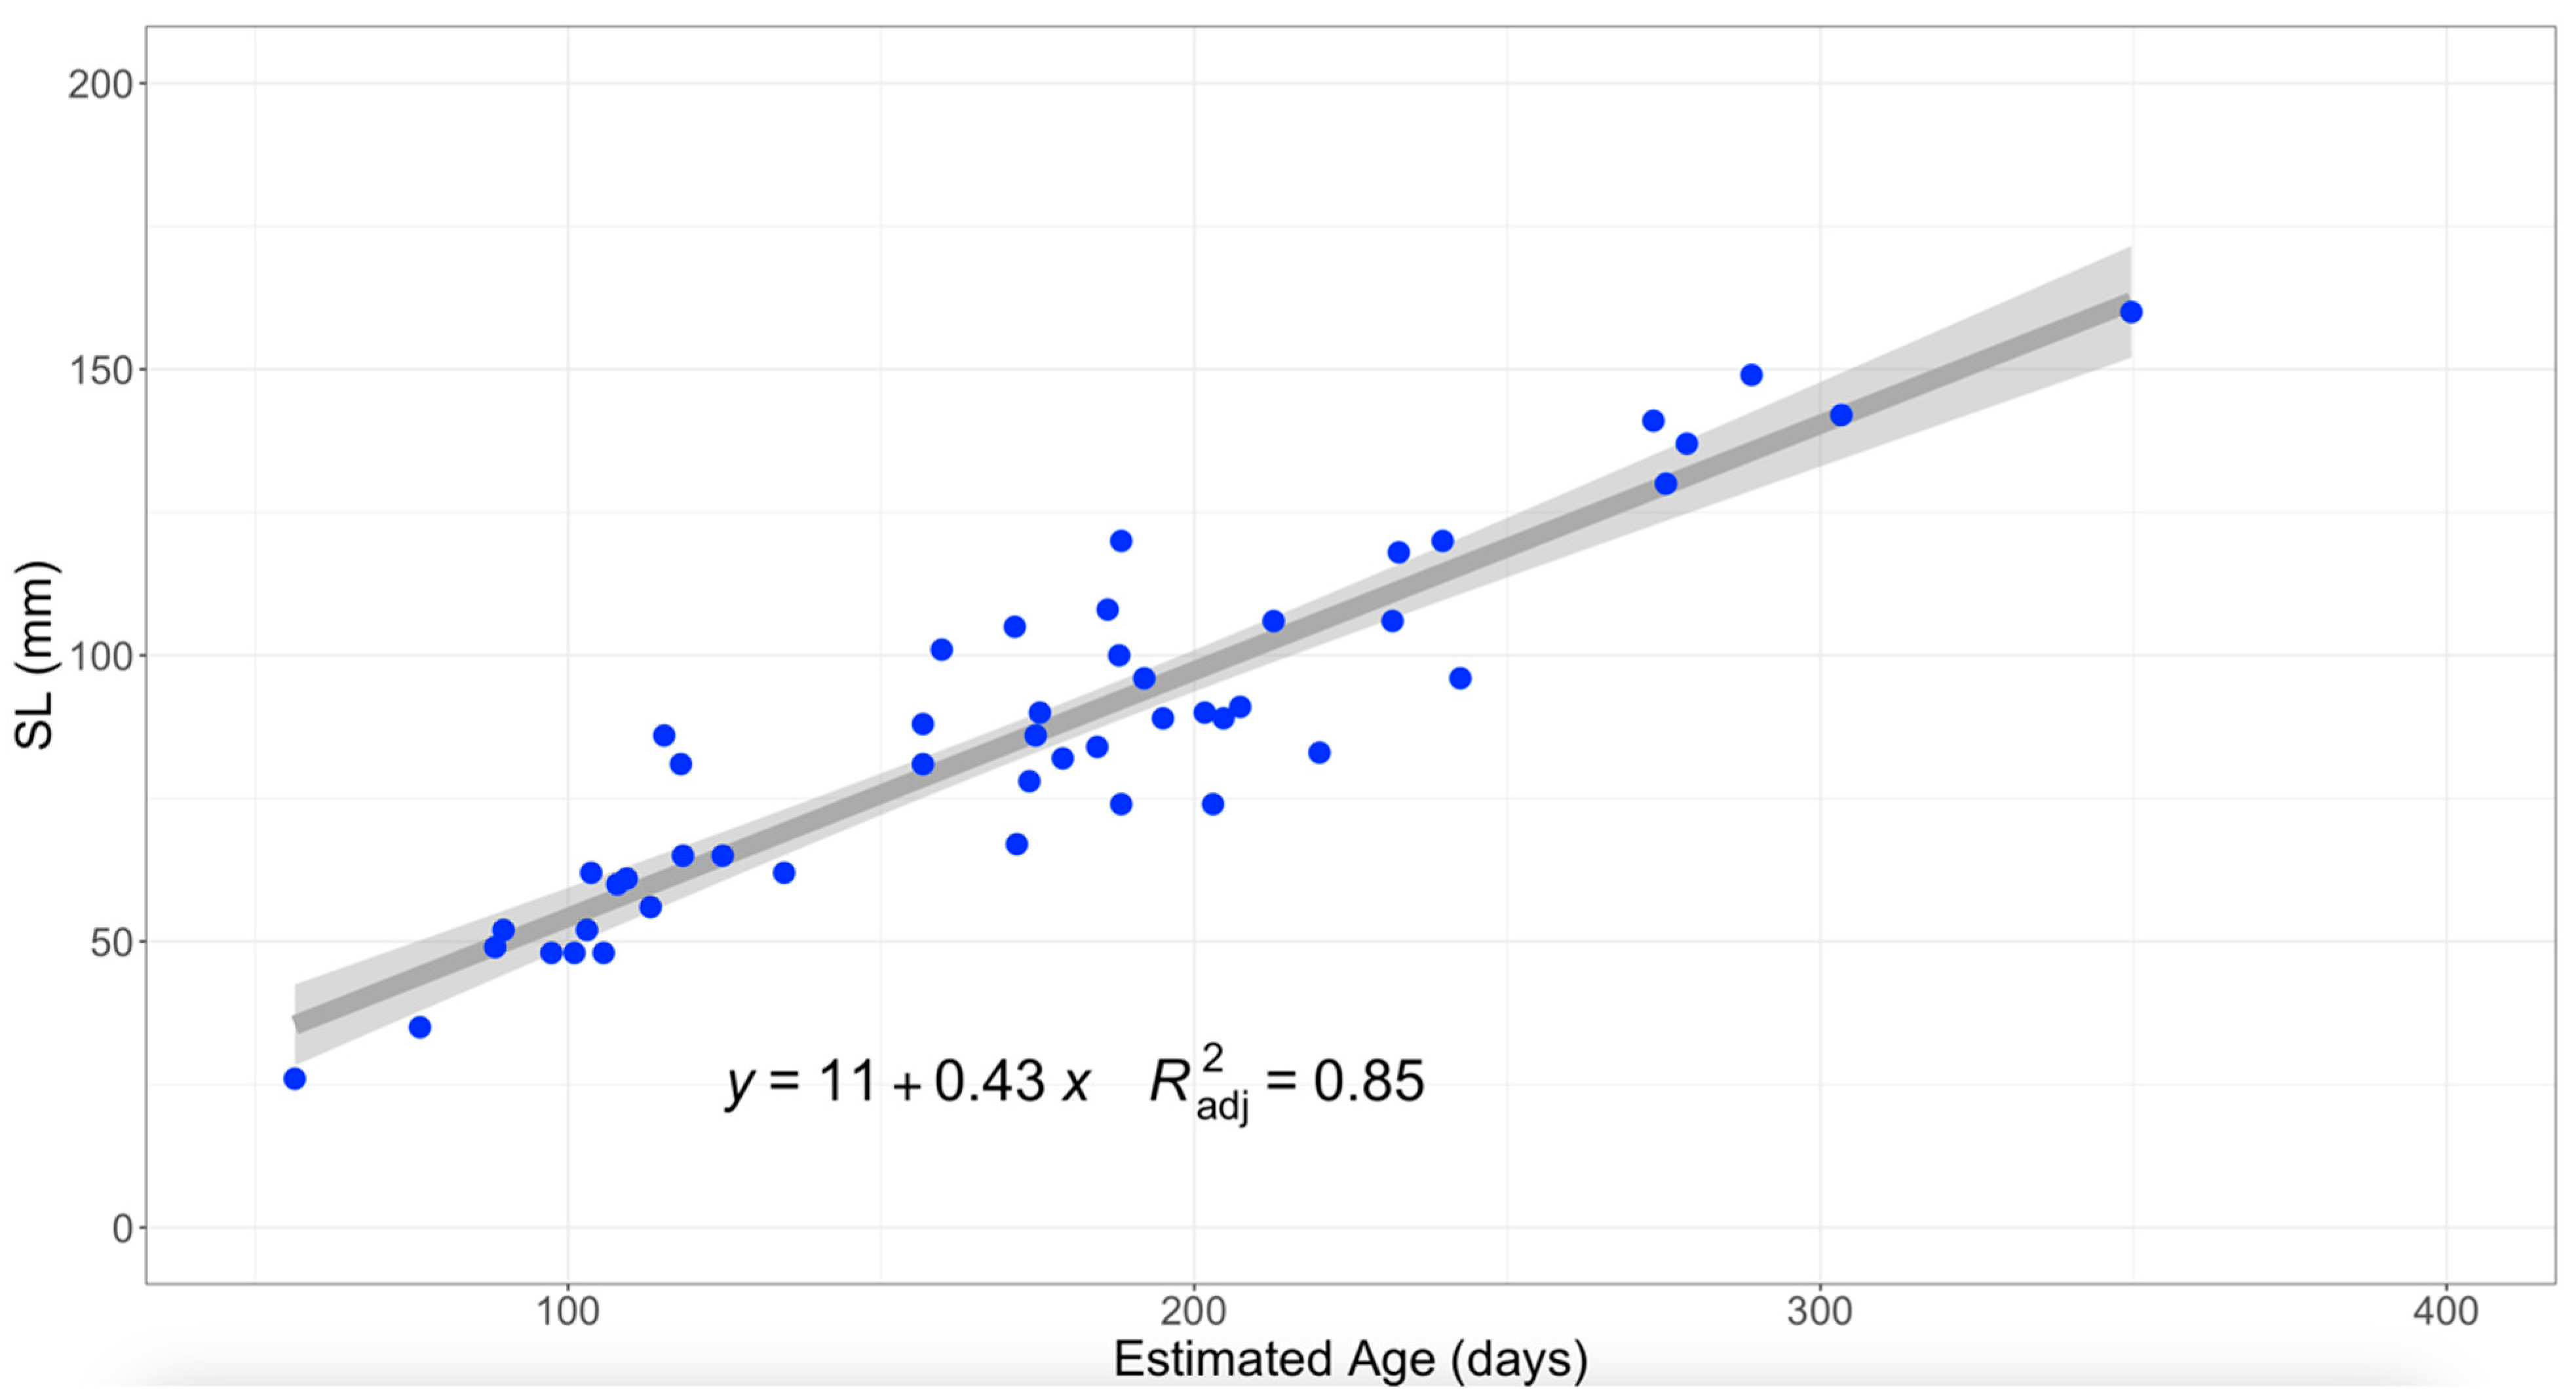
All statistical analyses were run in R version 4.1.1 [47]. Preliminary model comparisons found a linear growth model to be the most parsimonious growth model (AICc weight = 0.57 (57%)) when compared to the von Bertalanffy, Gompertz, and logistic functions (Table A1 and Table A2 in Appendix A; bblme package; FSA package). To compare results with studies also modeling gray snapper length-at-age using a linear growth function [3,8], age (days) and standard length (mm) of individuals were recorded and integrated into a lagoon-scale linear growth model to determine daily, weekly, and monthly growth rates. Using the R package stats version 4.3.2 [48], daily growth rate was calculated with the following linear equation, y = mx + b, where y equals mean length-at-age (SL), m equals daily gray snapper growth (mm/day), and b equals theoretical age when length is 0 mm SL. The model function was then plotted via the R package ggplot2 version 3.5.1 [49]. After growth parameters were calculated/plotted, an inverse function of the linear growth model was used to calculate enumerated age for all gray snapper (using gray snapper SL; following similar methodology from Mackay & Moreau [50]), x = (y − b)/m. After age data were recorded, generalized linear mixed models (GLMM) were developed to determine the relative importance of factors influencing daily growth rates. Moving forward, the variable incorporating age from gray snapper otoliths was labeled as “enumerated age,” and the variable incorporating both enumerated age and age calculated from the above linear growth function was labeled as “calculated age.” Standard length, mass, enumerated or calculated age, abiotic and biotic factors (see below) were fixed variables, while time (sampling date) and location (site location/ID) were random variables in GLMMs. Site type (ex. dead oyster reefs, control living shorelines, etc.) was also included as a fixed-effect variable in all model scales to investigate site-specific differences in growth. Calculated age was analyzed on all model scales (following Fischer et al. [13] and Anderson et al. [14]).
Mass was analyzed on all model scales to determine if it was a more parsimonious biological variable than calculated age, and to investigate whether gray snapper size and environmental factors or trophic position correlate with gray snapper mass [18,19,20]. All scales of model analyses involving standard length and mass had both variables log-transformed (following Fischer et al. [13] and Anderson et al. [14], Kimura [51], and Pardo et al. [52]). Biotic factors were: fish/macroinvertebrate abundance and species richness [22,53,54]. Abiotic factors were: water temperature, dissolved oxygen (DO), salinity, air temperature, barometric pressure, and wind speed, in addition to the lagged 4-week averages for each stated water property [20,22,26,40]. Wind speed was added into the lagoon and habitat-scale models as it correlated with non-lagged dissolved oxygen and temperature in models. R package glmmTMB version 1.1.4 was used to run the GLMMs [55]. To determine the best fit model for each GLMM, alternative model variables (and their respective null models) were compared using the Akaike Information Criterion (AIC) with the R package bblme version 1.0.25 [56]. AIC determined the most parsimonious, probable models as having the highest weight (AICw) and lowest AICc score. Model variables had a clear effect if they had a scaled effect size of p < 0.05, meaning there were no zeros in each 95% confidence interval. Final model assumptions, collinearity, and overdispersion were analyzed with the R package performance version 0.10.8 [57]. R package performance version 0.10.8 was also used to determine each final GLMM’s adjusted R2, where marginal R2 accounts for fixed effects and conditional R2 accounts for both fixed and random effects [57].
Preliminary results were conducted to guide model creation for this study. In particular, the most parsimonious models for size included sampling date as a random effect. For all model scales, the Gaussian family (with “identity” as the model link) was used as the model family. Additionally, after testing model assumptions, the slanted data point distribution in the normality of residuals plot suggests issues with model fit, along with non-linear outliers found in the linearity and homogeneity of variance plots for all model scales. Despite these issues, most data points in the linearity and homogeneity of variance plots followed horizontally linear trendlines, indicating the data are acceptable for analyses with the GLMMs. Additionally, low collinearity was detected for the predictor variables, and the random effects normality plot was found to be relatively consistent.

3. Results

3.1. Age and Growth Analyses

From 2017 to 2020, 241 gray snapper were collected from 27 sites in Mosquito Lagoon (Table 1). Almost all gray snapper were collected via seines (239 individuals, around 99.2% of all captures; 1 sample was collected by lift net and 1 sample was collected using an otter trawl). From oyster reefs, 136 samples were collected: 35 from degraded dead reefs, 37 from positive control live reefs, 45 from oyster reefs restored in 2017 (sites R1-R4), plus 19 from reefs restored in 2018 (sites R5–R8). For living shorelines, 105 samples (living shoreline GLMM) were collected from sites that were live positive control sites (n = 31) or stabilized shorelines (n = 74). A total of 49 otoliths from the 241 gray snapper were processed to enumerate daily age estimates. Of those 49 otoliths, 36 were collected at oyster reefs: 8 from dead reefs, 11 from live reefs, 13 from reef sites R1–R4, and 4 from reef sites R5–R8. The remaining 13 samples were collected at living shorelines: 5 from control shoreline sites and 8 from stabilized shoreline sites. Despite this being a relatively small sample size (i.e., 49 of 241 individuals), these otolith samples represent gray snapper collected across all site types used in this study.
The mean (±sd) of enumerated age (i.e., otolith-derived age data) for gray snapper (L. griseus) at the lagoon scale was 175 ± 66 days, and the range was 56–350 days (Table 1). The mean (±sd) of SL for the same samples was 86.5 ± 30.6 mm, and the range was 26.0–160.0 mm (Table 1).
The 16 randomly selected gray snapper otoliths for QA/QC had an average percent error (APE) of 5.2%, with an APE range of 0.3–12.0%, indicating that between-reader agreement was generally high for aged gray snapper otoliths from Mosquito Lagoon (Table 2) [46]. The 29% overlap between the primary and secondary reader met the common threshold for precision testing, and 14 of the 16 samples had an APE below 10%, which indicated high precision of age data included in analyses. Additionally, the mean APE (2.0%) and range (0.4–5.0%) for all 49 otoliths aged by the primary reader further demonstrate high precision for age data in the current study (Table 2) [46]. However, it should be noted that the presence of an annulus in 9 of the 16 otoliths affected interpretations of age estimates between both readers, where recorded enumerated age data was found to be relatively lower for the primary reader compared to the secondary reader. Specifically, mean enumerated age of the 16 individuals (primary vs. secondary reader) used in QA/QC procedures was 170 ± 48 days vs. 188 ± 58 days, and enumerated age range was 103–290 days vs. 106–317.
As a result of the sample size of gray snapper otoliths (n = 49), the growth model created for the current study was limited to the lagoon-scale (further discussed in Section 4.1 of the Discussion). The linear growth function parameters were m = 0.43 and b = 11, with relatively good model fit (R2adj = 0.85; Figure 5). Using this line of best fit, the growth rate calculated for Mosquito Lagoon’s gray snapper was 0.43 mm/day.
For analyses at the lagoon, oyster reef, and living shoreline-scale (Table 3) models containing log-transformed mass were the most parsimonious (Table 3, Table A3, Table A4 and Table A5 in Appendix B). For the lagoon and living shoreline-scale models, control living shorelines were each model’s intercept. For the oyster reef model, dead oyster reefs were the model’s intercept.
Lagoon and habitat-scale models had similar parsimonious variables but differences in variable combinations. Sampling date as a random effect had little to no effect on increasing model fit (e.g., lagoon-scale marginal R2 = 0.98; lagoon-scale conditional R2 = 0.99; Table 3), but its inclusion in all model scales aided in creating more plausible models (e.g., lagoon-scale model AICc weight = 0.70 (70%); Table 3). On the lagoon scale, gray snapper SL was positively correlated with mass (p < 0.001), lagged salinity (p = 0.001), and oyster reefs restored in 2017 (p = 0.022), implying larger-sized gray snapper were captured at oyster reefs restored in 2017 than at control living shorelines (conditional R2 = 0.99; Table 3). For the oyster reef model, SL was correlated with mass (p < 0.001) and oyster reefs restored in 2017 (p = 0.001), indicating relatively larger gray snapper were captured at oyster reefs restored in 2017 than at dead oyster reefs (conditional R2 = 0.99; Table 3). For the living shoreline model, SL was positively correlated with mass (p < 0.001), and lagged salinity (p = 0.005; conditional R2 = 0.99; Table 3). In general, mass had a clear relationship with SL at the lagoon and habitat scales. Location and site status (particularly restored habitats) were favored in the lagoon and oyster reef models, while lagged salinity was favored in the lagoon and living shoreline models. All site types except oyster reefs restored in 2017 (with control living shorelines as the model’s intercept) were found to have no effect on gray snapper SL in the lagoon and oyster reef-scale model (see “Coefficient Estimates” in Table 3). However, the inclusion of site type as a predictor variable was still important for investigating the effect of location on gray snapper growth in Mosquito Lagoon.

3.2. Catch Analyses

The mean (±sd) SL of all gray snapper collected from Mosquito Lagoon (n = 241) was 88.7 ± 28.8 mm, with an SL range of 26.0–171.0 mm. The mean (±sd) calculated age of these individuals was 181 ± 66 days, with a calculated age range of 54–372 days (Table 4). On the habitat scale, oyster reefs contained relatively older juvenile gray snapper than those living shorelines, in which the mean (±sd) SL and calculated age of gray snapper were 77.4 ± 27.5 mm (Range = 13.0–171.0 mm) and 154.1 ± 63.4 days (Range = 53.5–372.1 days); the mean SL and calculated age of gray snapper collected from oyster reefs were 97.5 ± 26.7 mm (Range = 16.0–161.0 mm) and 201 ± 60 days (Range = 74.4–349.7 days) (Table 4).

4. Discussion

This study establishes the first age/length data and growth model for juvenile gray snapper in Mosquito Lagoon, Florida. While additional age and growth assessments are needed to fully evaluate local gray snapper population dynamics, these data can aid local resource managers tasked with monitoring population trends and developing more effective ecosystem-based management strategies [58]. Model outputs indicate salinity and restored (2017) oyster reef habitats are statistically significant, and provide evidence of local environmental factors impacting gray snapper growth. Although additional analyses are required to better understand the relative importance of factors affecting gray snapper size, current model results suggest that, consistent with findings by Loch & Cook [24], environmental factors including salinity in the month prior to capture and time elapsed since restoration influence gray snapper size and growth rates.

4.1. Age and Growth

This study generated age, length, and growth data for gray snapper that can be compared with past and future studies in the region. Size data, in particular mean SL (± sd) at the lagoon scale (88.7 ± 28.8 mm) suggests gray snapper in the study region are predominantly later stage juveniles [4,8]. With the range of SLs being relatively similar between living shoreline and oyster reef habitats (living shoreline SL range = 26.0–171.0 mm; oyster reef SL range = 43.0–160.0 mm), gray snapper in Mosquito Lagoon range from early- to late-stage juveniles, all of which have yet to reach sexual maturity (~175 mm SL) [4,10]. However, gray snapper collected from living shorelines were smaller on average than those collected at oyster reefs (77.4 ± 27.5 mm vs. 97.5 ± 26.7 mm), implying gray snapper foraging at living shorelines are younger than those foraging at oyster reefs, corresponding with habitat preference findings from past studies (e.g., [4]). This age and size distribution is likely due to the proximity of living shoreline habitats to seagrass, which is a known settlement habitat for larval gray snapper [2,5]. In the study region Ponce de Leon Inlet is the only direct connection between Mosquito Lagoon and the Atlantic Ocean (where larval gray snapper originate), and is located north of both oyster reef and living shoreline habitats (Figure 1). Yet despite living shoreline habitats being farther from Ponce Inlet than oyster reef habitats, a greater proportion of relatively younger, smaller juveniles were collected at living shorelines. This finding implies seagrass adjacent to living shorelines may be providing stronger settlement cues than oyster reef habitats to the north [23,25]. These findings further suggest gray snapper in Mosquito Lagoon are generalists capable of foraging in various benthic habitat types and feeding on associated prey communities [24,59]. This generalist behavior might be influenced by the relative paucity of seagrass cover in Mosquito Lagoon, which could incline gray snapper to move from seagrass meadows to adjacent living shoreline or oyster reef habitats [4,60].
Regarding the relevance of size findings to local fisheries, the size range of collected gray snapper (32.0–207.0 mm TL) individuals from Mosquito Lagoon does not meet the minimum size limit for gray snapper in Florida’s recreational (254 mm maximum TL) or commercial fisheries (304.8 mm maximum TL) [61,62]. This means collected gray snapper in the current study are undersized, and have not recruited to local fisheries. These findings highlight the importance of Mosquito Lagoon providing critical benthic habitats for juvenile gray snapper, and their likely functioning as nursery habitat facilitating the survival of juveniles to adulthood [16,27]. The lower proportion of early-stage or recently settled juveniles in the current study suggests Mosquito Lagoon’s oyster reef and living shoreline habitats primarily support mid-stage juvenile gray snapper, with smaller individuals inhabiting the southern mangrove shoreline habitats nearer to seagrass meadows, while relatively larger juveniles inhabit the northern oyster reef habitats closer to Ponce De Leon inlet [2,5,23]. The capture of relatively larger juveniles in the northern portions of Mosquito Lagoon suggests that future studies should focus on collection sites closer to the inlet and potentially include nearshore and offshore collection sites to better understand ontogenetic habitat shifts of gray snapper in the study region.
The current population status of gray snapper from the Atlantic coast of Florida, including sexually mature adults collected from offshore habitats, remains unknown due to the lack of stock assessments in this region (see Bacheler et al. [63]). Fishery-independent surveys, such as the current study, provide important information on the early life history of gray snapper that can inform potential stock assessments. Therefore, natural resource managers should continue monitoring Mosquito Lagoon’s juvenile gray snapper and their relation to local environmental factors to help (1) understand potential changes in local juvenile gray snapper development in relation to habitat conditions and food availability, (2) determine whether stricter regulations on boating activity (i.e., human impacts) are necessary to protect local benthic habitats, and (3) assess the need for additional restoration efforts on dead oyster reefs and destabilized and/or eroding shorelines [22,24,35]. For abundance and length data, the SouthEast Data, Assessment, and Review 75 process highlights the importance of fishery-independent surveys for gray snapper populations, indicating said surveys contribute unbiased length data on gray snapper below minimum size limits for recreational and commercial fisheries, and help determine if gray snapper populations in the Gulf of Mexico are being overfished based on continuously updated life history data [15,16]. A large-scale assessment of gray snapper from Florida’s estuarine habitats, including Mosquito Lagoon, was conducted using data collected between 1996 and 2009 [21]. Gold et al. [64] found genetic differences between gray snapper populations in east and west Florida, emphasizing the need for an east Florida stock assessment to determine how coast-specific genetics relate to gray snapper population status. Together, such assessments are important to ensure gray snapper along the east coast of Florida are not at a higher risk of being overfished, which could manifest in reduced sizes and decreased abundance [65]. Gray snapper are a vital resource for the state’s recreational fishing sector, as Florida’s recreational fisheries represented ~90% of the take for gray snapper in the Southeastern United States, with 2 million pounds of gray snapper recreational landings recorded in 2022 along the east coast of Florida [66,67]. Despite the average size of juvenile gray snapper increasing at lower latitudes [3], studies conducted in east and west Florida found adult gray snapper collected from northern Florida reached larger maximum sizes and ages compared to individuals collected from southern Florida [11,12]. These studies suggest increased fishing pressure in southern Florida could be driving size-selective mortality, which would result in fewer larger and older gray snapper within local populations. However, the findings above emphasize the need for continuous monitoring efforts across benthic habitats located along both coasts of Florida to ensure optimal survival and recruitment rates for local gray snapper populations and to reduce the probability of overfishing [68].
Quality Assurance and Quality Control (QA/QC) procedures indicate relatively good concordance between readers aging fish using daily growth rings in gray snapper otoliths (Table 2) [46]. The secondary reader found higher daily age estimates than the primary reader (i.e., age range from 103 to 290 days old vs. 106 to 317 days old) due to the presence of an annulus in nine of the randomized samples. While this suggests current enumerated and calculated age data skew slightly younger, the primary reader achieved an individual APE below 10% for all 49 otolith samples, indicating high precision in age estimates for analyses. Although 2 of the 16 QA/QC otoliths had an APE slightly over 10% between both readers (10.3% and 12%), their enumerated ages did not appear to skew analyses, and were deemed sufficiently precise for use in analyses. However, there was complexity/difficulty in accurately estimating daily age due to individual annulus formations. A consistent QA/QC protocol should be employed for future studies on gray snapper growth [11,13,14]. QA/QC measures, such as creating reference collections and calculating APE between readers (i.e., methods applied in the current study) can help mitigate over- and underestimations of age, and help to prevent inaccurate population assessments [46].
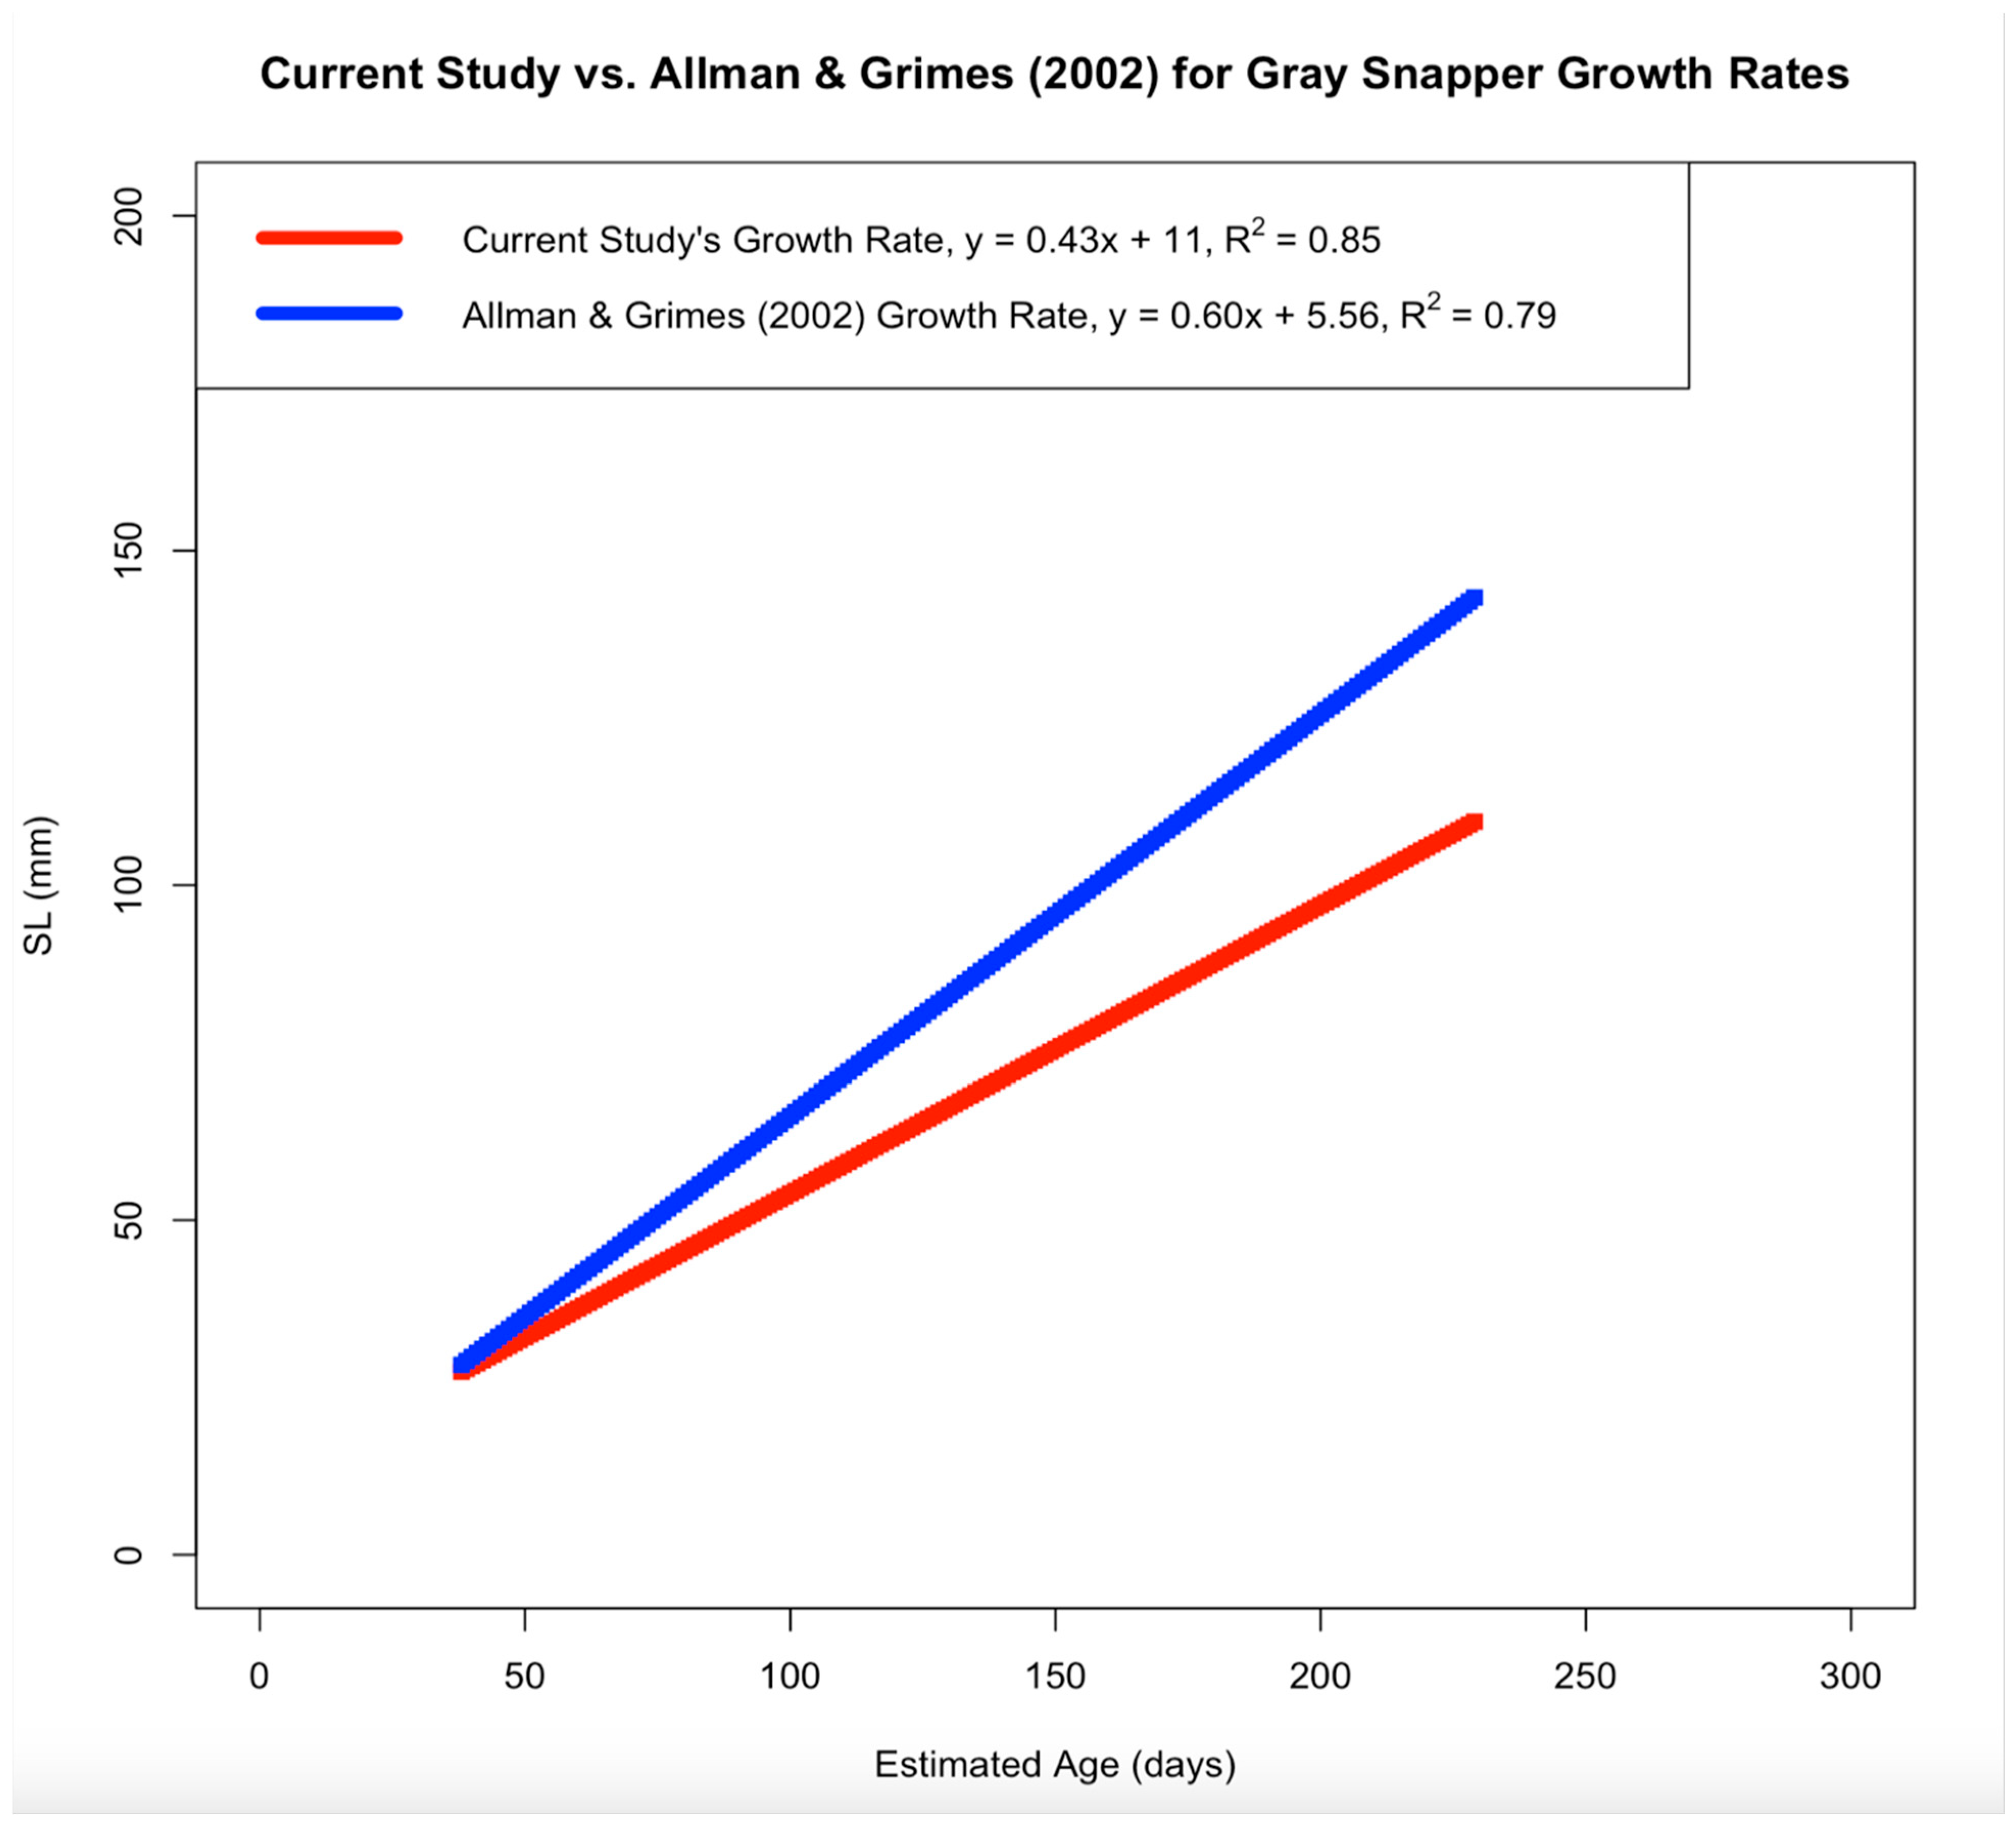
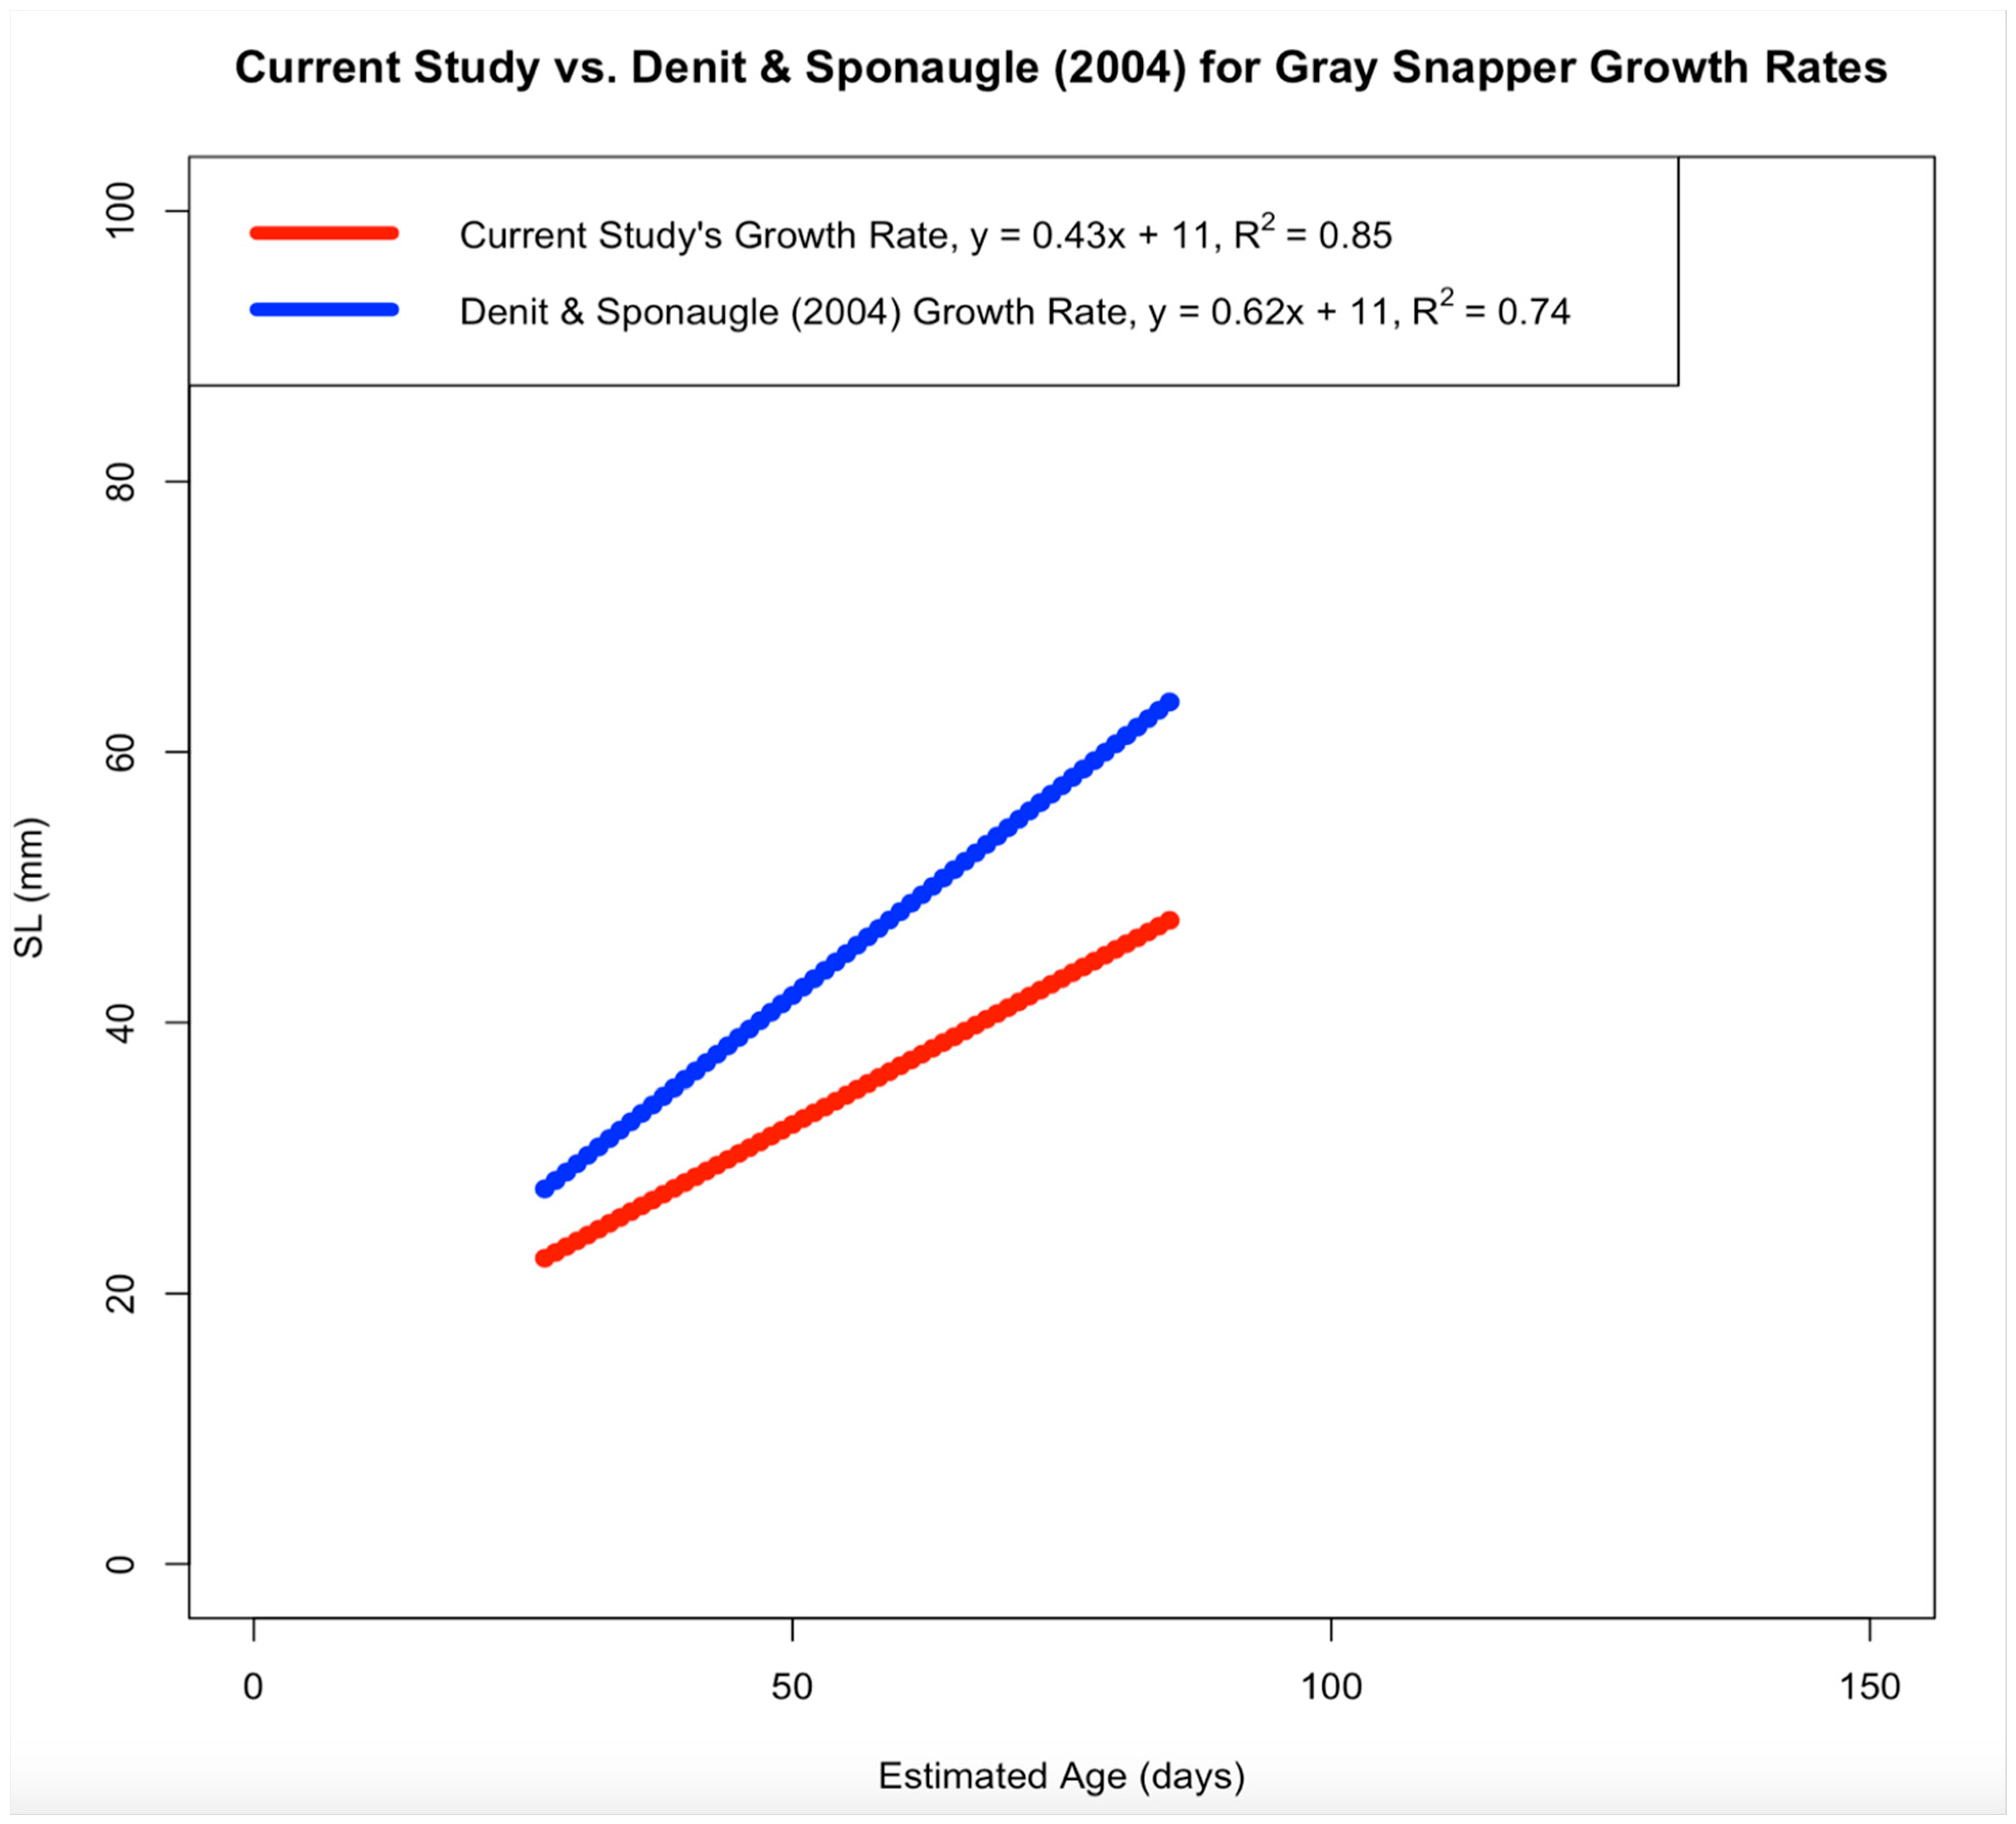
Age and length data from Mosquito Lagoon’s gray snapper were modeled using a linear growth model. Current results indicate the linear growth model to be the most parsimonious function when compared to the von Bertalanffy, Gompertz and logistic functions. This result may be due to the von Bertalanffy growth function typically being applied to fish across a wider age span (in years) than fish sampled here (in days). In contrast, linear models better analyze growth for fish less than 1 year old [3,8]. When comparing growth rates between the current study and two previous studies [8,14], gray snapper in this study had smaller calculated sizes despite comparisons using the lowest growth rates from the other studies. Growth patterns for separate juvenile gray snapper populations are similar within the Southeastern United States [3,8], with lower growth rates (1) indicating a presence of larger and older juveniles in collected samples [4], and (2) suggesting that gray snapper grow slower as they age. The minimum estimates for linear growth rate from North Carolina (0.62–0.72 mm SL/day) [3] and the west coast of Florida (0.60–1.02 mm SL/day) [8] were lower than those from the east coast of Florida (0.68–0.88 mm SL/day) [3]. However, the growth rate calculated in the current study (0.43 mm SL/day) was the lowest when compared to the above studies, which is most likely due to the presence of older juvenile samples in the current study (discussed below; Figure A1 and Figure A2 in Appendix C). For future studies in Mosquito Lagoon, a greater sample size of gray snapper with complementary otolith age data is recommended to create habitat-specific growth models. While the lagoon-scale linear growth model has established the first growth analysis of gray snapper in Mosquito Lagoon, future analyses should aim to obtain larger sample sizes from oyster reefs, living shorelines, and seagrass beds to create habitat-specific growth models [69]. Habitat-specific growth models would allow resource managers to investigate quantitative differences in gray snapper growth between benthic habitat types, along with how they relate to potential correlations between gray snapper size and environmental factors.
Caution should be taken when comparing results from the previous and current study due to size variations between collected gray snapper; the largest sample collected from North Carolina was 65 mm SL, while the largest sample collected from west Florida was 150 mm SL (current study largest SL = 171 mm) [3,8]. Additionally, the lack of studies focusing on juvenile gray snapper growth indicates a knowledge gap in early gray snapper development outside of Florida and North Carolina, along with how early gray snapper development is affected by habitat restoration outside of Mosquito Lagoon [23]. Expanding research in this area could enhance understanding of habitat use by juvenile gray snapper and their developmental responses to restored benthic habitats. Furthermore, while most studies on early-stage gray snapper growth date back to the early 2000s and may contain outdated population data, current findings indicate Mosquito Lagoon’s gray snapper have the slowest growth rates compared to samples collected from other estuarine habitats. Lagoon-scale age and length data for gray snapper also reveals individual variation in length-at-age. Although this specific topic has not yet been examined for gray snapper, Wimberger [70] suggests variation in size among similarly aged fish may be relative to differences in foraging behavior. Mosquito Lagoon’s gray snapper primarily consume macroinvertebrates; however, although prey fish are less common in their diet, they become more prevalent as gray snapper grow larger [23]. This finding suggests larger gray snapper may exhibit increased mobility and energy expenditure to forage, which could lead to shifts in diet composition and potential differences in length-at-age [23]. Combined with the high explanatory power of the current study’s linear growth model (R2 = 0.85), both findings could help explain variation in gray snapper length-at-age.

4.2. Model Analyses

Investigating correlations between gray snapper size and local environmental factors in Mosquito Lagoon provided insight into the environmental factors potentially influencing gray snapper growth in the study region. While daily age estimates for Mosquito Lagoon’s gray snapper were relatively accurate and precise for growth function analyses, length was more accurate and precise as a response variable for models investigating correlations between gray snapper size and environmental factors in Mosquito Lagoon.
The results suggest lagged salinity and year of restoration, namely 2017, influence gray snapper size. Before investigating the effects and model outputs of environmental variables on gray snapper size, unsurprisingly the most parsimonious models identified body mass as a more influential biological variable, as compared to models that included calculated age. This finding supports previous studies of gray snapper that demonstrate a strong positive correlation between length and mass [13,14]. Similarly, current models incorporating mass demonstrated strong explanatory power (conditional R2 = 0.99). For models with the greatest predictive power, predictive ability should be interpreted with caution, as inconsistencies (i.e., data outliers) were detected when testing model assumptions. While inconsistencies did not heavily impact predictive ability of said models, a higher sample size could reduce the relative number of potential outliers and provide more robust results for gray snapper size-based models [71]. Future analyses should continue to explore if age has a greater effect on gray snapper size than mass, as previous studies have used gray snapper age to determine life stage [2,4,10].
Gray snapper can survive in a broad range of salinity levels (0–60 ppt) [72]. Higher salinity levels are related to increased feeding frequency, and if prey remains sufficiently high, this could result in greater growth and size [20]. Current results show a positive correlation between gray snapper size and lagged salinity levels in Mosquito Lagoon, indicating that salinity levels over a 4-week period prior to the date of capture were more influential in affecting gray snapper size than salinity recorded on the date of capture. This finding provides new insight into lagged relationships between gray snapper size and local environmental conditions, as past research has only found lagged relationships between gray snapper growth and sea surface temperature [40]. While gray snapper typically prefer a salinity range of 9–23 ppt to optimize osmoregulation, Serrano et al. [73] suggest that proximity to offshore habitats takes priority over the need to minimize osmoregulatory energetic costs. This is evident in Mosquito Lagoon, where despite elevated salinity levels (mean of 33.91 ppt in oyster reefs and 33.56 ppt in living shorelines) [26], gray snapper continue to inhabit these areas. Sampled juvenile gray snapper were relatively older and larger in Mosquito Lagoon’s oyster reef habitats than living shorelines possibly due to local oyster reefs (1) having slightly higher salinity levels, and (2) being relatively closer to the Ponce de Leon Inlet, which corresponds with known ontogenetic movements from inshore nursery habitats to offshore habitats as gray snapper age [26]. Model results here indicate habitat suitability in Mosquito Lagoon similarly relates to gray snapper age and size, with older and larger individuals found in greater numbers at oyster reefs, while relatively younger and smaller individuals inhabit living shorelines.
In Mosquito Lagoon’s restored oyster reefs and stabilized shorelines, Loch & Cook [23] found gray snapper size to be equal to, and at times larger than, those collected from positive or negative control sites. Current model outputs using the same dataset support this finding, with gray snapper being relatively larger at oyster reefs restored in 2017 compared to control living shorelines, suggesting benthic habitat restoration has a positive relationship with gray snapper size. This finding is supported by Loch et al. [22], which found gray snapper abundance was generally higher at restored (2017) oyster reef sites compared to positive and negative control sites. Combined with current results indicating gray snapper size is slightly larger at restored (2017 and 2018) and live oyster reefs than at dead oyster reefs, the general presence of oyster reefs may aid growth by providing foraging and sheltering opportunities for local gray snapper as well as prey fish and macroinvertebrates [18,22,23,24,26]. Gray snapper are a generalist species [59,74], and current results suggest habitat quality and availability influences gray snapper size. Thus, location and habitat type could be used to predict gray snapper size in Mosquito Lagoon.
Based on the study findings, environmental conditions in Mosquito Lagoon appear to influence gray snapper size. Across all scales, lagged salinity and location or site status were correlated with gray snapper size. Oyster reef and living shoreline habitats in Mosquito Lagoon are relatively close in proximity (i.e., within kilometers), which may explain why similar-sized juvenile gray snapper were found at both habitat types. On the Mosquito Lagoon and oyster reef scale, oyster reefs restored in 2017 were found to have larger gray snapper than control living shorelines, indicating there is some benefit to gray snapper provided by restoration projects in Mosquito Lagoon [23,24]. Further analyses should be conducted to investigate if living shoreline stabilization provides additional size-appropriate ecological services (i.e., prey and shelter) for recently settled gray snapper. Local water properties should also be monitored to investigate potential changes in their correlation with gray snapper size and survivorship, along with environmental conditions and potential lags [75,76]. Of all the water property measurements taken during fish sampling, lagged salinity was found to be positively related to gray snapper growth. Overall, further post-restoration monitoring of potential changes in ecological community and habitat conditions/site status should be conducted to analyze the long-term impacts of oyster reef/living shoreline restoration on the body size of Mosquito Lagoon’s gray snapper.
Local water properties and their effects on Mosquito Lagoon’s oyster reef and living shoreline habitats should be monitored to assess potential shifts in the relationship between gray snapper size and habitat properties. Additionally, habitat-specific variables such as vegetative coverage, oyster reef height (as a proxy for structural complexity), and density should be recorded alongside gray snapper size to determine whether both are influenced by environmental properties at the time of sampling (non-lagged) or by shifts in environmental properties prior to sampling (lagged). Due to insufficient data on habitat-type specific variables in this study, consistent sampling of these variables is recommended for future studies to bolster investigations of gray snapper and their surrounding environment in Mosquito Lagoon. Gradual shifts in environmental conditions due to climate change could potentially reduce gray snapper size by affecting available habitat and prey communities [26,75]. For example, salinity in Mosquito Lagoon has risen over the past two and a half decades, from a mean of 30 ± 5 ppt (range: 31–38 ppt) in the late 1990s to a mean of 34 ± 4 ppt (range: 24–45 ppt) as of the late 2010s [26]. These increases have been gradual, suggesting changes in habitat coverage for oyster reef and living shoreline habitats may occur over decadal time scales. For local oyster populations, salinity levels > 35 ppt could increase oyster mortality, and potentially decrease survival rates for local populations [77]. For living shorelines, increasing salinity levels (>30–35 ppt) inhibit the growth and development of mangroves (e.g., R. mangle, L. racemosa) and reduce germination rates for smooth cordgrass (S. alterniflora) [78,79,80]. Results in the current study indicate larger juvenile gray snapper are more common in oyster reef habitats, suggesting a potential reduction in gray snapper length-at-age could occur via the reduction in size-appropriate foraging and sheltering habitat [4]. Thus, management in Mosquito Lagoon should continue to monitor the size structure of local gray snapper populations and investigate how they adapt to gradual changes in habitat quality and availability. Ensuring the continued use of local habitats and prey communities by gray snapper will help to optimize their recruitment to adult populations offshore.
Local management should consider long-term monitoring for potential changes in gray snapper size and environmental factors in Mosquito Lagoon. Outside of Loch & Cook [23,24], past research in Mosquito Lagoon has yet to explore the effects of habitat restoration on gray snapper size [22,24]. However, new findings from the current study could provide additional guidance for natural resource managers working in similar inshore nursery environments, and help identify environmental factors conducive to optimal habitat quality and gray snapper growth. Specifically, these results could inform the design of future size- and location-specific structures that promote early gray snapper survivorship both within and beyond Mosquito Lagoon. In the current study, model outputs found oyster reefs restored in 2017 had a positive correlation with gray snapper size, indicating restoration efforts in Mosquito Lagoon have found some success in supporting relatively larger juvenile gray snapper. However, given no effect on gray snapper size was observed from stabilized living shorelines and oyster reefs restored in 2018, it is possible that additional time or long-term monitoring is needed for these restoration projects to fully develop before their influence is detectable in growth models. Specifically, continued monitoring of local fish and macroinvertebrate community responses to restored oyster reefs or stabilized shorelines is recommended to ensure the long-term stability of Mosquito Lagoon’s ecological functions, which ultimately supports the survival of juvenile gray snapper and their recruitment into adult populations. Recent findings from Smith et al. [81] and Smith & Castorani [82] found restored oyster reefs need to be established for 6 to 8 years before local fish and macroinvertebrate abundance can consistently match quantities found in natural oyster reefs. For stabilized living shorelines, Gittman et al. [37] and Guthrie et al. [83] found nekton abundance from stabilized living shorelines matched that of natural (control) living shorelines after 2 to 8 years post-restoration. For future restoration studies, monitoring fish and macroinvertebrate assemblages on a quarterly or semi-annual basis for 7–8 years following habitat restoration is recommended. This sampling frequency should capture initial changes to the biotic community, and any chance disturbance events (e.g., hurricanes or algal blooms) that may influence the biotic community. Thereafter, annual monitoring may suffice to quantify long-term population trends and restoration outcomes.
Current results show no correlation between gray snapper size and prey richness/abundance in Mosquito Lagoon. Prey availability affects a fish’s size and behavior [84], and prey availability and feeding opportunities influence metabolic rates, which in turn influence digestion, growth, and locomotion [85], suggesting fish will seek habitats with higher prey availability to maintain individual fitness and reach optimal length-at-age. At the species-specific level, studies have shown gray snapper length-at-age declines when prey availability is low, prompting them to switch prey based on location and prey quality [20,59,77,86]. In the current study, ~83% of the gray snapper sampled had consumed prey, indicating a majority of gray snapper in Mosquito Lagoon had access to prey prior to capture. Thus, continued monitoring of Mosquito Lagoon’s oyster reef and living shoreline habitats can help identify habitat-specific changes in species diversity and composition of local prey fish or macroinvertebrate communities that may influence size structure of relatively higher trophic level gray snapper [23,24,33]. Specifically, a negative correlation between gray snapper size and nekton abundance could indicate a degradation of oyster reef and living shoreline sites, and warrant further assessment of local site status and their environmental conditions (e.g., changes in salinity). With climate change driving persistent shifts in environmental conditions and local prey communities [26,31], gray snapper could face metabolic challenges in the future.
Biometric and related age and growth analyses provide greater understanding of gray snapper life history. Therefore, fishery managers should continue assessing size-specific habitat requirements and environmental conditions critical to the growth and survivorship of gray snapper in Mosquito Lagoon. Previous studies have found habitat restoration in Mosquito Lagoon improves foraging/sheltering opportunities for local gray snapper [22,23,24]. As habitat quality is related to environmental conditions [77,80], continued monitoring of abiotic conditions could inform resource managers about regional opportunities to increase gray snapper landings by implementing strategies to better support the recruitment of juveniles into adult stocks offshore. Wuenschel et al. [87] found adult gray snapper distributions corresponded with the survival of nearby juvenile gray snapper populations, however gray snapper age and length data have yet to be quantified from inshore and offshore habitats near Mosquito Lagoon [21,63]. Thus, gray snapper in nearshore and offshore water near Mosquito Lagoon should be monitored to quantify connectivity among benthic habitats, and help establish spatial boundaries for potential future stock assessments.
5. Conclusions

Current age-at-length data indicate Mosquito Lagoon primarily hosts pre-reproductive juvenile stage gray snapper (i.e., individuals less than 175 mm SL and/or 3 years of age [10]). Similarities in age and growth parameters between the current and future studies could identify locations that provide foraging or refugia opportunities (e.g., prey-rich sites with observed higher growth rates or the proximity of nursery sites to offshore habitats) that support relatively high gray snapper growth and survivorship. While the current study establishes the first age and growth findings for gray snapper in Mosquito Lagoon, future studies should continue to monitor local age and growth to determine if these life history parameters shift over time.
Benthic habitat quality and lagged salinity levels impact gray snapper size in Mosquito Lagoon, suggesting resource managers continue efforts to improve and optimize habitat suitability in the region. While the findings here inform how habitat restoration influences gray snapper size and can be used to develop habitat restoration strategies that enhance environmental conditions for gray snapper, additional analyses are needed to (1) identify trends in the environmental variables affecting gray snapper growth the most, and (2) quantify the timeframe needed for restored and stabilized sites to offer ecological benefits similar to positive control sites. This study provides insight into local gray snapper population dynamics, informs how different aged and sized individuals utilize local nursery habitats, and can be used to guide future studies connecting inshore nursery habitats to offshore benthic habitats. Together this knowledge can guide the development of more effective monitoring programs, fishing regulations, and ecosystem-based management and restoration strategies to benefit adult gray snapper populations, ultimately moving local stocks toward sustainability.

Author Contributions

Conceptualization, W.C., G.S.C. and J.L.C.; methodology, W.C., G.S.C. and J.L.C.; validation, W.C., G.S.C. and J.L.C.; formal analysis, W.C.; investigation, W.C., G.S.C. and J.L.C.; resources, G.S.C. and J.L.C.; data curation, W.C., G.S.C. and J.L.C.; writing—original draft preparation, W.C.; writing—review and editing, W.C., G.S.C. and J.L.C.; visualization, W.C.; supervision, G.S.C. and J.L.C.; project administration, G.S.C. and J.L.C.; funding acquisition, W.C., G.S.C. and J.L.C. All authors have read and agreed to the published version of the manuscript.

Funding

The APC was funded by an open access fee waiver provided by Fishes.

Institutional Review Board Statement

The study was conducted approved by University of Central Florida Institutional Animal Care and Use Committee protocols (IACUC Permit #16-15W). (Approval date: 12 May 2016).

Informed Consent Statement

Not applicable.

Data Availability Statement

The data presented in this study are available on request from the corresponding author, upon reasonable request.

Acknowledgments

We thank David G. Jenkins for comments on an earlier draft, and the University of Central Florida Department of Biology for support. Fish and macroinvertebrate data were collected by the Marine Ecology and Conversation Lab at UCF. Fish dissection data were collected by J. Loch, L. Relue, D. Lewis, and J. Glomb.

Conflicts of Interest

The authors declare no conflicts of interest.

Appendix A

Table A1. Growth model comparison results for captured gray snapper on the lagoon scale with otolith age data only.
Lagoon-Scale
Gray Snapper with Otolith Age Data Only ModelsAICcdAICdfWeightWeight (%)
Linear Model692030.56656.6%
Von Bertalanffy Growth Model694240.23123.1%
Gompertz Model695340.12612.6%
Logistic Model696440.0767.6%
Null Non-Linear Least Squares Model818.4126.52<0.001<0.001%
Table A2. Linear growth model output for gray snapper with otolith age data only. For the table containing model output results, asterisks next to “p(t)” p-values indicate statistical significance for given model variables, with more asterisks indicating higher statistical significance.
Lagoon-Scale
Gray Snapper with Otolith Age Data Only Model
Standard Length~Enumerated Age
R2 = 0.85 Adjusted R2 = 0.85
Coefficient EstimatesEstimateSEp(t)
Fixed Effects(Intercept)11.1104.8620.0269 *
Enumerated Age0.4310.026<0.001 ***
Residual standard error: 11.86 on 47 degrees of freedom

Appendix B

Table A3. Model comparison results for captured gray snapper on the lagoon scale.
Lagoon-Scale
ModelsAICcdAICdfWeightWeight (%)
Log (Standard Length) ~ Log (Mass) + Lagged Dissolved Oxygen + Lagged Salinity + Lagged Water Temperature + Site Type + (1|Sampling Date)−897.70120.70370.3%
Log (Standard Length) ~ Log (Mass) + Lagged Dissolved Oxygen + Lagged Water Temperature + Fish Abundance + Macroinvertebrate Abundance + Site Type + (1|Sampling Date)−895.72.0130.26126.1%
Log (Standard Length) ~ Log (Mass) + Site Type + (1|Sampling Date)−891.26.690.0272.7%
Log (Standard Length) ~ Log (Mass) + Fish Abundance + Fish Richness + Macroinvertebrate Abundance + Macroinvertebrate Richness + Site Type + (1|Sampling Date)−887.410.3130.0040.4%
Log (Standard Length) ~ Log (Mass) + Wind Speed + Dissolved Oxygen + Salinity + Water Temperature + Site Type + (1|Sampling Date)−886.711.0130.0030.3%
Log (Standard Length) ~ Log (Mass) + Salinity + Water Temperature + Fish Abundance + Macroinvertebrate Abundance + Site Type + (1|Sampling Date)−886.711.1130.0030.3%
Standard Length ~ Calculated Age + Lagged Dissolved Oxygen + Lagged Salinity + Lagged Water Temperature + Site Type + (1|Sampling Date)1491.72389.412<0.001<0.001%
Standard Length ~ Calculated Age + Site Type + (1|Sampling Date)1492.92390.69<0.001<0.001%
Standard Length ~ Calculated Age + Lagged Dissolved Oxygen + Lagged Water Temperature + Fish Abundance + Macroinvertebrate Abundance + Site Type + (1|Sampling Date)1496.22393.913<0.001<0.001%
Standard Length ~ Calculated Age + Wind Speed + Dissolved Oxygen + Salinity + Water Temperature + Site Type + (1|Sampling Date)1496.62394.413<0.001<0.001%
Standard Length ~ Calculated Age + Salinity + Water Temperature + Fish Abundance + Macroinvertebrate Abundance + Site Type + (1|Sampling Date)1496.72394.413<0.001<0.001%
Standard Length ~ Calculated Age + Fish Abundance + Fish Richness + Macroinvertebrate Abundance + Macroinvertebrate Richness + Site Type + (1|Sampling Date)1499.92397.613<0.001<0.001%
Standard Length ~1 (null model)2305.83203.62<0.001<0.001%
Table A4. Model comparison results for captured gray snapper on the oyster reef scale.
Habitat-Scale
Oyster Reef ModelsAICcdAICdfWeightWeight (%)
Log (Standard Length) ~ Log (Mass) + (1|Sampling Date) + Site Type−499.6070.54254.2%
Log (Standard Length) ~ Log (Mass) + Lagged Dissolved Oxygen + Lagged Salinity + Lagged Water Temperature + Site Type + (1|Sampling Date)−498.31.3100.27827.8%
Log (Standard Length) ~ Log (Mass) + Lagged Salinity + Lagged Water Temperature + Fish Abundance + Macroinvertebrate Abundance + Site Type + (1|Sampling Date)−496.33.3110.10210.2%
Log (Standard Length) ~ Log (Mass) + Wind Speed + Dissolved Oxygen + Salinity + Water Temperature + Site Type + (1|Sampling Date)−493.85.8110.033.0%
Log (Standard Length) ~ Log (Mass) + Salinity + Water Temperature + Fish Abundance + Macroinvertebrate Abundance + Site Type + (1|Sampling Date)−493.85.8110.0292.9%
Log (Standard Length) ~ Log (Mass) + Fish Abundance + Fish Richness + Macroinvertebrate Abundance + Macroinvertebrate Richness + Site Type + (1|Sampling Date)−492.86.8110.0181.8%
Standard Length ~ Calculated Age + Lagged Dissolved Oxygen + Lagged Salinity + Lagged Water Temperature + Site Type + (1|Sampling Date)883.91383.510<0.001<0.001%
Standard Length ~ Calculated Age + Site Type + (1|Sampling Date)884.61384.27<0.001<0.001%
Standard Length ~ Calculated Age + Wind Speed + Dissolved Oxygen + Salinity + Water Temperature + Site Type + (1|Sampling Date)888.81388.411<0.001<0.001%
Standard Length ~ Calculated Age + Salinity + Water Temperature + Fish Abundance + Macroinvertebrate Abundance + Site Type + (1|Sampling Date)890.4139011<0.001<0.001%
Standard Length ~ Calculated Age + Lagged Salinity + Lagged Water Temperature + Fish Abundance + Macroinvertebrate Abundance + Site Type + (1|Sampling Date)890.41390.111<0.001<0.001%
Standard Length ~ Calculated Age + Fish Abundance + Fish Richness + Macroinvertebrate Abundance + Macroinvertebrate Richness + Site Type + (1|Sampling Date)892.21391.811<0.001<0.001%
Standard Length ~1 (null model)1282.11781.72<0.001<0.001%
Table A5. Model comparison results for captured gray snapper on the living shoreline scale.
Habitat-Scale
Living Shoreline ModelsAICcdAICdfWeightWeight (%)
Log (Standard Length) ~ Log (Mass) + Lagged Dissolved Oxygen + Lagged Salinity + Lagged Water Temperature + Site Type + (1|Sampling Date)−387.1080.66966.9%
Log (Standard Length) ~ Log (Mass) + Fish Abundance + Fish Richness + Macroinvertebrate Abundance + Macroinvertebrate Richness + Site Type + (1|Sampling Date)−384.42.890.16816.8%
Log (Standard Length) ~ Log (Mass) + Lagged Salinity + Lagged Water Temperature + Fish Abundance + Macroinvertebrate Abundance + Site Type + (1|Sampling Date)−383.63.590.11511.50%
Log (Standard Length) ~ Log (Mass) + Site Type + (1|Sampling Date)−381.75.450.0454.50%
Log (Standard Length) ~ Log (Mass) + Salinity + Water Temperature + Fish Abundance + Macroinvertebrate Abundance + Site Type + (1|Sampling Date)−375.311.990.0020.20%
Log (Standard Length) ~ Log (Mass) + Wind Speed + Dissolved Oxygen + Salinity + Water Temperature + Site Type + (1|Sampling Date)−374.512.690.0010.10%
Standard Length ~ Calculated Age + Site Type + (1|Sampling Date)591.5978.65<0.001<0.001%
Standard Length ~ Calculated Age + Lagged Salinity + Lagged Water Temperature + Fish Abundance + Macroinvertebrate Abundance + Site Type + (1|Sampling Date)594.6981.79<0.001<0.001%
Standard Length ~ Calculated Age + Fish Abundance + Fish Richness + Macroinvertebrate Abundance + Macroinvertebrate Richness + Site Type + (1|Sampling Date)595.1982.39<0.001<0.001%
Standard Length ~ Calculated Age + Salinity + Water Temperature + Fish Abundance + Macroinvertebrate Abundance + Site Type + (1|Sampling Date)595.2982.39<0.001<0.001%
Standard Length ~ Calculated Age + Lagged Dissolved Oxygen + Lagged Salinity + Lagged Water Temperature + Site Type + (1|Sampling Date)597.4984.68<0.001<0.001%
Standard Length ~ Calculated Age + Wind Speed + Dissolved Oxygen + Salinity + Water Temperature + Site Type + (1|Sampling Date)599.8986.99<0.001<0.001%
Standard Length ~1 (null model)996.913842<0.001<0.001%

Appendix C

Figure A1. Visual growth model comparison between the current study and Allman & Grimes ([8]).
Fishes 10 00336 g0a1
Figure A2. Visual growth model comparison between the current study and Denit & Sponaugle ([3]).
Fishes 10 00336 g0a2

References

  1. Hoese, H.D.; Moore, R. Fishes of the Gulf of Mexico, Texas, Louisiana, and Adjacent Waters; Texas A&M University Press: College Station, TX, USA, 1998. [Google Scholar]
  2. Tzeng, M.W.; Hare, J.A.; Lindquist, D.G. Ingress of transformation stage gray snapper, Lutjanus griseus (Pisces: Lutjanidae) through Beaufort Inlet, North Carolina. Bull. Mar. Sci. 2003, 72, 891–908. [Google Scholar]
  3. Denit, K.; Sponaugle, S. Growth Variation, Settlement, and Spawning of Gray Snapper across a Latitudinal Gradient. Trans. Am. Fish. Soc. 2004, 133, 1339–1355. [Google Scholar] [CrossRef]
  4. Starck, W.A.; Schroeder, R.E. Investigations of the Gray Snapper, Lutjanus griseus; University of Miami Press: Miami, FL, USA, 1971; Volume 10. [Google Scholar]
  5. Chester, A.J.; Thayer, G.W. Distribution of Spotted Seatrout (Cynoscion nebulosus) and Gray Snapper (Lutjanus griseus) juveniles in seagrass habitats of Western Florida Bay. Bull. Mar. Sci. 1990, 42, 345–357. [Google Scholar]
  6. Faunce, C.H.; Serafy, J.E. Nearshore Habitat Use By Gray Snapper (Lutjanus griseus) and Bluestriped Grunt (Haemulon sciurus): Environmental Gradients and Ontogenic Shifts. Bull. Mar. Sci. 2007, 80, 473–495. [Google Scholar]
  7. Bovee, E.; Murie, D.J.; Vaz, A.C. Larval dispersal of gray snapper (Lutjanus griseus) on the West Florida Shelf. Oceans 2025, 6, 12. [Google Scholar] [CrossRef]
  8. Allman, R.J.; Grimes, C.B. Temporal and spatial dynamics of spawning, settlement, and growth of gray snapper (Lutjanus griseus) from the West Florida shelf as determined from otolith microstructures. Fish. Bull. 2002, 100, 391–403. [Google Scholar]
  9. Panzetta, S.W.; Stuart, C.E.; Green, S.J. Biogeophysical drivers of abundance for habitat-shifting reef fishes on stepping-stone coral patch reefs. Coral Reefs 2025, 44, 759–774. [Google Scholar] [CrossRef]
  10. Starck, W.A. Biology of the gray snapper, Lutjanus griseus (Linnaeus), in the Florida Keys; University Miami Press: Coral Gables, FL, USA, 1971. [Google Scholar]
  11. Burton, M.L. Age, growth, and mortality of gray snapper, Lutjanus griseus, from the east coast of Florida. Fish. Bull. 2001, 99, 254–265. [Google Scholar]
  12. Allman, R.J.; Goetz, L.A. Regional variation in the population structure of gray snapper, Lutjanus griseus, along the west Florida shelf. Bull. Mar. Sci. 2009, 84, 315–330. [Google Scholar]
  13. Fischer, A.; Baker, M.S.; Wilson, C.; Nieland, D. Age, growth, mortality, and radiometric age validation of gray snapper (Lutjanus griseus) from Louisiana. Fish. Bull. 2005, 103, 307–319. [Google Scholar]
  14. Anderson, J.; McDonald, D.; Getz, E.; Weixelman, R.; Grubbs, F.; Ferguson, J. Distribution, maturity, age and growth of gray snapper (Lutjanus griseus) in the northwestern Gulf of Mexico. Gulf Caribb. Res. 2022, 33, 14–27. [Google Scholar] [CrossRef]
  15. SouthEast Data, Assessment, and Review. Available online: https://sedarweb.org/assessments/sedar-51/ (accessed on 6 April 2025).
  16. SouthEast Data, Assessment, and Review. Available online: https://sedarweb.org/assessments/sedar-75/ (accessed on 6 April 2025).
  17. Vignon, M. Ontogenetic trajectories of otolith shape during shift in habitat use: Interaction between otolith growth and environment. J. Exp. Mar. Biol. Ecol. 2012, 420–421, 26–32. [Google Scholar] [CrossRef]
  18. Van Chi, V.; True, J.D. Effects of habitat structure and salinity on growth and survival of juvenile Mangrove Red Snapper Lutjanus argentimaculatus (Forsskal, 1775). Songklanakarin J. Sci. Technol. 2018, 40, 6. [Google Scholar]
  19. Hernández, C.; Hurtado-Oliva, M.A.; Peña, E. Effect of short-term starvation on hematological and blood biochemical parameters in juvenile spotted rose snapper Lutjanus guttatus (Steindachner, 1869). Lat. Am. J. Aquat. Res. 2019, 47, 9–17. [Google Scholar] [CrossRef]
  20. Wuenschel, M.J.; Jugovich, A.R.; Hare, J.A. Effect of temperature and salinity on the energetics of juvenile gray snapper (Lutjanus griseus): Implications for nursery habitat value. J. Exp. Mar. Biol. Ecol. 2004, 312, 333–347. [Google Scholar] [CrossRef]
  21. Flaherty, K.E.; Switzer, T.S.; Winner, B.L.; Keenan, S.F. Regional correspondence in habitat occupancy by Gray Snapper (Lutjanus griseus) in estuaries of the southeastern United States. Estuaries Coasts 2014, 37, 206–228. [Google Scholar] [CrossRef]
  22. Loch, J.M.H.; Walters, L.J.; Donnelly, M.L.; Cook, G.S. Restored Coastal Habitat Can “Reel In” Juvenile Sportfish: Population and Community Responses in the Indian River Lagoon, Florida, USA. Sustainability 2021, 13, 12832. [Google Scholar] [CrossRef]
  23. Loch, J.M.H.; Cook, G.S. Evidence of ontogenetic partitioning of restored coastal habitat by a generalist sportfish. Restor. Ecol. 2023, 31, e13960. [Google Scholar] [CrossRef]
  24. Loch, J.M.; Cook, G.S. Restored oyster reefs and living shorelines can augment predator trophic dynamics. Restor. Ecol. 2024, 32, e14028. [Google Scholar] [CrossRef]
  25. Wooster, W.S.; Bailey, K.M. Recruitment of marine fishes revisited. Effects of ocean variability on recruitment and an evaluation of parameters used in stock assessment models. Can. Spec. Publ. Fish. Aquat. Sci. 1989, 108, 153–159. [Google Scholar]
  26. Lewis, D.M.; Troast, B.V.; Glomb, J.C.; Cook, G.S. An Ecological Characterization of Fish Assemblages in Mosquito Lagoon, Florida. Southeast. Nat. 2020, 19, 491–510. [Google Scholar] [CrossRef]
  27. National Oceanic and Atmospheric Administration. Available online: https://www.fisheries.noaa.gov/national/habitat-conservation/essential-fish-habitat#essentially,-fish-habitat (accessed on 6 April 2025).
  28. National Oceanic and Atmospheric Administration. Available online: https://www.fisheries.noaa.gov/insight/understanding-essential-fish-habitat (accessed on 6 April 2025).
  29. St. John’s River Water Management District. Available online: https://www.sjrwmd.com/waterways/indian-river-lagoon/ (accessed on 6 April 2025).
  30. Dybas, C.L. Florida’s Indian River lagoon: An estuary in transition. Bioscience 2002, 52, 554–559. [Google Scholar] [CrossRef]
  31. Troast, B.; Paperno, R.; Cook, G.S. Multidecadal shifts in fish community diversity across a dynamic biogeographic transition zone. Divers. Distrib. 2019, 26, 93–107. [Google Scholar] [CrossRef]
  32. Troast, B.V.; Walters, L.J.; Cook, G.S. A multi-tiered assessment of fish community responses to habitat restoration in a coastal lagoon. Mar. Ecol. Prog. Ser. 2022, 698, 1–14. [Google Scholar] [CrossRef]
  33. Searles, A.R.; Gipson, E.E.; Walters, L.J.; Cook, G.S. Oyster Reef Restoration facilitates the recovery of macroinvertebrate abundance, diversity, and composition in estuarine communities. Sci. Rep. 2022, 12, 11688. [Google Scholar] [CrossRef]
  34. Loch, J.M.H.; Walters, L.J.; Cook, G.S. Recovering trophic structure through habitat restoration: A Review. Food Webs 2020, 25, e00162. [Google Scholar] [CrossRef]
  35. Walters, L.J.; Sacks, P.E.; Campbell, D.E. Boating impacts and boat-wake resilient restoration of the eastern oyster Crassostrea virginica in Mosquito Lagoon, Florida, USA. Fla. Sci. 2021, 84, 173–199. [Google Scholar]
  36. Gilby, B.L.; Olds, A.D.; Peterson, C.H.; Connolly, R.M.; Voss, C.M.; Bishop, M.J.; Elliott, M.; Grabowski, J.H.; Ortodossi, N.L.; Schlacher, T.A. Maximizing the benefits of oyster reef restoration for finfish and their fisheries. Fish Fish. 2018, 19, 931–947. [Google Scholar] [CrossRef]
  37. Gittman, R.K.; Peterson, C.H.; Currin, C.A.; Fodrie, J.; Piehler, M.F.; Bruno, J.F. Living shorelines can enhance the nursery role of threatened estuarine habitats. Ecol. Appl. 2016, 26, 249–263. [Google Scholar] [CrossRef]
  38. Lewis, D.M.; Durham, K.E.; Walters, L.J.; Cook, G.S. A resident fish guild as a higher trophic level indicator of oyster reef restoration success. Sustainability 2021, 13, 13004. [Google Scholar] [CrossRef]
  39. National Oceanic and Atmospheric Administration. Available online: https://tidesandcurrents.noaa.gov/ (accessed on 6 April 2025).
  40. Black, B.A.; Allman, R.J.; Schroeder, I.D.; Schirripa, M.J. Multidecadal otolith growth histories for red and gray snapper (Lutjanus spp.) in the northern Gulf of Mexico, USA. Fish. Oceanogr. 2011, 20, 347–356. [Google Scholar] [CrossRef]
  41. Herdter, E.S.; Chambers, D.P.; Stallings, C.D.; Murawski, S.A. Did the Deepwater Horizon oil spill affect growth of Red Snapper in the Gulf of Mexico? Fish. Res. 2017, 191, 60–68. [Google Scholar] [CrossRef]
  42. U.S. Department of the Interior. Available online: https://irma.nps.gov/aqwebportal/ (accessed on 6 April 2025).
  43. Secor, D.H.; Dean, J.M.; Laban, E.H. Otolith removal and preparation for microstructural examination. Can. Spec. Publ. Fish. Aquat. Sci. 1992, 117, 19–57. [Google Scholar]
  44. VanderKooy, S.; Carroll, J.; Elzey, S.; Gilmore, J.; Kipp, J. A Practical Handbook for Determining the Ages of Gulf of Mexico and Atlantic Coast Fishes, 3rd ed.; Gulf States Marine Fisheries Commission: Ocean Springs, MS, USA, 2020.
  45. Beamish, R.J.; Fournier, D.A. A method for comparing the precision of a set of age determinations. Can. J. Fish. Aquat. Sci. 1981, 38, 982–983. [Google Scholar] [CrossRef]
  46. Campana, S.E. Accuracy, precision and quality control in age determination, including a review of the use and abuse of age validation methods. J. Fish Biol. 2001, 59, 197–242. [Google Scholar] [CrossRef]
  47. The R Foundation. Available online: https://www.r-project.org/ (accessed on 6 April 2025).
  48. The Comprehensive R Archive Network. Available online: https://CRAN.R-project.org/package=STAT (accessed on 6 April 2025).
  49. ggplot2. Available online: https://ggplot2.tidyverse.org (accessed on 6 April 2025).
  50. Mackay, D.; Moreau, J. A note on the inverse function of the von Bertalanffy growth function. Fishbyte 1990, 8, 28–31. [Google Scholar]
  51. Kimura, D.K. Extending the von Bertalanffy growth model using explanatory variables. Can. J. Fish. Aquat. Sci. 2008, 65, 1879–1891. [Google Scholar] [CrossRef]
  52. Pardo, S.A.; Cooper, A.B.; Dulvy, N.K. Avoiding fishy growth curves. Methods Ecol. Evol. 2013, 4, 353–360. [Google Scholar] [CrossRef]
  53. Hammerschlag-Peyer, C.M.; Layman, C.A. Intrapopulation variation in habitat use by two abundant coastal fish species. Mar. Ecol. Prog. Ser. 2010, 415, 211–220. [Google Scholar] [CrossRef]
  54. Cramer, M.T.; Fidler, R.Y.; Penrod, L.M.; Carroll, J.; Turingan, R.G. A spatiotemporal comparison of length-at-age in the Coral Reef Fish Acanthurus nigrofuscus between marine reserves and fished reefs. PLoS ONE 2020, 15, e0239842. [Google Scholar] [CrossRef]
  55. The Comprehensive R Archive Network. Available online: https://cran.r-project.org/web/packages/glmmTMB/index.html (accessed on 6 April 2025).
  56. The Comprehensive R Archive Network. Available online: https://CRAN.R-project.org/package=bbmle (accessed on 6 April 2025).
  57. Journal of Open Source Software. Available online: https://joss.theoj.org/papers/10.21105/joss.03139 (accessed on 6 April 2025).
  58. Cook, G.S.; Fletcher, P.J.; Kelble, C.R. Towards marine ecosystem-based management in South Florida: Investigating the connections among ecosystem pressures, states, and services in a complex coastal system. Ecol. Indic. 2014, 44, 26–39. [Google Scholar] [CrossRef]
  59. Yeager, L.A.; Layman, C.A.; Hammerschlag-Peyer, C.M. Diet variation of a generalist fish predator, grey snapper Lutjanus griseus, across an estuarine gradient: Trade-offs of quantity for quality? J. Fish Biol. 2014, 85, 264–277. [Google Scholar] [CrossRef] [PubMed]
  60. Insalaco, S.A.; Herrero, H.V.; Limber, R.; Oliver, C.; Wolfson, W.B. Monitoring an Ecosystem in Crisis: Measuring Seagrass Meadow Loss Using Deep Learning in Mosquito Lagoon, Florida. Photogramm. Eng. Remote Sens. 2024, 90, 363–370. [Google Scholar] [CrossRef]
  61. Florida Fish and Wildlife Conservation Commission. Available online: https://myfwc.com/fishing/saltwater/commercial/ (accessed on 6 April 2025).
  62. Florida Fish and Wildlife Conservation Commission. Available online: https://myfwc.com/fishing/saltwater/recreational/snappers/ (accessed on 6 April 2025).
  63. Bacheler, N.M.; Gillum, Z.C.; Gregalis, K.C.; Schobernd, C.M.; Schobernd, Z.H.; Teer, B.Z. Spatial patterns in relative abundance and habitat use of adult gray snapper off the southeastern coast of the United States. Mar. Coast. Fish. 2020, 12, 205–219. [Google Scholar] [CrossRef]
  64. Gold, J.R.; Saillant, E.; Ebelt, N.D.; Lem, S. Conservation genetics of gray snapper (Lutjanus griseus) in US waters of the northern Gulf of Mexico and western Atlantic Ocean. Copeia 2009, 2009, 277–286. [Google Scholar] [CrossRef]
  65. Coleman, F.C.; Koenig, C.C.; Eklund, A.M.; Grimes, C.B. Management and conservation of temperate reef fishes in the grouper-snapper complex. In Life in the Slow Lane: Ecology and Conservation of Long-Lived Marine Animals; Musick, J.A., Heppell, S.S., Eds.; American Fisheries Society: Bethesda, MD, USA, 1999; pp. 233–242. [Google Scholar]
  66. National Oceanic and Atmospheric Administration. Available online: https://www.fisheries.noaa.gov/national/sustainable-fisheries/fisheries-united-states (accessed on 6 April 2025).
  67. National Oceanic and Atmospheric Administration Fisheries. Available online: https://www.fisheries.noaa.gov/foss/f?p=215:200:::::: (accessed on 6 April 2025).
  68. Smith, P.E. Balancing sampling precision and fisheries management objectives: Minimal methods. Bull. Mar. Sci. 1993, 53, 930–935. [Google Scholar]
  69. Jenkins, D.G.; Quintana-Ascencio, P.F. A solution to minimum sample size for regressions. PLoS ONE 2020, 15, e0229345. [Google Scholar] [CrossRef]
  70. Wimberger, P.H. Plasticity of fish body shape. The effects of diet, development, family and age in two species of Geophagus (Pisces: Cichlidae). Biol. J. Linn. Soc. 1992, 45, 197–218. [Google Scholar] [CrossRef]
  71. Dushoff, J.; Kain, M.P.; Bolker, B.M. I can see clearly now: Reinterpreting statistical significance. Methods Ecol. Evol. 2019, 10, 756–759. [Google Scholar] [CrossRef]
  72. Serrano, X.; Serafy, J.; Grosell, M. Osmoregulatory capabilities of the gray snapper, Lutjanus griseus: Salinity challenges and field observations. Mar. Freshw. Behav. Physiol. 2011, 44, 185–196. [Google Scholar] [CrossRef]
  73. Serrano, X.; Grosell, M.; Serafy, J.E. Salinity selection and preference of the grey snapper Lutjanus griseus: Field and laboratory observations. J. Fish Biol. 2010, 76, 1592–1608. [Google Scholar] [CrossRef] [PubMed]
  74. Hettler, W.F., Jr. Food habits of juveniles of spotted seatrout and gray snapper in western Florida Bay. Bull. Mar. Sci. 1989, 44, 155–162. [Google Scholar]
  75. Lewis, D.M.; Cook, G.S. Freshwater discharge disrupts linkages between the environment and estuarine fish community. Ecol. Indic. 2023, 151, 110282. [Google Scholar] [CrossRef]
  76. Lewis, D.M.; Thompson, K.A.; Macdonald, T.C.; Cook, G.S. Assessing the responses of an estuarine sport fish community to chronic ecological stressors and acute disturbances using an ensemble modeling approach. Ecol. Indic. 2021, 126, 107623. [Google Scholar] [CrossRef]
  77. McFarland, K.; Vignier, J.; Standen, E.; Volety, A.K. Synergistic effects of salinity and temperature on the eastern oyster Crassostrea virginica throughout the lifespan. Mar. Ecol. Prog. Ser. 2022, 700, 111–124. [Google Scholar] [CrossRef]
  78. Lonard, R.I.; Judd, F.W.; DeYoe, H.R.; Stalter, R. Biology and ecology of the halophyte Laguncularia racemosa (L.) Gaertn. f.: A review. In Handbook of Halophytes: From Molecules to Ecosystems Towards Biosaline Agriculture; Spinger: Berlin/Heidelberg, Germany, 2020; pp. 1–16. [Google Scholar]
  79. Matsuda, R.; Yamada, K.; Hayasaka, D.; Henmi, Y. Effects of salinity, temperature, and immersion conditions on seed germination of invasive Spartina alterniflora Loisel (smooth cordgrass) in Japan. Reg. Stud. Mar. Sci. 2023, 57, 102738. [Google Scholar] [CrossRef]
  80. Silva, B.P.; Saballo, H.M.; Lobo, A.K.M.; Neto, M.C.L. The plasticity of the photosynthetic apparatus and antioxidant responses are critical for the dispersion of Rhizophora mangle along a salinity gradient. Aquat. Bot. 2023, 185, 103609. [Google Scholar] [CrossRef]
  81. Smith, R.S.; Lusk, B.; Castorani, M.C. Restored oyster reefs match multiple functions of natural reefs within a decade. Conserv. Lett. 2022, 15, e12883. [Google Scholar] [CrossRef]
  82. Smith, R.S.; Castorani, M.C. Meta-analysis reveals drivers of restoration success for oysters and reef community. Ecol. Appl. 2023, 33, e2865. [Google Scholar] [CrossRef]
  83. Guthrie, A.G.; Bilkovic, D.M.; Mitchell, M.; Chambers, R.; Thompson, J.S.; Isdell, R.E. Ecological equivalency of living shorelines and natural marshes for fish and crustacean communities. Ecol. Eng. 2022, 176, 106511. [Google Scholar] [CrossRef]
  84. Auer, S.K.; Salin, K.; Rudolf, A.M.; Anderson, G.J.; Metcalfe, N.B. Differential effects of food availability on minimum and maximum rates of metabolism. Biol. Lett. 2016, 12, 20160586. [Google Scholar]
  85. Auer, S.K.; Salin, K.; Rudolf, A.M.; Anderson, G.J.; Metcalfe, N.B. Flexibility in metabolic rate confers a growth advantage under changing food availability. J. Anim. Ecol. 2015, 84, 1405–1411. [Google Scholar] [CrossRef] [PubMed]
  86. Croker, R.A. Growth and food of the gray snapper, Lutjanus griseus in Everglades National Park. Trans. Am. Fish. Soc. 1962, 91, 379–383. [Google Scholar] [CrossRef]
  87. Wuenschel, M.J.; Hare, J.A.; Kimball, M.E.; Able, K.W. Evaluating juvenile thermal tolerance as a constraint on adult range of gray snapper (Lutjanus griseus): A combined laboratory, field and modeling approach. J. Exp. Mar. Biol. Ecol. 2012, 436, 19–27. [Google Scholar] [CrossRef]
Figure 1. Map of northern oyster reef (A) and southern living shoreline (B) study sites where gray snapper were collected in Mosquito Lagoon. In both panels, solid boxes indicate the oyster reef and living shoreline sites used in analyses. For oyster reefs, D = dead reef (orange, n = 4); L = living/natural reef (green, n = 4); R = restored reef (blue, n = 8). For living shorelines, C = control shorelines (red, n = 3); S = stabilized living shoreline (yellow, n = 8). Red box in inset map indicates location of study area along Florida’s east coast. Center of study area between oyster reef habitat (Panel A) to the north and living shoreline (Panel B) to the south is ~28°54′57″ N, 80°49′29″ W.
Fishes 10 00336 g001
Figure 2. Example of live (positive control) oyster reef (photo credit: W. Chen).
Fishes 10 00336 g002
Figure 3. Example of positive control living shoreline (photo credit: G.S. Cook).
Fishes 10 00336 g003
Figure 4. A sectioned and polished gray snapper otolith (~157 days old). The ventral (V) and dorsal (D) sides are labeled, with daily age estimation (yellow arrow) counted from the core to the edge on the dorsal side (photo credit: W. Chen).
Fishes 10 00336 g004
Figure 5. The linear growth function fitted to a relationship with enumerated age (consensus-agreed ages in days) and standard length (mm) for gray snapper otolith samples from Mosquito Lagoon (n = 49). Light gray shading represents a 95% confidence interval.
Fishes 10 00336 g005
Table 1. Mean (±sd) and range of enumerated age (days), standard length (SL; mm), and total length (TL; mm) for all processed gray snapper otoliths on the lagoon (a) and habitat scale (b) (total n = 49).
(a)
Study Locationn (Total = 49)Mean Enumerated Age (Days)Enumerated Age Range (Days)Mean SL (mm)SL Range (mm)Mean TL (mm)TL Range (mm)
Mosquito Lagoon49175 ± 6656–35086.5 ± 30.626.0–160.0108.8 ± 39.032.0–206.0
(b)
Habitatsn (Total = 49)Mean Enumerated Age (Days)Enumerated Age Range (Days)Mean SL (mm)SL Range (mm)Mean TL (mm)TL Range (mm)
Living Shoreline13111 ± 3656–19259.6 ± 19.726.0–96.074.2 ± 24.932.0–121.0
Oyster Reef36198 ± 5897–35096.2 ± 28.148.0–160.0121.2 ± 35.660.0–206.0
Table 2. Mean (±sd) and range of otolith-derived age (days) and average percent error (percentage) between two readers for a subset of the 49 processed gray snapper otoliths from Mosquito Lagoon (n = 16).
Study LocationReaderMean Enumerated Age (Days)Enumerated Age Range (Days)Average Percent Error Average Percent Error Range
Mosquito Lagoon (total n = 16)Between Readers177 ± 52106–3035.2%0.3–12.0%
Reader 1170 ± 48103–2901.6%0.4–4.1%
Reader 2188 ± 58106–3173.4%1.2–7.3%
Table 3. Leading standard length GLMMs and coefficient estimates for captured gray snapper at the lagoon-scale (a); AICc weight = 0.703 (70.3%); AICc = −897.7; dAIC = 0; df = 12) = oyster reefs (b); AICc weight = 0.542 (54.2%); AICc = −499.6; dAIC = 0; df = 7) and living shorelines (c); AICc weight = 0.669 (66.9%); AICc = −387.1; dAIC = 0; df = 8). Asterisks next to “p(z)” p-values indicate statistical significance for given model variables, with more asterisks indicating higher statistical significance. Continuous variables were scaled in each model to allow for coefficient comparisons. Marginal (fixed effects) and conditional (fixed and random effects) R2 were used to determine model fit for all models.
(a)
Lagoon-Scale Model
Log (Standard Length) ~ Log (Mass) + Lagged Dissolved Oxygen + Lagged Salinity + Lagged Water Temperature + Site Type + (1|Sampling Date)
R2m = 0.98 R2c = 0.99
Coefficient EstimatesEstimateSEp(z)
Fixed EffectsControl Living Shorelines3.4890.013<0.001 ***
Log (Mass)0.3310.003<0.001 ***
Lagged Dissolved Oxygen−0.0020.0090.842
Lagged Salinity0.0280.0090.001 **
Lagged Water Temperature−0.00040.0090.965
Dead Oyster Reefs0.0020.0110.826
Live Oyster Reefs−0.0040.0110.748
Stabilized Living Shorelines0.0070.0080.391
Restored Oyster Reefs (2017)0.0270.0120.022 *
Restored Oyster Reefs (2018)0.0060.0150.666
Std. Dev.
Random EffectsSampling Date 0.03
(b)
Habitat-Scale Oyster Reef Model
Log (Standard Length) ~ Log (Mass) + Site Type + (1|Sampling Date)
R2m = 0.97 R2c = 0.99
Coefficient EstimatesEstimateSEp(z)
Fixed EffectsDead Oyster Reefs3.4930.017<0.001 ***
Log (Mass)0.3340.004<0.001 ***
Live Oyster Reefs−0.0040.0080.667
Restored Oyster Reefs (2017)0.0280.0090.001 **
Restored Oyster Reefs (2018)−0.0040.0120.768
Std. Dev.
Random EffectsSampling Date 0.04
(c)
Habitat-Scale Living Shoreline Model
Log (Standard Length) ~ Log (Mass) + Lagged Dissolved Oxygen + Lagged Salinity + Lagged Water Temperature + Site Type + (1|Sampling Date)
R2m = 0.99 R2c = 0.99
Coefficient EstimatesEstimateSEp(z)
Fixed EffectsControl Living Shorelines3.4710.016<0.001 ***
Log (Mass)0.3300.004<0.001 ***
Lagged Dissolved Oxygen−0.0150.0100.145
Lagged Salinity0.0270.0100.005 **
Lagged Water Temperature−0.0110.0110.333
Stabilized Living Shorelines0.0080.0080.316
Std. Dev.
Random EffectsSampling Date 0.02
Table 4. Mean (±sd) and range of calculated age (days), mass (g), standard length (SL) and total length (TL) for all captured gray snapper in Mosquito Lagoon (a); n = 241, including habitat-scale (b) and site-type-specific scale (c) mean (±sd). Please see Figure 5 for the linear growth function used to calculate age.
(a)
Study Locationn (Total = 241)Mean Calculated Age (Days)Calculated Age Range (Days)Mean Mass (g)Mass Range (g)Mean SL (mm)SL Range (mm)Mean TL (mm)TL Range (mm)
Mosquito Lagoon241181 ± 6654–37226.1 ± 24.80.6–122.088.7 ± 28.826.0–171.0110.9 ± 36.232.0–207.0
(b)
Habitatsn (Total = 241)Mean Calculated Age (Days)Calculated Age Range (Days)Mean Mass (g)Mass Range (g)Mean SL (mm)SL Range (mm)Mean TL (mm)TL Range (mm)
Living Shoreline105154 ± 6354–37218.4 ± 19.30.06–121.877.4 ± 27.526.0–171.096.2 ± 34.432.0–207.0
Oyster Reef136201 ± 6074–35032.0 ± 26.92.2–122.097.5 ± 26.743.0–160.0122.2 ± 33.553.0–206.0
(c)
Habitats and Site Typesn (Total = 241)Mean Calculated Age (Days)Calculated Age Range (Days)Mean Mass (g)Mass Range (g)Mean SL (mm)SL Range (mm)Mean TL (mm)TL Range (mm)
Living Shoreline (n = 105)
Stabilized74151 ± 6256–37217.8 ± 20.20.6–121.876.0 ± 26.932.0–207.094.3 ± 33.732.0–207.0
Live31161 ± 6754–28820.1 ± 17.11.1–71.580.9 ± 28.934.0–135.0101.0 ± 36.041.0–172.0
Oyster Reef (n = 136)
Live37197 ± 57105–31932.4 ± 26.83.2–100.596.7 ± 26.456.0–149.0122.2 ± 33.870.0–190.0
Dead35191 ± 5774–32325.2 ± 19.72.2–101.191.4 ± 24.643.0–150.0114.6 ± 30.353.0–189.0
R1–R445197 ± 58101–35029.6 ± 26.74.2–122.096.5 ± 25.348.0–161.0120.6 ± 31.961.0–206.0
R5–R819238 ± 6786–34049.8 ± 33.02.9–111.8112.7 ± 30.348.0–157.0139.8 ± 38.457.0–194.0
Disclaimer/Publisher’s Note: The statements, opinions and data contained in all publications are solely those of the individual author(s) and contributor(s) and not of MDPI and/or the editor(s). MDPI and/or the editor(s) disclaim responsibility for any injury to people or property resulting from any ideas, methods, instructions or products referred to in the content.