Article

Impacts of Low-Order Stream Connectivity Restoration Projects on Aquatic Habitat and Fish Diversity

Fishery Machinery and Instrument Research Institute, Chinese Academy of Fishery Sciences, Shanghai 200092, China
*
Author to whom correspondence should be addressed.
Fishes 2025, 10(7), 321; https://doi.org/10.3390/fishes10070321
Submission received: 1 June 2025 / Revised: 28 June 2025 / Accepted: 29 June 2025 / Published: 2 July 2025
(This article belongs to the Special Issue Biodiversity and Spatial Distribution of Fishes, Second Edition)

Abstract

River barriers constitute a key factor that is degrading river connectivity and represent a critical research focus in riverine ecosystem conservation. Management authorities and river restoration agencies globally have increasingly employed barrier removal or modification for connectivity restoration projects in recent years, practices that are widely discussed and empirically supported in academia. However, existing research predominantly focuses on large dams in primary rivers, overlooking the more severe fragmentation caused by low-head barriers within low-order streams. This study targets the Yanjing River (total length: 70 km), a third-order tributary of the Yangtze River basin, implementing culvert modification and complete removal measures, respectively, for two river barriers distributed within its terminal 9 km reach. Using differential analysis, principal component analysis (PCA), cluster analysis, Mantel tests, and structural equation modeling (SEM), we systematically examined the mechanisms by which connectivity restoration projects influences aquatic habitat and fish diversity, the evolution of reach heterogeneity, and intrinsic relationships between aquatic environmental factors and diversity metrics. Results indicate that (1) the post-restoration aquatic habitat significantly improved with marked increases in fish diversity metrics, where hydrochemical factors and species diversity exhibited the highest sensitivity to connectivity changes; (2) following restoration, the initially barrier-fragmented river segments (upstream, middle, downstream) exhibited significantly decreased differences in aquatic habitat and fish diversity, demonstrating progressive homogenization across reaches; (3) hydrological factors exerted stronger positive effects on fish diversity than hydrochemical factors did, particularly enhancing species diversity, with a significant positive synergistic effect observed between species diversity and functional diversity. These studies demonstrate that “culvert modification and barrier removal” represent effective project measures for promoting connectivity restoration in low-order streams and eliciting positive ecological effects, though they may reduce the spatial heterogeneity of short-reach rivers in the short term. It is noteworthy that connectivity restoration projects should prioritize the appropriate improvement of hydrological factors such as flow velocity, water depth, and water surface width.
Key Contribution: This study targeted the river barriers at the ends of low-order streams and implemented a coupled connectivity restoration projects of “dam removal + culvert reconstruction”. Using differential analysis, sequential clustering, the Mantel test, and an SEM model, this study systematically analyzed the impacts on aquatic habitat and fish diversity, the changes in regional heterogeneity and their correlations, and identified the main driving factors for fish community stability.

Graphical Abstract

1. Introduction

With the advancement of society, human utilization of rivers has evolved from basic survival needs to diverse sectors such as shipping, irrigation, hydropower generation, and fishery production [1,2]. The extensive construction of river barriers (e.g., large dams, weirs, bridge piers, culverts) within river systems has created millions of channel obstructions [3,4]. Studies indicate that approximately 2.8 million dams have been constructed globally, with over 3700 hydropower dams of a ≥1 MW installed capacity currently under construction [4]. While dam projects enhance flood control capabilities through regulated water discharge, promote floodplain development, and generate economic benefits, they fundamentally alter the natural attributes of rivers [5,6]. Currently, only 37% of the world’s rivers exceeding 1000 km flow freely throughout their entire courses, predominantly in regions with sparse human activity [3,4]. River barriers trigger a series of ecological impacts, such as impeding sediment transport, attenuating flood peak flows, disrupting fish spawning cycles, reducing fish diversity, and altering food web structures [7,8,9,10]. Additionally, the high-energy water flows from concentrated reservoir releases continuously erode downstream riverbeds, severely damaging geomorphic units that are critical for “three habitats and one passage” (spawning grounds, feeding grounds, overwintering sites, and migration corridors) [7,11,12].
River connectivity restoration has emerged as a core issue in river health management over the past decade, aiming to reconstruct four-dimensional connectivity—lateral, longitudinal, vertical, and spatio-temporal—to restore river integrity and repair fragmented ecosystems [4,13]. This systematic restoration enhances geomorphic heterogeneity and ensures the transport efficiency of material flows (e.g., water, sediment, nutrients), species flows (e.g., fish migration, egg and larva dispersal), and information flows (e.g., flood pulses), laying the foundation for maintaining biodiversity [12,14]. European and American countries have established well-developed policy support systems and implemented restoration practices, with barrier removal and modification as the primary technical approaches [15,16,17]. Since the 1970s, the United States has removed over 1400 dams, with more than 80% of these removals occurring in the past 20 years [15,18,19,20]. Culvert optimization and road modifications have also been widely applied [21]. Research shows that among the over 1.2 million river obstacles in Europe, only 13.1% exceed 10 m in height, while 68% are ≤2 m [3]. Notably, the key constraints on river network connectivity are not the heights of obstacles but their distribution density and location [3]. Therefore, clearing barriers in low-order streams should be prioritized in connectivity restoration, as such projects are both economically viable and socially acceptable, easily gain recognition from local stakeholders, and are crucial for ensuring the sustainability of restoration initiatives [3,15].
As indicator species of river ecological integrity, fish—owing to their apex position in freshwater food webs—are often the core assessment targets for connectivity restoration [22,23]. Current solutions to address fish migration barriers include removing river barriers, constructing natural-like bypass channels, installing diversified fishway systems, and establishing fish ladder transportation facilities, all aimed at restoring continuous habitats that are required for critical ecological behaviors such as spawning migration, feeding dispersal, and overwintering [24,25]. Although existing restoration practices have achieved some results in ecological benefit assessments [10,16], two aspects require further investigation. First, there is a lack of research on the mechanisms of longitudinal connectivity restoration in low-order streams [3,5]. As vital components of river networks, low-order streams not only regulate mainstem water bodies but also provide breeding refuges and nutrient subsidies for small-to-medium-sized fish and juveniles through their unique hydrodynamic conditions [26]. However, most current restoration projects focus on mainstem corridors, neglecting the critical role of tributaries in maintaining basin-wide biodiversity [26]. Second, the ecological effect assessment framework remains underdeveloped. Existing studies are mostly limited to single dimensions such as water quality factors and fish species diversity, failing to systematically reveal the mechanisms linking changes in fish habitat environments and fish diversity by integrating fish functional diversity [17,27,28].
Based on a connectivity restoration projects conducted in 2023 on the Yanjing River (a tertiary low-order stream of the Yangtze River and a secondary tributary of the Chishui River Basin), this study collected hydrological factors, hydrochemical factors, and fish abundance and species data through sampling. Using PCA, cluster, Mantel, and SEM analytical methods, we aim to address three questions: (1) How have habitat environments and fish diversity changed before and after connectivity restoration projects? (2) How has the heterogeneity of the upper, middle, and lower river reaches evolved after connectivity restoration projects, following the removal of river barriers? (3) What are the intrinsic linkages between habitat environments and fish diversity?

2. Materials and Methods

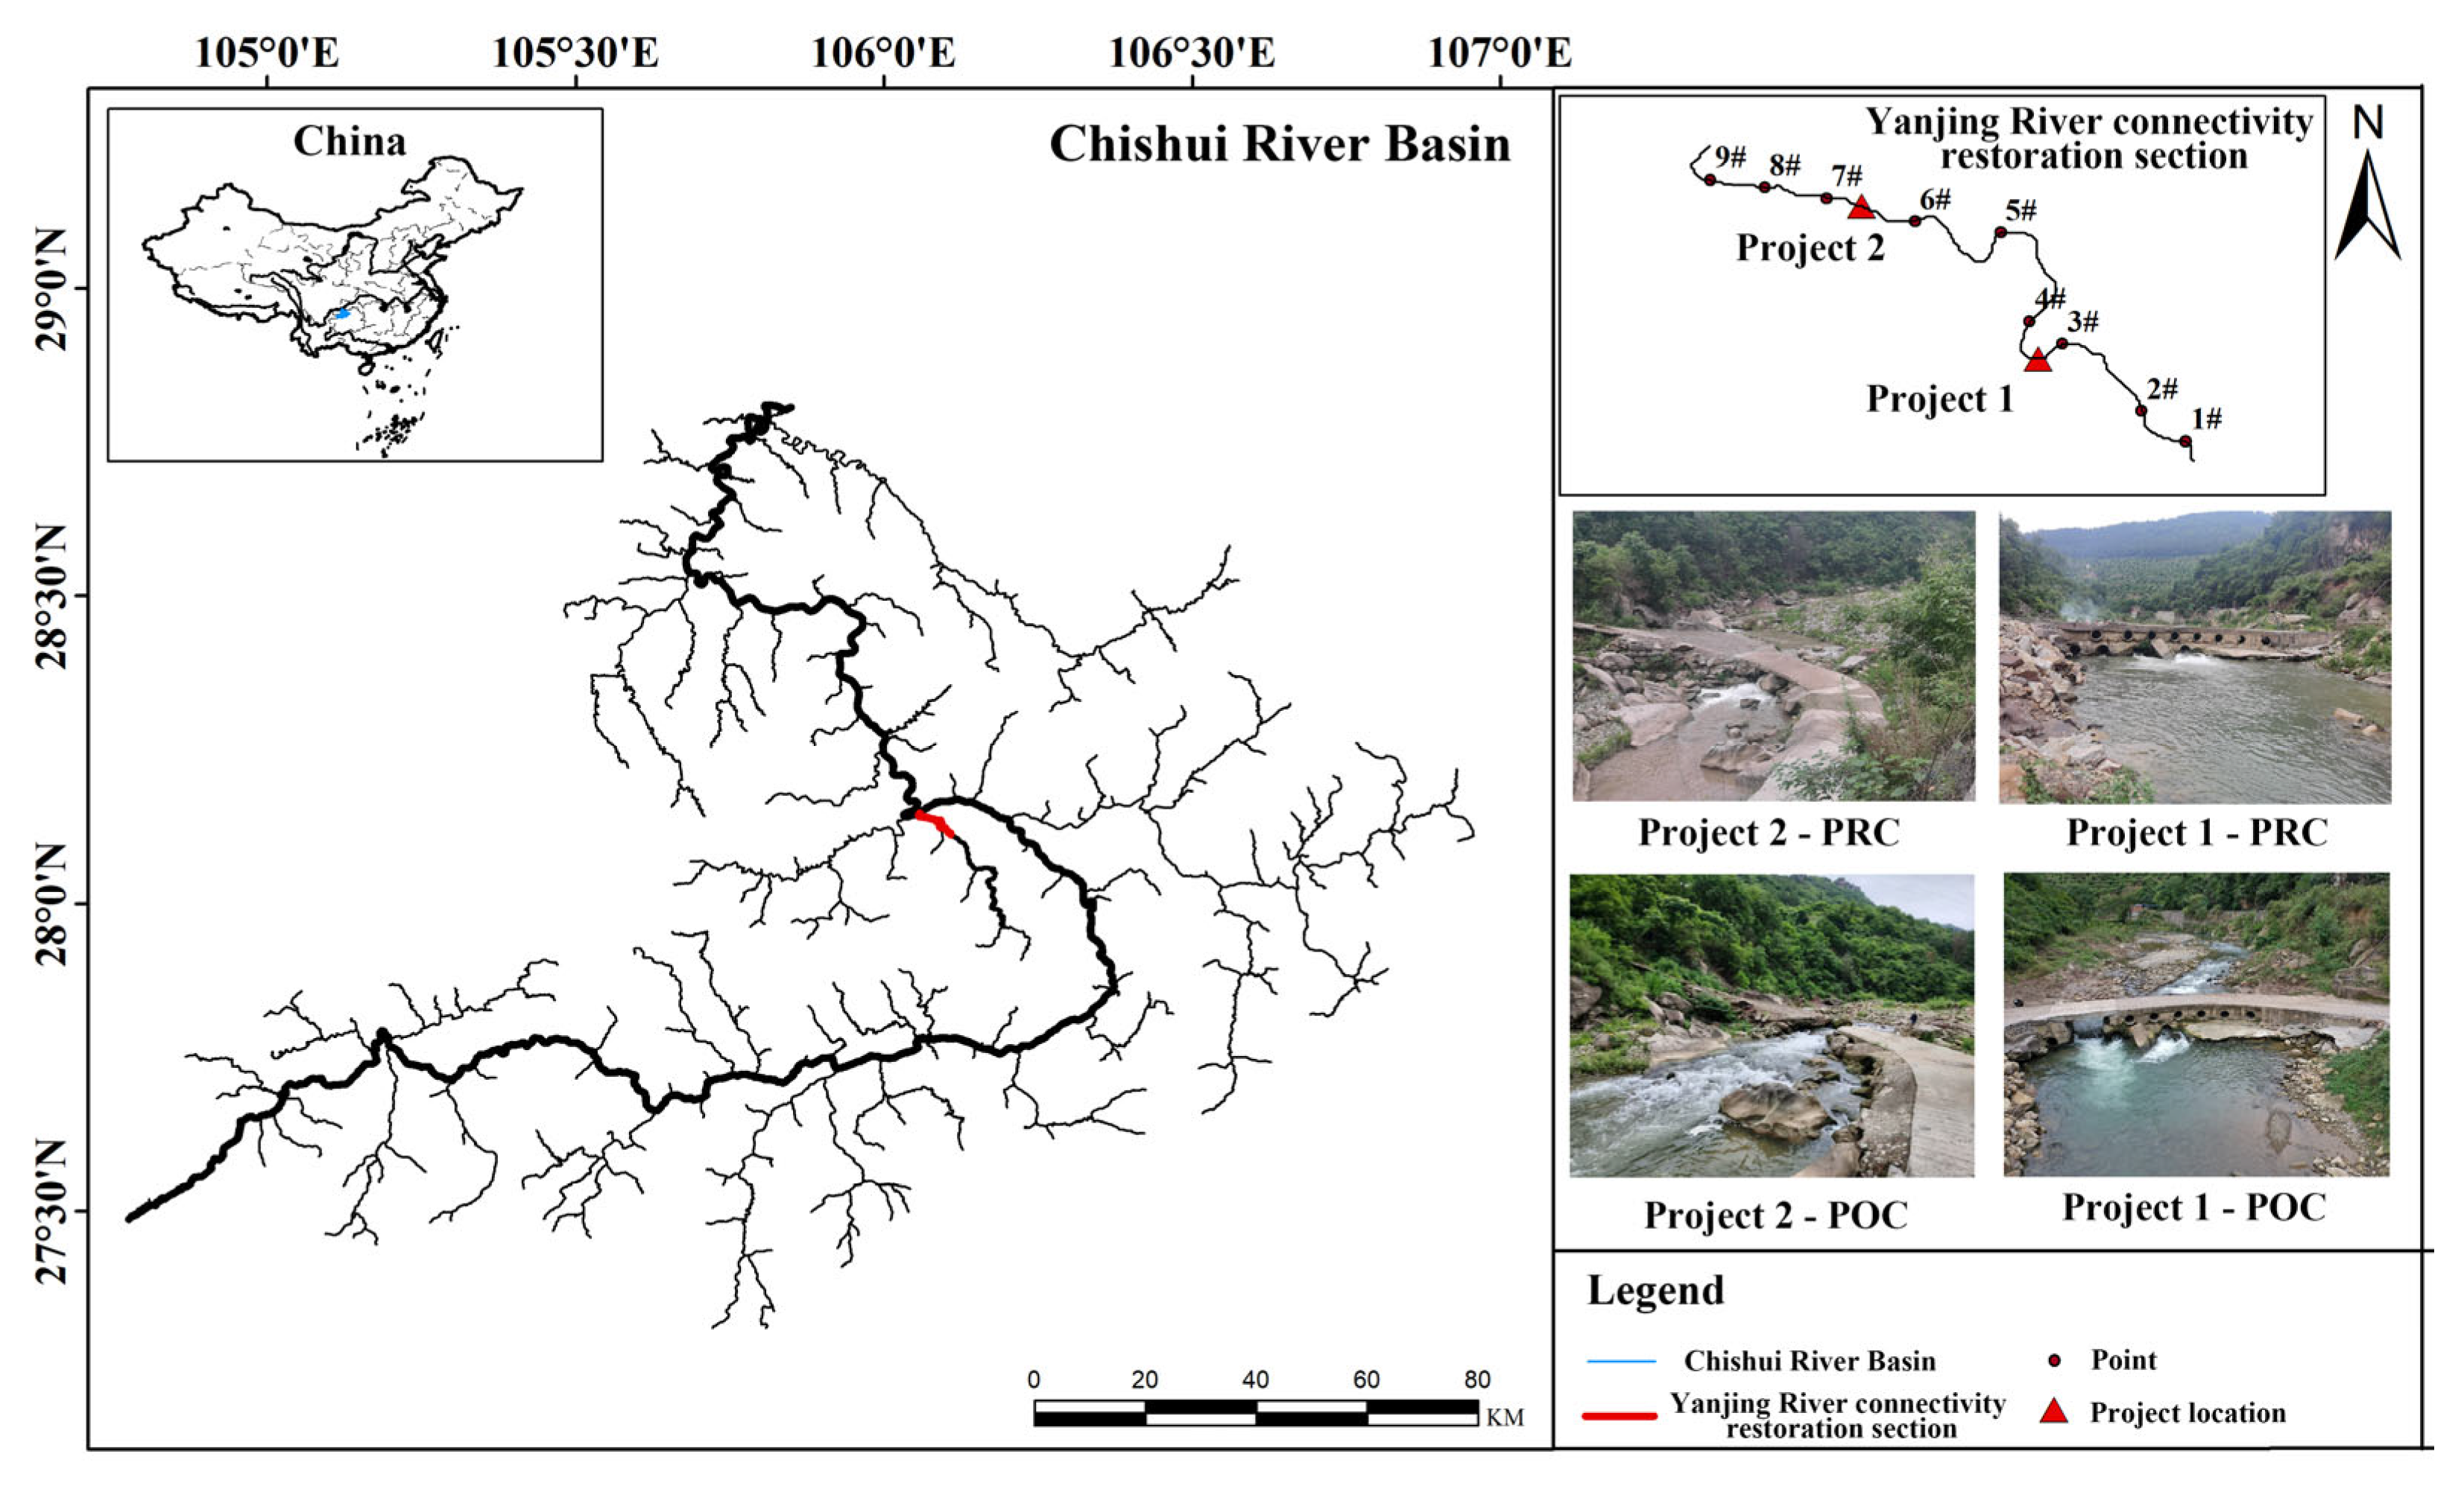
2.1. Connectivity Project Implementation Area

The Chishui River Basin (104°45′–106°51′ E, 27°20′–28°50′ N), shaped like a mulberry leaf, originates from Chishuiyuan Town of Zhenxiong County in Yunnan Province at the northern foot of the Wumeng Mountains, flows through Yunnan, Guizhou, and Sichuan provinces, and converges into the Yangtze River at Hejiang County of Sichuan Province. The main stream has a total length of approximately 437 km and a drainage area of about 21,000 km2. The basin is characterized by numerous tributaries, with larger ones distributed on the eastern and southern banks (14 major tributaries in total) and relatively smaller ones on the western and northern banks (7 main tributaries in total). Tributaries with a drainage area exceeding 1000 km2 within the entire river system include the Tongzi River, Xishui River, Erdao River, Datong River, and Gulin River [29,30].
Yanjing River, located on the left bank of the middle-lower reaches of the Chishui River Basin, originates from Shuikou Township, Gulin County, and converges into the main stream of the Chishui River at Jiuxikou, Gulin County. With a total length of approximately 70 km, it is a typical low-order stream characterized by a generally low water volume. Field surveys identified 11 in-river structures. Although abundant summer rainfall allows water to overflow over most barriers during July and August, the river remains blocked at these structures for the rest of the year.

2.2. Connectivity Restoration Measures

Considering the characteristics that most fish in Yanjing River are small-to-medium-sized and have weak swimming ability (According to the fish collection results before the implementation of the connectivity restoration projects, the dominant species were Zacco platypus, Opsariichthys bidens, Hemiculter leucisculus, and Acrossocheilus yunnanensis.), the connectivity restoration needs to achieve the dual objectives of restoring channel flow and reducing the flow velocity at the river barriers. Based on Yi et al.’s research conclusion that the closer the river barrier is to the confluence, the greater the damage to river connectivity [31], restoration projects were carried out on two river barriers at the end of Yanjing River in August-September 2023. Project 1 (28°07′23.67″ N, 106°05′34.25″ E) is located 6.2 km away from the Chishui River. Although the river-crossing road is equipped with a culvert, its base is too high, allowing water to pass only in summer and with too fast of a flow velocity, which hinders fish from migrating upstream. Measurements show that the roadbed height is 0.5 m, the drop from the road surface to the riverbed is 2.6 m, and the total length of the road is 25 m. Considering that it still undertakes the traffic function, a culvert renovation scheme was adopted; after removing the right 5 m of the road surface and roadbed, a reinforced concrete tunnel was re-poured to balance the functions of traffic and ecological corridor. Project 2 (28°08′26.78″ N, 106°03′56.46″ E) is located 1.6 km away from the Chishui River. It was originally an abandoned road that cut off the river, forming a 90 cm high drop, and a full demolition method was used to restore river connectivity. The implementation location of the connectivity restoration project is shown in Figure 1.

2.3. Sampling Site Setup and Sampling Timing

To address the three research questions, the river reach was divided into three zones according to barrier locations with 1#–3# as the project’s upstream section, 4#–6# as the inter-project section, and 7#–9# as the project’s downstream section.
A Before–After–Control–Impact (BACI) design was employed, involving three sampling campaigns: water and fish samples were collected in July 2023 (summer, pre-connectivity), February 2024 (winter, half a year post-connectivity), and July 2024 (summer, one year post-connectivity).

2.4. Measurement of Aquatic Environmental Factors

In accordance with the Specification for Geodesic Survey in Hydrology (SL 58-2014) [32], wading measurement was used for data collection due to the study reach’s characteristics of narrow cross-sections (width < 25 m) and shallow water depth (<1.5 m). Three hydrochemical factors—dissolved oxygen (DO), pH, and turbidity (TUR)—and three hydrological factors—water velocity (V), water depth (WD), and water surface width (W)—were measured. Hydrochemical factors were recorded using a YSI ProQuatro portable multiparameter water quality analyzer (Xylem Inc., Washington, DC, USA), with three replicate measurements taken at the center of each sampling section and with the mean value documented. Hydrological factor measurements employed a multi-point sampling method: water velocity was measured using an ultrasonic handheld LS1206B propeller (Shandong Jingdao Optoelectronic Technology Co., Ltd., Qufu, China) flow meter, with three measurement points set by dividing the cross-section into four equal parts, where surface and bottom velocities were separately determined at each point before calculating the cross-sectional average; water surface width was directly measured with a tape measure across both river banks, with additional measurements taken 3 m upstream and downstream from the section to derive a mean value; water depth was synchronously measured vertically with a tape measure at the same velocity-measuring points, and the sectional water depth was represented by the average of the three points.

2.5. Fish Sampling and Data Collection

Fish collection employed a sampling method combining three-layer composite gillnets and bottom-set cage nets, with one set deployed at each sampling section. The three-layer composite gillnet, measuring 1.5 m in height and 150 m in length, was composed of three gillnets with different mesh sizes (2 cm, 6 cm, and 10 cm) connected in series, with each individual gillnet sized at 1.5 m × 50 m. The bottom-set cage net had dimensions of 18 m × 0.45 m × 0.33 m. The three-layer composite gillnet was stretched across the river, while the bottom-set cage net was placed in still or slightly flowing water areas. To minimize damage to the catch caused by high temperatures and water flow, nets were retrieved every six hours, and each sampling cycle lasted 24 h.
Fish specimens were classified and identified by observing their external morphological characteristics, referring to the Colored Atlas of Fishes in Sichuan, China [33] and The Fishes of Yunnan, China [34]. The individual numbers of each species were meticulously recorded.

2.6. Selection of Functional Traits

Functional traits of fish species were selected by referring to Colored Atlas of Fishes in Sichuan, China [33]; The Fishes of Guizhou, China [35]; the FishBase website (https://www.fishbase.org/search.php?lang=scChinese, accessed on 5 November 2024), and the relevant literature [36,37,38]. Five major categories of functional traits were included: reproduction (spawning type, age at first maturity, body length at first maturity, spawning season, absolute fecundity, relative fecundity), habitat (water velocity preference, water layer occupancy, ecological habitat type, preferred water temperature), feeding (mouth position, feeding habit, trophic level), growth (maximum lifespan, vulnerability, life history strategy, growth rate, population resilience), and locomotion (number of maxillary barbels, body shape, maximum body length).

2.7. Fish Diversity

2.7.1. Selection of Species Diversity Indices

During the selection of species diversity indices, this study systematically reviewed the literature on the impact of ecological restoration on fish species diversity, and comprehensively considered the differences in the community characteristic representation ability and sample size sensitivity of different diversity indices [39,40,41]. In view of the practical situation wherein the spatial scale and sample size of the study area are relatively limited, six targeted species diversity indices were selected for use in this study. Specifically, the Shannon index (H’) can comprehensively reflect the diversity and stability of community structure, and is suitable for comprehensively evaluating the complexity of ecosystems; the Margalef richness index (Ma) focuses on quantifying the species richness in the community, intuitively showing the quantitative characteristics of species; the Brillouin index (HB) is particularly suitable for the analysis of community structure diversity under the condition of a small sample size, which can effectively reduce the interference of sample size on the results; the Pielou evenness index (J’) is extremely sensitive to the number fluctuations of rare species, helping to reveal the distribution dynamics of rare species in the community; the Gini–Simpson index (D1-d) focuses on measuring the impact of the number changes in dominant species on community evenness; and the Simpson index (D) is mainly used to characterize the dominance of species and clarify the composition of dominant species in the community. The calculation methods of the above indices follow the references [39,40,41]. In addition, this study conducted a joint analysis of fish density (De) and the number of species (S) to intuitively evaluate the impact of the connectivity restoration projects on fishery resources. Fish density is defined as the ratio of the number of fish individuals captured at a sampling point to the distance between sampling points (the distance between the central points of adjacent sampling points; for sampling points 3# and 7#, the distance between the central point and the project point is used).

2.7.2. Selection of Functional Diversity Indices

In contrast to species diversity, functional diversity places greater emphasis on the differences in traits and functions among species within a community. Based on the three dimensions of richness, evenness, and dispersion, and drawing on relevant research, this study selected five indices [42]. Specifically, Functional Richness (FRic) is used to quantify the volume of functional space occupied by species in a community, directly reflecting the distribution range of functional traits and embodying the ecological niche breadth of community functions. Functional Evenness (FEve) reveals the evenness of resource utilization within the community by measuring the regularity of a species distribution in functional space, reflecting the niche differentiation strategies of species. Functional Divergence (FDiv) evaluates the degree to which species deviate from the centroid in functional space, which can be used to characterize the intensity of resource differentiation and interspecific competition, while also reflecting the dominant position of species with extreme functional traits. Functional Dispersion (FDis) calculates the average distance from species to the centroid of functional space, quantifying the degree of dispersion of functional traits and reflecting the discrete characteristics of community functional structure. As a comprehensive index, Rao’s Quadratic Entropy Index (RaoQ) quantifies the overall differences in functional traits among species within a community, integrating information on the diversity and dissimilarity of functional traits. The calculation methods of the above indices follow the methods of Zhang [43].

2.8. Data Analysis Methods and Software

2.8.1. Differential Analysis

Differential analysis was employed to evaluate the impact of the connectivity restoration projects on the aquatic habitat. First, the Shapiro–Wilk test and Levene’s test were used to conduct normality and homogeneity of variance tests, respectively, on six aquatic environmental factors (DO, TUR, pH, V, W, and WD) measured during different restoration periods. If both test conditions were met, one-way analysis of variance (ANOVA) was applied; otherwise, the Kruskal–Wallis test for multiple independent samples was used. To determine the differences between groups, post hoc multiple comparisons were further carried out: the Least Significant Difference (LSD) method was applied to parameters analyzed by one-way ANOVA, while the Nemenyi method was used for parameters from the Kruskal–Wallis test. All data analyses were performed using SPSS 27.0.1, ensuring methodological rigor and consistency in statistical evaluation.

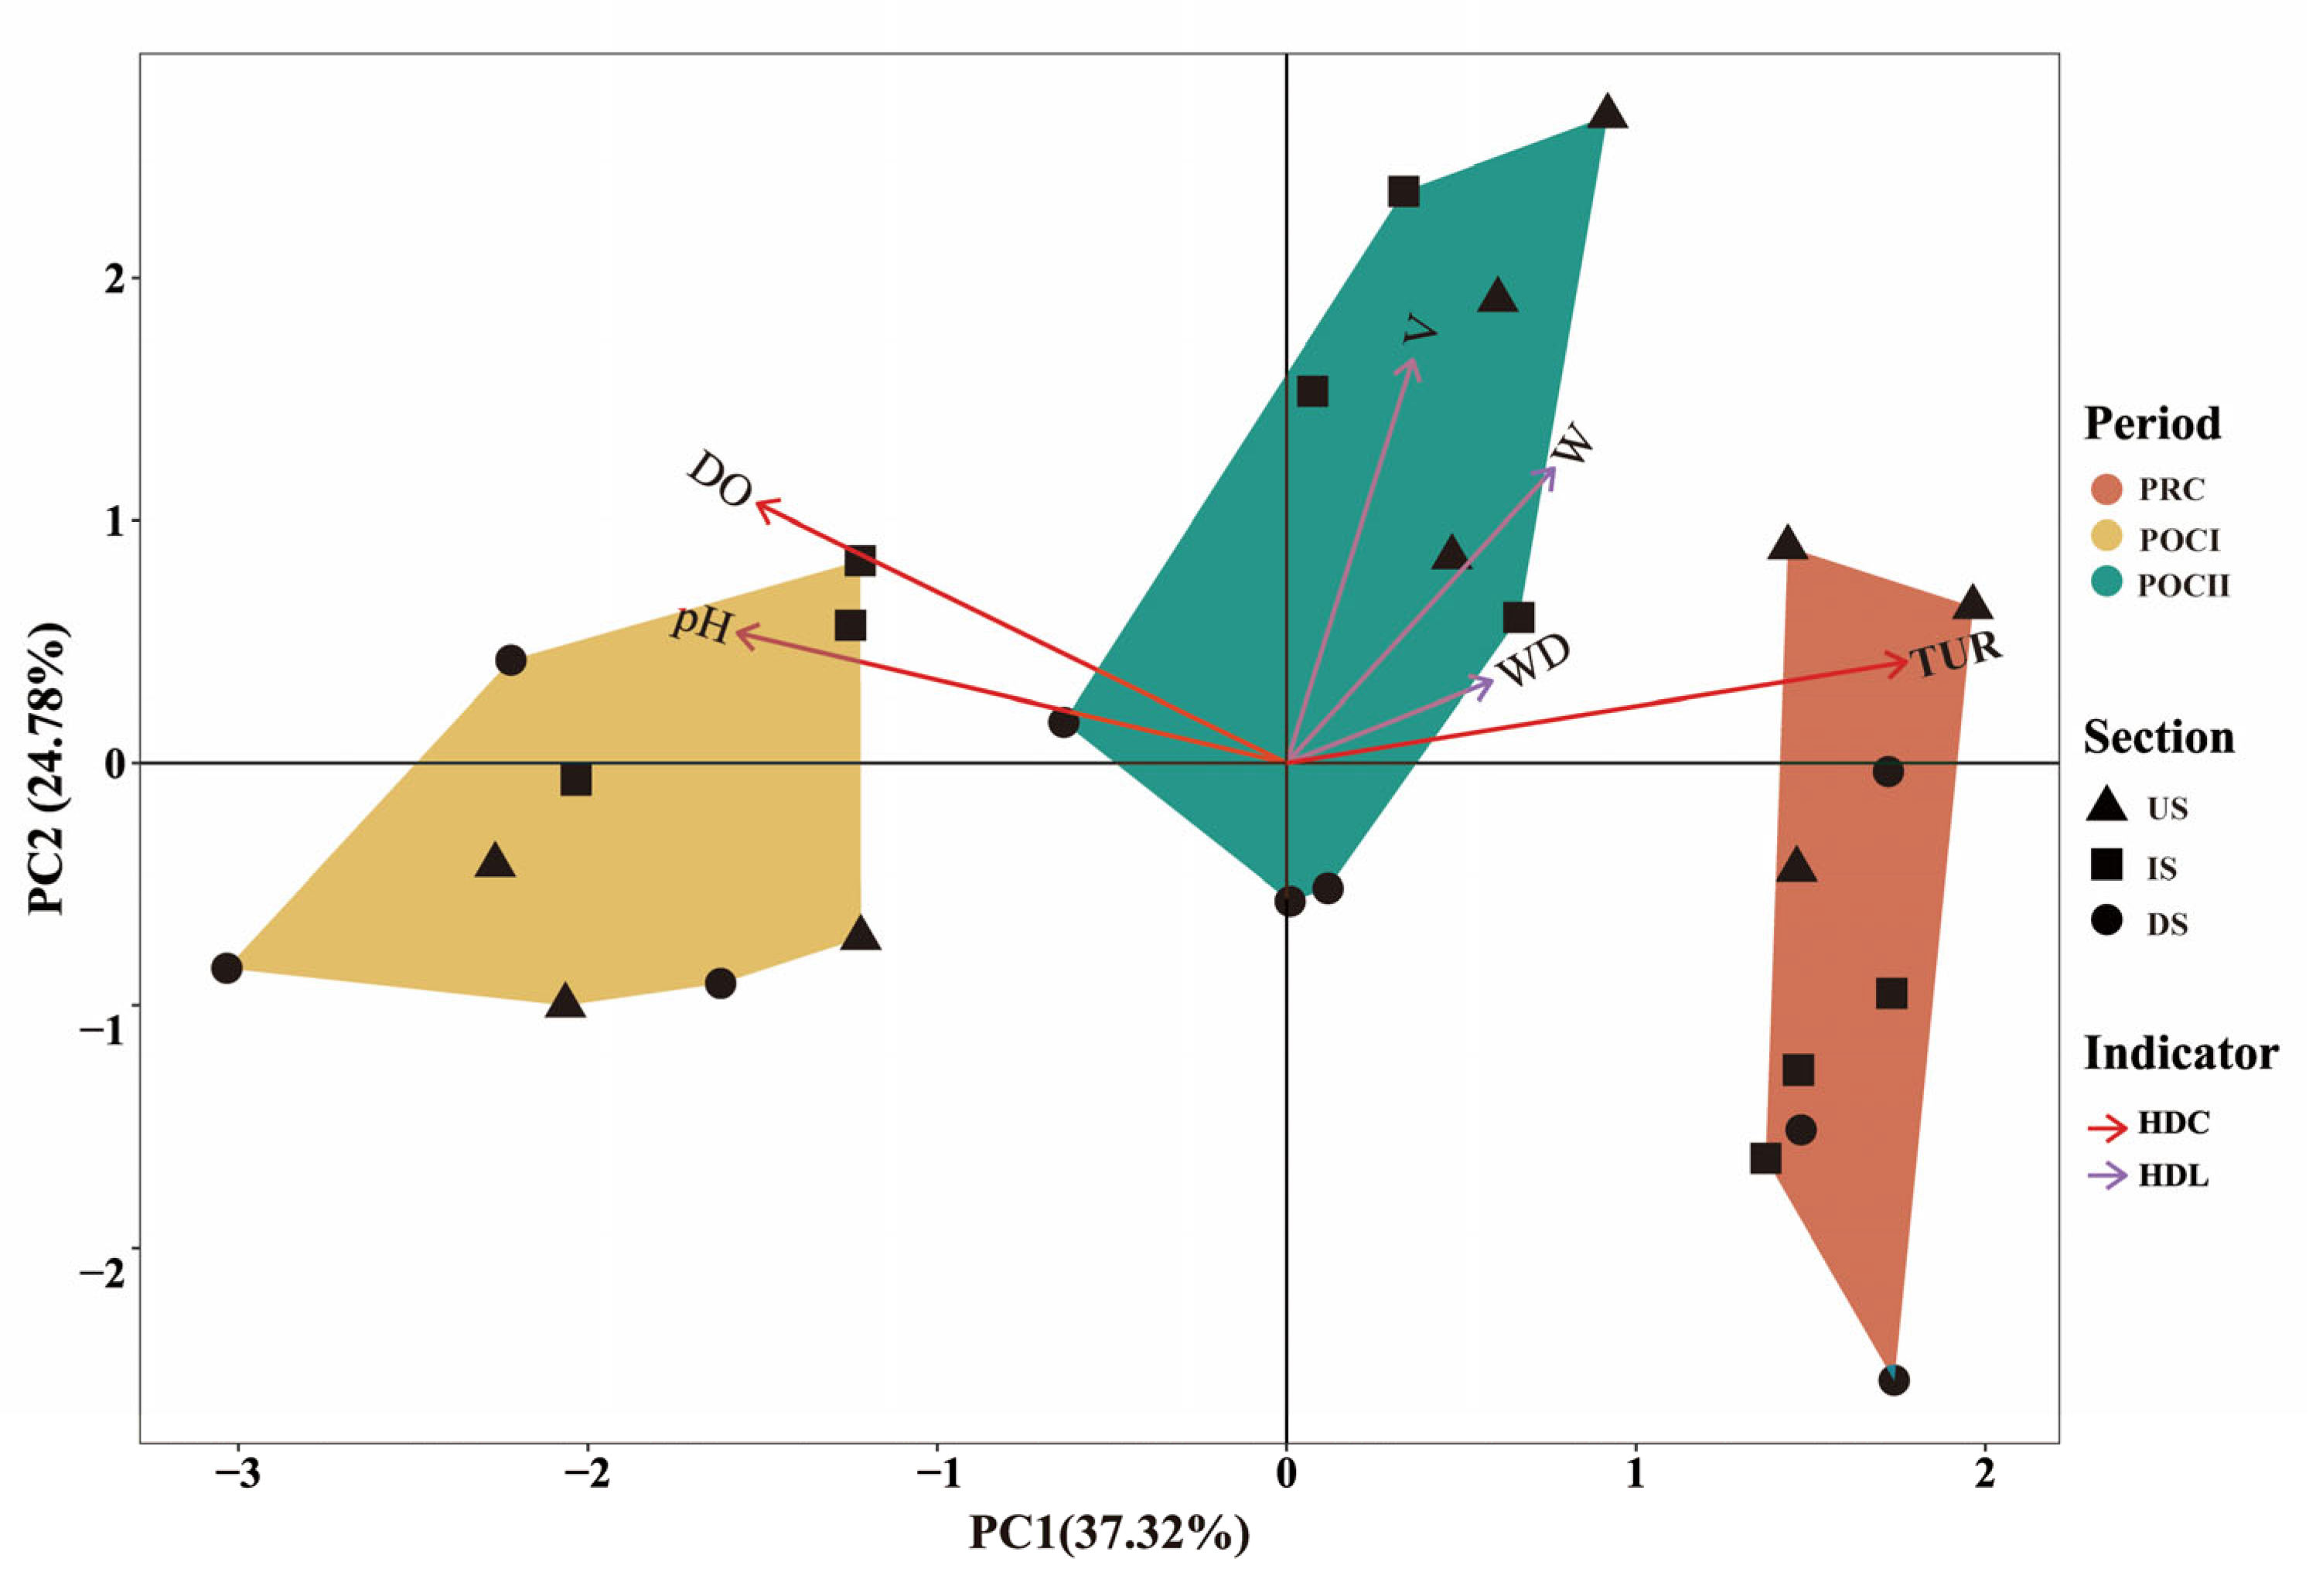
2.8.2. Principal Component Analysis (PCA)

To analyze the heterogeneity characteristics of the aquatic habitat among different sections (sampling sites) across three periods, this study employed principal component analysis (PCA). Initially, the raw data were standardized to eliminate the influence of dimensional differences and range variations on the analysis results. Subsequently, the Kaiser–Meyer–Olkin (KMO > 0.5) test and Bartlett’s test of sphericity (p < 0.05) were conducted to evaluate the suitability of the data for PCA. Finally, the dimensionality reduction results were visualized. Based on the spatial distribution characteristics of the sampling points in the visualization plots, data groups were classified through cluster analysis, and the significance of differences between groups was tested using Permutational Multivariate Analysis of Variance (PERMANOVA). Additionally, key driving factors for each cluster group were identified according to the arrow directions and lengths of the six aquatic environmental factors in the principal component space. The study utilized the ‘PCA()’ function from the “FactoMineR” package (Version 2.1.1) in R to perform principal component analysis and employed the ‘Adonis2()’ function from the “Vegan” package (Version 2.7-1) to conduct PERMANOVA tests, ensuring the reliability and scientific validity of the analysis results.

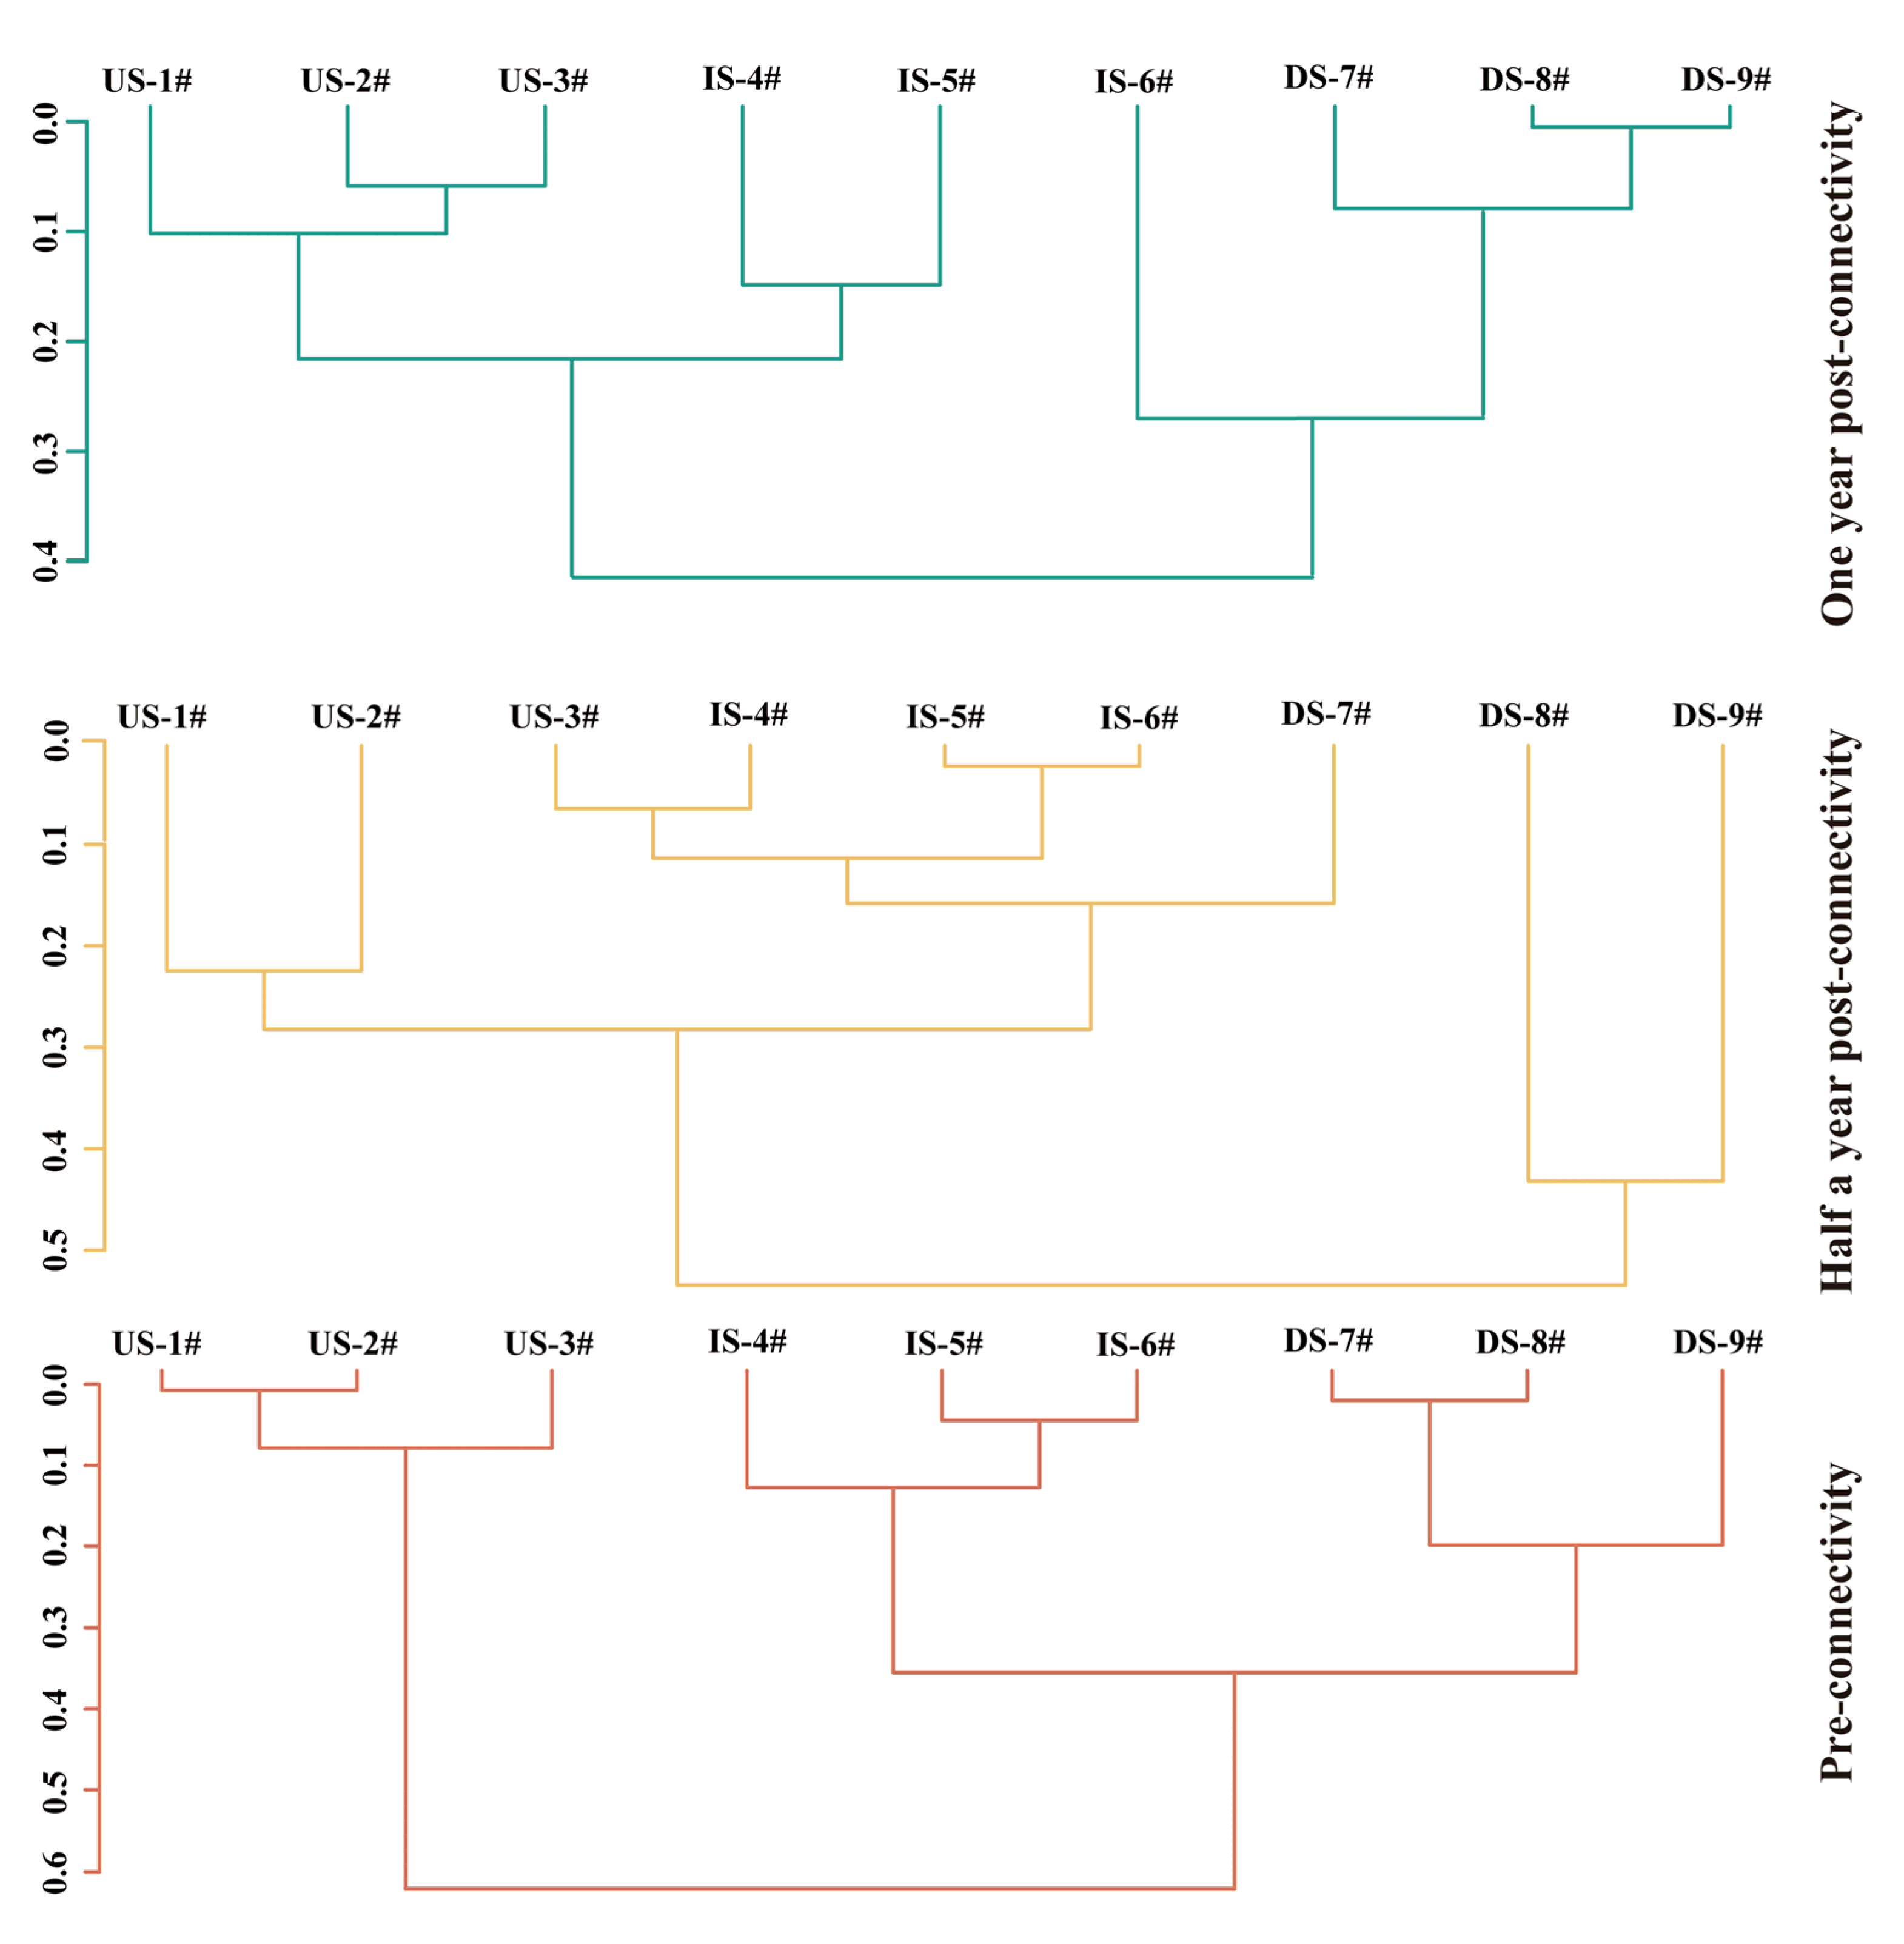
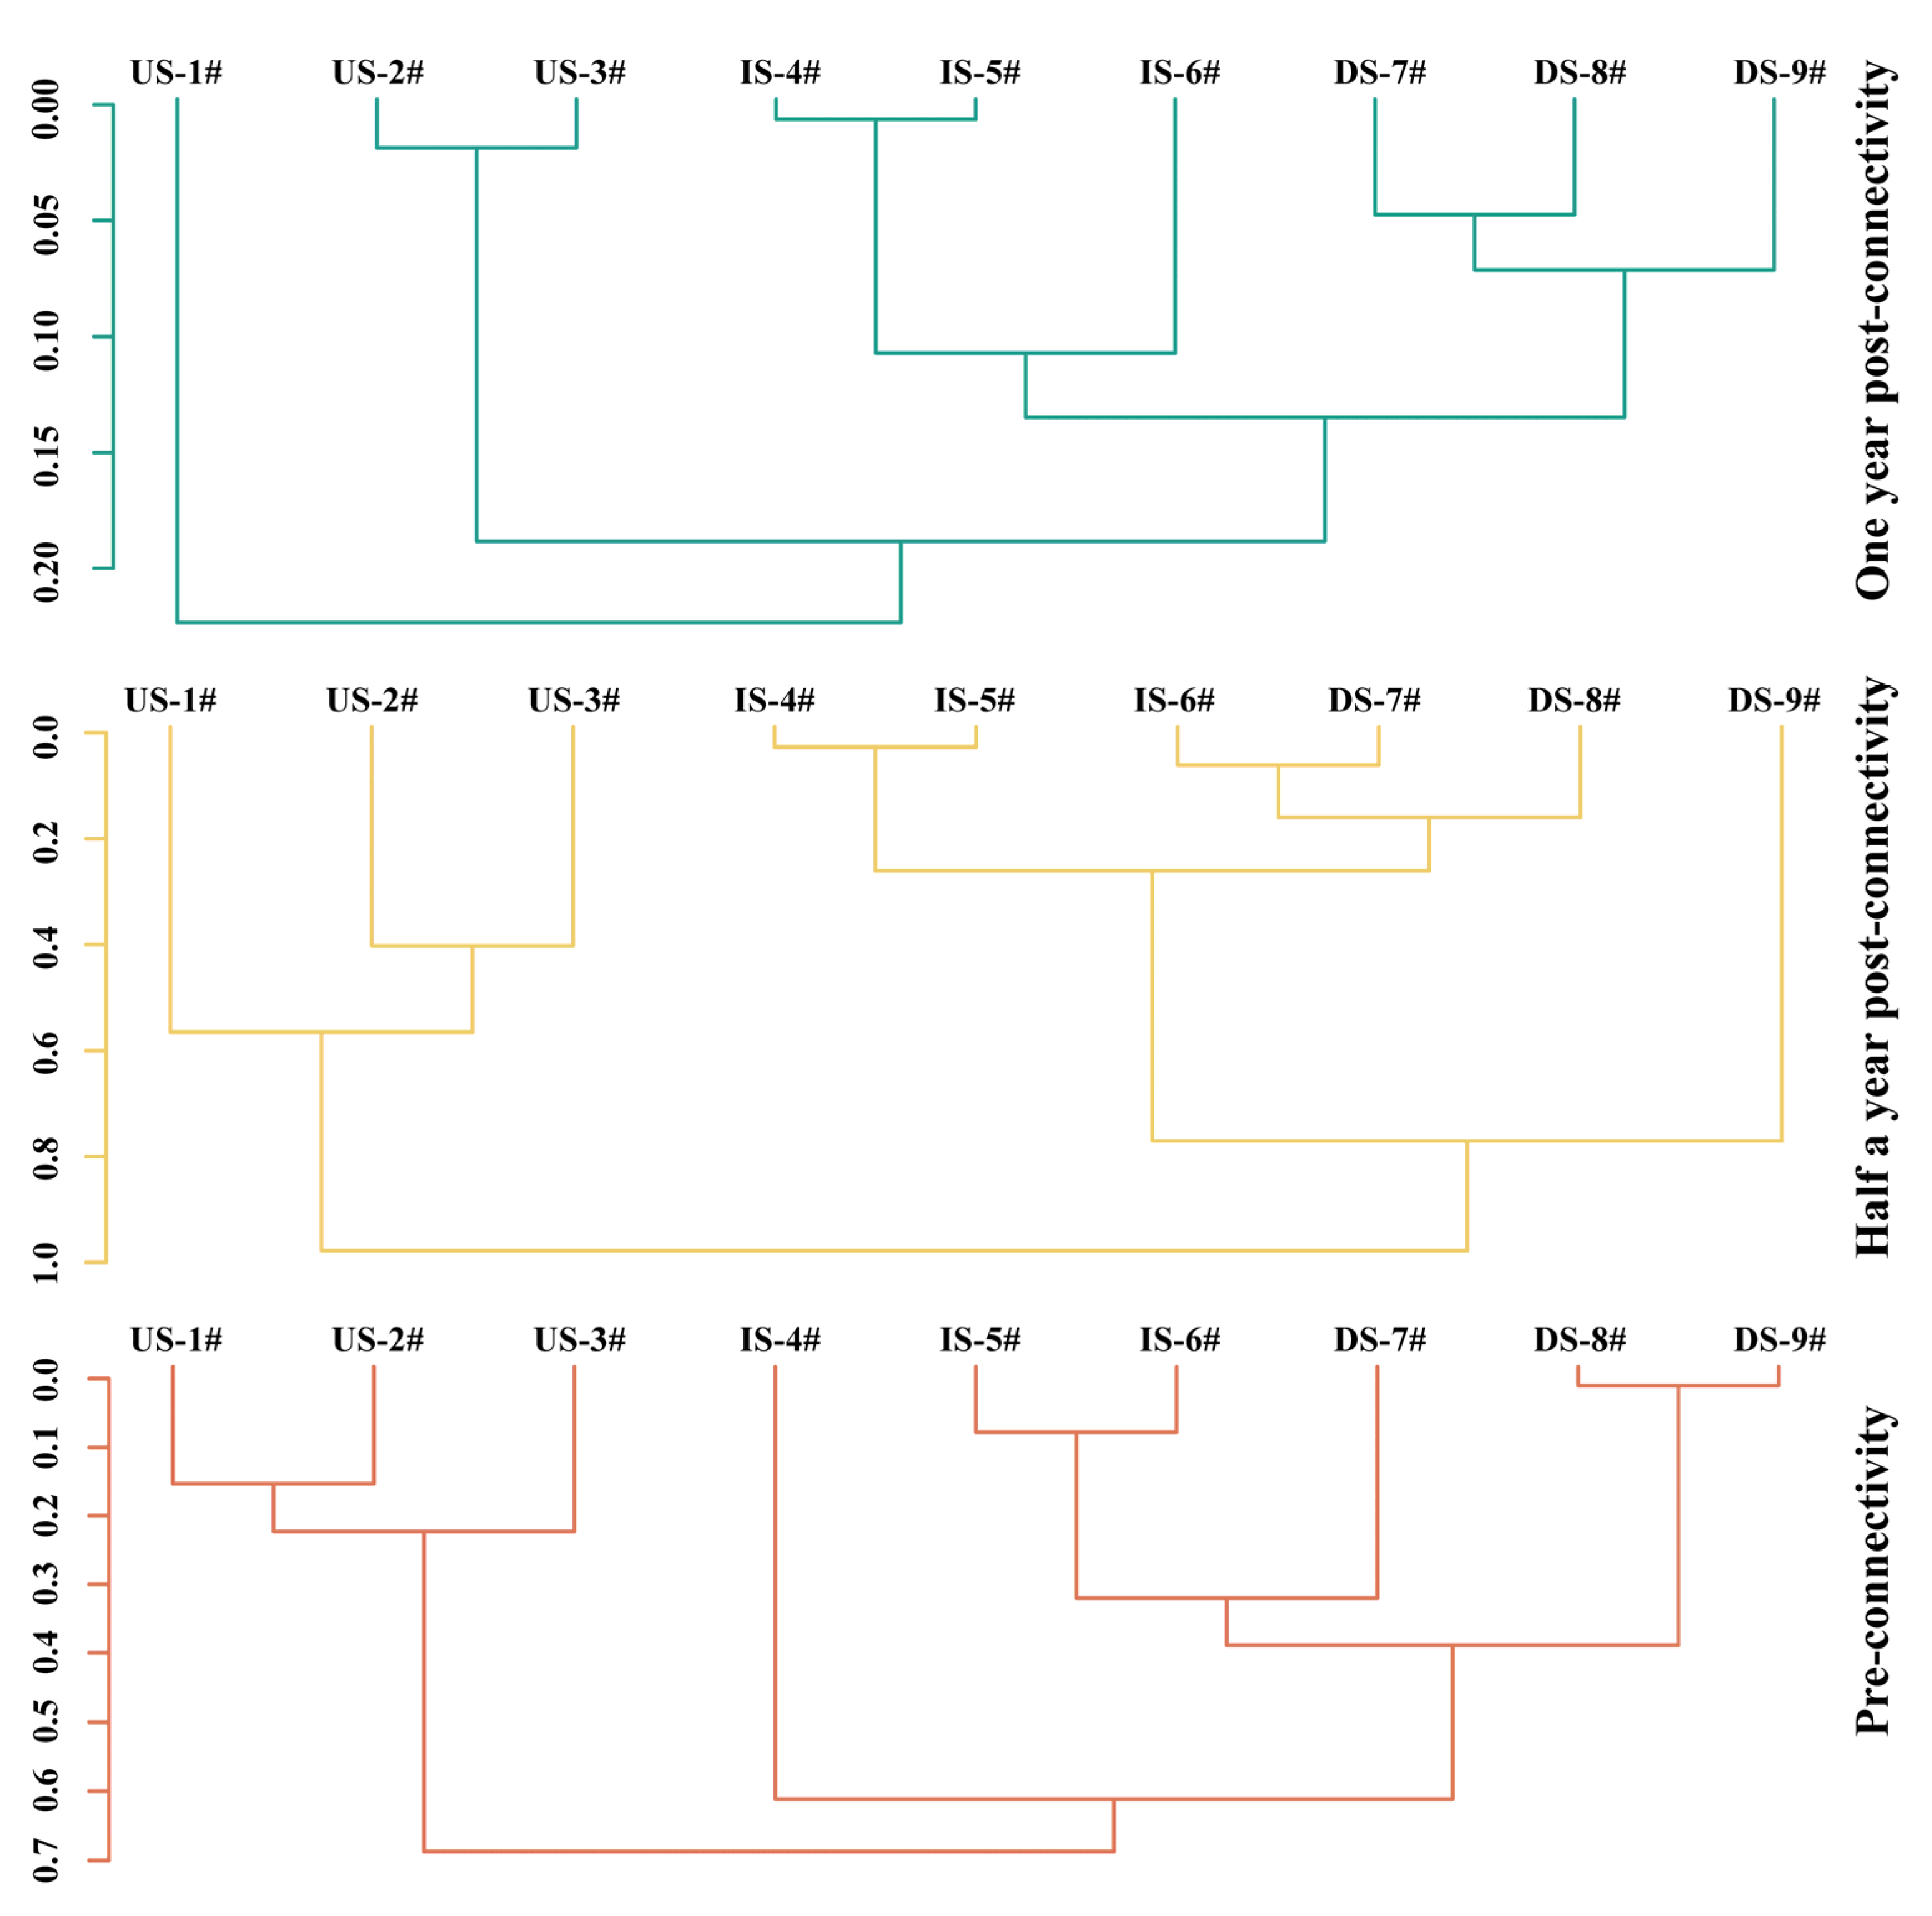
2.8.3. Constrained Sequential Clustering (CONISS)

Taking into account the spatial continuity of the river, the constrained sequential clustering (CONISS) method was adopted [44]. This approach was employed to explore the dissimilarity of fish community diversity indices across different sections, thereby evaluating the impact of river connectivity restoration projects on the convergence of fish species diversity structures. In this study, cluster analysis plots were created to partition groups based on varying dissimilarity distances, and ANOSIM (Analysis of Similarities) tests were performed to assess the differences between these groups.
Given the significant differences in the magnitudes of parameters within the original dataset, the ‘decostand()’ function from the “vegan” package in R was first used to perform normalization. For the processed data, the ‘vegdist()’ function from the “vegan” package was applied to calculate the Bray–Curtis distances between sampling points, followed by sequential clustering using the ‘chclust()’ function from the “rioja” package. Finally, visualization was achieved using the basic ‘plot’ function in R. The ANOSIM() function was used to conduct difference tests on the partitioned groups, ensuring the reliability of the analysis results.

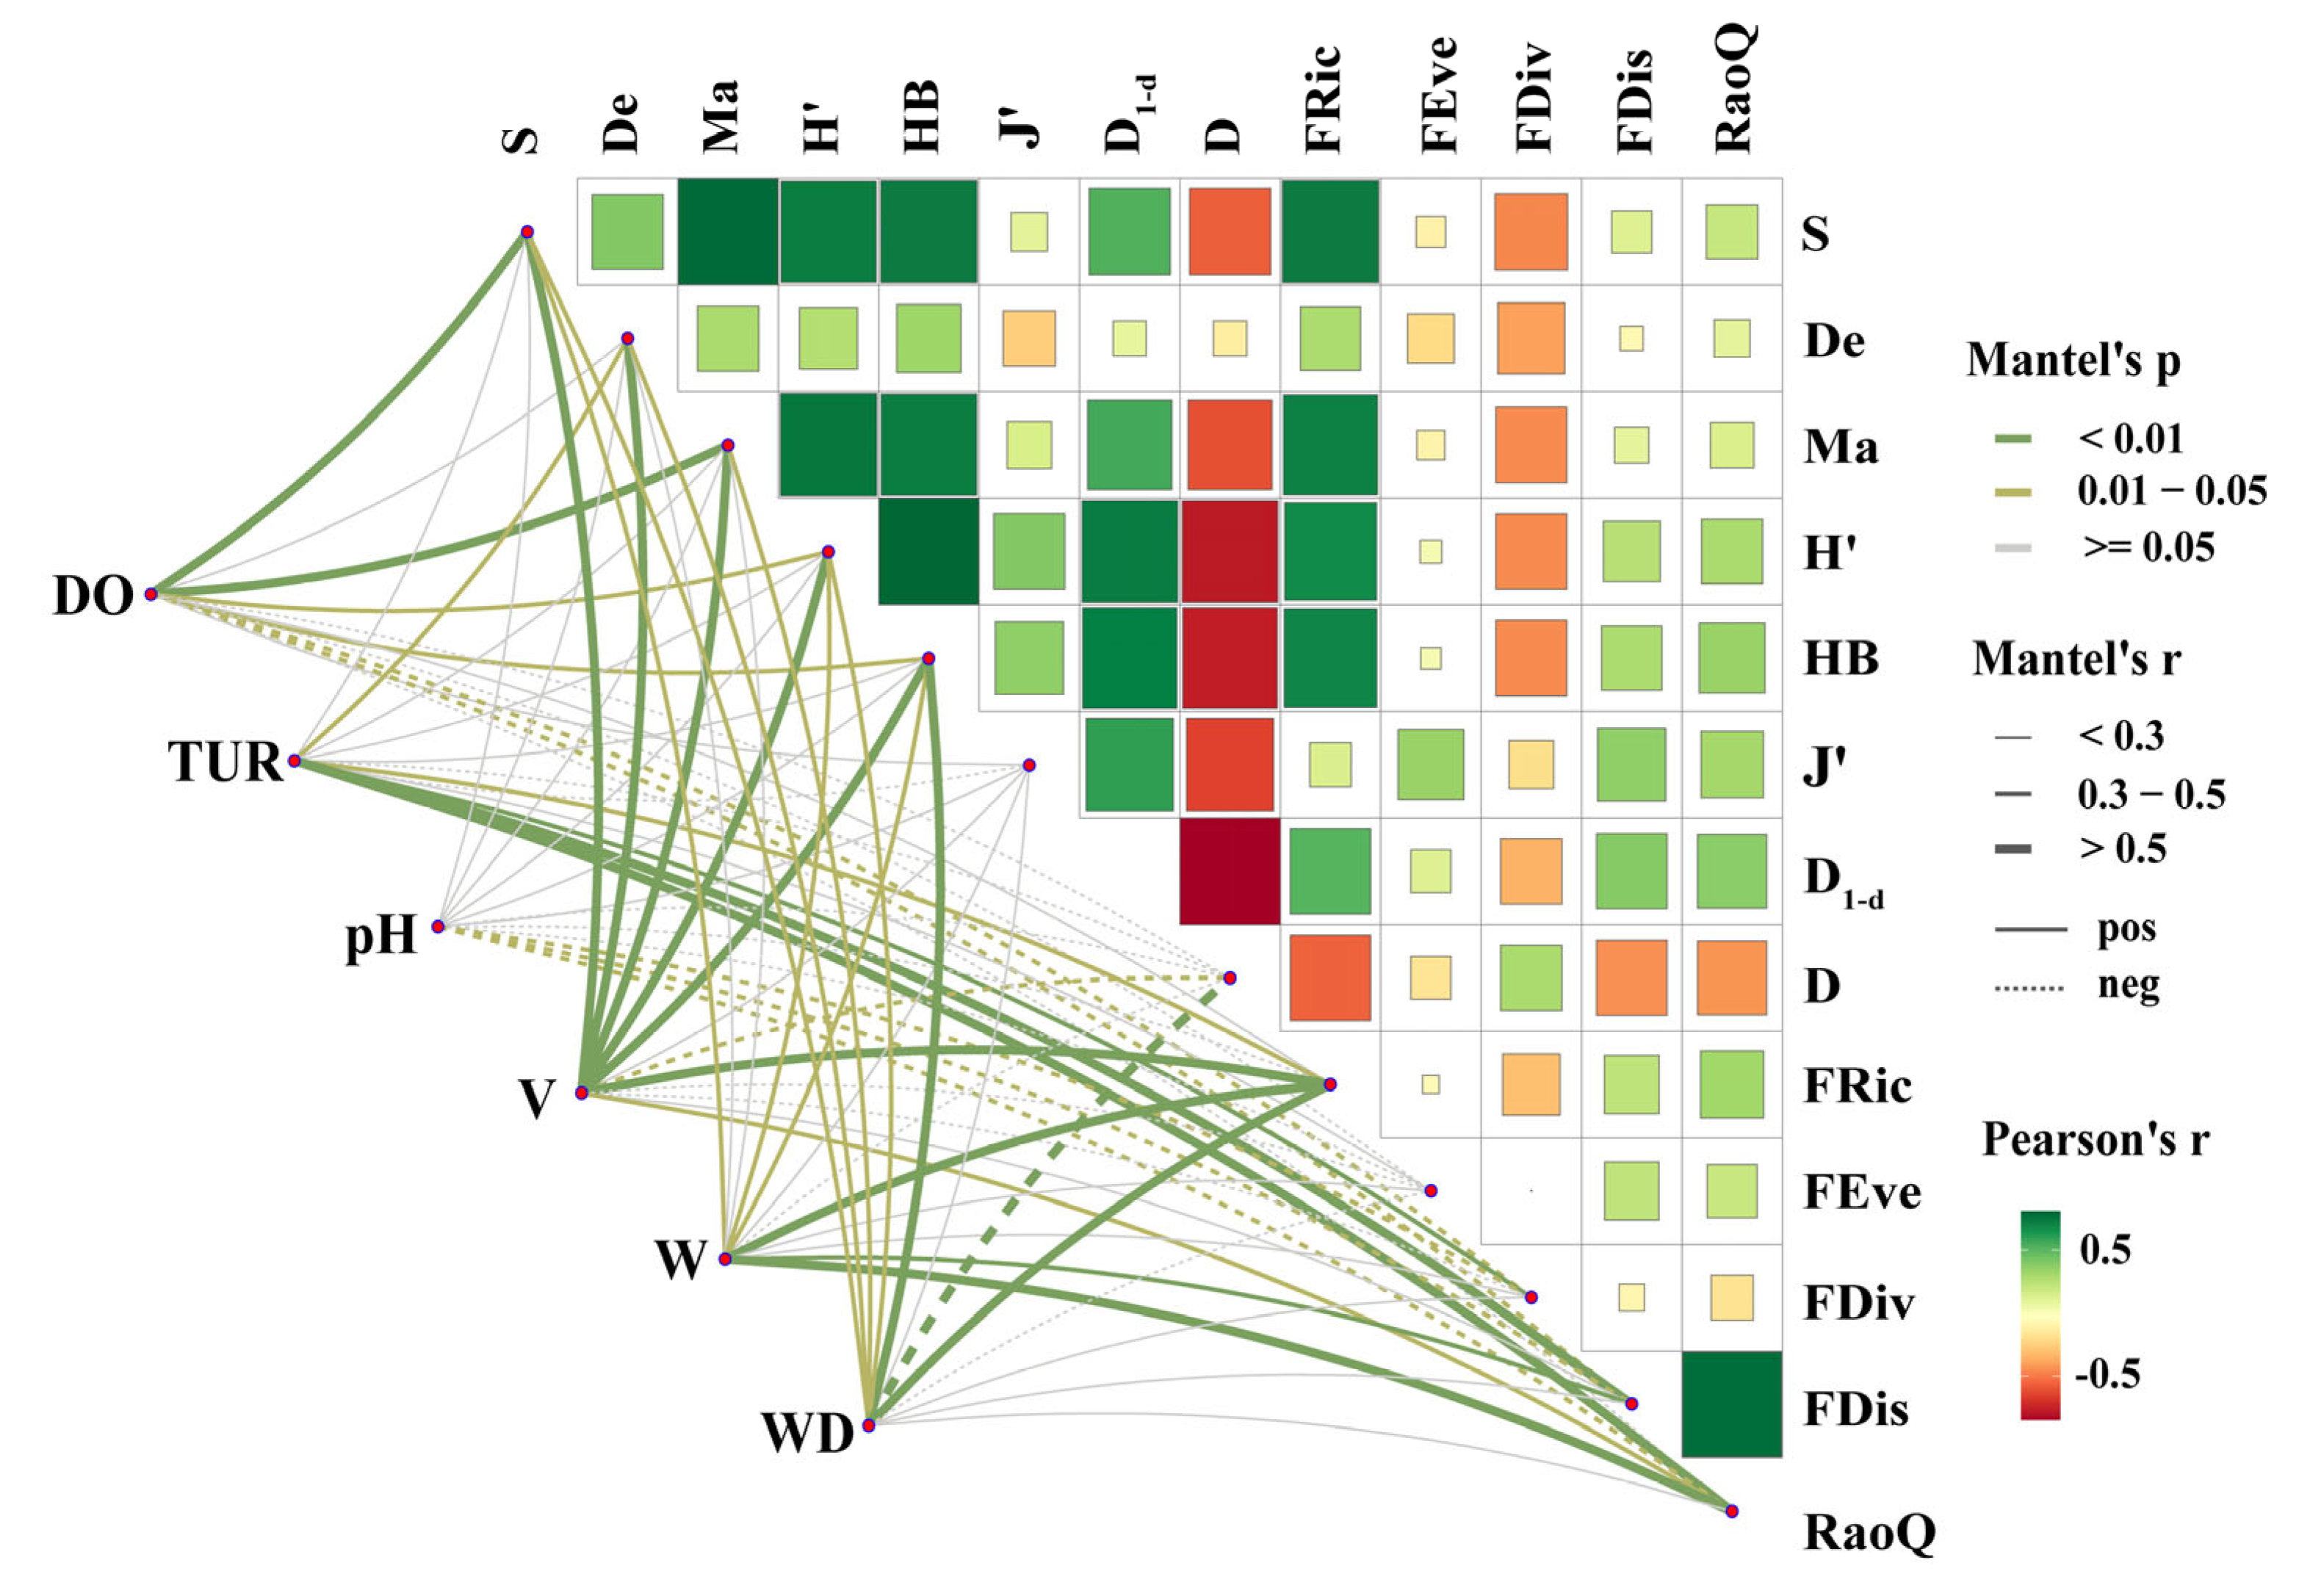
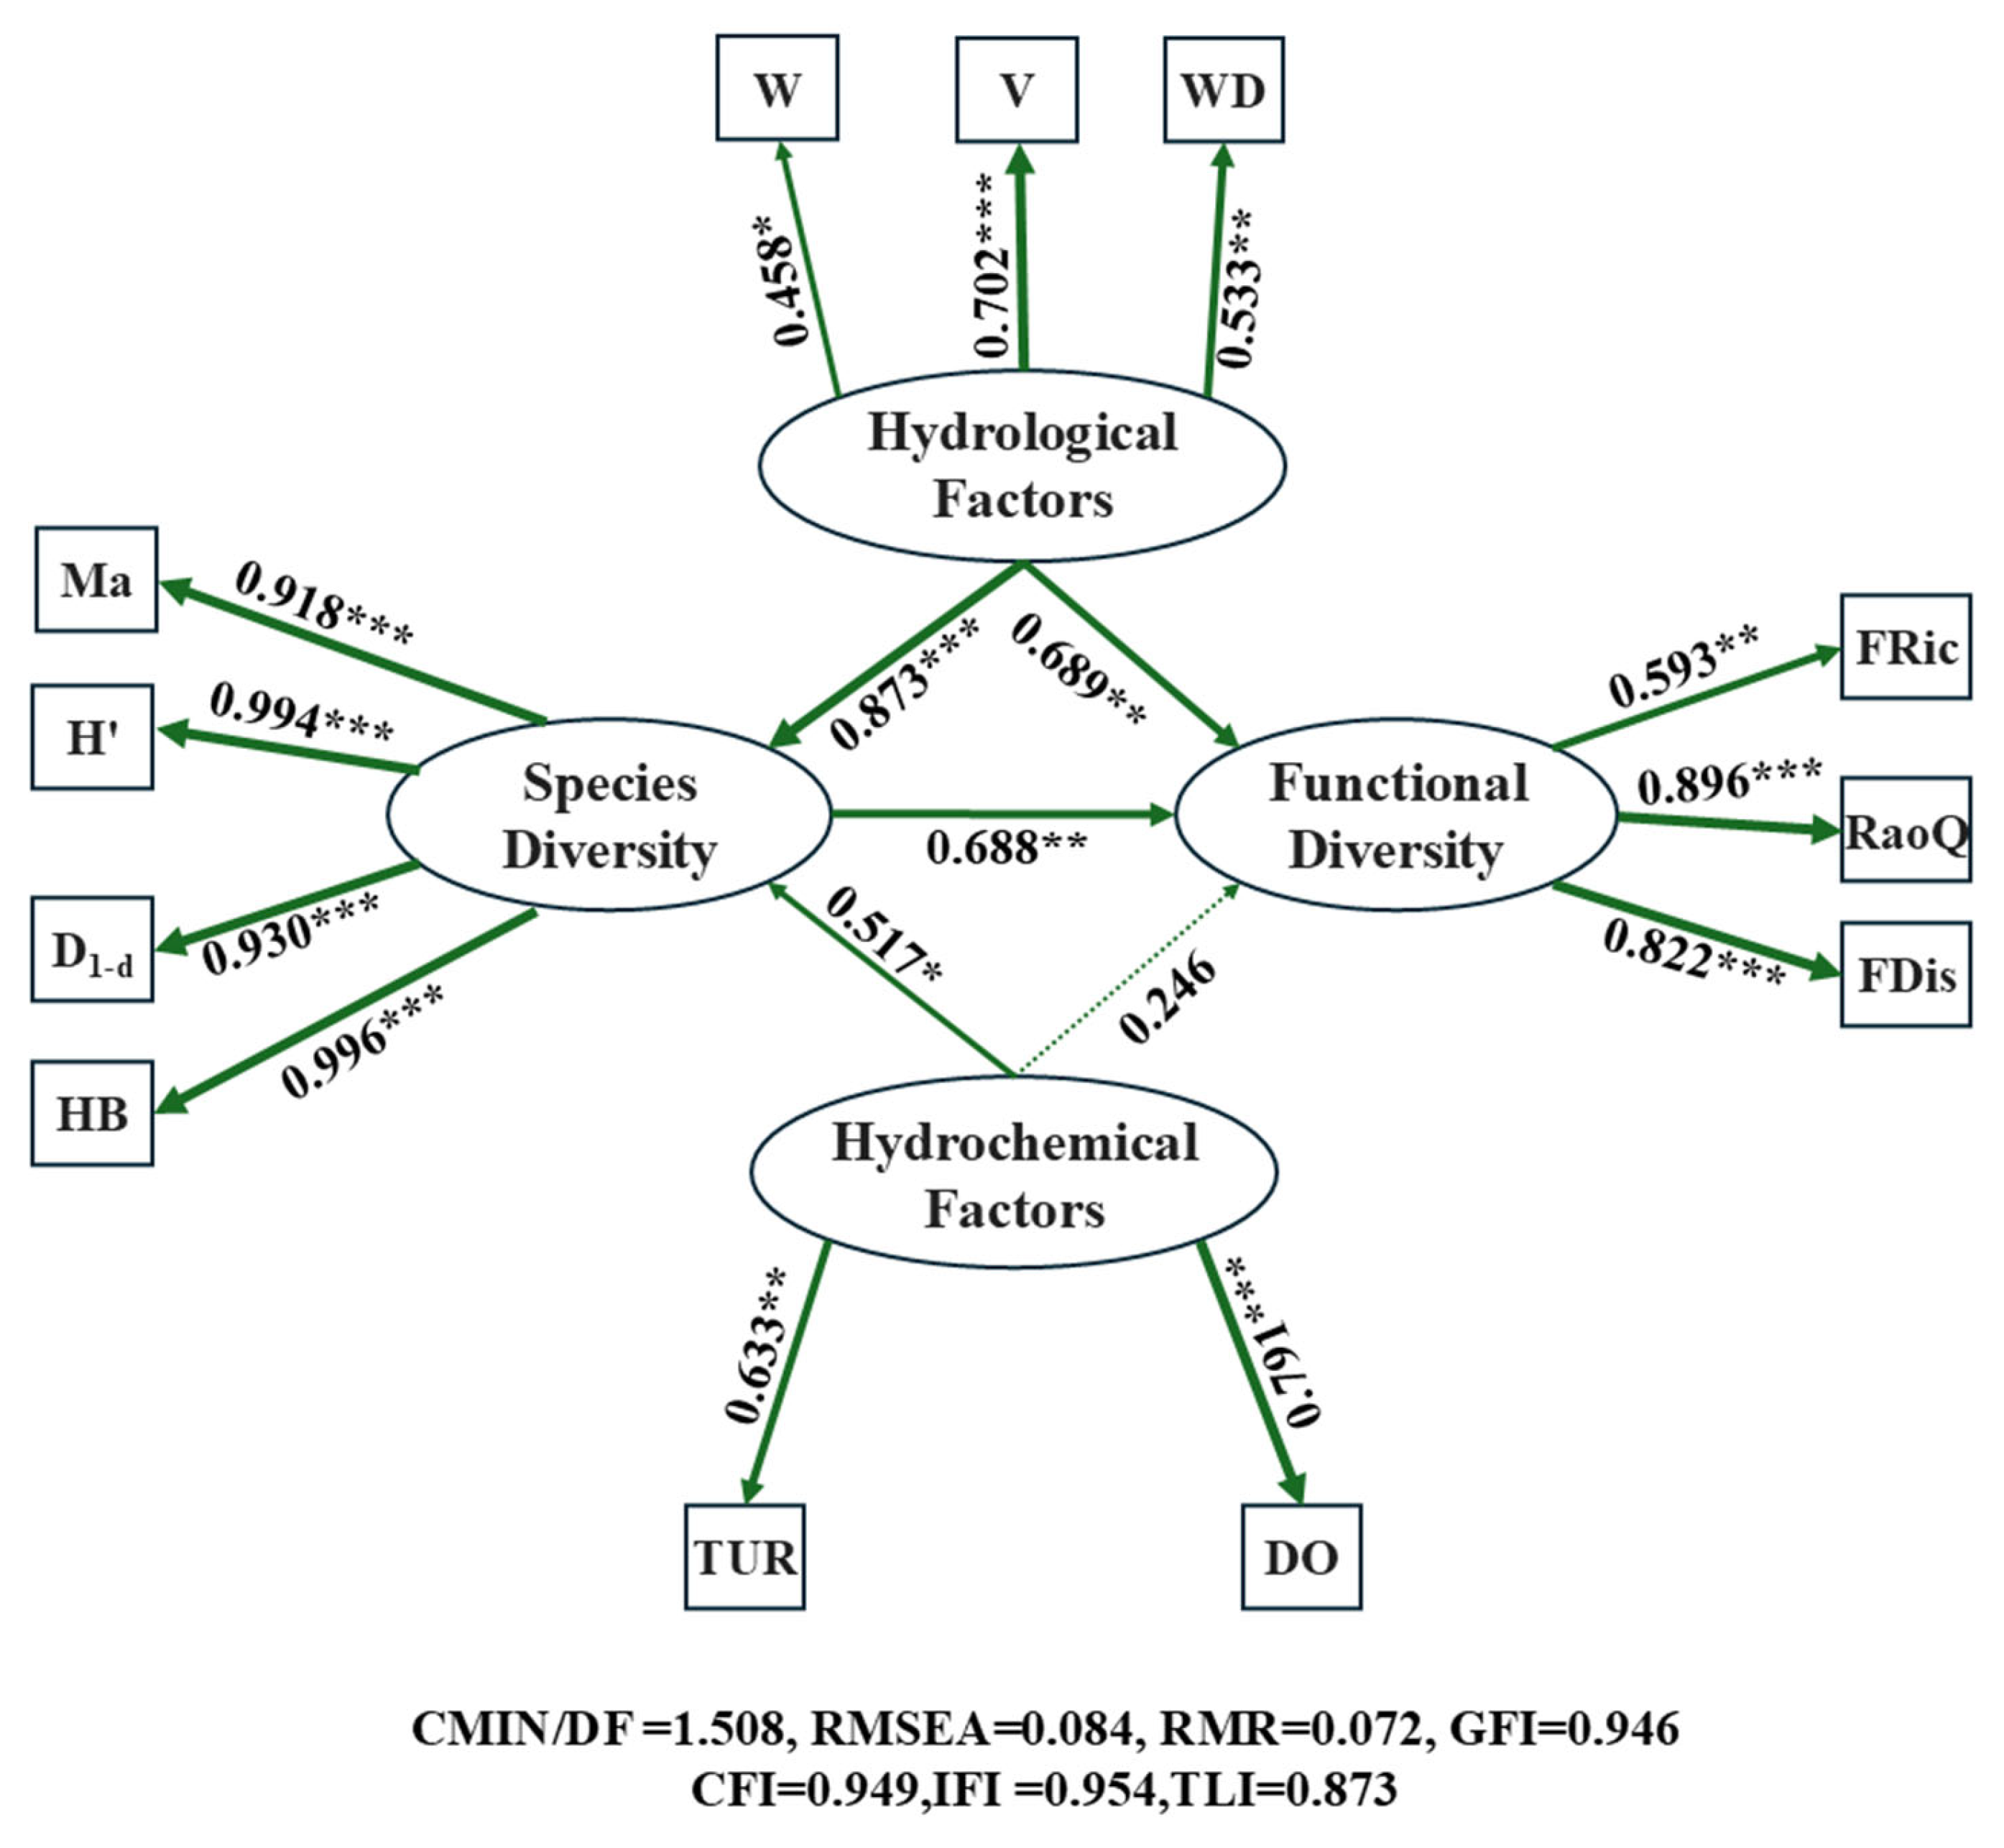
2.8.4. Mantel Test and Structural Equation Modeling Construction

To reveal the internal correlation mechanism between aquatic habitat and fish diversity, this study employed the Mantel test to analyze the driving effects of the environment on fish diversity and quantified the influence degree of aquatic environmental factors by constructing a structural equation model (SEM).
As a non-parametric statistical method, the Mantel test was used to examine the correlation between multiple independent distance matrices. In this study, Mantel’s r value was adopted to characterize the correlation between aquatic habitat and fish diversity indices, while Mantel’s p value was used to evaluate statistical significance. Additionally, Pearson’s r was applied to analyze the correlations among fish diversity indices. Data analysis and visualization were performed using R programming language, with calculations completed via the ‘correlate()’ and ‘mantel_test()’ functions in the “linkET” (Version 0.0.7.4) package and the ‘mantel()’ function in the “vegan” package.
Structural equation modeling integrates factor analysis and path analysis, enabling the simultaneous presentation of the measurement model for observed variables and the structural model for latent variables. Based on existing research and objectives, this study specified four categories of latent variables (hydrochemical factors, hydrological factors, species diversity, and functional diversity) to construct an initial model. During analysis, all observed data were first included, and then the model was optimized by progressively eliminating non-significant observed variables according to goodness-of-fit indices, including CMIN/DF (1–3), RMSEA (<0.08), SRMR (<0.08), GFI (>0.90), CFI (>0.90), IFI (>0.90), and TLI (>0.90). SEM analysis was conducted using Amos 29.0 software.
All the significance levels for the above difference tests are stipulated as follows: p < 0.05 indicates statistical significance; p < 0.01 indicates significant difference; p < 0.001 indicates extremely significant difference.
In the following text, the periods mentioned denote pre-connectivity (PRC), half a year post-connectivity (POCⅠ), and one year post-connectivity (POCⅡ); the sections refer to the project’s upstream section (US), the inter-project section (IS), and the project’s downstream section (DS).

3. Results

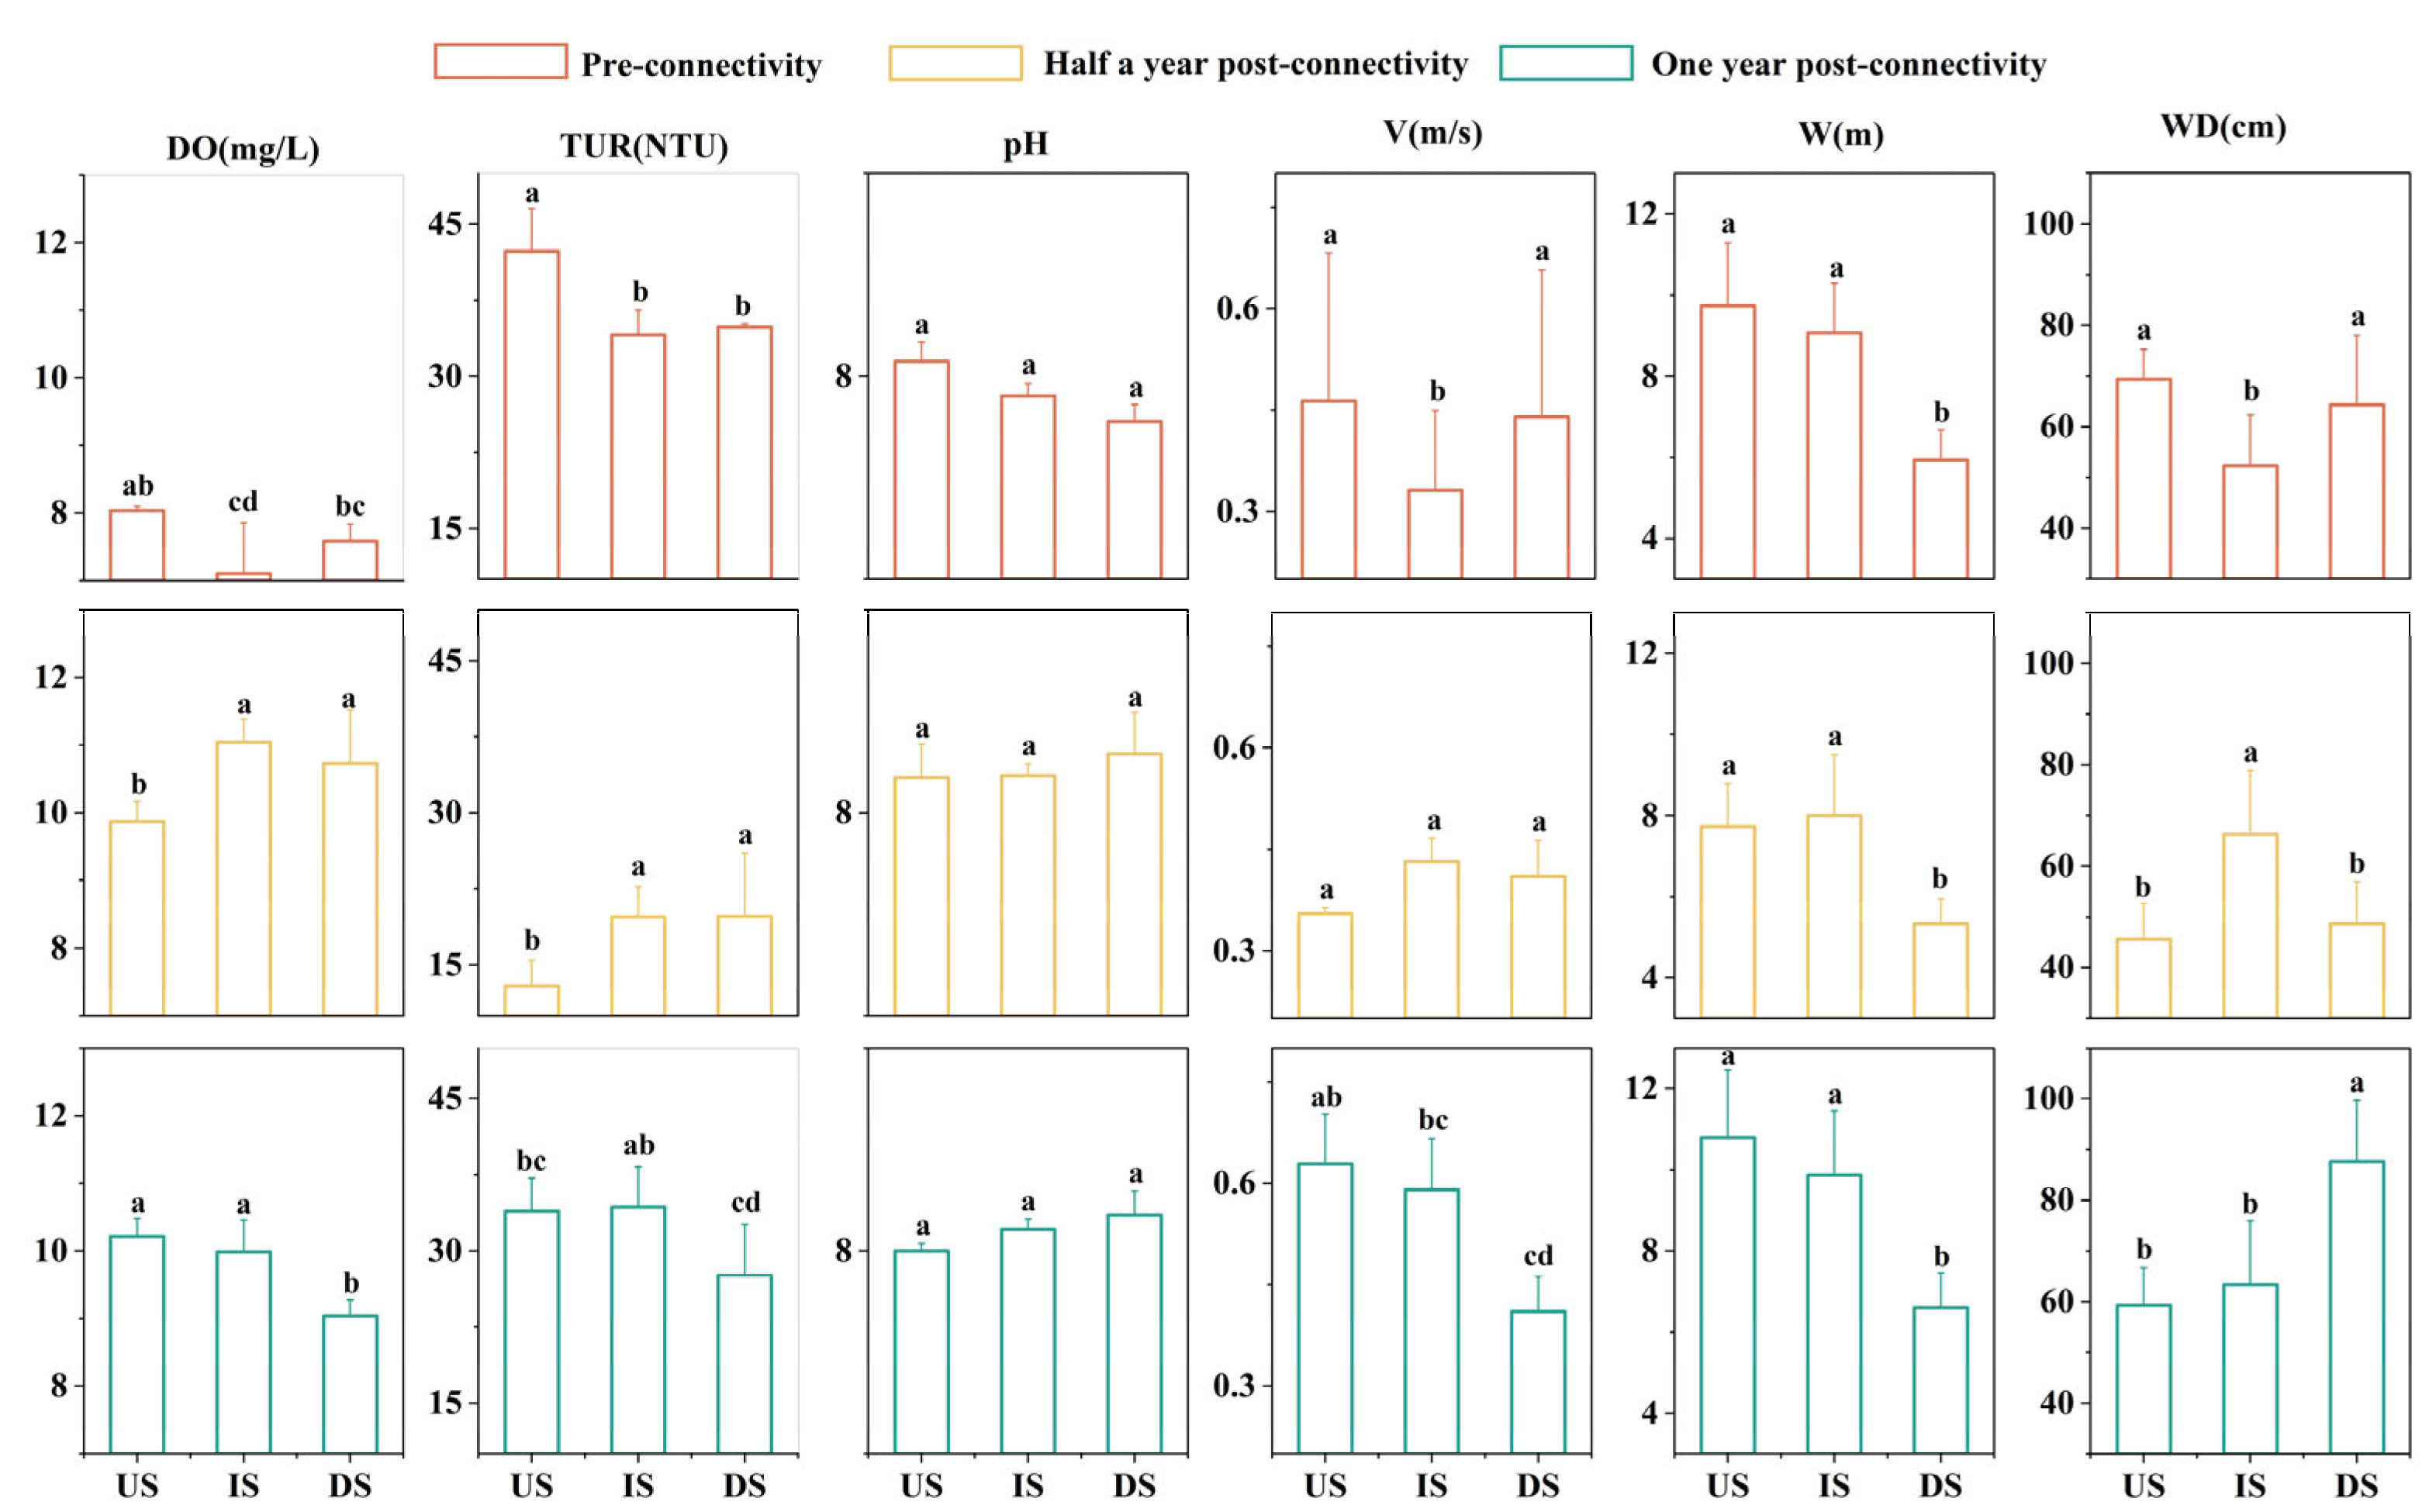
3.1. Variation Characteristics of Aquatic Environmental Factors

Following the implementation of the connectivity projects, five out of six aquatic environmental factors showed statistically significant differences (p < 0.05), except for W (Figure 2). DO and pH exhibited consistent variation trends, with significantly higher values after the project compared to pre-project levels (p < 0.05), and the increase was particularly pronounced in POCⅠ (p < 0.01). The mean TUR significantly decreased post-project (p < 0.05), with the most substantial decline observed in POCⅠ (p < 0.01). W and WD showed similar variation patterns, and POCⅠ values were slightly lower than those in PRC, while POCⅡ showed a minor rebound, though neither reached statistical significance (p > 0.05). V did not differ significantly between POCⅠ and PRC, but was significantly higher in POCⅡ than in PRC (p < 0.01).
The habitat aquatic environmental factors (DO, TUR, V, and WD) in the IS showed distinct trends and significant differences compared to those in the US and DS across different periods (Figure 3). Specifically, during the PRC period, the IS exhibited the lowest values of DO, TUR, V, and WD, with V and WD being significantly lower than those in the US and DS (p < 0.05), while TUR was only significantly lower than that in the US (p < 0.05). During the POCⅠ period, except for pH, the values of DO, TUR, V, W, and WD in the IS rose to the highest levels, where DO, TUR, and WD were significantly higher than those in the US (p < 0.05), W was significantly higher than that in the DS (p < 0.05), and WD was significantly higher than those in the other two sections (p < 0.05). During the POCⅡ period, all aquatic environmental factors in the IS were nearly identical to those in the US, with only slightly lower values in V and W (p > 0.05), whereas significant differences were observed in all factors except pH when compared to the DS, with DO, TUR, V, and W being significantly higher than those in the DS.
The conditional tests showed that the KMO value was greater than 0.6, and the Bartlett test had a p < 0.05, indicating that the data were suitable for PCA. As shown in the PCA ordination plot, the first axis of PCA contributed 37.32% of the variance, and the second axis contributed 24.78%, with a cumulative contribution rate of 62.10%, which can represent most of the information in the original data, thus giving high credibility to the ordination plot (Figure 4). The results showed significant differences in the characteristics of aquatic environmental factors across the three periods (permanova test: R2 = 0.368, p = 0.025 < 0.05).
Further observation of the positional relationships among sampling sites revealed that during the PRC period, sampling sites in the IS and US had no overlap, and only one sampling site in the DS was adjacent to them (Figure 4). During the POCⅠ period, although the three sampling sites in the three sections were relatively dispersed, there was a small degree of overlap in their positions. During the POCⅡ period, sampling sites in the IS and US were intermingled, while they were clearly separated from those in the DS. This indicates that the aquatic habitat characteristics in the IS gradually changed from being significantly different from those in the US and DS of the projects before connectivity to becoming similar to those in the US. Additionally, based on the distribution positions of the arrow axes representing aquatic environmental factors, the main contributing factor during the PRC period was TUR, during the POCⅠ period the main factors were pH and DO, and during the POCⅡ period they were V and W.

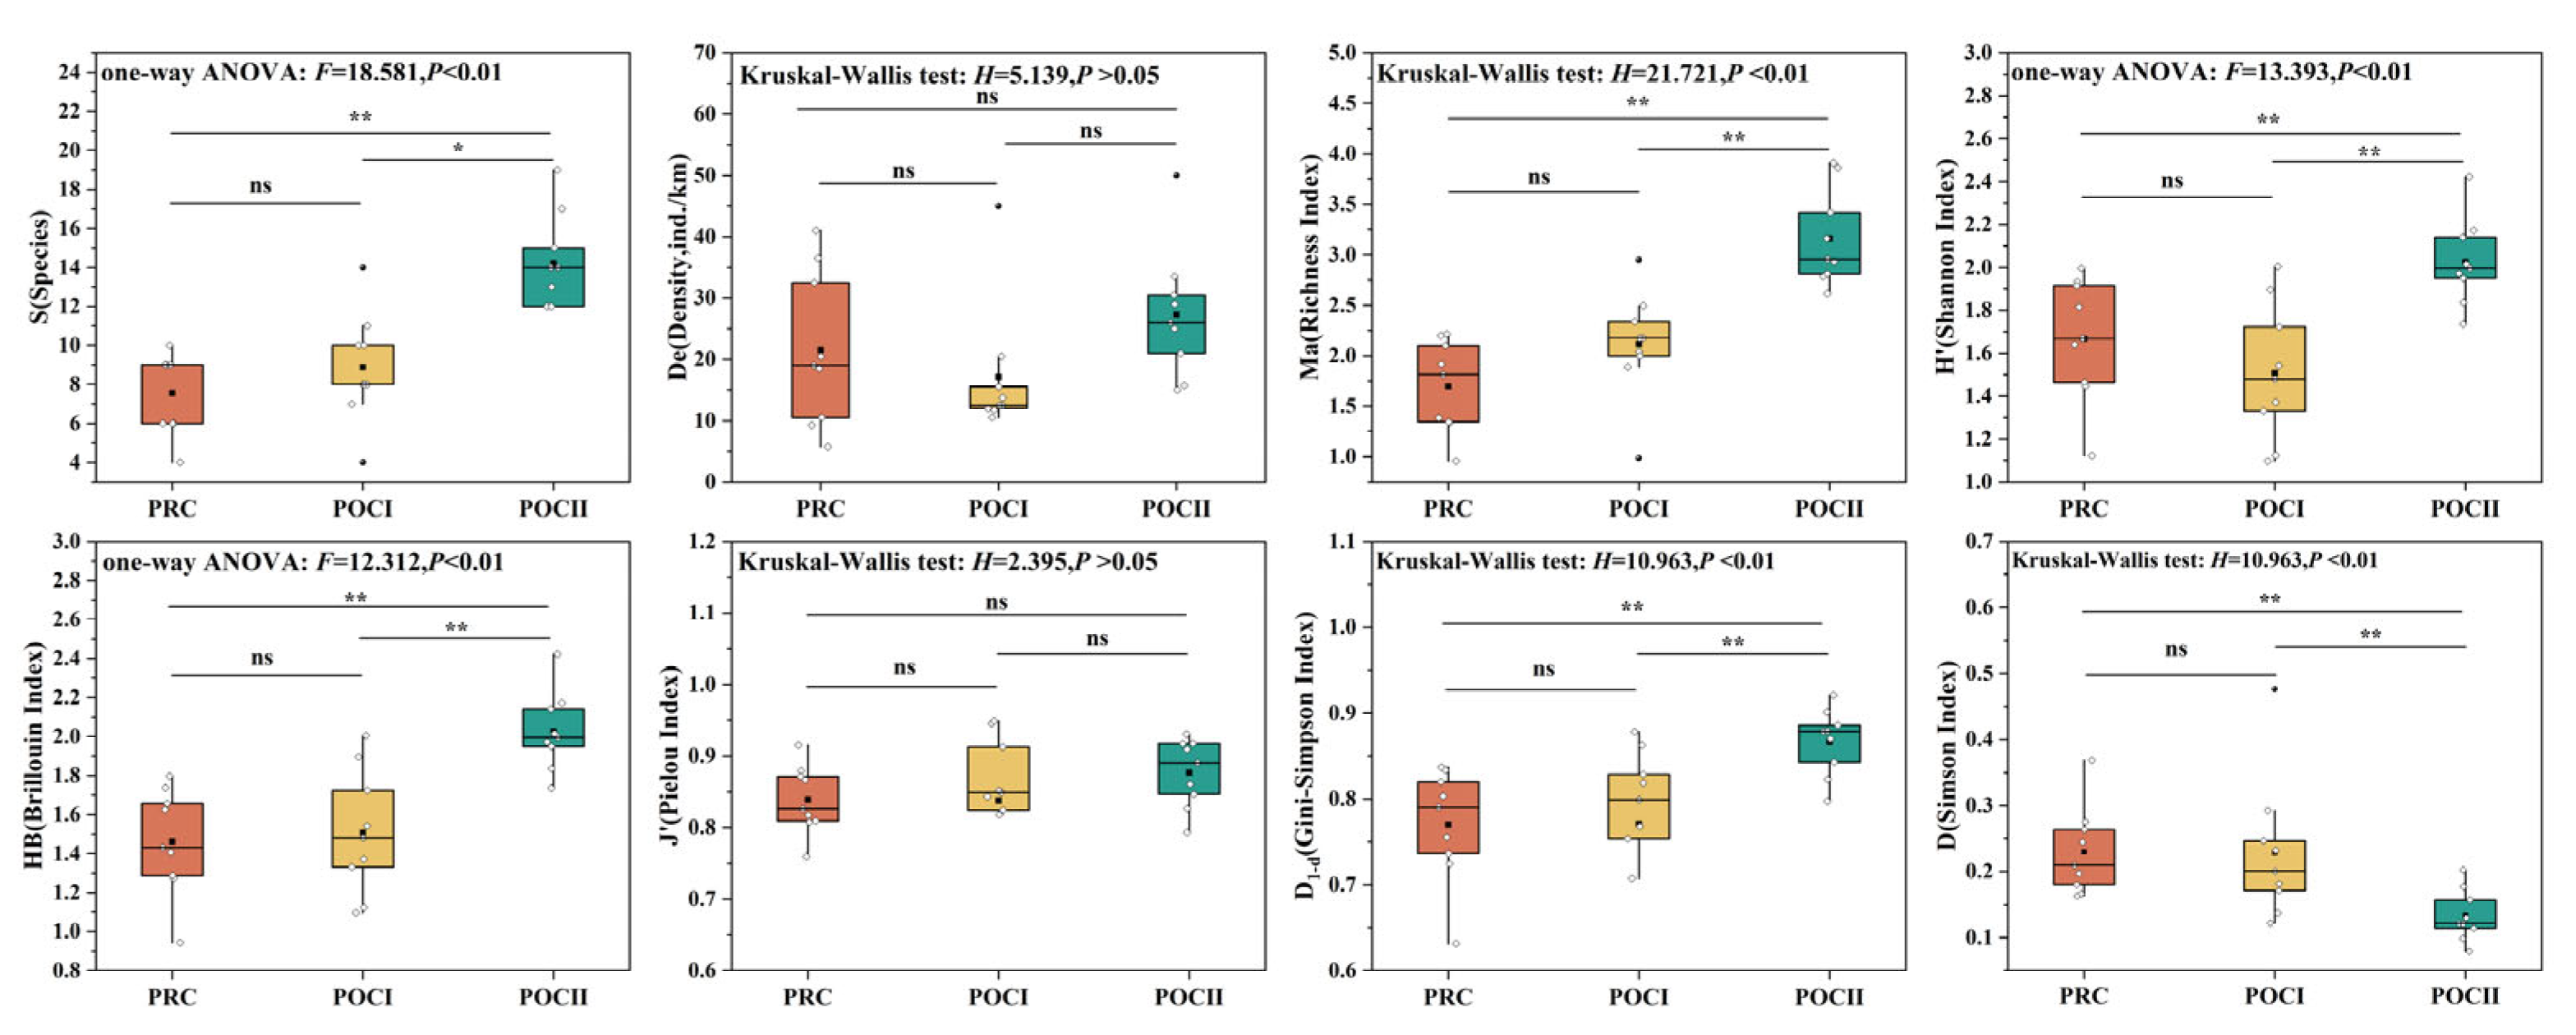
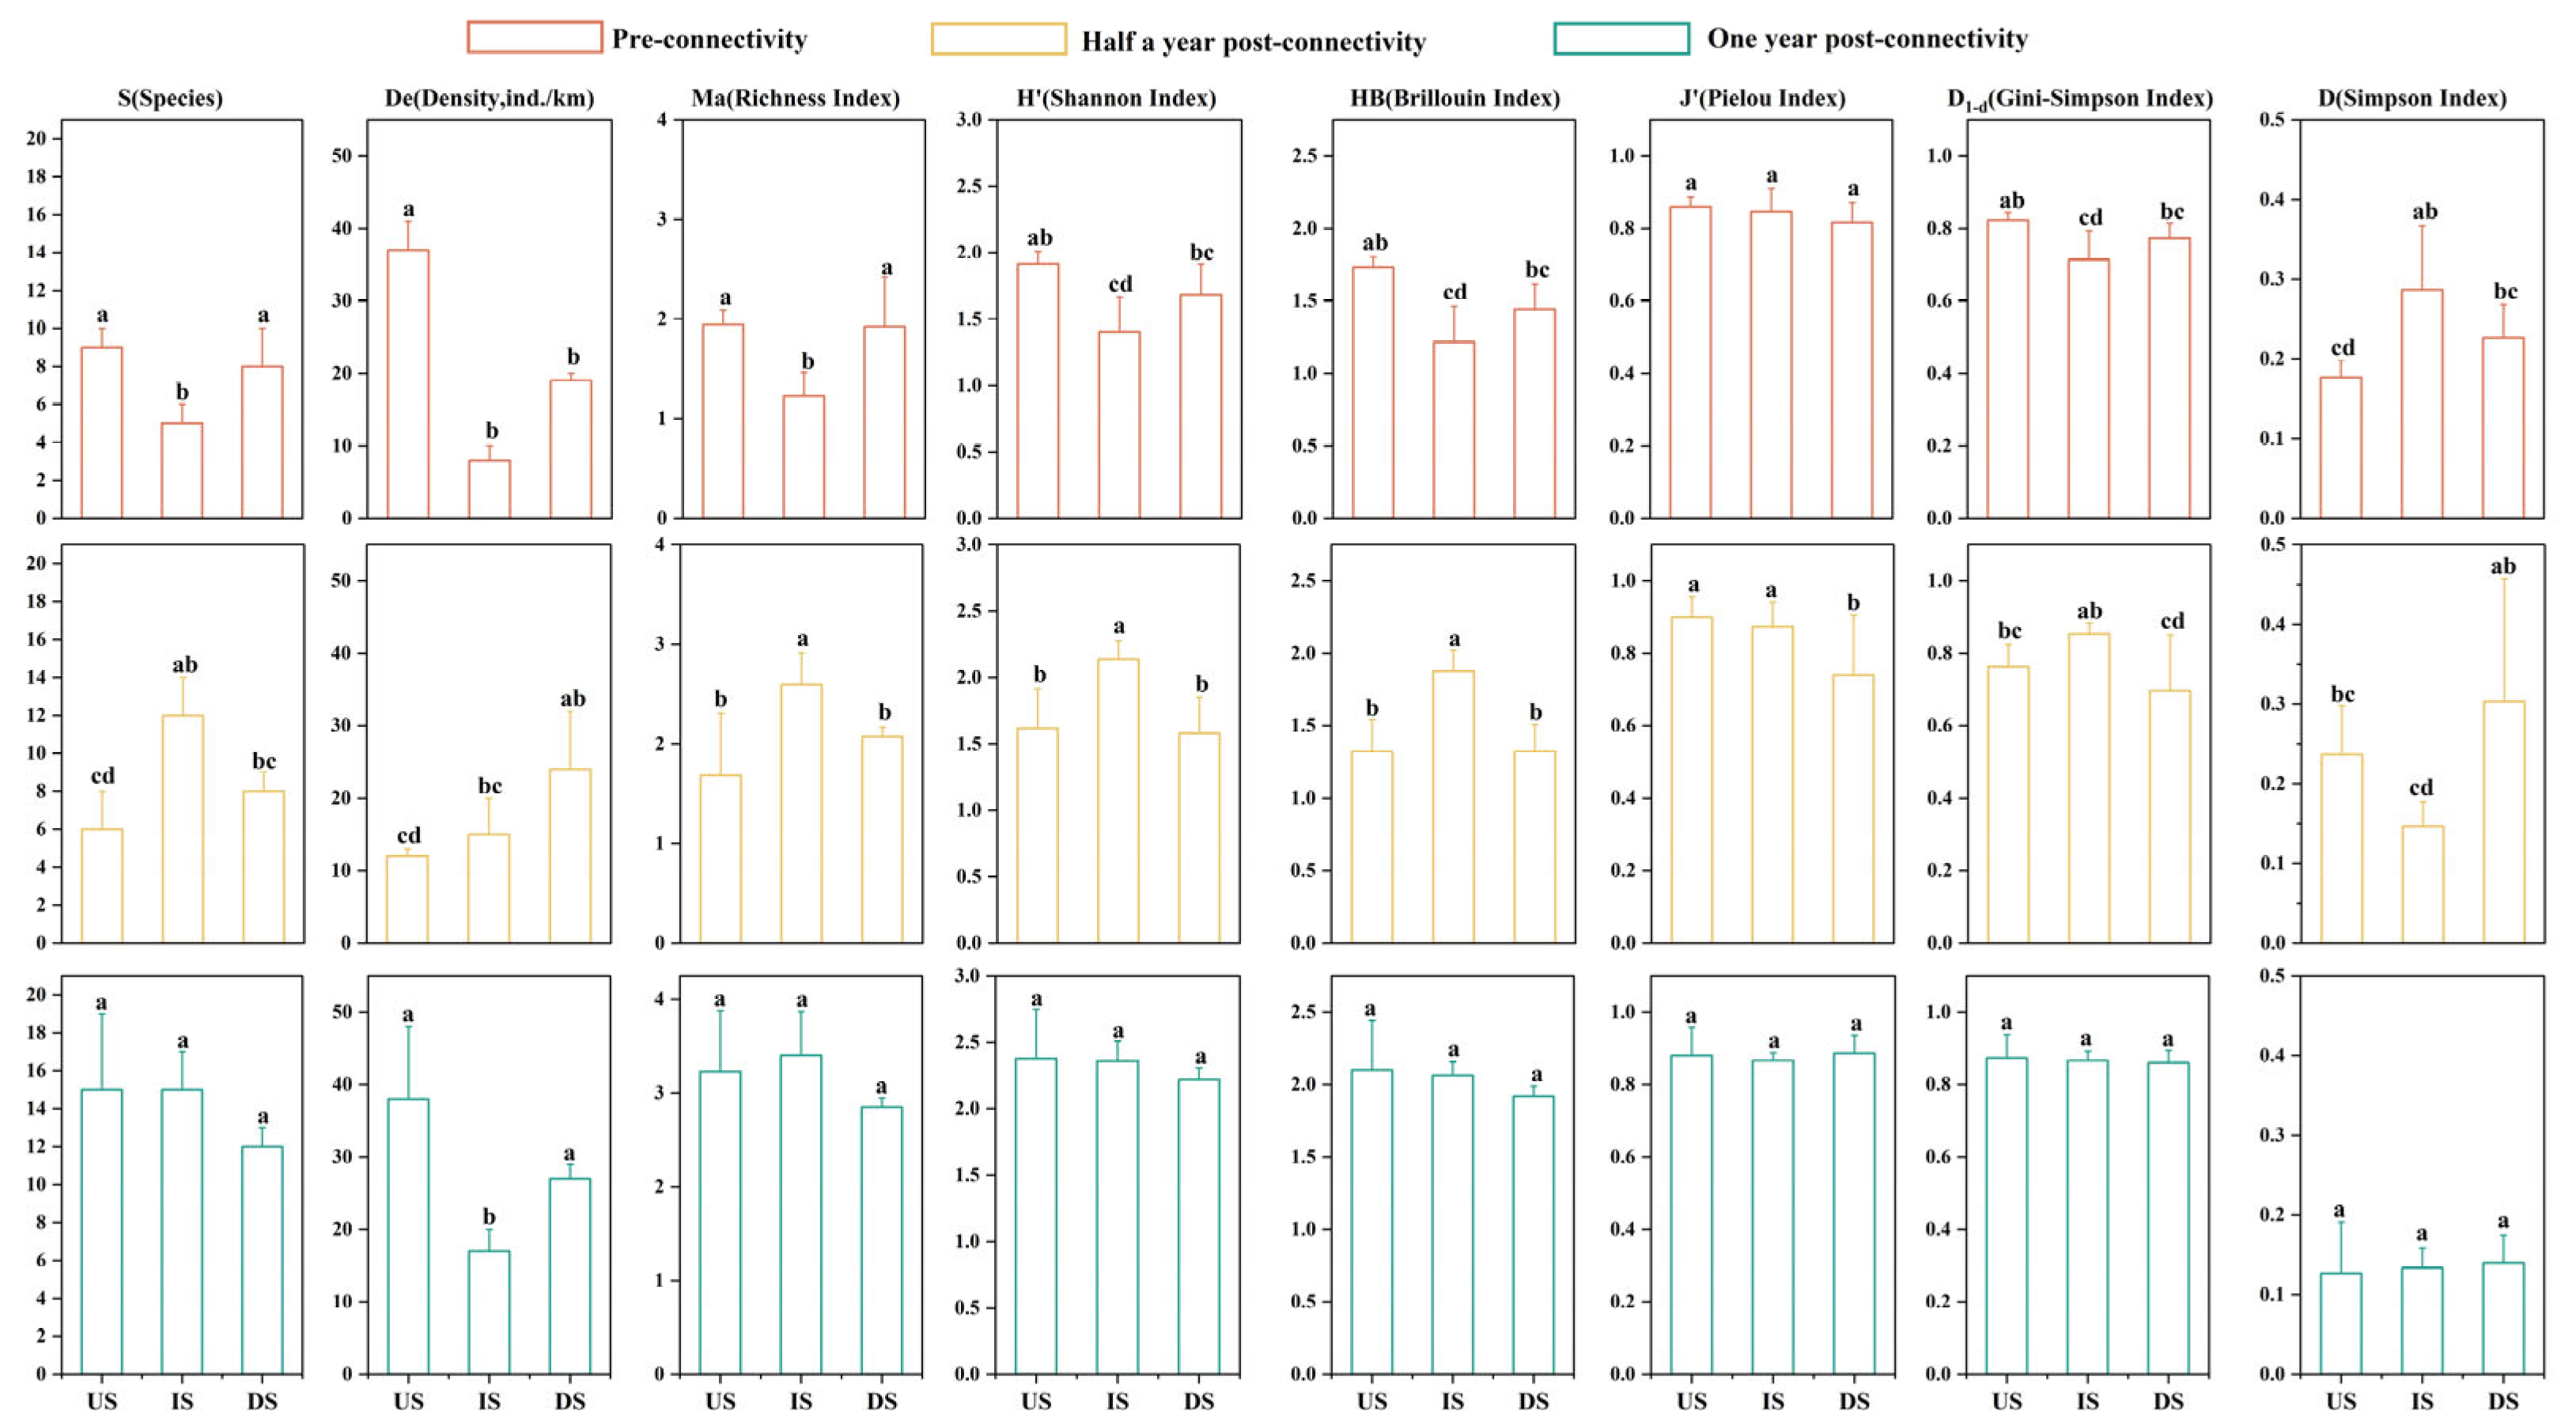
3.2. Variation Characteristics of Fish Species Diversity

With the implementation of the connectivity restoration projects, half of the eight species diversity indices showed an overall upward trend, while the remaining ones exhibited different changing trends (Figure 5). Specifically, both S and Ma exhibited similar trends of gradual increase over time, with values in the POCⅡ period being significantly higher than those in the previous two periods (p < 0.05). HB and D1-d remained essentially unchanged in the PRC and POCⅠ periods but showed a significant increase in the POCⅡ period (p < 0.05). In contrast, D displayed the opposite trend, with a significant decrease observed in the POCⅡ period (p < 0.05). The H’ index and De shared the same trajectory, both declining during POCⅠ and rising in POCⅡ, though only H’ showed a significant difference in the POCⅡ period (p < 0.05). Additionally, J’ showed almost no fluctuation across the three periods (p > 0.05). From the perspective of project timeliness, the effects observed in the POCⅡ period were more pronounced than those in the POCⅠ period.
The IS showed the lowest index levels (except D) during PRC, transitioned to the highest levels in POCⅠ, and converged toward section-wide similarity in POCⅡ (Figure 6). During PRC, six indices (De, S, Ma, H’, HB, D1-d) in the IS were the lowest and were significantly lower than those in the US (p < 0.05), with S and Ma values were also significantly lower than those in the DS (p < 0.05), while D was significantly higher in IS than in US. During POCⅠ, most indices in the IS became the highest: Ma, H’, and HB were significantly elevated (p < 0.05), S was significantly higher than in the US (p < 0.05), D1-d was significantly higher than in the DS (p < 0.05), and D was the lowest and significantly lower than in the DS (p < 0.05); concurrently, N increased along the flow direction while J’ decreased non-significantly (p > 0.05). During POCⅡ, only De remained significantly lower in the IS (p < 0.05), S, Ma, H’, and HB were lower in the DS without significance (p > 0.05), and J’, D1-d, and D showed no significant differences across sections (p > 0.05).
The sequential clustering analysis showed that during the PRC period, significant differences in fish species diversity existed between sections due to barriers, while such differences gradually diminished and converged during the POCⅡ period after connectivity restoration, as evidenced by varying dissimilarity distances and statistical significance across periods (Figure 7). Specifically, in the PRC period, two groups showed a significant difference (R = 0.414, p = 0.048) at a dissimilarity distance of 0.73, and three groups exhibited extremely significant differences (R = 0.728, p = 0.004) at 0.474, indicating barrier-induced diversity disparities. In the POCⅠ period, no difference was found in the group with a dissimilarity distance of 0.71 (R = 0.240, p = 0.272), but three groups at 0.593 showed a significant difference (R = 0.483, p = 0.035), with DS-7# having similar fish diversity to that in the IS. During POCⅡ, the group at 0.481 showed no significant difference (R = 0.571, p = 0.08), and only three groups at 0.354 had a significant difference (R = 0.543, p = 0.041); notably, the dissimilarity distance (0.481) was lower than in previous periods, and significant differences between the three sections disappeared, reflecting the gradual convergence of fish species diversity after connectivity restoration.

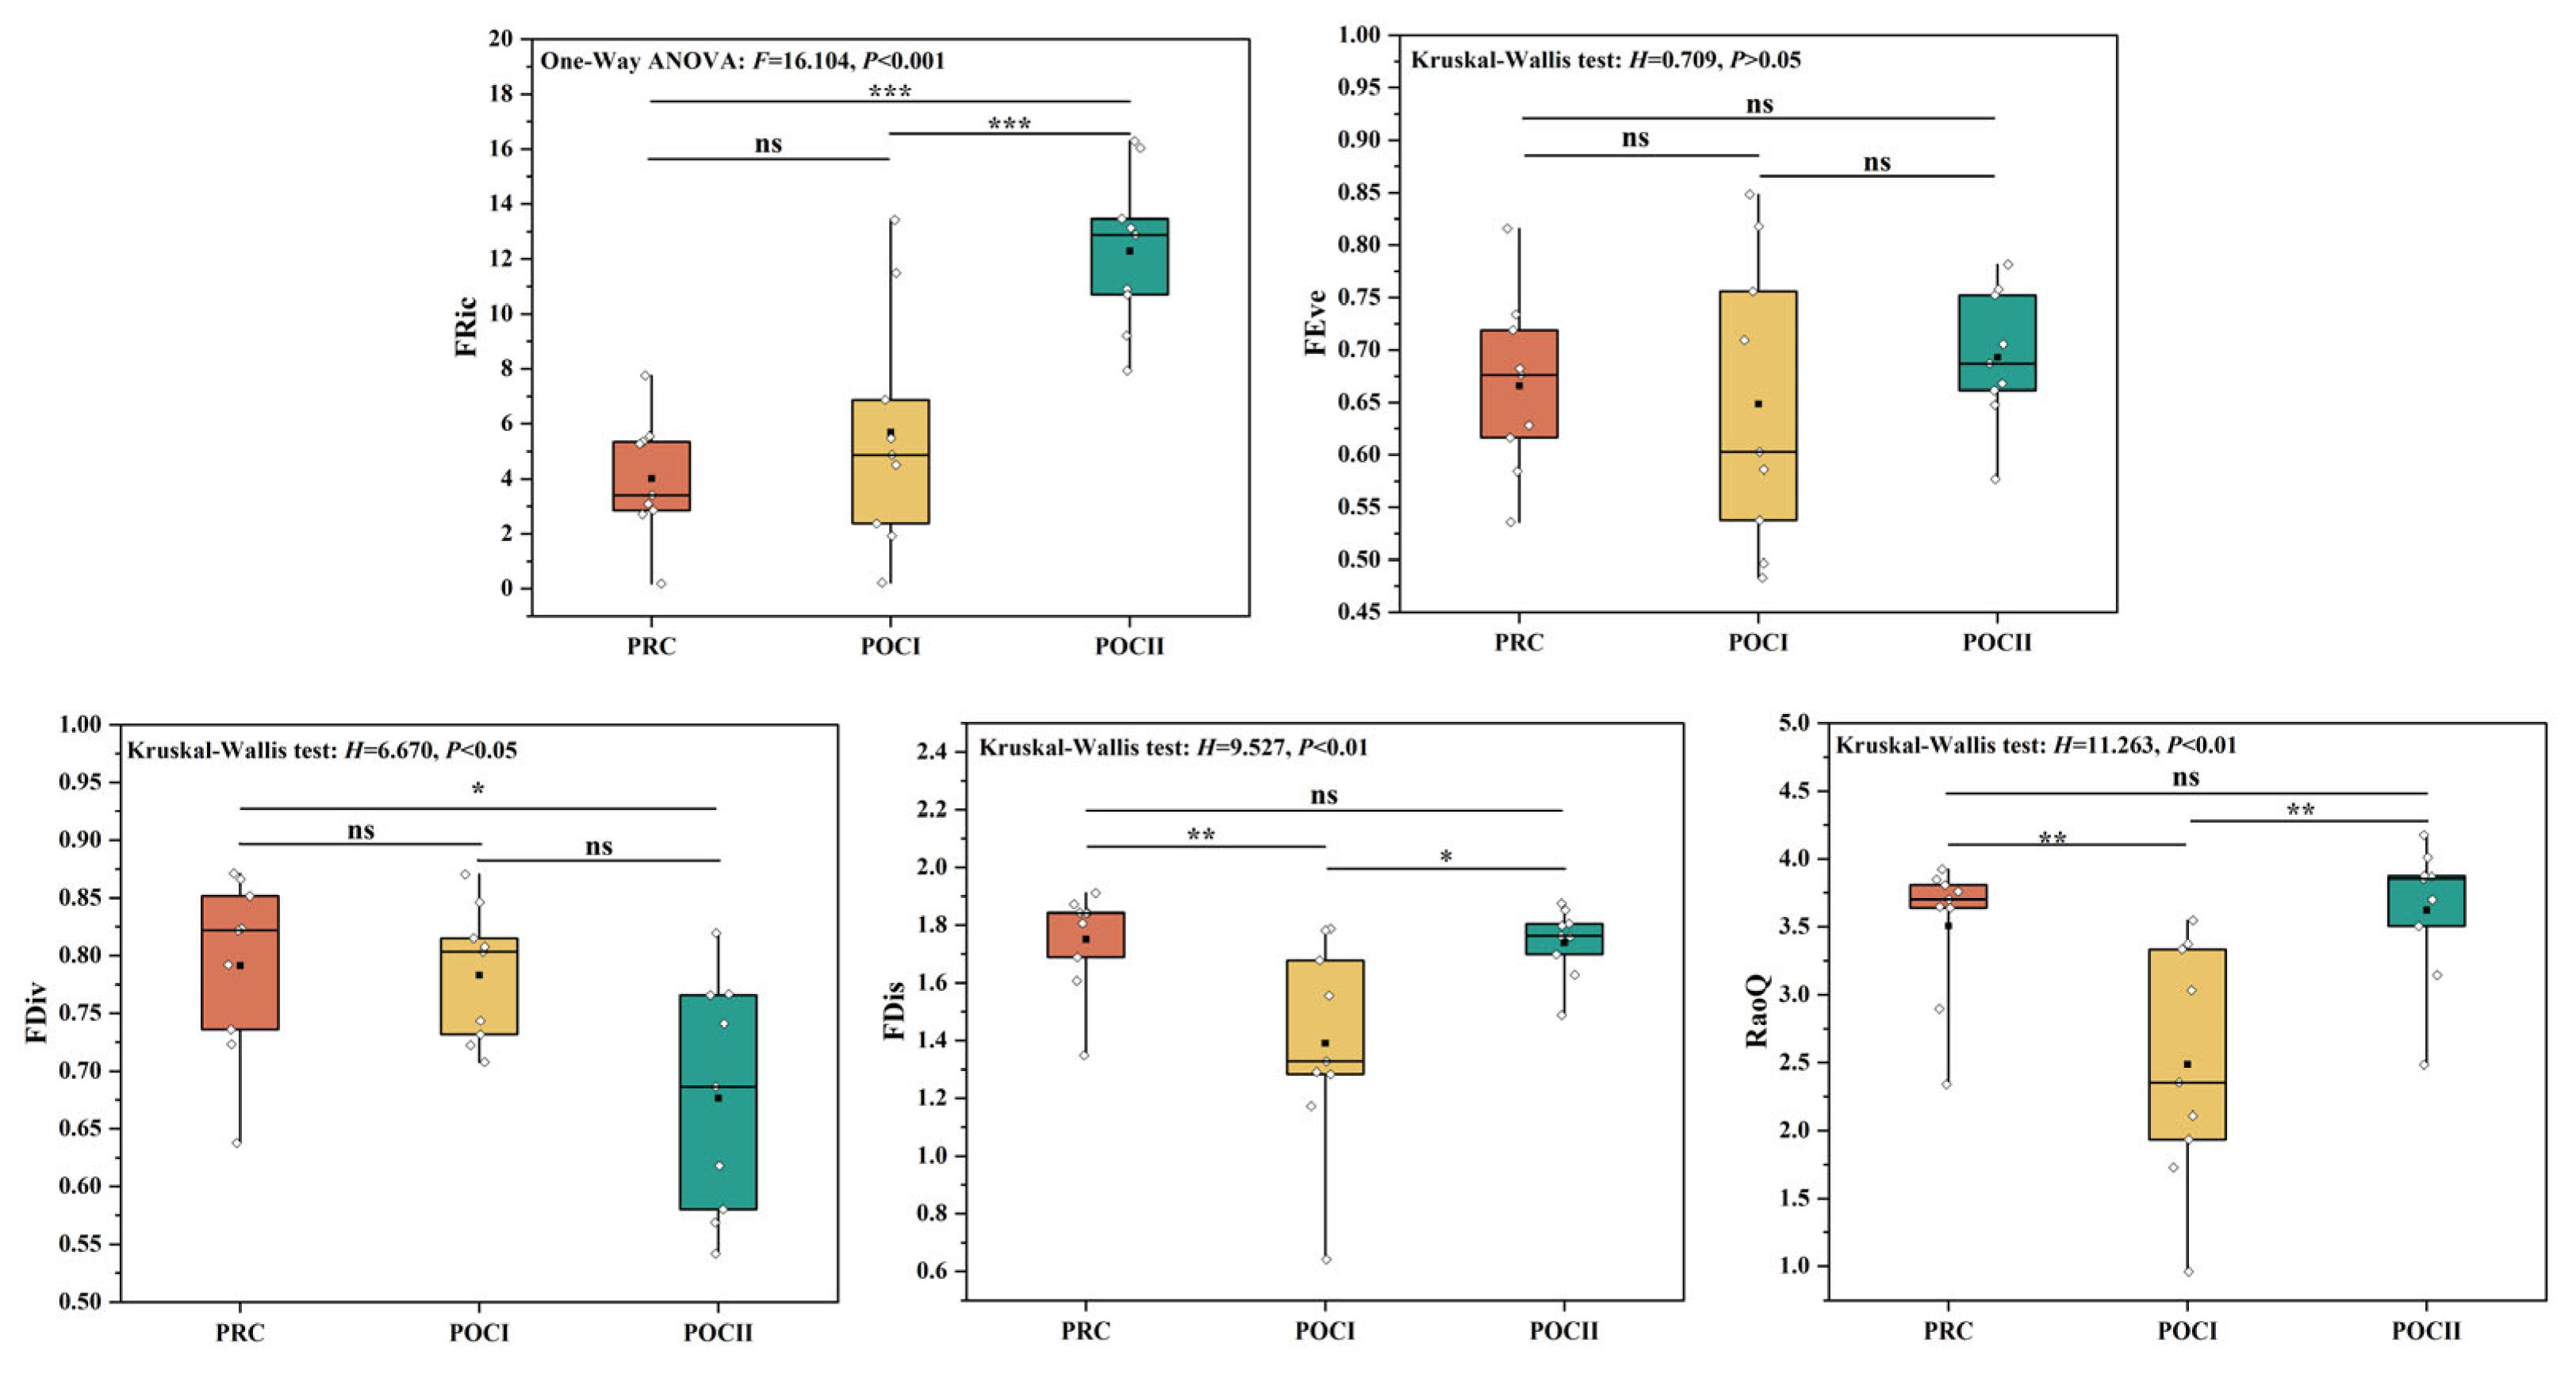
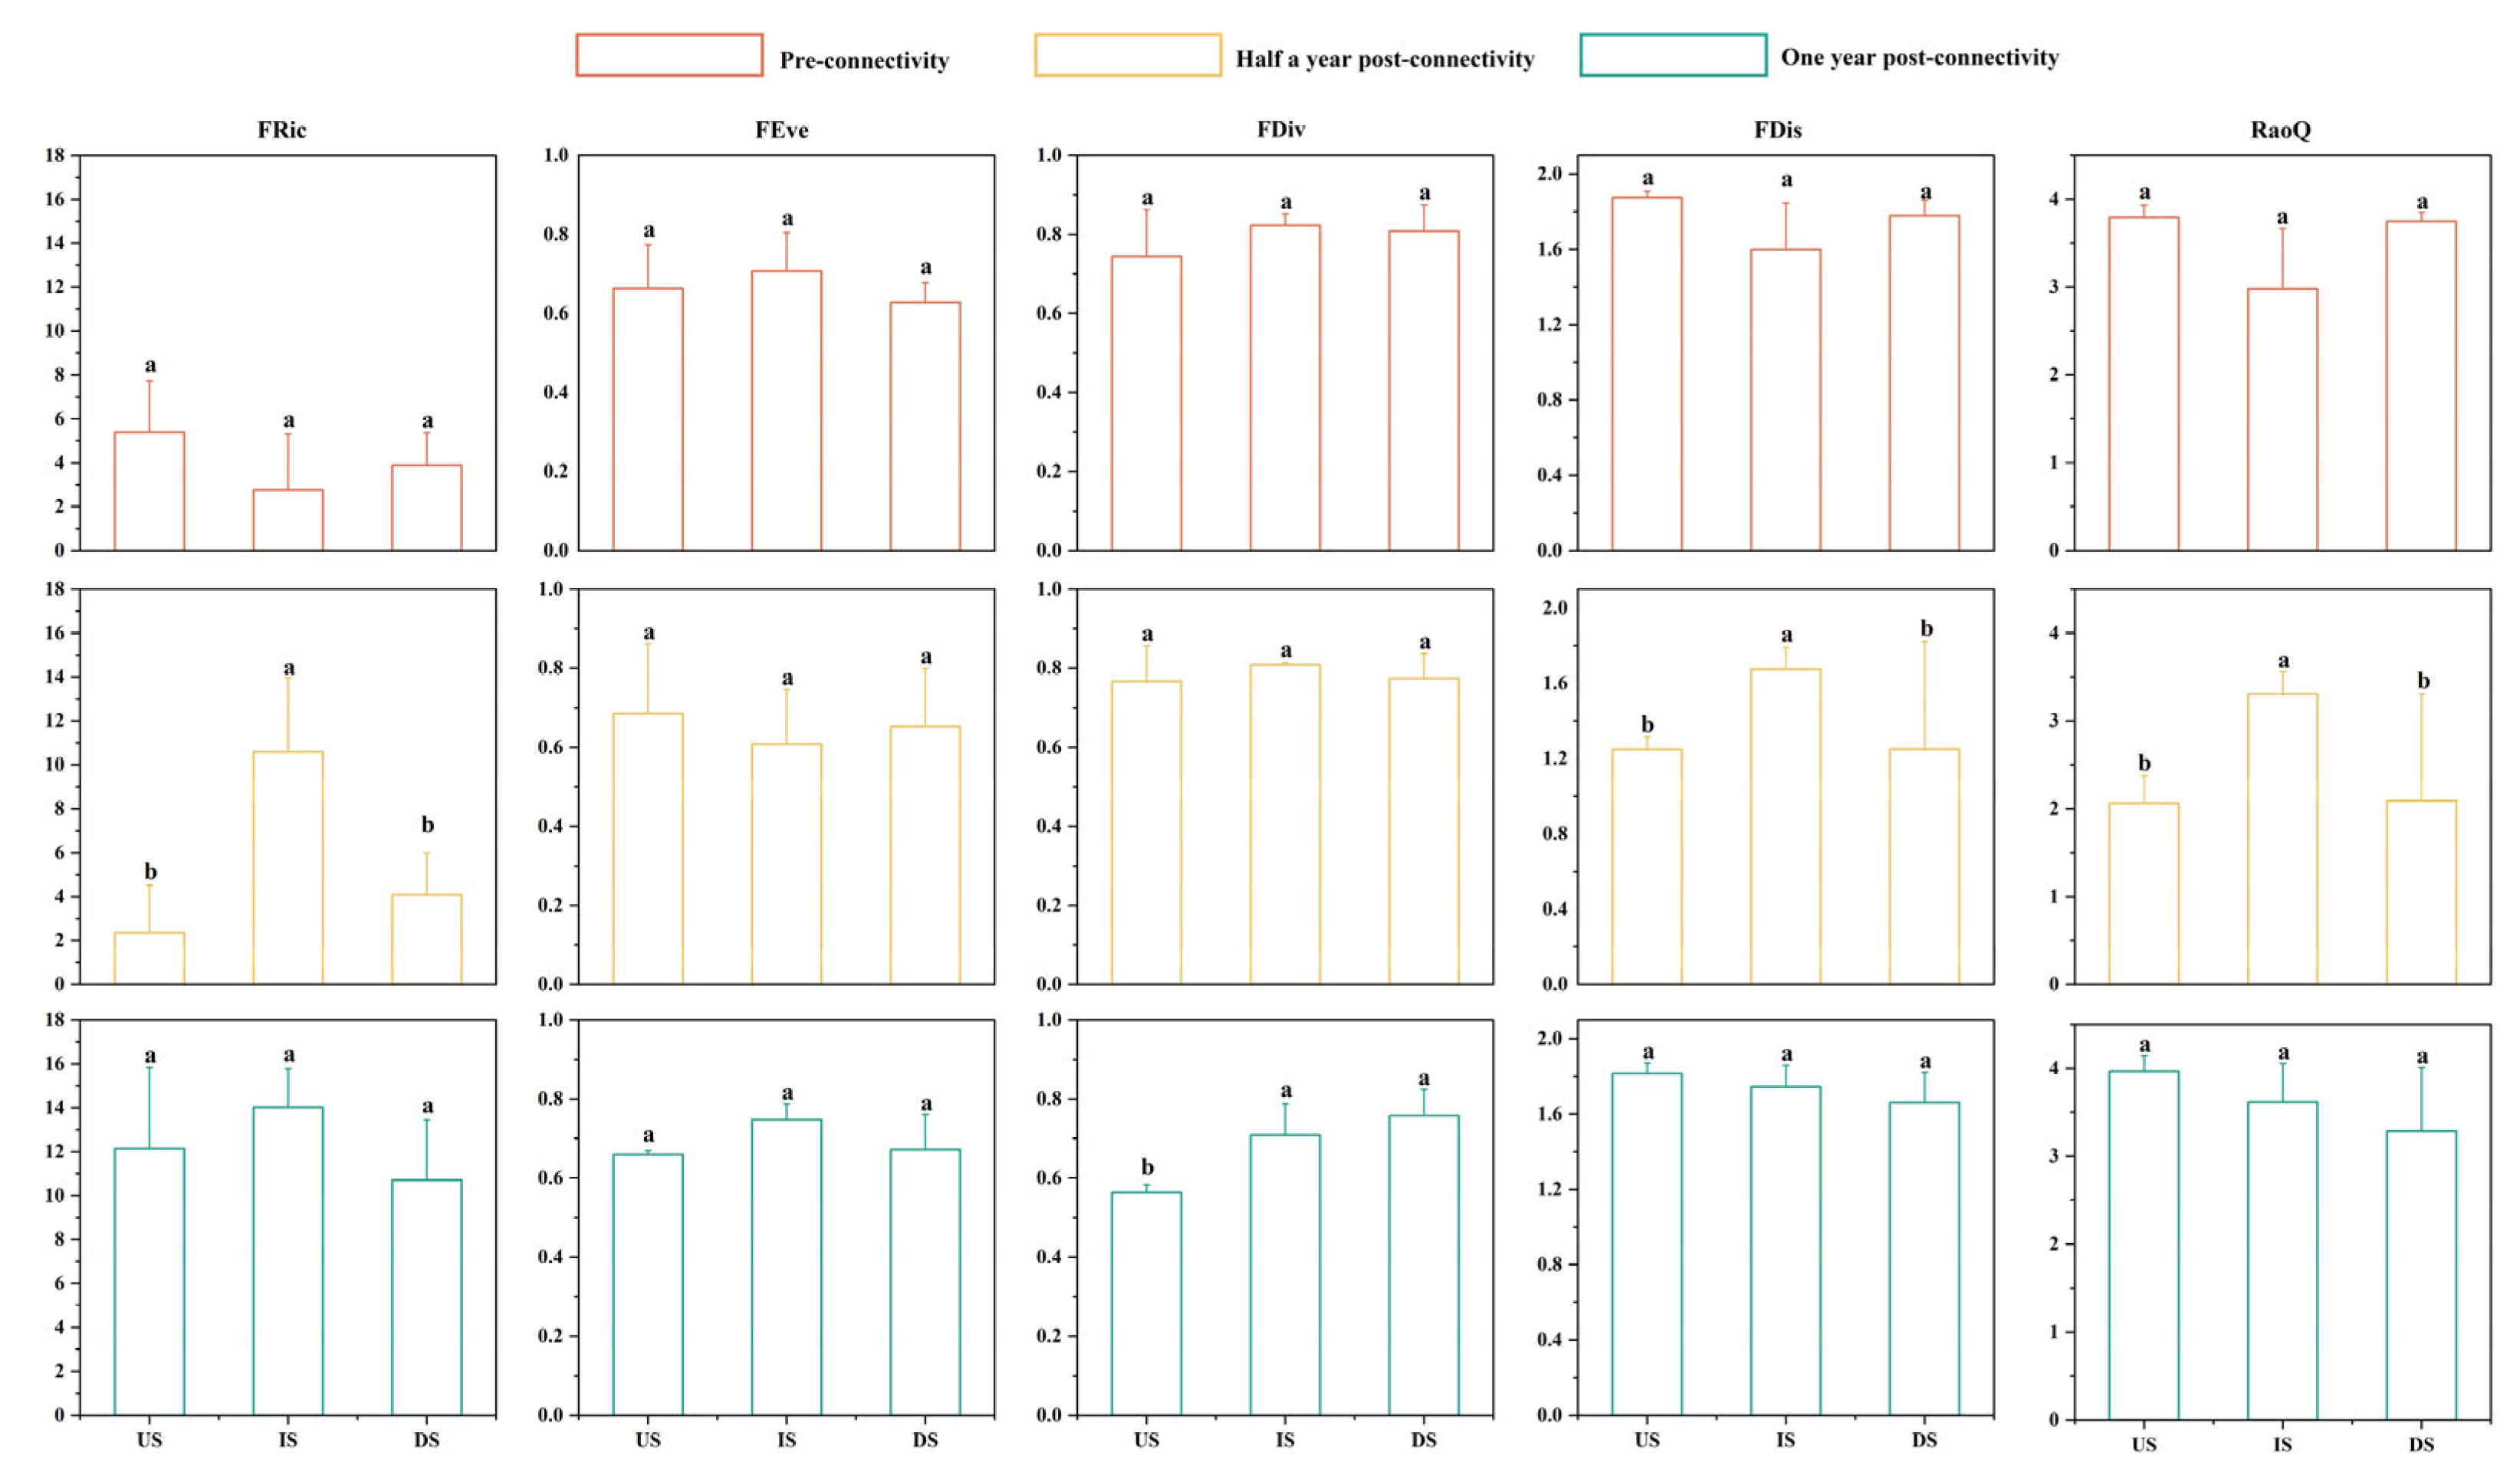
3.3. Variation Characteristics of Fish Functional Diversity

Based on the characteristics of changes in five functional diversity indices before and after the implementation of the connectivity project (Figure 8), FRic gradually increased after the implementation of the project, especially in POCⅡ, where it showed a significant improvement (p < 0.001). In contrast, FDiv showed less fluctuation in POCⅠ (p > 0.05), but a more significant decrease in POCⅡ (p < 0.05). The trends in FDis and RaoQ changes are similar, showing a significant decrease in POCⅠ (p < 0.01), while POCⅡ and PRC were relatively stable (p > 0.05).
The connectivity restoration projects had a significant impact on the functional diversity indices of the IS, and altered the differential characteristics among sections (Figure 9). During the PRC period, none of the five indices showed statistical differences (p > 0.05), though mean values indicated that the IS had the lowest FRic, FDis, and RaoQ, with the other two indices similar to those in the US and DS. In POCⅠ, FRic, FDis, and RaoQ in the IS were significantly higher than in the US and DS (p < 0.05), while FEve and FDiv showed no differences despite a slightly lower FEve and a higher FDiv in the IS via mean comparison. For POCⅡ, only FDiv differed statistically (p < 0.05) with lower values in the US than in the downstream IS and DS, whereas mean analysis for the other four indices showed a higher FRic and FEve in the IS, and gradual slight decreases in FDis and RaoQ along the flow direction.
The sequential clustering analysis indicated that functional diversity differences among sections varied significantly across the PRC, POCⅠ, and POCⅡ periods, with the greatest disparities in POCⅠ, followed by PRC, and homogenization in POCⅡ (Figure 10). Specifically, during the PRC period, three groups identified at a dissimilarity distance of 0.61 (US, IS sampling sites 4#, IS sampling sites 5#–6# and DS) showed significant differences (R = 0.384, p = 0.048), while other groupings were non-significant. In the POCⅠ period, three groups divided at 0.77 (US, IS and DS sampling sites 7#–8#, DS sampling site 9#) exhibited significant differences (R = 0.411, p = 0.046), whereas grouping at 0.98 showed no differences. During the POCⅡ period, all groupings (two groups at 0.22, three groups at 0.19, four groups at 0.13) displayed no significant differences.

3.4. Analysis of the Intrinsic Relationship Between Aquatic Habitat and Fish Diversity

Mantel test results showed (Figure 11) that DO was significantly correlated with six fish diversity indices (p < 0.05), among which it had extremely significant positive correlations with S and De (R > 0.5, p < 0.01). TUR was significantly correlated with four indices, with extremely significant positive correlations with FDis and RaoQ (R > 0.5, p < 0.01). pH had significant negative correlations with three functional diversity indices (0.3 < R < 0.5, p < 0.05). V was significantly correlated with nine indices, including extremely significant positive correlations with S, De, Ma, HB, H′, and FRic (R > 0.5, p < 0.01). W was significantly correlated with seven indices, with only extremely significant positive correlations with FRic and RaoQ (R > 0.5, p < 0.01). WD was significantly correlated with eight indices, including extremely significant positive correlations with HB, D, and FRic (R > 0.5, p < 0.01), and an extremely significant negative correlation with D1-d. These results indicate that hydrological factors (V, WD) had stronger driving effects on fish diversity indices than hydrochemical factors (DO, TUR, pH, W), particularly influencing species diversity.
During SEM analysis, non-significant observed variables were sequentially excluded for model refinement based on model fit parameters, and finally TUR, DO, V, W, WD, HB, D1-d, H′, Ma, FRic, RaoQ, and FDis were selected as the main contributing factors for four categories of latent variables. The model fit parameters were as follows: CMIN/DF = 1.508 (within the range of 1–3), SRMR = 0.072 (<0.08), GFI = 0.946 (>0.90), CFI = 0.949 (>0.90), and IFI = 0.954 (>0.90). Although RMSEA = 0.084 (>0.08) and TLI = 0.873 (<0.90) did not fully meet the criteria, the deviations were small and within acceptable ranges. Comprehensive analysis suggested a high degree of fit between the model and the actual data. Model results showed (Figure 12) that hydrological factors had high standardized path coefficients with fish species diversity and functional diversity (0.873 and 0.689, respectively), both reaching extremely significant levels (p < 0.001). In contrast, hydrochemical factors only showed a statistically significant relationship with species diversity (p < 0.05), with a standardized coefficient of 0.517. This indicates that hydrological factors had a greater impact on fish diversity than hydrochemical factors, and fish species diversity was more sensitive to habitat environments. Additionally, the standardized path coefficient between fish species diversity and functional diversity was 0.688, with significant differences (p < 0.01), suggesting a mutually positive influence between the two types of diversity.

4. Discussion

4.1. Changes in Aquatic Habitat and Fish Diversity Before and After River Connectivity Restoration

Differential analysis and principal component analysis (PCA) show that aquatic environmental factors in the three project periods exhibit significant separation (the PERMANOVA test was significant), indicating that connectivity restoration has a significant impact on the aquatic habitat of low-order streams [27,29,45,46]. In terms of change trends, most environmental factors showed an upward trend one year after restoration, aligning with the conclusion proposed by Yu [47] and Yang [48] that connectivity indices are positively correlated with aquatic environmental quality. Among them, hydrochemical factors showed more obvious changes than hydrological factors, which is closely related to the physical characteristics of low-order streams. Their narrow, shallow, and gentle channels, small water volume, and weak resistance to external disturbances make long-term water retention prone to the enrichment of suspended solids, organic pollutants, and sediment deposits, disrupting the stability of hydrochemical substances [49,50]. After connectivity is restored, enhanced water flow exchange promotes the rapid diffusion or transfer of harmful substances, and improves water oxygen solubility, leading to significant short-term improvements in hydrochemical factors [51]. In contrast, hydrological factors are limited by the natural structure of low-order streams (such as a small channel capacity and low riverbed elevation) [52]. Although only a small increase occurred, it still expanded the habitat space for fish and provided suitable external flow conditions for rheophilic fish. As Qin’s research pointed out, water velocity not only brings more nutrients but also stimulates spawning in rheophilic fish [22].
In terms of species diversity, five indices (accounting for 75%) of species diversity showed extremely significant differences (p < 0.01) one year after restoration, while only two indices (accounting for 40%) of functional diversity reached statistical significance (p < 0.05), indicating that connectivity restoration has a more direct impact on species diversity. This is mainly because after river connectivity is restored, fish quickly recruit, leading to obvious changes in species richness and individual numbers [53]. However, functional redundancy may exist among different fish species, meaning that multiple species share the same functional category, resulting in a relatively delayed response in functional diversity [42,54]. Specifically, except for a significant decrease in D and a slight increase in De, all other species diversity indices significantly increased, reflecting that the fish community structure is becoming more diverse and stable [55,56]. The insignificant increase in N may be related to the short monitoring interval, newly colonized fish may not have reached the spawning period or were in the larval stage, and the fishing gear used may be inappropriate, limiting capture efficiency [1,8]. Additionally, some scholars have found that improved connectivity and fish abundance are not simply positively linearly correlated and may even decrease, which also provides a reference for the results of this study [19,57,58].
Functional diversity analysis shows that Fric significantly increased while FDiv significantly decreased, indicating that after river connectivity was restored, the range of functional traits in fish communities expanded, and resource competition decreased [59]. FEve, FDis, and the comprehensive functional index RaoQ showed no significant changes, consistent with the findings of Bower’s connectivity restoration study on the Twelve Mile River and Shaffer’s research after nearshore dam removal [38,58]. It is speculated that the reason is similar to the non-significant increase in N: the restoration time may be too short for the functional traits of new species to fully differentiate, or the redundancy of species with similar functions may have prevented significant changes in the overall structure of functional diversity. Analysis of data from the first six months of restoration showed that only four indices, DO, TUR, FDis, and RaoQ, changed significantly [60,61]. This difference may be the result of the combined effects of winter environmental conditions and the lag in ecosystem response, indicating that even in small rivers, it may take years or even decades for ecosystems to reach a new stable state [8,60].

4.2. Analysis of Heterogeneity Between River Sections Formed by River Blockages After River Connectivity

PCA and ChClust analyses show that before restoration, sampling points of aquatic environmental factors were scattered, and significant differences existed in the grouping of fish species diversity (similarity distance 0.73) and functional diversity (similarity distance 0.61). After restoration, differences between groups only appeared at smaller dissimilarity distances, indicating that both aquatic environmental factors and fish diversity tended to homogenize [8,55,62]. This phenomenon is closely related to the terminal attributes and scale characteristics of the study river section. The restored section has low channel morphology heterogeneity—before connectivity, only microhabitat differences existed in riverbanks and riverbed substrates. After connectivity, the original microhabitat differences disappeared due to the scouring by upstream water flow, leading to convergent habitat types and thus the homogenization of aquatic environmental factors and biodiversity [62].
From the perspective of differential changes in project sections, before restoration, aquatic environmental factors, species diversity, and functional diversity indices between projects (sections affected by barriers) were generally the lowest. Two river-blocking barriers caused poor water circulation, and the continuous enrichment of pollutants, suspended solids, and sediments, severely deteriorating habitat environments [13,63,64]. The enclosed and narrow space limited food resources and breeding grounds, only supporting the survival of fish with strong stress resistance, high fecundity, and broad feeding habits, forming a community structure with a narrow range of functional traits and weak niche complementarity [65,66]. Dominant species exerted a squeezing effect on the living space of specialized functional fish.
Half a year post-connectivity, most aquatic environmental factors and diversity indices between projects became the highest, while those in the upstream project area were lower. This phenomenon is influenced by two factors: first, a low water volume, slow water velocity, and weak water kinetic energy in winter, combined with decreased water temperature reduced fish appetite and narrowed activity ranges, with most fish entering overwintering areas or sheltered sites to hibernate [63]; second, the upstream restoration measure was culvert reconstruction (with a limited connectivity capacity), while the downstream barrier was completely removed. In winter, upstream water connectivity was weaker than downstream, hindering fish migration upstream and making the area between projects a relatively aggregated region [5].
One year post-connectivity, aquatic environmental factors and fish diversity became consistent between the upstream project area and the area between projects. The transformation and removal of river-blocking barriers achieved continuous water flow from upstream to downstream, no longer hindering fish behaviors such as feeding, breeding, and hazard avoidance, and significantly expanding habitat space and resource acquisition ranges [16,19,67]. However, downstream project indices were low, mainly due to the influence of the main river with poor water quality [68]. Additionally, after the Yanjing River was connected, harmful substances were effectively transferred or degraded, improving habitat environments and attracting fish recruitment from upstream and the mainstream of the Chishui River, particularly fish with upstream migratory spawning habits, which could enter tributaries from the mainstream to complete feeding and breeding activities [16].

4.3. The Internal Relationships Between Aquatic Habitat and Fish Diversity

Structural equation modeling (SEM) shows that hydrological factors have a significantly stronger impact on fish diversity than hydrochemical factors, particularly exerting a more direct promoting effect on species diversity. When hydrological factors improve, the Shannon index, evenness, and richness of fish communities all exhibit rapid positive responses [69]. Combined with Mantel analysis, water velocity (V) among hydrological factors is the main driving factor. Increased water velocity not only stimulates spawning in rheophilic fish but also provides attractive conditions for the upstream migration of anadromous fish [23]. The expansion of water depth (W) and water surface width (WD) provides broader habitat space for fish, meeting their needs for feeding, reproduction, and hazard avoidance, thereby reducing resource competition [64]. Additionally, accelerated water velocity promotes material transfer and energy circulation, enhances the water purification capacity, and strengthens genetic exchange among fish, maintaining the diversity and stability of community structure [57].
For functional diversity, the impact of hydrological factors includes both the direct recruitment of functional traits that respond to them (e.g., water velocity affecting spawning types and habitat preferences, habitat space determining feeding habits and trophic levels) and the indirect synergistic effects generated through species diversity. Improved hydrological conditions promote the recruitment of fish with different functional categories, expanding the range of functional traits [66]. However, the response speed of functional diversity lags behind that of species diversity, possibly related to the longer time required for community adaptation to achieve functional trait balance [70,71].
Regarding the finding that the promoting effect of hydrochemical factors on fish diversity is significantly weaker than that of hydrological factors, this may be closely linked to the short monitoring period [8,60]. Research from related scholars indicates that hydrochemical factors primarily impact growth rate and body morphology by acting on the regulatory mechanisms of fish growth and development, directly influencing cell morphology, and ultimately affecting fish community diversity and structural stability. This impact is deeply rooted and may exert long-term or even permanent effects, indicating that hydrochemical factors do not demonstrate an immediate positive correlation with fish community diversity but exhibit a pronounced lag effect [72,73]. This study relies solely on one-year monitoring data. Within such a short-term timeframe, the improvement in hydrochemical conditions following connectivity restoration primarily satisfies the basic survival needs of fish. Thus, in the analysis of short-term data, the impact of hydrochemical factors on fish diversity is less pronounced than that of hydrological factors. Therefore, subsequent studies should rely on long-term and continuous monitoring data to fully reveal the influence mechanisms of hydrochemical and hydrological factors on fish diversity.

5. Conclusions

This study innovatively proposes a coupled technical scheme of “dam removal-culvert reconstruction” to specifically address the problem of blocked connectivity at the terminals of low-order streams. From the two dimensions of aquatic habitat and fish diversity, it systematically analyzes the change characteristics and internal correlation mechanisms of hydrochemical factors, hydrological factors, fish species diversity, and functional diversity. The research results show that river connectivity restoration can produce significant positive ecological effects: even in the environment of low-order streams and with a short monitoring period, the restoration project can still significantly improve the hydrochemical index and species diversity level. It is worth noting that influenced by the river’s spatial scale effect, the aquatic habitat characteristics and fish diversity composition in different river sections gradually tend to homogenize after restoration. Further research reveals that the improvement of hydrological factors has a more efficient driving effect on the enhancement of fish diversity. Completely removing river-blocking barriers can quickly restore the natural flow state of downstream channels and significantly increase water flow velocity and runoff scale.
In terms of the selection and application of analytical methods, the sequential clustering method demonstrates good applicability when performing exploratory cluster analysis on samples with spatial or temporal series characteristics, and can effectively reveal the evolution laws of continuous space or time. The combined use of Mantel analysis and structural equation modeling can not only intuitively present the correlations between observed variables, but also can clearly reveal the internal influence degree between latent variables, providing a comprehensive and in-depth analytical perspective for the research. In terms of connectivity restoration engineering practice, complete removal of river-blocking barriers should be prioritized to achieve the rapid natural restoration of hydrological processes. Meanwhile, it is necessary to combine habitat heterogeneity enhancement technologies, such as constructing deep pool–shallow beach sequences and laying multi-grain-size riverbed substrates, to form a synergistic restoration effect between improved hydrological conditions and optimized habitat structures. This study provides a scientific and operational technical path for the ecological restoration of small rivers and holds important reference value for water ecological protection and the restoration of similar rivers.

Author Contributions

Conceptualization, X.L. and X.C. (Xuan Che); methodology, X.L. and X.C. (Xuan Che); software, X.L.; formal analysis, X.C. (Xiaolong Chen) and C.T.; investigation, X.L. and J.Z.; writing—original draft, X.L.; writing—review and editing, X.C. (Xuan Che) and J.Z.; visualization, X.L.; supervision, C.T.; project administration, X.C. (Xuan Che) and X.C. (Xiaolong Chen); funding acquisition, X.C. (Xuan Che). All authors have read and agreed to the published version of the manuscript.

Funding

Species Protection Project of the Ministry of Agriculture and Rural Affairs of China: Pilot Program for Ecological Restoration in the Yangtze River Basin: 2025LKY015; Central Public-interest Scientific Institution Basal Research Fund, CAFS: 2023TD67; Science & Technology Fundamental Resources Investigation Program: Grant No.2022FY100400; Central Public-interest Scientific Institution Basal Research Fund, FMIRI of CAFS: 2025YJS306.

Institutional Review Board Statement

The study was approved by the Animal Welfare and Ethics Working Group of FMIRI; FMIRI-AWE-2023-001; 1 June 2023.

Data Availability Statement

The raw data supporting the conclusions of this article will be made available by the authors on request.

Conflicts of Interest

The authors declare no conflicts of interest.

References

  1. Garcia De Leaniz, C.; Wantzen, K.M.; Wolter, C.; Tharme, R.E.; Zalewski, M.; Belletti, B. Editorial: Challenges and Benefits of Restoring River Connectivity. Front. Ecol. Evol. 2023, 11, 1110413. [Google Scholar] [CrossRef]
  2. Kujanová, K.; Matoušková, M. Improvement in Physical River Habitat Quality in Response to River Restoration Measures. Geografie 2016, 121, 54–78. [Google Scholar] [CrossRef]
  3. Belletti, B.; Garcia De Leaniz, C.; Jones, J.; Bizzi, S.; Börger, L.; Segura, G.; Castelletti, A.; Van De Bund, W.; Aarestrup, K.; Barry, J.; et al. More than One Million Barriers Fragment Europe’s Rivers. Nature 2020, 588, 436–441. [Google Scholar] [CrossRef]
  4. Grill, G.; Lehner, B.; Thieme, M.; Geenen, B.; Tickner, D.; Antonelli, F.; Babu, S.; Borrelli, P.; Cheng, L.; Crochetiere, H.; et al. Mapping the World’s Free-Flowing Rivers. Nature 2019, 569, 215–221. [Google Scholar] [CrossRef]
  5. Poff, N.L.; Hart, D.D. How Dams Vary and Why It Matters for the Emerging Science of Dam Removal. Bioscience 2002, 52, 659–668. [Google Scholar] [CrossRef]
  6. Ioannidou, C.T.; Neeson, T.M.; O’Hanley, J.R. Boosting Large-Scale River Connectivity Restoration by Planning for the Presence of Unrecorded Barriers. Conserv. Biol. 2023, 37, e14093. [Google Scholar] [CrossRef]
  7. McKay, S.K.; Martin, E.H.; McIntyre, P.B.; Milt, A.W.; Moody, A.T.; Neeson, T.M. A Comparison of Approaches for Prioritizing Removal and Repair of Barriers to Stream Connectivity. River Res. Appl. 2020, 36, 1754–1761. [Google Scholar] [CrossRef]
  8. Wohl, E.; Fryirs, K.; Grabowski, R.C.; Morrison, R.R.; Sear, D. Enhancing the Natural Absorbing Capacity of Rivers to Restore Their Resilience. Bioscience 2024, 74, 782–796. [Google Scholar] [CrossRef]
  9. Birnie-Gauvin, K.; Nielsen, J.; Frandsen, S.B.; Olsen, H.-M.; Aarestrup, K. Catchment-Scale Effects of River Fragmentation: A Case Study on Restoring Connectivity. J. Environ. Manage. 2020, 264, 110408. [Google Scholar] [CrossRef]
  10. Tummers, J.S.; Hudson, S.; Lucas, M.C. Evaluating the Effectiveness of Restoring Longitudinal Connectivity for Stream Fish Communities: Towards a More Holistic Approach. Sci. Total Environ. 2016, 569–570, 850–860. [Google Scholar] [CrossRef]
  11. Drouineau, H.; Carter, C.; Rambonilaza, M.; Beaufaron, G.; Bouleau, G.; Gassiat, A.; Lambert, P.; Le Floch, S.; Tétard, S.; De Oliveira, E. River Continuity Restoration and Diadromous Fishes: Much More than an Ecological Issue. Environ. Manag. 2018, 61, 671–686. [Google Scholar] [CrossRef]
  12. Kunakh, O.M.; Volkova, A.M.; Tutova, G.F.; Zhukov, O.V. Diversity of diversity indices: Which diversity measure is better? Biosyst. Divers. 2023, 31, 131–146. [Google Scholar] [CrossRef]
  13. Rodeles, A.A.; Miranda, R.; Galicia, D. Barriers to Longitudinal River Connectivity: Review of Impacts, Study Methods and Management for Iberian Fish Conservation. Limnetica 2020, 39, 601–619. [Google Scholar] [CrossRef]
  14. Wegscheider, B.; Waldock, C.; Calegari, B.B.; Josi, D.; Brodersen, J.; Seehausen, O. Neglecting Biodiversity Baselines in Longitudinal River Connectivity Restoration Impacts Priority Setting. Sci. Total Environ. 2024, 954, 175167. [Google Scholar] [CrossRef] [PubMed]
  15. Sneddon, C.S.; Barraud, R.; Germaine, M.-A. Dam Removals and River Restoration in International Perspective. Water Altern. 2017, 10, 648–654. [Google Scholar]
  16. Gessner, J.; Zahn, S.; Jaric, I.; Wolter, C. Estimating the Potential for Habitat Restoration and Connectivity Effects on European Sturgeon (Acipenser Sturio L. 1758) Population Rehabilitation in a Lowland River-the Havel, Germany. J. Appl. Ichthyol. 2014, 30, 1473–1482. [Google Scholar] [CrossRef]
  17. Besacier-Monbertrand, A.-L.; Paillex, A.; Castella, E. Short-term impacts of lateral hydrological connectivity restoration on aquatic macroinvertebrates. River Res. Appl. 2012, 30, 557–570. [Google Scholar] [CrossRef]
  18. Pohl, M.M. Bringing down our dams: Trends in american dam removal rationales. J. Am. Water Resour. Assoc. 2002, 38, 1511–1519. [Google Scholar] [CrossRef]
  19. Bellmore, J.R.; Pess, G.R.; Duda, J.J.; O’Connor, J.E.; East, A.E.; Foley, M.M.; Wilcox, A.C.; Major, J.J.; Shafroth, P.B.; Morley, S.A. Conceptualizing Ecological Responses to Dam Removal: If You Remove It, What’s to Come? Bioscience 2019, 69, 26–39. [Google Scholar] [CrossRef]
  20. Major, J.J.; East, A.E.; O’Connor, J.E.; Grant, G.E.; Wilcox, A.C.; Magirl, C.S.; Collins, M.J.; Tullos, D.D. Geomorphic Responses to Dam Removal in the United States—A Two-Decade Perspective. In Gravel-Bed Rivers; Tsutsumi, D., Laronne, J.B., Eds.; Wiley: Hoboken, NJ, USA, 2017; pp. 355–383. [Google Scholar]
  21. Wood, D.M.; Welsh, A.B.; Todd Petty, J. Genetic Assignment of Brook Trout Reveals Rapid Success of Culvert Restoration in Headwater Streams. North Am. J. Fish. Manag. 2018, 38, 991–1003. [Google Scholar] [CrossRef]
  22. Qiu, J.; Yuan, S.; Tang, H.; Zhang, Q.; Wolter, C.; Nikora, V. Ecological Connectivity of River-Lake Ecosystem: Evidence from Fish Population Dynamics in a Connecting Channel. Water Resour. Res. 2024, 60, e2024WR037495. [Google Scholar] [CrossRef]
  23. Birnie-Gauvin, K.; Candee, M.M.; Baktoft, H.; Larsen, M.H.; Koed, A.; Aarestrup, K. River Connectivity Reestablished: Effects and Implications of Six Weir Removals on Brown Trout Smolt Migration. River Res. Appl. 2018, 34, 548–554. [Google Scholar] [CrossRef]
  24. Branco, P.; Segurado, P.; Santos, J.M.; Ferreira, M.T. Prioritizing Barrier Removal to Improve Functional Connectivity of Rivers. J. Appl. Ecol. 2014, 51, 1197–1206. [Google Scholar] [CrossRef]
  25. Silva, A.T.; Lucas, M.C.; Castro-Santos, T.; Katopodis, C.; Baumgartner, L.J.; Thiem, J.D.; Aarestrup, K.; Pompeu, P.S.; O’Brien, G.C.; Braun, D.C.; et al. The Future of Fish Passage Science, Engineering, and Practice. Fish Fish. 2017, 19, 340–362. [Google Scholar] [CrossRef]
  26. Downing, J. Global Abundance and Size Distribution of Streams and Rivers. Inland Waters 2012, 2, 229–236. [Google Scholar] [CrossRef]
  27. Harvey, J.; Gomez-Velez, J.; Schmadel, N.; Scott, D.; Boyer, E.; Alexander, R.; Eng, K.; Golden, H.; Kettner, A.; Konrad, C.; et al. How Hydrologic Connectivity Regulates Water Quality in River Corridors. J. Am. Water Resour. Assoc. 2018, 55, 369–381. [Google Scholar] [CrossRef]
  28. Aftabuddin, M.; Hassan, M.A.; Das, A.K.; Jha, B.C.; Sharma, A.P. Effect of River Connectivity on Hydrochemistry, Sediment Enzyme Activity and Biotic Communities of Wetlands. Aquat. Ecosyst. Health Manag. 2017, 20, 140–150. [Google Scholar] [CrossRef]
  29. Lei, Y.; Dong, F.; Liu, X.; Ma, B.; Huang, W. Short-Term Variations and Correlations in Water Quality after Dam Removal in the Chishui River Basin. J. Environ. Manag. 2023, 327, 116917. [Google Scholar] [CrossRef]
  30. Yu, F.; Liu, F.; Xia, Z.; Lin, P.; Xu, C.; Wang, J.; Hou, M.; Zou, X. Classification and Assessment Methods for Mountain Channel Habitats in the Chishui River Basin, China. Water 2022, 14, 515. [Google Scholar] [CrossRef]
  31. Yujun, Y.; Yanning, G.; Shanghong, Z. The Impact of Dams on the River Connectivity of the Two Largest River Basins in China. River Res. Appl. 2021, 38, 185–193. [Google Scholar] [CrossRef]
  32. SL 58-2014; Specification for Geodesic Survey in Hydrology. China Water&Power Press: Beijing, China, 2014.
  33. Chu, Y.; Sun, Z.; He, X.; Jin, W.; Cheng, Y. Colored Atlas of Fishes in Sichuan, China: Volumes I and II; C.S.P.M.: Beijing, China, 2021. [Google Scholar]
  34. Guo, X.; Cheng, Y. The Fishes of Yunnan, China: Volumes I and II; C.S.P.M.: Beijing, China, 1990. [Google Scholar]
  35. Wu, L.; Li, D.; Zhao, Z. The Fishes of Guizhou, China; Guizhou People’s Publishing House: Guizhou, China, 1989. [Google Scholar]
  36. Villéger, S.; Miranda, J.R.; Hernández, D.F.; Mouillot, D. Contrasting Changes in Taxonomic vs. Functional Diversity of Tropical Fish Communities after Habitat Degradation. Ecol. Appl. 2010, 20, 1512–1522. [Google Scholar] [CrossRef] [PubMed]
  37. Villéger, S.; Grenouillet, G.; Brosse, S. Decomposing Functional β-Diversity Reveals That Low Functional β-Diversity Is Driven by Low Functional Turnover in European Fish Assemblages: Decomposing Functional β-Diversity. Glob. Ecol. Biogeogr. 2013, 22, 671–681. [Google Scholar] [CrossRef]
  38. Bower, L.M.; Marion, C.A.; Scott, M.; Kubach, K.; Gelder, A. Fish Assemblage and Functional Trait Responses to Small-Dam Removal. Freshw. Biol. 2024, 69, 1043–1056. [Google Scholar] [CrossRef]
  39. Zhang, Y.; Zhang, H.; Wu, Z.; Zhao, M.; Feng, G. Community Structure Characteristics and Changes in Fish Species at Poyang Lake after the Yangtze River Fishing Ban. Fishes 2024, 9, 281. [Google Scholar] [CrossRef]
  40. Vakal, A.; Govorun, O.; Gulevets, D.; Korchynska, Z.; Kushch, Y. The Impact of the Ecosystem on Biodiversity Restoration in the Natural Ecosystems of Ukraine. Grassroots J. Nat. Resour. 2025, 8, 945–963. [Google Scholar] [CrossRef]
  41. Happel, A. Increasing Fish Diversity of Chicago’s Waterways. Knowl. Manag. Aquat. Ecosyst. 2022, 423, 6. [Google Scholar] [CrossRef]
  42. Chao, A.; Chiu, C.; Villéger, S.; Sun, I.; Thorn, S.; Lin, Y.; Chiang, J.; Sherwin, W.B. An Attribute-diversity Approach to Functional Diversity, Functional Beta Diversity, and Related (Dis)Similarity Measures. Ecol. Monogr. 2019, 89, e01343. [Google Scholar] [CrossRef]
  43. Zhang, X.; Xue, Y.; Zhang, C.; Ren, Y.; Xu, B.; Chen, Y. Sampling Intensity Influences the Estimation of Functional Diversity Indices of Fish Communities. Ecol. Indic. 2021, 121, 107169. [Google Scholar] [CrossRef]
  44. Grimm, E.C. CONISS: A FORTRAN 77 Program for Stratigraphically Constrained Cluster Analysis by the Method of Incremental Sum of Squares. Comput. Geosci. 1987, 13, 13–35. [Google Scholar] [CrossRef]
  45. Shijie, P.; Lei, W.; Yongkun, L.; Ruowen, W.; Tianming, G.; Zongjun, G. A Study on Ecohydrological Mutual Feedback Relationship of the Shangdong River Basin Based on Hydrological Connectivity. Sci. Total Environ. 2024, 927, 171957. [Google Scholar] [CrossRef]
  46. Deng, X. Correlations between Water Quality and the Structure and Connectivity of the River Network in the Southern Jiangsu Plain, Eastern China. Sci. Total Environ. 2019, 664, 583–594. [Google Scholar] [CrossRef] [PubMed]
  47. Yu, Z.; Wang, Q.; Xu, Y.; Lu, M.; Lin, Z.; Gao, B. Dynamic Impacts of Changes in River Structure and Connectivity on Water Quality under Urbanization in the Yangtze River Delta Plain. Ecol. Indic. 2022, 135, 108582. [Google Scholar] [CrossRef]
  48. Yang, S.; Yang, G.; Li, B.; Wan, R. Water Quality Improves with Increased Spatially Surface Hydrological Connectivity in Plain River Network Areas. J. Environ. Manag. 2025, 377, 124703. [Google Scholar] [CrossRef]
  49. Beschta, R.L.; Platts, W.S. Morphological features of small streams: Significance and function. J. Am. Water Resour. Assoc. 1986, 22, 369–379. [Google Scholar] [CrossRef]
  50. Zhang, K.; Hu, M.; Yu, D.; Bao, Y. A Method for Detecting Navigable Areas in Narrow Rivers under Complex Reflection Conditions. Eng. Rep. 2024, 6, e12959. [Google Scholar] [CrossRef]
  51. Xiongjun, L.; Suping, P.; Lvliu, L.; Ye, Z. Variation Law of Organic Contaminant in Lijiang River. J. China Univ. Min. Technol. 2004, 14, 133–137. [Google Scholar]
  52. Nabi, M. Computational Modelling of Small-Scale River Morphodynamics. Ph.D. Thesis, Delft University of Technology, Delft, The Netherlands, 2012. [Google Scholar]
  53. Raffard, A.; Santoul, F.; Cucherousset, J.; Blanchet, S. The Community and Ecosystem Consequences of Intraspecific Diversity: A Meta-analysis. Biol. Rev. 2018, 94, 648–661. [Google Scholar] [CrossRef]
  54. Song, Y.; Wang, P.; Li, G.; Zhou, D. Relationships between Functional Diversity and Ecosystem Functioning: A Review. Acta Ecol. Sin. 2014, 34, 85–91. [Google Scholar] [CrossRef]
  55. Stoffers, T.; Buijse, A.D.; Geerling, G.W.; Jans, L.H.; Schoor, M.M.; Poos, J.J.; Verreth, J.A.J.; Nagelkerke, L.A.J. Freshwater Fish Biodiversity Restoration in Floodplain Rivers Requires Connectivity and Habitat Heterogeneity at Multiple Spatial Scales. Sci. Total Environ. 2022, 838, 156509. [Google Scholar] [CrossRef]
  56. Sun, J.; Tummers, J.S.; Galib, S.M.; Lucas, M.C. Fish Community and Abundance Response to Improved Connectivity and More Natural Hydromorphology in a Post-Industrial Subcatchment. Sci. Total Environ. 2022, 802, 149720. [Google Scholar] [CrossRef]
  57. Hansen, H.H.; Schneider, M.; Hägele, T. A Habitat Connectivity Reality Check for Fish Physical Habitat Model Results and Decision-making for River Restoration. Ecol. Solut. Evid. 2023, 4, e12291. [Google Scholar] [CrossRef]
  58. Shaffer, J.A.; Munsch, S.; Juanes, F. Functional Diversity Responses of a Nearshore Fish Community to Restoration Driven by Large-Scale Dam Removal. Estuar. Coast. Shelf Sci. 2018, 213, 245–252. [Google Scholar] [CrossRef]
  59. Faucheux, N.M.; Miranda, L.E.; Taylor, J.M.; Farris, J. Impact of Dams on Stream Fish Diversity: A Different Result. Diversity 2023, 15, 728. [Google Scholar] [CrossRef]
  60. Pool, T.K.; Olden, J.D.; Whittier, J.B.; Paukert, C.P. Environmental Drivers of Fish Functional Diversity and Composition in the Lower Colorado River Basin. Can. J. Fish. Aquat. Sci. 2010, 67, 1791–1807. [Google Scholar] [CrossRef]
  61. Torres-Bejarano, A.M.; Sulliván, S.M.P.; González-Daza, W.; Cáceres, C.; Colorado, Z.G.J. Riparian Vegetation Structure and Seasonality Influence Functional Diversity More than Taxonomic Diversity of Stream Fish Assemblages in the Colombian Amazon. Aquat. Ecol. 2021, 56, 153–172. [Google Scholar] [CrossRef]
  62. Henriques-Silva, R.; Boivin, F.; Calcagno, V.; Urban, M.C.; Peres-Neto, P.R. On the Evolution of Dispersal via Heterogeneity in Spatial Connectivity. Proc. R. Soc. B Biol. Sci. 2015, 282, 20142879. [Google Scholar] [CrossRef]
  63. Wolter, C.; Buijse, A.D.; Parasiewicz, P. Temporal and Spatial Patterns of Fish Response to Hydromorphological Processes. River Res. Appl. 2015, 32, 190–201. [Google Scholar] [CrossRef]
  64. Woolnough, D.A.; Downing, J.A.; Newton, T.J. Fish Movement and Habitat Use Depends on Water Body Size and Shape. Ecol. Freshw. Fish 2009, 18, 83–91. [Google Scholar] [CrossRef]
  65. Hale, R.; Colton, M.A.; Peng, P.; Swearer, S.E. Do Spatial Scale and Life History Affect Fish–Habitat Relationships? J. Anim. Ecol. 2019, 88, 439–449. [Google Scholar] [CrossRef]
  66. Mittelbach, G.G.; Ballew, N.G.; Kjelvik, M.K. Fish Behavioral Types and Their Ecological Consequences. Can. J. Fish. Aquat. Sci. 2014, 71, 927–944. [Google Scholar] [CrossRef]
  67. Magilligan, F.J.; Graber, B.E.; Nislow, K.H.; Chipman, J.W.; Sneddon, C.S.; Fox, C.A. River Restoration by Dam Removal: Enhancing Connectivity at Watershed Scales. Elem. Sci. Anth. 2016, 4, 000108. [Google Scholar] [CrossRef]
  68. Wenwu, M.; Fujiang, H.; Wei, W. Situation of Water Environment and Evaluation of Water Quality in Chishui River Basin. Acta Agric. Jiangxi 2021, 33, 87–91. [Google Scholar]
  69. Shao, X.; Fang, Y.; Jawitz, J.W.; Yan, J.; Cui, B. River Network Connectivity and Fish Diversity. Sci. Total Environ. 2019, 689, 21–30. [Google Scholar] [CrossRef] [PubMed]
  70. Biswas, S.R.; Mallik, A.U. Species Diversity and Functional Diversity Relationship Varies with Disturbance Intensity. Ecosphere 2011, 2, 1–10. [Google Scholar] [CrossRef]
  71. Hooper, D.U.; Solan, M.; Symstad, A.; Áz, S.D.; Gessner, M.O.; Buchmann, N.; Degrange, V.; Grime, P.; Hulot, F.; Mermillod-Blondin, F.; et al. Species Diversity, Functional Diversity, and Ecosystem Functioning. In Biodiversity and Ecosystem Functioning; Loreau, M., Naeem, S., Lnchausti, P., Eds.; Oxford University Press: Oxford, UK, 2002; pp. 195–208. [Google Scholar]
  72. Bowden, T.J. Modulation of the Immune System of Fish by Their Environment. Fish Shellfish Immunol. 2008, 25, 373–383. [Google Scholar] [CrossRef]
  73. Mamun, M.; An, K.-G. Key Factors Determining Water Quality, Fish Community Dynamics, and the Ecological Health in an Asian Temperate Lotic System. Ecol. Inform. 2022, 72, 101890. [Google Scholar] [CrossRef]
Figure 1. Location map of the connectivity restoration section in Yanjing River. Situated on the right bank of the Chishui River Basin, two river barrier connectivity restoration projects were carried out within the terminal 9 km reach. Project 1: culvert modification; Project 2: full removal; PRC: pre-connectivity project implementation; POC: post-connectivity project implementation.
Fishes 10 00321 g001
Figure 2. Variation characteristics of aquatic environmental factors during three restoration periods (before and after the connectivity restoration projects). PRC (orange): pre-connectivity; POCⅠ (yellow): half a year post-connectivity; POCⅡ (green): one year post-connectivity; black squares: mean values; white diamonds: sampling data points; black horizontal lines: medians; black spheres: outliers; “ns”: p > 0.05 (non-significant); “*”: p < 0.05 (statistically significant); “**”: p < 0.01 (highly significant).
Fishes 10 00321 g002
Figure 3. Variation characteristics of aquatic environmental factors across different sections during three restoration periods. Orange: pre-connectivity; yellow: half a year post-connectivity; green: one year post-connectivity; US: project’s upstream section; IS: inter-project section; DS: project’s downstream section; statistical significance (p < 0.05): any two groups without the same letter indicate significant differences.
Fishes 10 00321 g003
Figure 4. Principal component analysis (PCA) of the impacts of connectivity restoration projects on aquatic habitat and heterogeneity changes among sections. PRC (orange): pre-connectivity; POCⅠ (yellow): half a year post-connectivity; POCⅡ (green): one year post-connectivity; black triangle (US): project’s upstream section; black square (IS): inter-project section; black circle (DS): project’s downstream section; red arrow (HDC): hydrochemical factors; purple arrow (HDL): hydrological factors.
Fishes 10 00321 g004
Figure 5. Variation characteristics of fish species diversity during three restoration periods (before and after the connectivity restoration projects). PRC (orange): pre-connectivity; POCⅠ (yellow): half a year post-connectivity; POCⅡ (green): one year post-connectivity; black squares: mean values; white diamonds: sampling data points; black horizontal lines: medians; black spheres: outliers; “ns”: p > 0.05 (non-significant); “*”: p < 0.05 (statistically significant); “**”: p < 0.01 (highly significant);.
Fishes 10 00321 g005
Figure 6. Variation characteristics of fish species diversity across different sections during three periods. Orange: pre-connectivity; yellow: half a year post-connectivity; green: one year post-connectivity; US: project’s upstream section; IS: inter-project section; DS: project’s downstream section; statistical significance (p < 0.05): any two groups without the same letter indicate significant differences.
Fishes 10 00321 g006
Figure 7. Shows the constrained sequential clustering of fish species diversity during three restoration periods. Orange: pre-connectivity; yellow: half a year post-connectivity; green: one year post-connectivity; US: project’s upstream section; IS: inter-project section; DS: project’s downstream section; 1#~9#: sampling points.
Fishes 10 00321 g007
Figure 8. Variation characteristics of fish functional diversity during three restoration periods (before and after the connectivity restoration projects). PRC (orange): pre-connectivity; POCⅠ (yellow): half a year post-connectivity; POCⅡ (green): one year post-connectivity; black squares: mean values; white diamonds: sampling data points; black horizontal lines: medians; black spheres: outliers; “ns”: p > 0.05 (non-significant); “*”: p < 0.05 (statistically significant); “**”: p < 0.01 (highly significant); “***”: p < 0.001 (extremely significant).
Fishes 10 00321 g008
Figure 9. Variation characteristics of functional diversity across different sections during three periods. Orange: pre-connectivity; yellow: half a year post-connectivity; green: one year post-connectivity; US: project’s upstream section; IS: inter-project section; DS: project’s downstream section; statistical significance (p < 0.05): any two groups without the same letter indicate significant differences.
Fishes 10 00321 g009
Figure 10. Shows the constrained sequential clustering of fish functional diversity during three restoration periods. Orange: pre-connectivity; yellow: half a year post-connectivity; green: one year post-connectivity; US: project’s upstream section; IS: inter-project section; DS: project’s downstream section; 1#~9#: sampling points.
Fishes 10 00321 g010
Figure 11. Mantel analysis of correlations between aquatic habitat and fish diversity. Green lines indicate extremely significant differences (p < 0.01); yellow lines indicate statistically significant differences (p < 0.05); gray lines indicate no statistical significance (p > 0.05); line thickness represents the strength of correlation (thicker lines = stronger correlation), solid lines denote positive correlations, and dashed lines denote negative correlations; the color bar represents the strength of correlations among fish diversity indices.
Fishes 10 00321 g011
Figure 12. Structural equation model (SEM) constructed for hydrological factors, hydrochemical factors, fish species diversity, and fish functional diversity to investigate the intrinsic relationships between aquatic habitat and fish diversity. Values on lines represent standardized path coefficients; line thickness indicates the magnitude of correlation (thicker lines = stronger correlation), solid lines signify positive correlations, and dashed lines signify negative correlations; “*”: p < 0.05 (statistically significant); “**”: p < 0.01 (highly significant); “***”: p < 0.001 (extremely significant).
Fishes 10 00321 g012
Disclaimer/Publisher’s Note: The statements, opinions and data contained in all publications are solely those of the individual author(s) and contributor(s) and not of MDPI and/or the editor(s). MDPI and/or the editor(s) disclaim responsibility for any injury to people or property resulting from any ideas, methods, instructions or products referred to in the content.

