Article

Comparative Analyses of IGF-Induced Liver Transcriptomes Reveal Genes and Signaling Pathways Associated with Ovarian Growth and Development in Golden Pompano (Trachinotus ovatus)

by
Yan Wang
1,2,†,
Charles Brighton Ndandala
1,2,†,
Muhammad Fachri
1,
Vicent Michael Shija
1,
Pengfei Li
3,* and
Huapu Chen
1,2,*
1
Guangdong Research Center on Reproductive Control and Breeding Technology of Indigenous Valuable Fish Species, Guangdong Provincial Key Laboratory of Aquatic Animal Disease Control and Healthy Culture, Fisheries College, Guangdong Ocean University, Zhanjiang 524088, China
2
Southern Marine Science and Engineering Guangdong Laboratory (Zhanjiang), Zhanjiang 524025, China
3
Guangxi Key Laboratory of Aquatic Biotechnology and Modern Ecological Aquaculture, Guangxi Academy of Marine Sciences, Guangxi Academy of Sciences, Nanning 530007, China
*
Authors to whom correspondence should be addressed.
These authors contributed equally to this work.
Fishes 2025, 10(7), 315; https://doi.org/10.3390/fishes10070315
Submission received: 10 May 2025 / Revised: 19 June 2025 / Accepted: 25 June 2025 / Published: 2 July 2025
(This article belongs to the Section Genetics and Biotechnology)

Abstract

Recently, China has become a hotspot for farming golden pompano (Trachinotus ovatus), a commercially valuable marine fish. The genetic mechanisms underlying ovarian development, particularly those regulated by insulin-like growth factors (IGFs), remain poorly understood. Existing research on T. ovatus has focused primarily on growth metrics, developmental stages, and immune responses, leaving a critical gap in knowledge regarding the hepatic regulatory pathways activated by IGFs. In this study, differentially expressed genes (DEGs) were detected through RNA sequencing (RNA-Seq) and associated pathways in response to IGF treatment. Comparisons between the IGF1, IGF2, and IGF3 treated groups and the control revealed 113 (46 upregulated, 67 downregulated), 637 (567 upregulated, 70 downregulated), and 587 DEGs (273 upregulated, 314 downregulated), respectively. KEGG enrichment analysis highlighted key pathways that may be linked to ovarian growth and development, including biotin metabolism, biosynthesis of amino acids, drug-cytochrome p450 pathways, MAPK signaling, estrogen signaling pathways, ECM receptor interaction, steroid biosynthesis, and ovarian steroidogenesis. These findings advance our understanding of hepatic metabolic regulation in golden pompano via the IGF system and provide actionable insights for optimizing aquaculture practices and selective breeding programs for this species.
Key Contribution: This study reveals the hepatic molecular pathways through which IGFs influence ovarian development and oocyte maturation in golden pompano through RNA-Seq-based identification of key differentially expressed genes and metabolic pathways. The results provide novel insights into IGF-driven hepatic ovarian crosstalk, offering a foundation for enhancing selective breeding and aquaculture efficiency in this commercially important species.

1. Introduction

Insulin-like growth factors (IGFs) are hormones that have evolved to be highly conserved across all vertebrates [1]. The system includes IGF1 and IGF2 ligands, binding proteins, and high-affinity receptors [2,3]. A third ligand, IGF3, which is primarily found in the somatic cells of the gonads, was discovered in 2008, limited to teleosts [4,5]. IGF1 governs the neuroendocrine growth mechanism and modulates biological activities such as differentiation, survival, growth, and metabolism via autocrine, paracrine, and endocrine pathways [6]. Growth hormone (GH) increases the IGF1 production in the liver because it is the primary driver of its synthesis, and its receptors are found in all tissues [7]. Although IGF1 is delivered from the liver to other tissues via the blood, it can also operate in autocrine and paracrine manners. The presence of IGF1 in the plasma exerts negative feedback on GH secretion by acting on the pituitary and hypothalamus, while somatostatin directly inhibits GH release from the pituitary, implying an evolutionarily conserved neuroendocrine pathway called the somatotropic axis (GH-IGF1) [8]. IGF1 interacts with tyrosine kinase receptors (IGF1R), which are heterodimers of the alpha (α) and beta (β) subunits [8]. Ligand binding causes the downstream of kinases through autophosphorylation, initiating signal cascades involved in numerous biological activities such as glucose metabolism, mitogenesis, and even reproduction.
IGF2 expression has also been observed in several tissues in fish; however, its biological function within this vertebrates group has not been explored. In zebrafish (Danio rerio) four IGF genes (Igf1a, Igf1b, Igf2a, and Igf2b) have been identified and characterized, each encoding a polypeptide with 16 distinct structural and functional characteristics [2]. Authors also found that IGF1a shares orthologous genes with human IGF1, whereas IGF2a and IGF2b are orthologous to human IGF2. IGF1a is known to contribute to muscle growth, promote myoblast proliferation, and enhance protein synthesis in fish [2,9,10]. However, it is unclear what role IGF2a and IGF2b play. The suppression of these genes in zebrafish revealed that the two isoforms serve distinct functions, yet they are both involved in the early phases of embryonic development. The presence of four IGF genes in the zebrafish genome indicates that each gene may carry out distinct and vital biological functions.
A new IGF family member, IGF3, was first discovered in Nile tilapia (Oreochromis niloticus) and zebrafish [11,12]. IGF3 was later discovered in several teleosts, including spotted scat (Scatophagus argus), damselfish (Chrysiptera cyanea), orange-spotted grouper (Epinephelus coioides), common carp (Cyprinus carpio), medaka (Oryzias latipes), and grass carp (Ctenopharyngodon idella) [5,6,13,14,15,16,17,18]. Unlike IGF1 and IGF2, IGF3 is predominantly expressed in the gonadal tissues of teleosts and is essential for reproductive processes, including ovarian development and maturation [4]. Like other IGF family members, IGF3 was shown to have an endocrine growth-regulating role in the liver of the sapphire devil (Chrysiptera cyanea), where its activation elevated many growth-related genes, specifically Igf1, Igf2b, and growth hormone receptors. Although IGF3 can impact liver function in Scatophagus argus, the regulatory role of IGF3 in teleost livers needs to be more largely explored [19].
Transcriptome analysis is a powerful molecular biological method that maps gene activity in tissues under specific conditions [20]. In grass carp, liver studies revealed key growth-related genes (Igf1, ghr, and Igf1r) linked to the mTOR pathway, which controls cell growth and metabolism, highlighting the role of the liver in nutrient processing and energy balance [21,22,23,24]. Comparing the gene and microRNA activity in fast and slow-growing Wuchang bream (Megalobrama amblycephala) livers could uncover growth mechanisms to improve fish farming [25,26]. The liver also supports reproduction: during ovary development, estradiol spikes prompt the liver to produce vitellogenin, a yolk protein vital for embryos, and to store retinol and folate nutrients critical for reproduction [9,27]. Understanding how the liver manages growth, metabolism, and reproduction through gene activity offers insights to boost aquaculture efficiency and reproductive health in fish [20,28].
The golden pompano (Trachinotus ovatus) is a valuable aquaculture species known for its high economic significance, high nutritional content, and is mainly cultured in south China [28]. However, the ovaries of T. ovatus take time to mature, even under standard marine cage farming conditions, which limits its artificial propagation [28,29,30,31]. IGF1 and IGF2 are highly expressed in the liver compared to other tissues, including ovaries, in contrast to IGF3, which is primarily expressed in teleost ovaries during development stages. IGF3 has also been implicated in regulating both ovarian development and maturation [32]. The liver can support ovarian function, and IGF3 can regulate liver function. This study employed a comparative transcriptomic analysis of liver tissues in T. ovatus following IGF stimulation to identify differentially expressed genes and signaling pathways potentially involved in development and reproductive regulation. This study aimed to comprehensively identify the genes involved in fish metabolism in response to IGF stimulation while providing insights that could assist breeding programs.

2. Materials and Methods

2.1. Ethics Statement

This study was carried out with the approval of the Animal Research and Ethics Committees of the Fisheries College of Guangdong Ocean University (Approval number: GDOU-IACUC-2021-A1229), and all possible measures were taken to reduce animal distress.

2.2. Sample Handling and Treatment

Twelve female T. ovatus (body weight 800–1000 g) were purchased from an aquatic product market in Zhanjiang, Guangdong, China, and transported to the experimental facility at Guangdong Ocean University. Upon arrival, all fish were quarantined for 7 days in independent 1 m3 fiberglass tanks supplied with continuously aerated and UV-sterilized, filtered seawater.
During the quarantine and experimental period, water temperature was maintained at 26 ± 1 °C, salinity at 29 ± 2‰, pH at 7.8–8.2, and dissolved oxygen levels above 6 mg/L. The fish were fed a commercial marine fish diet (Guangdong Yuehai Feed Group Co., Ltd., Zhanjiang, Guangdong, China) twice daily to apparent satiation. Uneaten feed and waste were removed daily, and one-third of the water was renewed every 2 days to maintain water quality.
The health condition of the fish was assessed by external observation (appearance, behavior, and skin lesions), and a subset of individuals was examined using gill and liver histology to exclude any signs of infection or abnormality. Only healthy individuals were selected for further experiments.
Prior to dissection, the fish were anesthetized with tricaine methanesulfonate (MS-22; 100 g mg/L). First, recombinant IGF1, IGF2, and IGF3 proteins were produced in Escherichia coli using an established protocol [33]. In brief, the coding sequence of T. ovatus IGF1 was inserted into a His-SUMO-tagged pETSUMO vector (Wuhan GeneCreate Biological Engineering Co., Ltd., Wuhan, China) while IGF2 and IGF3 were cloned into GST-tagged pGEXT-4T1 vectors (LMAIBio, Shanghai, China). The constructs were transformed into E. coli Rosetta2 (DE3) and cultured into antibiotic-supplemented Luria–Bertani (LB) medium. To induce protein expression, 1 mM isopropyl β-D-thiogalactoside (IPTG, YEASEN, Shanghai, China) was added, and the culture was incubated at 37 °C for 4–5 h. Cells were lysed by sonication in Tris-HCl buffer (pH 8.0) containing 0.5 M NaCl. Ni-NTA affinity chromatography was used for recombinant protein purification, followed by purity assessment via 12% SDS-PAGE.
For in vitro incubation, fresh liver tissues were excised and sectioned into approximately 100 mg pieces as previously described [33]. Samples were cultured in L-15 medium (Gibco, USA) at 25 °C for 6 h. The treatment group received medium supplemented with recombinant protein at a final concentration of 1 nM IGF1, 5 nM IGF2, or 5 nM IGF3, while the control group received medium without recombinant proteins. Each group consisted of three biological replicates (n = 3). The selected concentrations were based on preliminary dose-dependence experiments, which identified these levels as optimal for stimulating IGF-responsive gene expression. After 6 h of incubation, liver samples were quickly snap-frozen in liquid nitrogen and kept at −80 °C until RNA extraction.

2.3. RNA Sequencing and Transcriptome Analysis

Total RNA from liver tissues was isolated using TRIzol reagent (Invitrogen, Carlsbad, CA, USA) following the manufacturer’s instructions. The concentration, integrity, and purity of RNA were analyzed using Qubit 3.0 fluorometer (Thermo Fisher Scientific, Waltham, MA, USA), an Agilent 2100 (Agilent Technologies, Santa Clara, CA, USA), and standard electrophoresis. High-quality RNA samples were used to construct RNA libraries. Ribosomal RNA (rRNA) was initially depleted using the Ribo-Zero Gold Kit (Epicentre Technologies, Madison, WI, USA), and the remaining RNA was randomly broken into smaller fragments using a fragmentation buffer. The fragmented RNA was used as a template for first strand cDNA synthesis, followed by second-strand cDNA synthesis. The resulting synthesized double-stranded cDNA was subsequently purified using VAHTS DNA Clean Beads (Vazyme, Nanjing, China), then the fragments were end repaired, A-tailed, and ligated to sequencing adapters. The cDNA libraries were amplified via PCR, and after confirming their quality and purity, high-throughput sequencing was carried out using the Illumina NovaSeq X Plus platform at Gene Denovo Biotechnology Co., Ltd. (Guangzhou, China).
Raw sequencing reads containing adapter sequences, low-quality bases (q-value ≤ 20), or over 5% unidentified nucleotides (N) were removed to obtain high-quality clean reads. Using HISAT2 (version 2.2.0) [34], the filtered reads were aligned to the T. ovatus reference genome (10.6084/m9.figshare.7570727.v3) to obtain genome-aligned sequences. Mapping results were subsequently used to assess sequencing quality and library characteristics, including insert size distribution and sequence randomness.

2.4. Screening of Differentially Expressed Genes

Differentially expressed genes encoding mRNA were performed using the DESeq2 package (version 1.46.0) [35] to evaluate significant differences between the IGF1, IGF2, or IGF3 groups compared to the control group. Genes exhibiting a fold-change (FC) of ≥1.5 and a p-value below 0.05 were identified as differentially expressed.

2.5. Functional Enrichment Analysis

Gene annotations were retrieved and aligned using multiple databases, such as Gene Ontology (GO), pathway analysis through the Kyoto Encyclopedia of Genes and Genomes (KEGG), Eukaryotic Orthologous Groups, Clusters of Orthologous Groups, Non-Redundant Protein Sequence, and Swiss-Prot. The aligned data were assembled using the StringTie (v1.3.0) (BioMarker Technologies, Beijing, China) [36]. The fragments per kilobase of transcript per million fragments mapped were used to calculate the mRNA expression levels using Cuffdiff (v2.1.1) [37]. A fold change of ≥1.5 combined with a p-value of < 0.05 was used to define differentially expressed genes. Functional enrichment analysis of identified DEGs was performed by “Cluster-Profiler” R package (version 4.2.2) in the GO and KEGG databases (http://www.geneontology.org/ accessed on 23 February 2025).

2.6. Gene Expression Validation Using Real-Time Quantitative PCR

Using the PrimeScript™ RT Reagent Kit with gDNA Eraser (Perfect Real Time) (TaKaRa, Shiga, Japan), total RNA was reverse-transcribed into cDNA. Real-time quantitative PCR was performed using PerfectStart® Green qPCR SuperMix (TransGen Biotech, Beijing, China). The PCR program consisted of initial denaturation at 95 °C for 2 min, followed by 35 cycles of denaturation at 95 °C for 20 s, annealing at 60 °C for 20 s, and extension at 72 °C for 20 s. Relative expression levels were determined using the 2−∆∆Ct method, with β-actin serving as the internal control. All primers were designed using Primer Premier 6 software (Primer Biosoft International, Palo Alto, CA, USA; https://www.premierbiosoft.com/primerdesign/ accessed on 27 February 2025) and are provided in Table S1.

3. Results

3.1. Overview of Transcriptome Sequencing

The Illumina NovaSeq X Plus by Gene Denovo Biotechnology Co., Ltd. (Guangzhou, China) system was used to sequence the 12 liver samples treated with IGF1, IGF2, or IGF3 protein in vitro. A total of 156,666,358,800 raw reads were obtained from the golden pompano liver transcriptome, including 44,247,732,300 raw reads from the stage control group, 37,654,882,800 raw reads in the IGF1 group, 36,480,839,100 raw reads from the IGF2 group, and 38,282,904,600 raw reads from the IGF3 group. The Q20 and Q30 percentages exceeded 97.75% and 93.88%, respectively. The GC content was approximately 53.4%, indicating the sequencing data were of good quality (Table S2). The clean reads from all 12 liver sequencing libraries were subsequently aligned to the golden pompano reference genome, with an average mapping rate of 89.5%, including 84.9% uniquely mapped reads (Table S3).

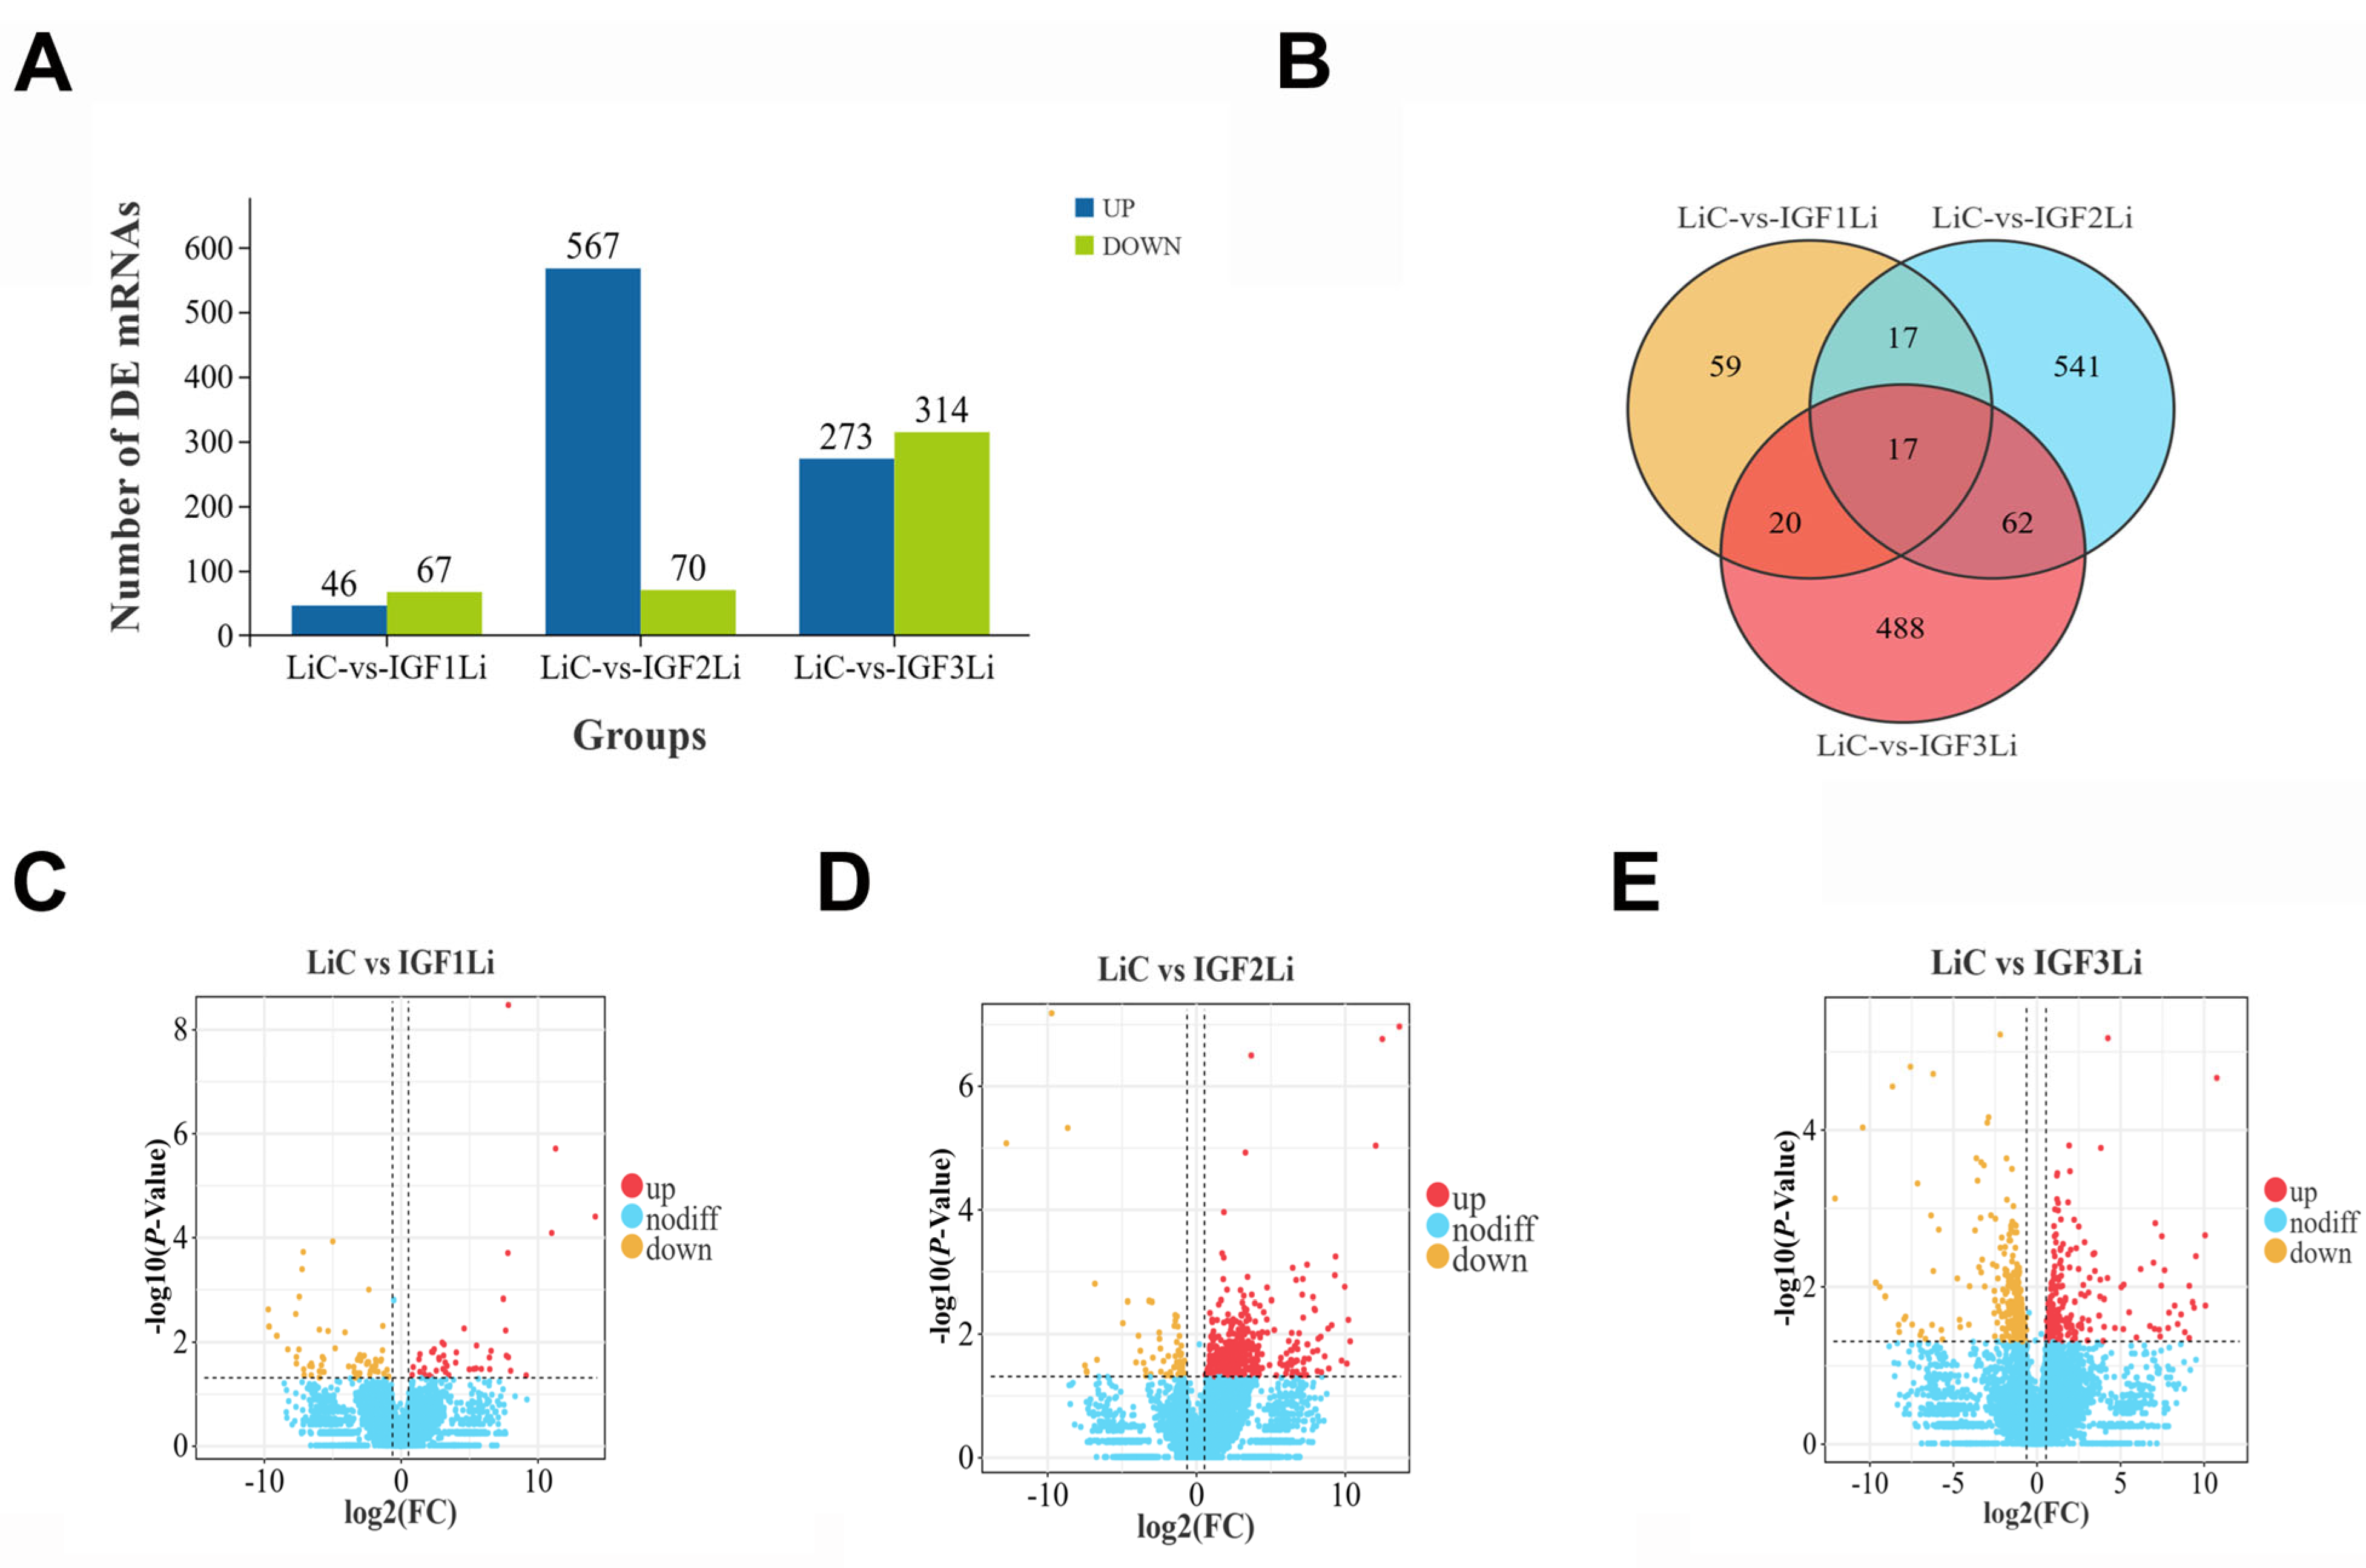
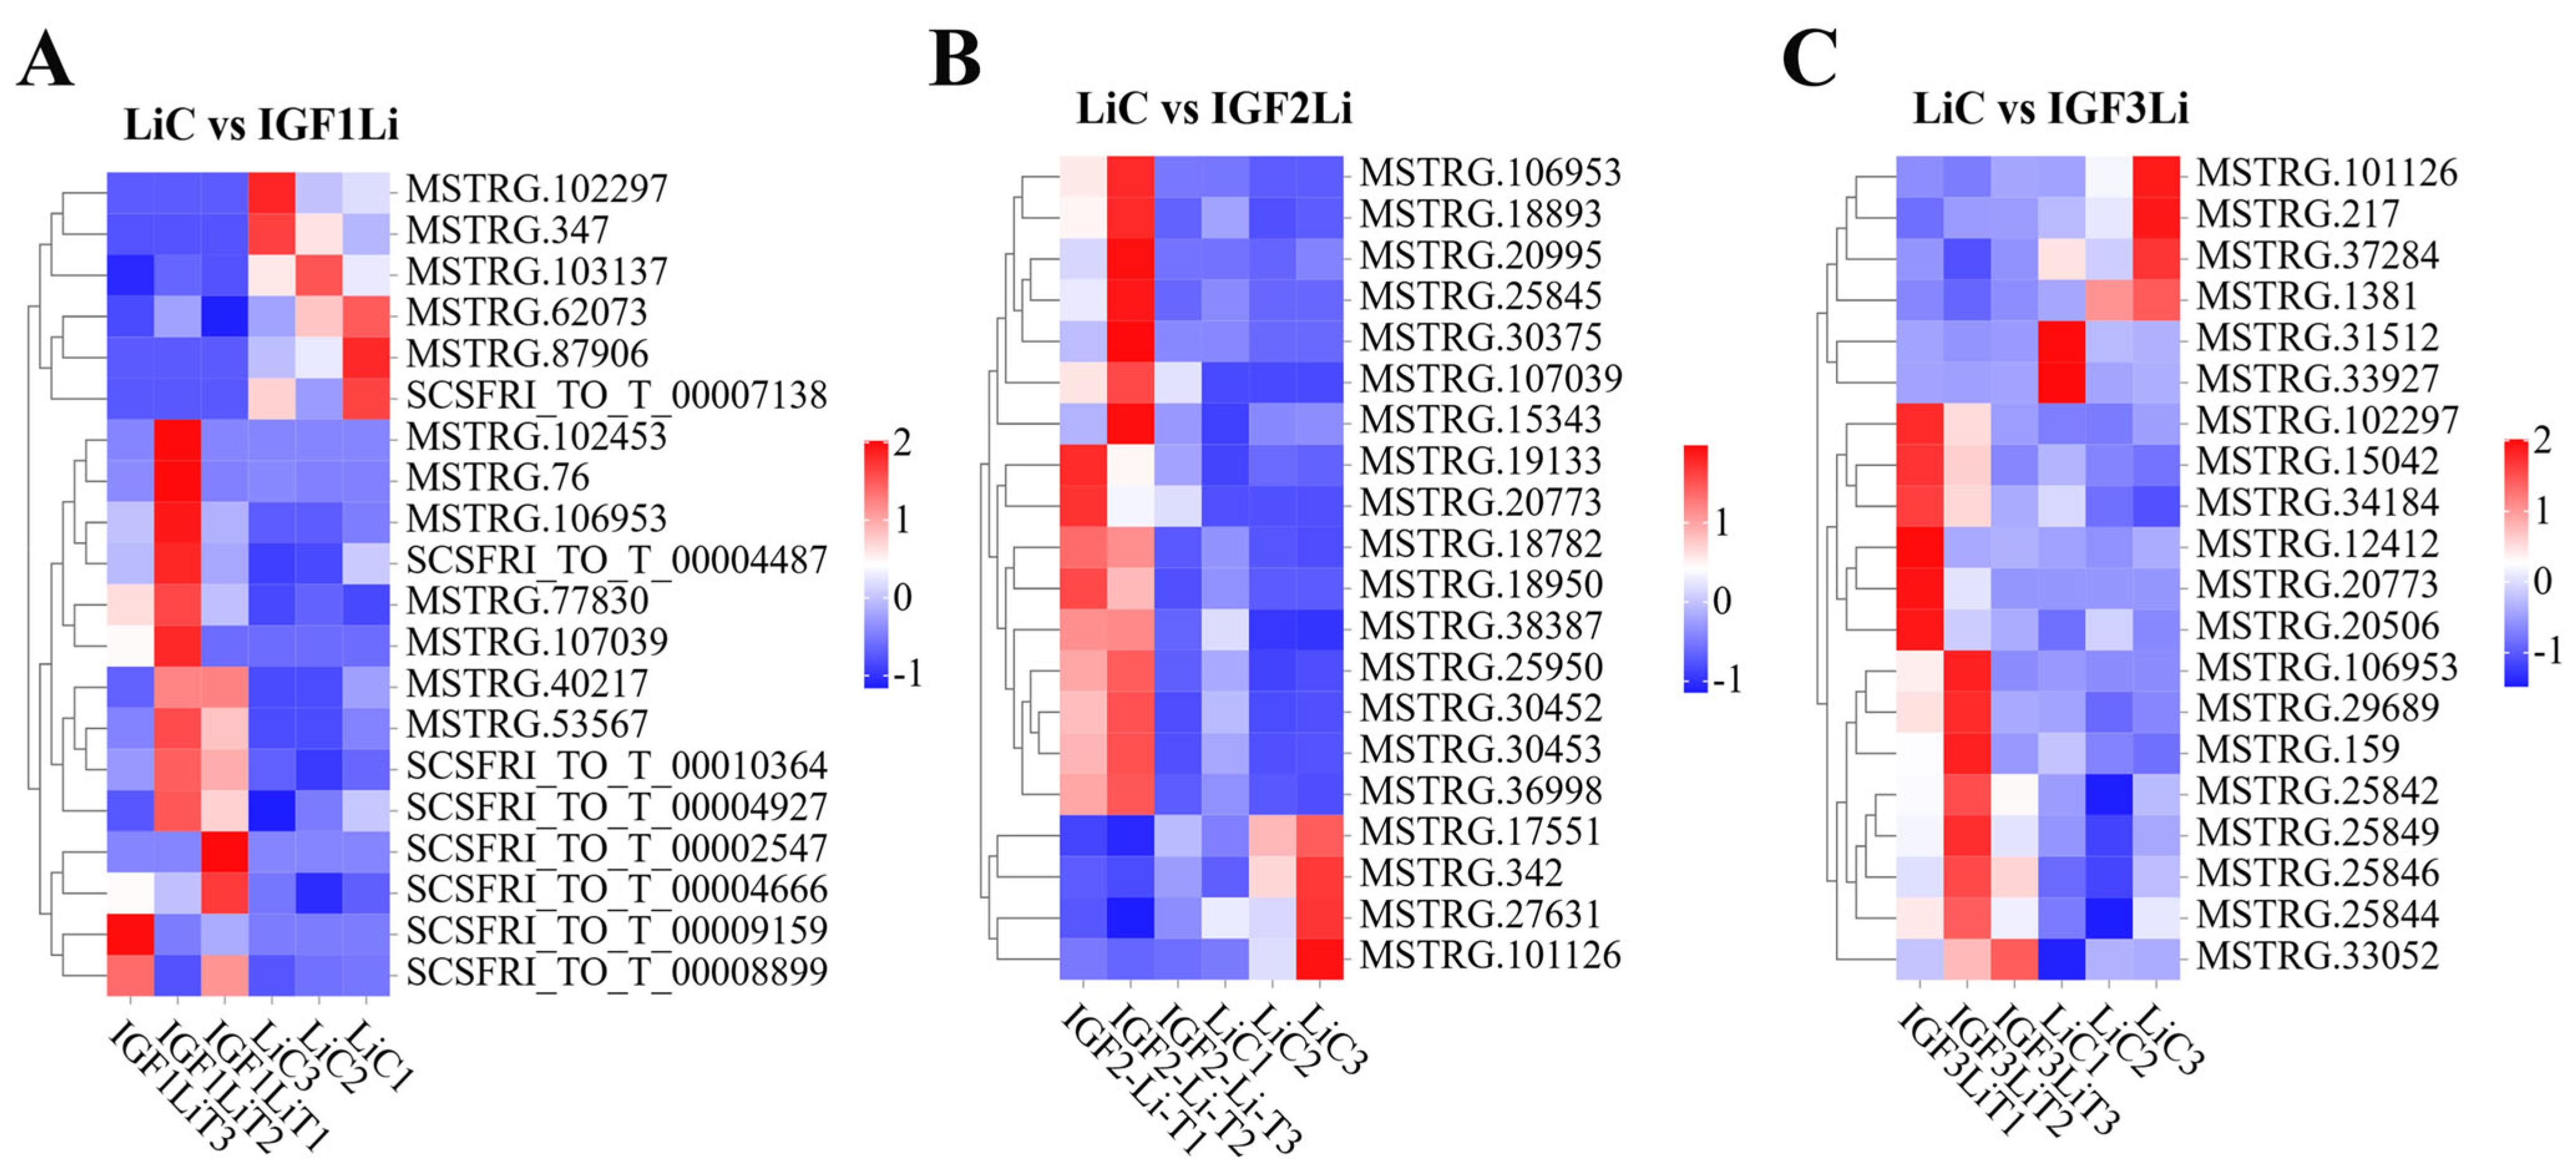
3.2. DEG Profiles Following IGF1, IGF2, and IGF3 Treatment

Differential expression data from different stimulation responses in the golden pompano liver are shown in Figure 1A. The comparative transcriptomic expression profile between control and IGF1 showed 113 DEGs (46 upregulated, 67 downregulated), control and IGF2 showed 637 DEGs (567 upregulated, 70 downregulated), and control and IGF3 showed 587 DEGs (273 upregulated, 314 downregulated). Figure 1B shows the number of shared DEGs in the comparison groups. Volcano plots depicting the comparison between IGF1-, IGF2-, and IGF3-stimulated groups and the control group are shown in Figure 1C, D, and E, respectively. The systematic clustering analysis of the mRNAs showing both up-regulation and down-regulation between the control and treatment groups of IGF1, IGF2, and IGF3 showed significant variation in heat maps, as shown in Figure 2A, B, and C, respectively.

3.3. DEGs Associated with Metabolism and Energy Storage

Some key nutrient metabolism and energy storage-related DEGs determined by liver RNA-seq analysis are shown in Supplementary Table S4. Ldlr, fabp6, slc7a2, mat2a, and nt5e were upregulated following IGF1 treatment. Following IGF2 treatment, acsl1, atp4b, atp5f1e, pyy, fbxo2, and elovl4 were identified. In addition, cyp1a1, atp5po, gpd1, fab10a, fabp6, eno3, and acy1a were identified following IGF3 treatment. These results suggest that IGFs particularly elicit nutrient processing in biosynthetic pathways (proteins, lipids, nucleic acids) for growth and repair. In addition, they promote anabolic processes such as glucose uptake and lipid synthesis to store energy.

3.4. DEGs Associated with Growth and Development Following IGF Induction

The liver RNA-seq analysis identified some key DEGs related to cell differentiation, growth, and development, as shown in Supplementary Table S4. In response to IGF1 stimulation, fgf12, acta1a, mmp11, mmp15, adcy8, and foxb1 were identified. Tc1a, map6, Igfbp1, myo18a, and fgf18 were identified in control versus IGF2 stimulation. In the control versus IGF3 treatment groups, Igf2bp2, Igfbp4, eno3, ccn2, and ppp1r14b were identified. Through these genes, therefore IGFs drive proliferation, ECM remodeling, and cell cycle progression.

3.5. DEGs Associated with Steroid Biosynthesis Following IGF Stimulation

Key steroid biosynthesis-related DEGs were determined by liver RNA-seq analysis, as shown in Table S1. IGF1 stimulation resulted in ncoa2 and adcy8. In the control versus IGF2 treatment group, tm7sf2, ebp, sqle, hsd17b7, nsdhl, and fdft1 were identified. Moreover, the steroid biosynthesis genes identified after IGF3 stimulation are adcy8 and hsd17b14. These findings suggest that IGFs indirectly influence reproductive hormone synthesis in the liver, a key site for steroid metabolism.

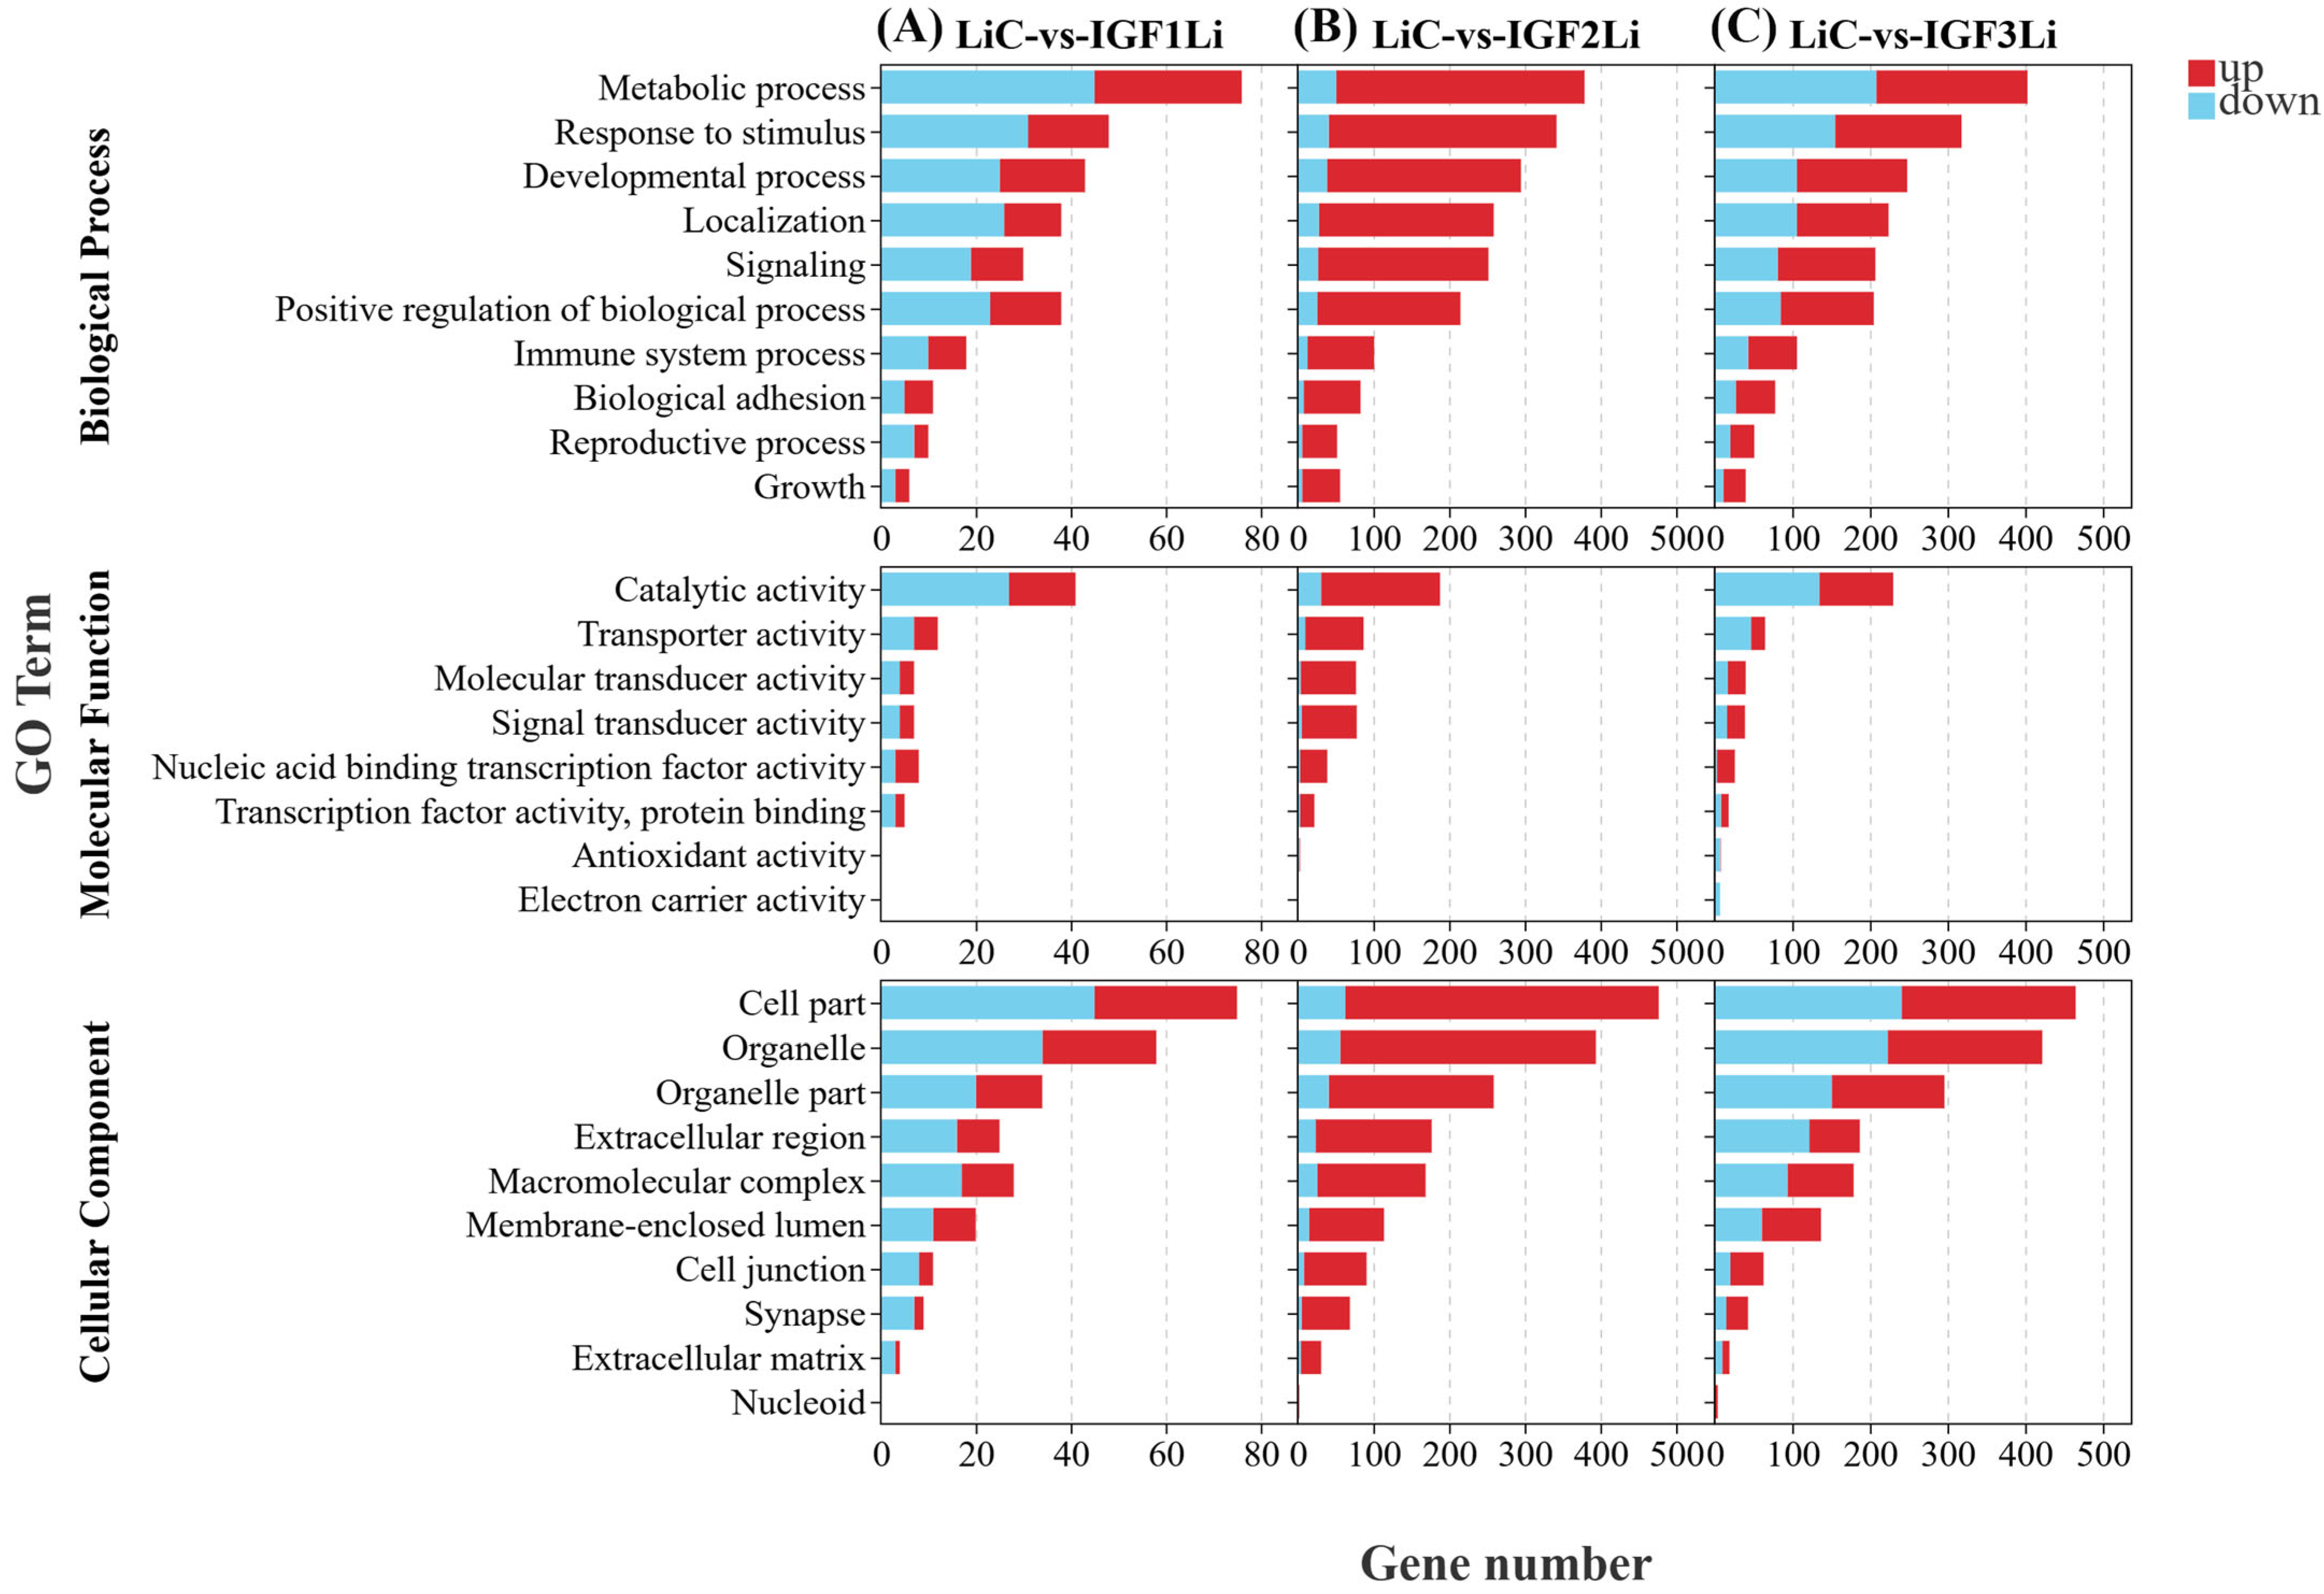
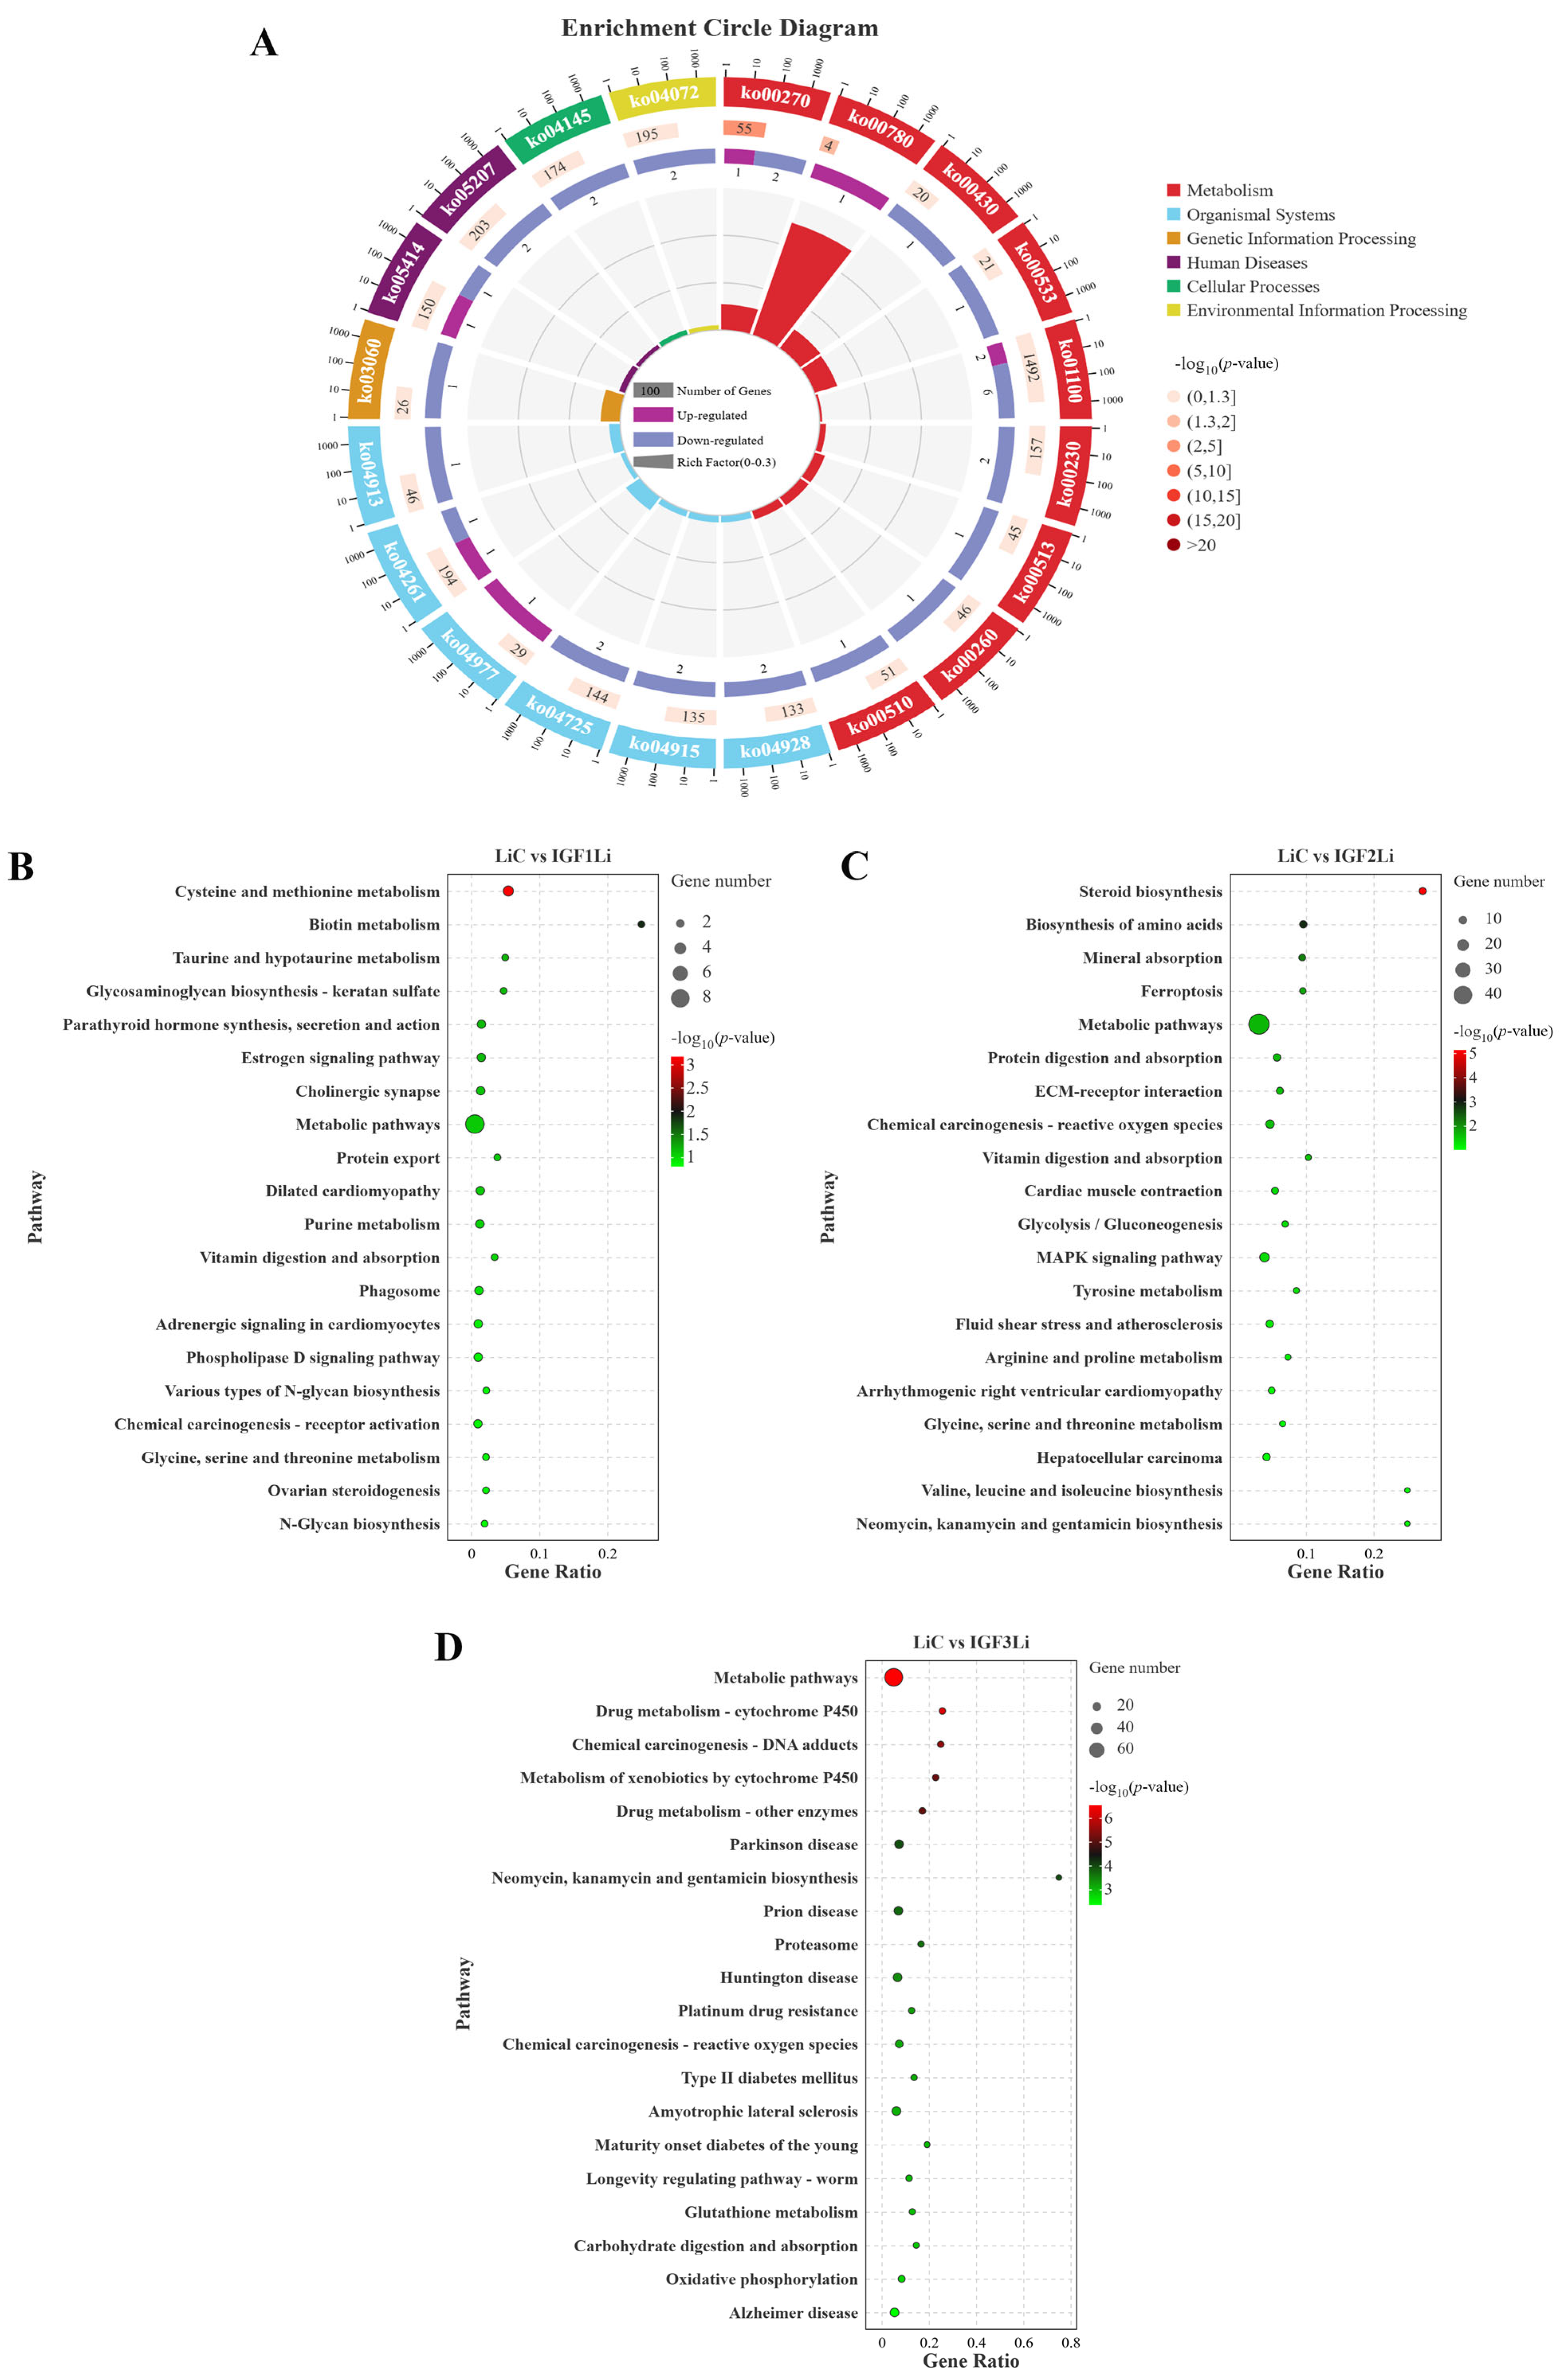
3.6. Functional Annotation and Pathway Analysis of DEGs

To identify the key functional categories, GO enrichment analysis was performed on DE mRNAs resulting from comparisons between the control and IGF1, IGF2, or IGF3 groups. The results of overlapping GO terms among all three comparison groups are presented in an enrichment circle diagram (Figure 3). In addition, we highlight several enriched terms in three main functional categories: biological process, cellular component, and molecular function. The enrichment of the GO category terms among the three comparison groups is presented in Figure 3 and Table S5. Among biological process, metabolic process, reproductive process, developmental process, and biological adhesion were the highly enriched GO terms. Within molecular function, catalytic activity, transporter activity, and molecular transducer activity were highly enriched GO terms. In the cellular component category, cell part, extracellular region, organelle, and extracellular matrix were highly enriched GO terms overlapping among all the comparison groups.
Functional pathways associated with the target genes of DE mRNAs were identified through KEGG pathway enrichment analysis (Table S6). The results revealed that KEGG pathways enriched by target genes of DE mRNAs are categorized into five categories for the control versus IGF1 metabolism (e.g., ovarian steroidogenesis, vitamin digestion and absorption, metabolic pathways, cysteine and methionine metabolism, various types of N-glycan biosynthesis), organismal system (e.g., parathyroid hormone synthesis, secretion and action), genetic information processing (e.g., protein export), human diseases (e.g., dilated cardiomyopathy), cellular processes, and environmental information processing (e.g., estrogen signaling pathway, phospholipase D signaling pathway). For the control versus IGF2 group, the enriched pathways were metabolism (e.g., metabolic pathways, steroid biosynthesis, biosynthesis of amino acids, vitamin digestion and absorption, glycolysis/gluconeogenesis), organismal system (e.g., mineral absorption, protein digestion and absorption), human diseases (e.g., hepatocellular carcinoma, chemical carcinogenesis reactive oxygen species), cellular processes, and environmental information processing (e.g., ECM receptor interaction, MAPK signaling pathway). For the control versus IGF3 group, the following pathways were enriched: metabolism (e.g., metabolic pathways, drug metabolism, glutathione metabolism, carbohydrate digestion and absorption), organismal system (e.g., longevity regulating pathway-worm), genetic information processing (e.g., proteasome), human diseases (e.g., Type II diabetes mellitus, Alzheimer disease, maturity-onset diabetes of the young, prion disease), cellular processes, and environmental information processing (e.g., oxidative phosphorylation), as shown in Figure 4.

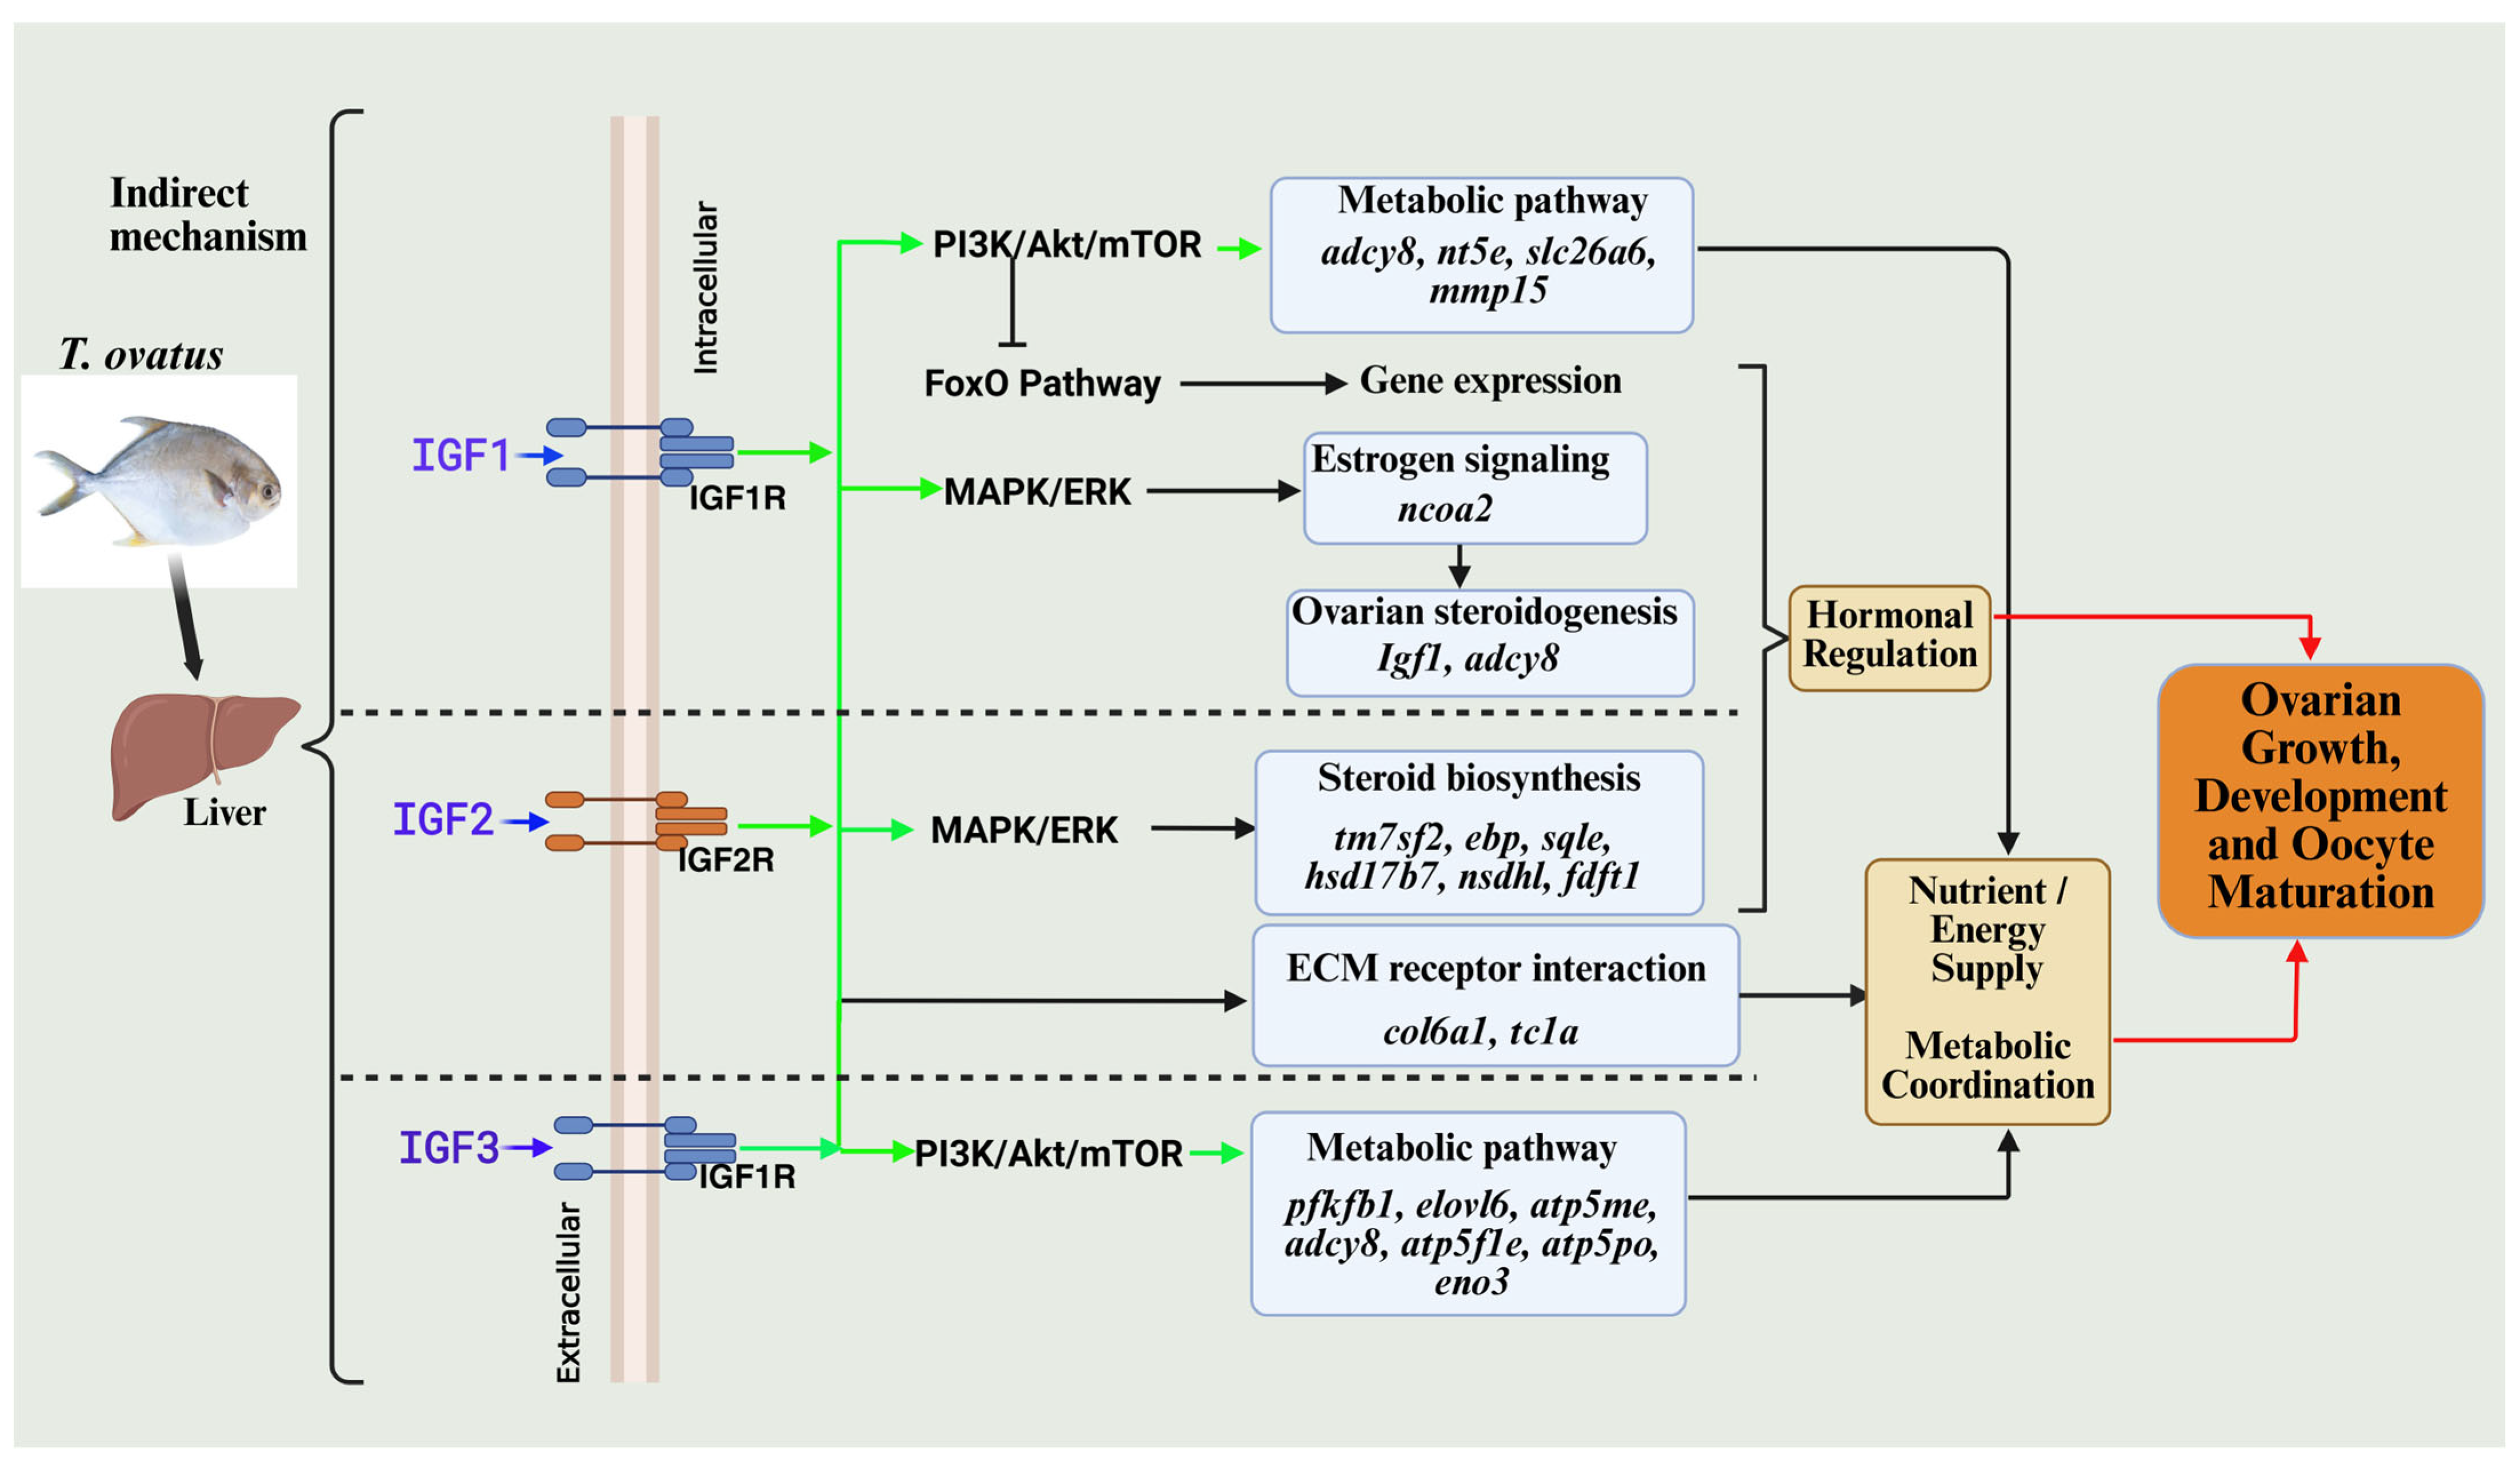
3.7. Liver-Derived Gene Expression Changes Induced by IGFs and Their Hypothesized Impact on Ovarian Function

While the current study relied on liver transcriptomic profiling following in vitro stimulation with recombinant IGF1, IGF2, and IGF3, it provides important insights regarding potential mechanisms by which hepatic IGF signaling may indirectly influence ovarian function in T. ovatus, as suggested by differentially expressed genes and their involvement in signaling pathways (Figure 5). IGF1 activates the PI3K/Akt/mTOR metabolic pathways (via adcy8, nt5e, slc26a6, and mmp15), enhancing systemic metabolism to indirectly support ovarian follicular growth and energy availability while inhibiting the FoxO pathway. It also triggers the MAPK/ERK cascade, modulating estrogen signaling through ncoa2 upregulation to regulate ovarian steroidogenesis via igf1 and adcy8. IGF2 activates both PI3K/Akt/mTOR and MAPK/ERK cascades, which may trigger steroid biosynthesis genes (tm7sf2, ebp, sqle, hsd17b7, nsdhl, and fdft1) critical for hormone production, whereas its ECM receptor interactions via col6a1 and tcla facilitate nutrient and energy supply, which may promote follicular maturation. IGF3, acting through IGF1R, activates PI3K/Akt/mTOR to coordinate metabolic pathways, facilitating metabolic coordination and structural support for ovarian tissue via metabolic genes (pfkfb1, elovl6, atp5me, adcy8, atp5f1e, atp5po, and eno3). Collectively, hepatic IGF simulation is suggested to synergize metabolic and steroidogenic processes that may enhance ovarian development and oocyte maturation, functioning as an endocrine mediator of ovarian regulation. The proposed mechanistic links between hepatic gene expression and ovarian development remain hypothetical and require further validation through in vivo studies.

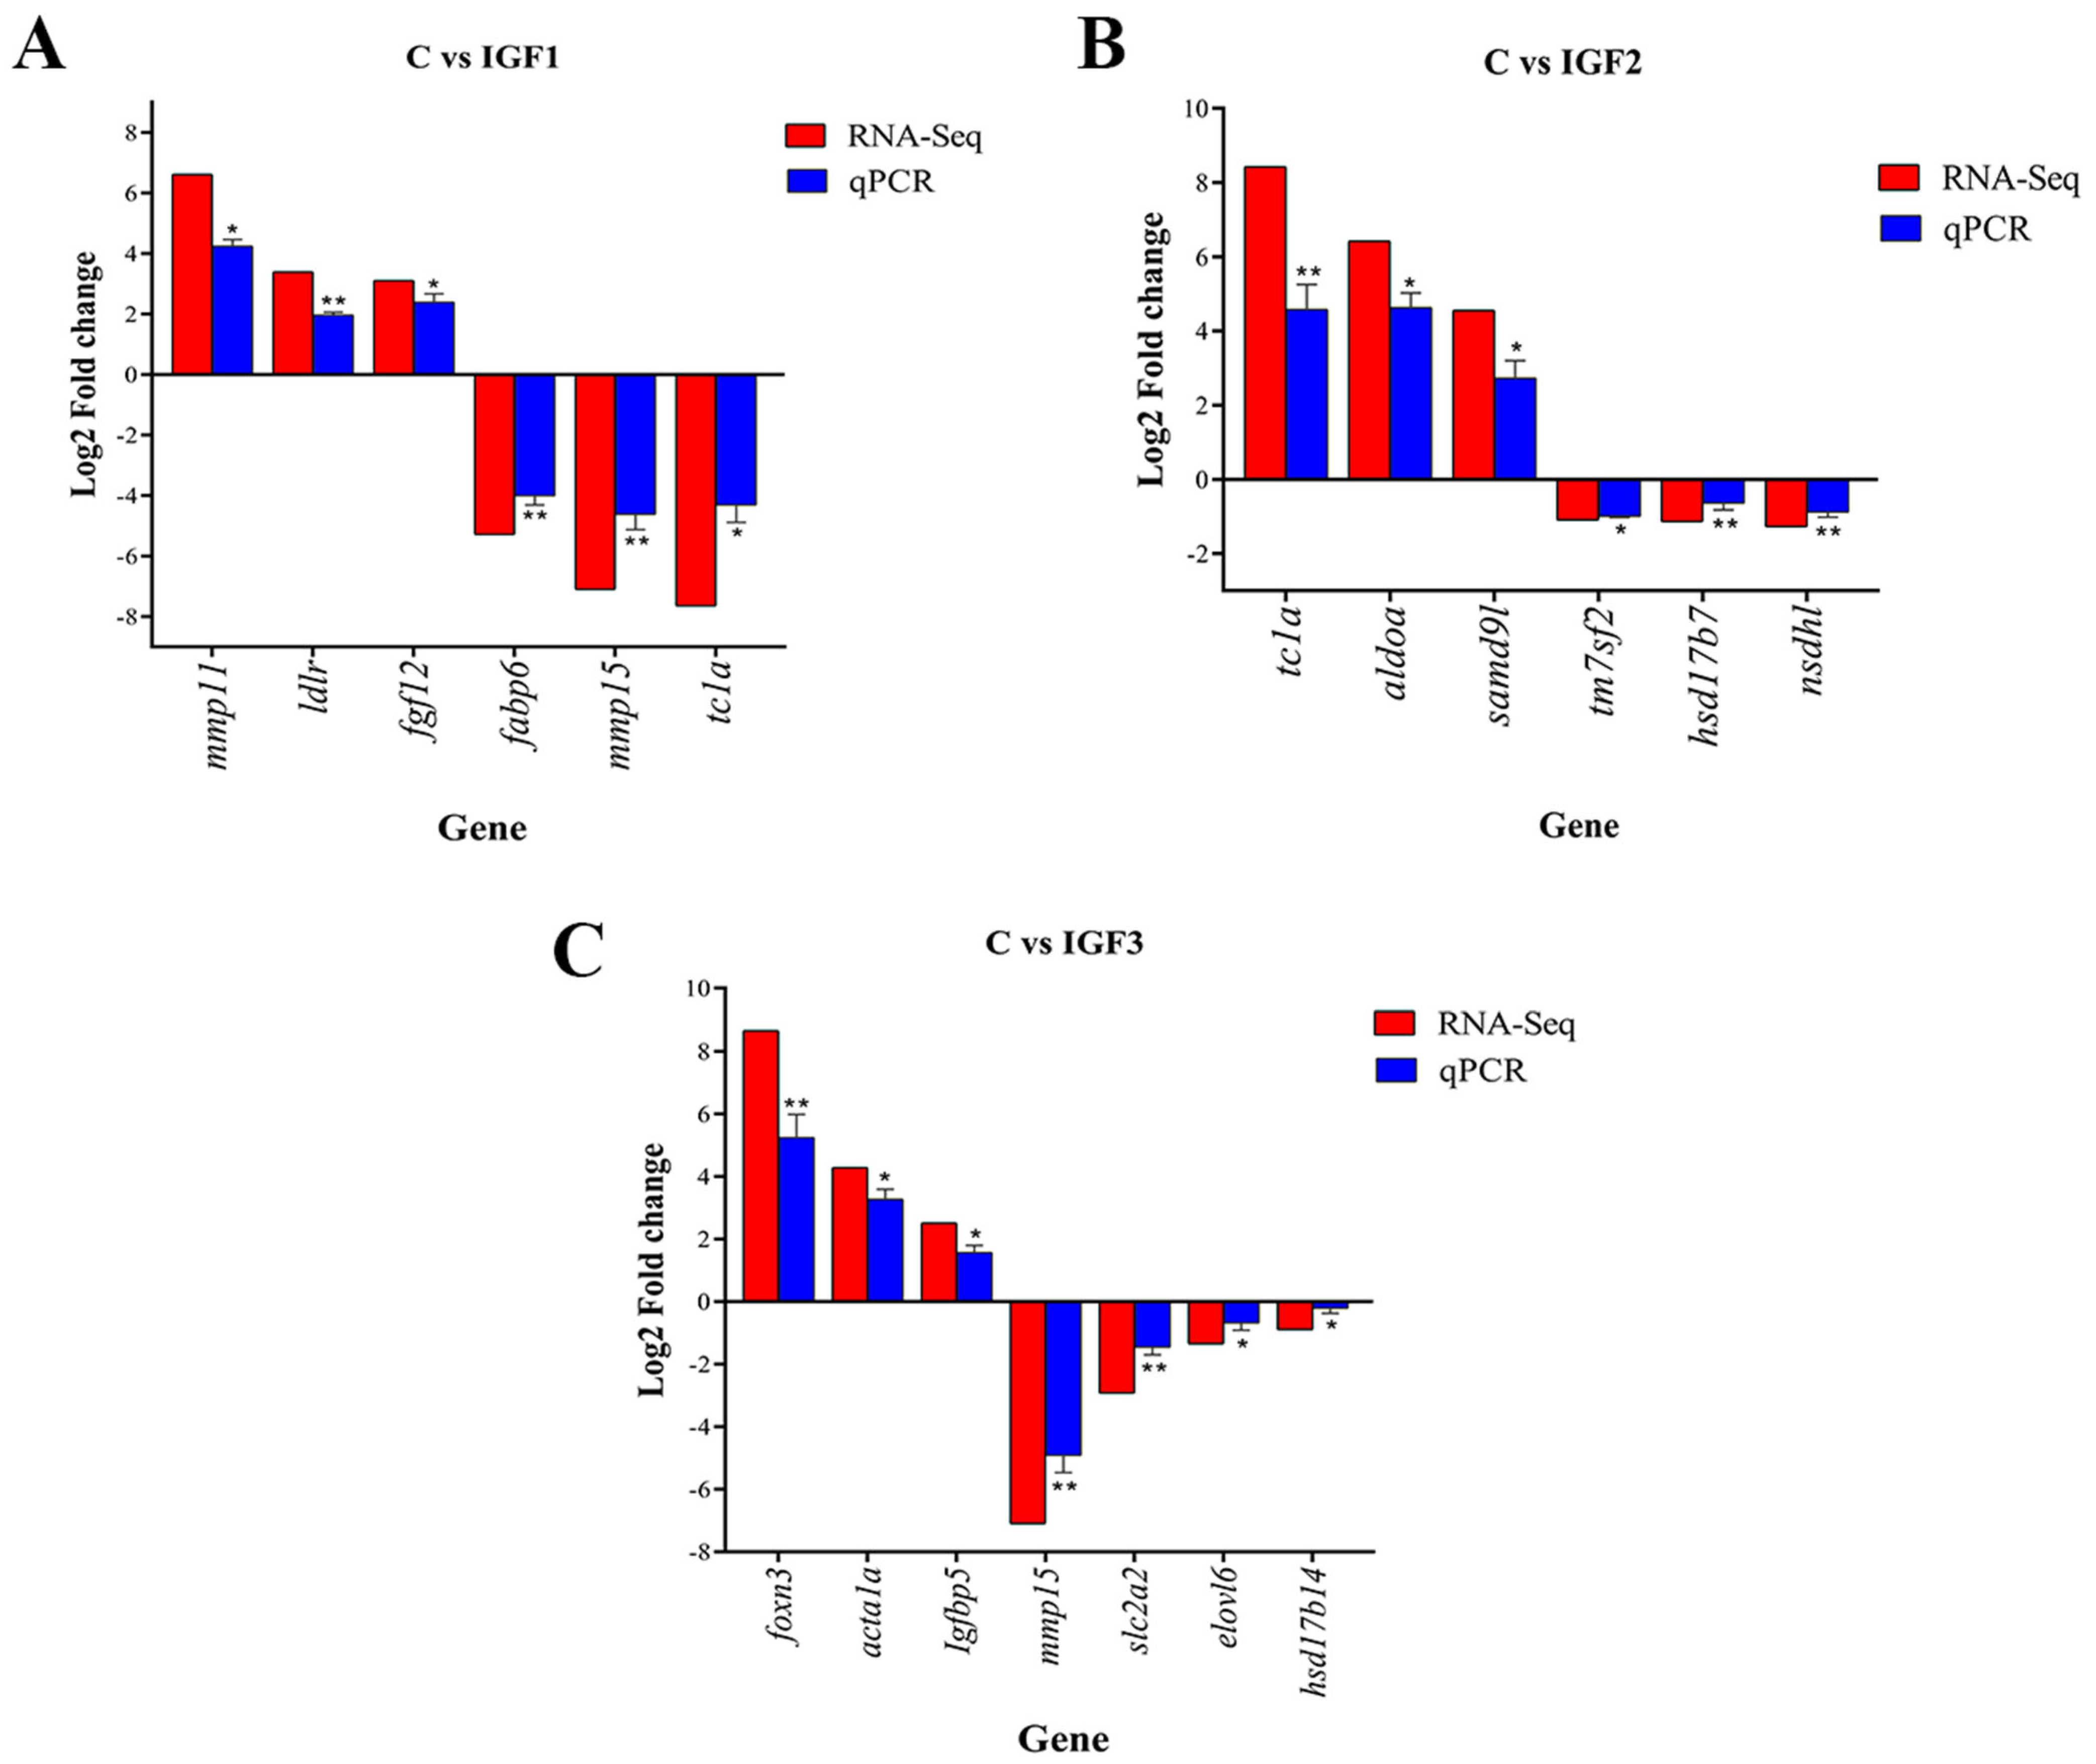
3.8. Validation of DE mRNAs by RT-qPCR

To confirm the reliability of the RNA-seq results, 19 DEGs were randomly chosen from the three comparison groups (C vs. IGF1, C vs. IGF2, and C vs. IGF3) and analyzed using quantitative real-time PCR (qRT-PCR). The expression patterns observed across the groups were consistent with the RNA-seq data, supporting the validity of the transcriptomic findings (Figure 6).

4. Discussion

The liver plays a central role in regulating nutrient metabolism, energy homeostasis, growth, and reproduction in fish, serving as a hub for the synthesis, breakdown, storage, and redistribution of proteins, lipids, and carbohydrates [38,39,40]. Research has shown that liver functions and related pathways influence growth and development. In addition, metabolic functions of the liver are closely linked to reproductive physiology, as demonstrated in species such as the Euphrates spiny eel (Mastacembelus mastacembelus) and Atlantic salmon (Salmo salar), where sexual maturation leads to noticeable changes in liver activity, including alterations in lipid composition, phospholipid metabolism, and energy storage [41]. These shifts reflect the role of the liver in supporting the energetic and physiological demands of reproduction [41,42]. However, the effect of IGF-induced liver and molecular mechanisms underlying its response to varying nutrient processing, energy storage, growth, and reproductive processes remain poorly understood. To address this, our study employed RNA-seq technology to identify genes and pathways involved in metabolism, energy storage, growth, and reproductive processes in golden pompano following IGF (IGF1, IGF2, or IGF3) protein stimulation in the liver in vitro. Stimulation of the liver with IGF1, IGF2, and IGF3 resulted in 113 (46 upregulated, 67 downregulated), 637 (567 upregulated, 70 downregulated), and 587 DEGs (273 upregulated, 314 downregulated), respectively (Figure 1). These regulatory mechanisms underscore the liver’s pivotal role in integrating metabolic and reproductive functions via the IGF system.

4.1. IGFs Regulate Nutrient Metabolism and Energy Storage Through the Liver

Metabolism encompasses the complex network of physiological and biochemical processes essential for maintaining life. Different types of metabolism have been discussed, including lipid metabolism, which involves triglycerides, cholesterol, glycerophospholipids, sphingolipids, and fatty acids. Carbohydrate metabolism provides energy for fish growth, movement, reproduction, and thermoregulation. In addition, amino acid metabolism involves signaling molecules with various biological functions, including protein synthesis, energy metabolism, and hormone metabolism [39,40,43,44,45,46,47,48,49]. In this study, some key genes related to lipid metabolism, carbohydrate metabolism, nutrient transport, and energy storage following IGF1, IGF2, or IGF3 stimulation were identified as ldlr, fabp6, slc7a2, mat2a, nt5e, atp5f1e, and Pyy, which belong to different metabolic pathways including MAPK and phospholipase D signaling pathways, vitamin digestion and absorption, biosynthesis of amino acids, ECM receptor interaction, glycolysis/gluconeogenesis, carbohydrate digestion, and oxidative phosphorylation. The regulation of these metabolic pathways by IGFs likely contributes to ovarian growth and development by ensuring the availability of essential nutrients, energy, and molecular signals necessary for follicle maturation, steroidogenesis, and cellular proliferation within the ovary.
In spotted scat (S. argus), IGF3 upregulated SLC family genes such as slc7a2, which encodes a fructose transporter responsible for fructose uptake and glucose and amino acid transport responsible for protein synthesis, indicating an improvement in carbohydrate absorption [19]. In addition, the level of cyp1a1, which is related to lipid synthesis, was upregulated by IGF3 stimulation in S. argus, similarly to our study [19]. In Atlantic salmon and rainbow trout (Oncorhynchus mykiss), the low-density lipoprotein receptor (ldlr) gene has been reported to play an essential role in cholesterol uptake in the liver, thereby influencing lipid metabolism [22,50]. In addition, dietary changes in fish, such as the inclusion of plant products, can modulate ldlr expression. Studies have shown that dietary highly unsaturated fatty acids (HUFAs) significantly affect fabp6 expression in the liver, indicating its role in lipid metabolism [50]. Nt5e (5’-nucleotidase) plays a role in nucleotide metabolism, which is crucial for energy homeostasis in liver cells [51]. In pejerrey (Odontesthes bonariensis), IGF1 stimulation in the liver upregulated the atp5f1e gene associated with mitochondrial function, supporting energy production [52]. Peptide YY (Pyy) regulates appetite in mammals and fishes [53,54,55]. Several studies have reported that Pyy is affected by fasting in some fishes [53,54,56,57,58]. In this study, Pyy was upregulated following IGF2 stimulation in the liver. Together, all these findings suggest that IGFs may induce the liver to promote nutrient metabolism and energy storage.

4.2. IGFs Affect the Growth and Development of T. ovatus

As discussed previously, the growth of vertebrates, including fishes, is primarily regulated by the GH/IGF axis; its receptors and binding proteins play a crucial role in cell proliferation, growth, and reproduction [33,59,60]. GH stimulates hepatic IGF levels, which are positively correlated with the growth rate [61,62]. Serum IGF1 levels serve as a growth index in fishes, as demonstrated in different fish species, including spotted scat, medaka, orange-spotted grouper, mud carp, Mozambique tilapia (Oreochromis mossambicus), and Nile tilapia [8]. In the present study, we identified several key growth-associated genes following IGF stimulation. Acta1a, mmp11, mmp15, adcy8, and foxb1 were identified after IGF1 stimulation. Skeletal muscle alpha-actin (acta1a) belongs to the actin family of genes and plays a crucial role in muscle development [63,64,65]. In the present study, acta1a was upregulated in the liver after IGF1 stimulation, suggesting that IGF1 stimulates the production of the acta1a gene in the liver to support muscle growth. Similarly, in the East Asian river prawn (Macrobrachium nipponense) [64], the acta1a gene was upregulated in fast-growing males and females, suggesting a potentially conserved role of actin-related genes in growth regulation across diverse aquatic species. Moreover, acta1a has been shown to play a role in muscle development in zebrafish [65]. Two matrix metalloproteinase (mmp) encoding genes (mmp11 and mmp15) expressed after IGF1 stimulation play a significant role in ovarian growth and oocyte maturation [66,67,68,69]. Adenylate cyclase type 8 (adcy8) is a crucial regulator of growth and metabolism in beef cattle [66,70]. This indicates that IGF1 may exert its effects on gonadal development via liver stimulation. Forkhead box protein B1 (foxb1) is a gene that encodes a transcription factor protein involved in various biological processes, including growth and embryonic development [71,72]. Foxb1 expressed at the start of gastrulation in zebrafish, is used as molecular marker to study neurectoderm in mutants affecting the dorsoventral axis [72].
Transcriptome results showed that map6, myo18a, fgf12, and fgf18 were upregulated, whereas Igfbp1 was downregulated after IGF2 stimulation. Microtubule-associated protein 6 (Map6) was upregulated after IGF1 stimulation in the liver. In black carp (Mylopharyngodon piceus), map6 is associated with signal transduction, brain tissue, and neuronal development [64,73]. Myo18a proteins belongs to the myosin subfamily, which includes a motor domain homologous to myosin involved in organismal cell development and differentiation [74]. Stimulation with IGF2 led to the upregulation of myo18a in the liver, suggesting that this gene may be involved in diverse biological functions. Fibroblast growth factors (FGFs) represent growth factors that have recognized by their potential effects on tissue regeneration and repair [46,75]. In black rockfish (Sebastes schlegelii), nine fgf genes were found to play vital roles in promoting myoblast differentiation as well as in muscle development and recovery of juveniles [76]. Additionally, a number of fgf genes showed sex-specific expression profiles in developing gonads. Among them, fgf1 was expressed in Sertoli cells within the testis, where it contributes to germ cell proliferation and differentiation [75,76]. Fgf18 has been reported to be upregulated and to play a role in muscle development and growth in S. schlegelii [76].
Following IGF3 stimulation, Igf2bp2, eno3, and ccn2 were upregulated, whereas igfbp4 and fbx02 were downregulated, indicating that IGF3 may play an important role in the growth of T. ovatus. In hybrid groupers (Epinephelus sp.), it was reported to bind IGFs with higher affinity than IGFR, leading to the degradation of IGFs, thereby prolonging the half-life of IGFs in serum [45,70]. In addition, Igfbp-2a and Igfbp4 are more highly expressed in hybrids than in their parents [45]. Enolase (eno) is a key glycolytic enzyme that catalyzes the hydration of 2-phospho-D-glycerate to phosphoenolpyruvate in the catabolic glycolytic pathway [26,77,78]. Eno3 (β-enolase) is mainly found in skeletal and heart muscle tissues [78]. In this study, stimulation of the liver with IGF3 downregulated eno3. Cellular communication network factor 2 (ccn2), commonly called connective tissue growth factor, is a modular matricellular protein within the CCN family [79]. In this study, ccn2 was upregulated after IGF3 stimulation in the liver in vitro [65]. In adult mice, the reproductive system expresses ccn2, which is implicated in governing uterine cell growth, migration, ECM formation, and adhesion [79].
Overall, these findings suggest that IGFs influence the expression of key genes involved in growth, metabolism, and tissue remodeling in the liver, which in turn may contribute to ovarian development. By modulating pathways related to energy availability, cellular proliferation, and extracellular matrix organization, IGFs appear to create a systematic environment favorable for gonadal maturation and oocyte growth in T. ovatus.

4.3. IGFs Influence Steroid Biosynthesis in the Liver

IGFs indirectly regulate ovarian steroidogenesis, estrogen signaling pathways, and steroid biosynthesis by stimulating differentially expressed hepatic genes. This study identified DEGs that would affect reproductive performance, including ovarian performance and ovarian development following IGF stimulation in the liver. We identified ncoa2 and adcy8 genes involved in ovarian steroidogenesis after IGF1 stimulation. IGF1 enhances liver ncoa2, also known as steroid/nuclear receptor coactivator 2, a transcription coactivator critical for nuclear receptor signaling [80]. It is important to maintain liver function and potentially influence steroid hormone metabolism [81]. The liver contributes to the endocrine environment necessary for ovarian function, and affects steroid hormone levels which are crucial for ovarian steroidogenesis. Adcy8, a protein implicated in steroid hormone synthesis, may influence ovarian function by interacting with liver-derived factors [70]. Following IGF2 stimulation, some DEGs, such as tm7sf2, ebp, sqle, hsd17b7, nsdhl, and fdft1, involved in steroid biosynthesis in the liver were associated with GO terms and KEGG pathways, indicating a potential link to key growth performance indicators [49].
In this study, fdft1 was identified as a potential key gene in steroid biosynthesis, which may be involved in sterol biosynthesis through the catalytic condensation of two farnesyl pyrophosphate molecules into squalene. In turbot (Scophthalmus maximus), sqle was identified as a crucial enzyme in steroid biosynthesis [39]. Tm7sf2 reduces the C14 unsaturated bonds in lanosterol, and hsd17b7 has been reported as a bifunctional protein in steroid hormone metabolism [39,68]. Nsdhl has been reported to decarboxylate the C4 methyl group of cholesterol in turbot [49]. In response to IGF3 liver stimulation, DEGs related to steroid biosynthesis were identified, such as adcy8 and hsd17b14. Similarly to IGF1 stimulation, adcy8 is involved in steroid synthesis and reproduction. Hsd17b4 was reported to be highly expressed in the liver and ovaries and is involved in steroid biosynthesis and gonadal development [82]. This study highlights the evolutionary conservation of steroid biosynthesis pathways and genes in the IGF stimulation groups. This pattern of conservation across diverse fish species parallels observations previously reported in poultry, mammals, and ruminants. Overall, the identified liver-derived steroidogenic genes suggest a potential regulatory role in creating a hormonal environment that could support ovarian growth and development in T. ovatus.

5. Conclusions

In this study, liver transcriptome profiling was conducted to investigate gene expression changes in golden pompano liver tissues following stimulation with recombinant IGF1, IGF2, or IGF3 proteins. A total of 1337 DEGs were identified across the three treatment groups. These DEGs were involved in various biological processes, such as nutrient metabolism, energy storage, growth regulation, and steroid biosynthesis, related to reproduction. Notably, genes such as igf2bp2, eno3, ccn2, igfbp4, fbxo2, ldlr, fabp6, slc7a2, mat2a, nt5e, atp5f1e, cyp1a1, Pyy, tm7sf2, ebp, sqle, hsd17b7, nsdhl, fdft1, adcy8, and hsd17b14 were differentially expressed and mapped to critical pathways, including the MAPK signaling pathway, metabolic pathways, biosynthesis of amino acids, drug–cytochrome (p450) pathways and estrogen signaling pathways, ECM receptor interaction, steroid biosynthesis, and ovarian steroidogenesis. These pathways are not only essential for hepatic nutrient processing and energy regulation, but also contribute significantly to ovarian growth and development by supporting steroid hormone production, germ–cell proliferation, and follicular maturation. The findings of this study provide new molecular insights into how IGF signaling influences liver function to support reproductive physiology in golden pompano, thereby offering a valuable resource for future research and aquaculture breeding strategies aimed at enhancing growth and reproductive performance.

Supplementary Materials

The following supporting information can be downloaded at: https://www.mdpi.com/article/10.3390/fishes10070315/s1, Table S1: Primer sequences for the RT-qPCR analysis of mRNAs; Table S2: Summary of quality-controlled reads; Table S3: Overview of mapped read statistics; Table S4: Differentially Expressed Genes (DEGs) in the IGFs treated group versus the control group; Table S5: GO (Gene Ontology) enrichment analysis of differentially expressed (DE) mRNAs in the IGFs treated group versus the control group; Table S6: KEGG pathway enrichment analysis of target genes associated with differentially expressed (DE) mRNAs in the IGFs treated group versus the control group.

Author Contributions

Conceptualization, C.B.N. and H.C.; methodology, P.L. and C.B.N.; software, M.F. and V.M.S.; validation, C.B.N. and H.C.; formal analysis, C.B.N., M.F. and H.C.; investigation, H.C.; resources, C.B.N., M.F., P.L. and H.C.; data curation, Y.W., C.B.N. and H.C.; writing—original draft preparation, C.B.N., and H.C.; writing—review and editing, M.F., V.M.S. and H.C.; visualization, C.B.N.; supervision, H.C.; project administration, H.C.; funding acquisition, H.C. All authors have read and agreed to the published version of the manuscript.

Funding

This work was supported by funds from the Key Research and Development Program of Guangdong (2021B0202020002), the Science and Technology Plan of Guangdong Province (2023B0202010016), the Natural Science Foundation of China (32273131), the Youth Science and Technology Innovation Talent of Guangdong TeZhi plan talent (2023TQ07A888), the Science and Technology Plan of Zhanjiang City (2024E03007), and the science and technology plan of Yangjiang City (2022011, SDZX2023027 and BQW2024013).

Institutional Review Board Statement

The animal study protocol was approved by the Institutional Review Board of Animal Research Ethics Committee of Guangdong Ocean University Approval Code: 201903004—Approval Date 12 March 2019.

Informed Consent Statement

Not applicable.

Data Availability Statement

The data supporting this study’s findings are available upon reasonable request. The raw reads in this article have been deposited into the Sequence Read Archive (SRA) of the NCBI database under BioProject accession number: PRJNA1259472.

Acknowledgments

We acknowledge all funders of this work.

Conflicts of Interest

The authors declare no conflict of interest.

References

  1. Codina, M.; Montserrat, N.; De La Serrana, D.G.; Rallière, C.; Gabillard, J.C.; Navarro, I.; Rescan, P.; Gutiérrez, J. Role of Insulin and IGFs in Fish Muscle Development and Quality. Arch. Fur Tierz. 2006, 49, 33–38. [Google Scholar]
  2. Pierce, A.L.; Breves, J.P.; Moriyama, S.; Hirano, T.; Grau, E.G. Differential Regulation of Igf1 and Igf2 MRNA Levels in Tilapia Hepatocytes: Effects of Insulin and Cortisol on GH Sensitivity. J. Endocrinol. 2011, 211, 201–210. [Google Scholar] [CrossRef] [PubMed]
  3. Hack, N.L.; Strobel, J.S.; Journey, M.L.; Beckman, B.R.; Lema, S.C. Response of the Insulin-like Growth Factor-1 (Igf1) System to Nutritional Status and Growth Rate Variation in Olive Rockfish (Sebastes serranoides). Comp. Biochem. Physiol. Part A Mol. Integr. Physiol. 2018, 224, 42–52. [Google Scholar] [CrossRef]
  4. Li, J.; Liu, Z.; Kang, T.; Li, M.; Wang, D.; Cheng, C.H.K. Igf3: A Novel Player in Fish Reproduction. Biol. Reprod. 2021, 104, 1194–1204. [Google Scholar] [CrossRef]
  5. Li, J.; Niu, C.; Cheng, C.H.K. Igf3 Serves as a Mediator of Luteinizing Hormone in Zebrafish Ovulation. Biol. Reprod. 2018, 99, 1235–1243. [Google Scholar] [CrossRef] [PubMed]
  6. Rizky, D.; Mahardini, A.; Byun, J.; Takemura, A. General and Comparative Endocrinology Molecular Cloning of Insulin-like Growth Factor 3 (Igf3) and Its Expression in the Tissues of a Female Damsel Fish, Chrysiptera cyanea, in Relation to Seasonal and Food-Manipulated Reproduction. Gen. Comp. Endocrinol. 2020, 295, 113479. [Google Scholar] [CrossRef]
  7. Beckman, B.R. Perspectives on Concordant and Discordant Relations between Insulin-like Growth Factor 1 (IGF1) and Growth in Fishes. Gen. Comp. Endocrinol. 2011, 170, 233–252. [Google Scholar] [CrossRef]
  8. Ndandala, C.B.; Dai, M.; Farouk, U.; Li, X.; Liu, J.; Huang, H.; Li, G.; Chen, H. Current Research and Future Perspectives of GH and IGFs Family Genes in Somatic Growth and Reproduction of Teleost Fish. Aquac. Rep. 2022, 26, 101289. [Google Scholar] [CrossRef]
  9. Reinecke, M. Insulin-like Growth Factors and Fish Reproduction. Biol. Reprod. 2010, 82, 656–661. [Google Scholar] [CrossRef]
  10. Ferńndez, I.; Darias, M.; Andree, K.B.; Mazurais, D.; Zambonino-Infante, J.L.; Gisbert, E. Coordinated Gene Expression during Gilthead Sea Bream Skeletogenesis and Its Disruption by Nutritional Hypervitaminosis A. BMC Dev. Biol. 2011, 11, 7. [Google Scholar] [CrossRef]
  11. Xie, Y.; Huang, D.; Chu, L.; Liu, Y.; Sun, X.; Li, J.; Cheng, C.H.K. IGF3 Is Essential for Ovary Differentiation in Zebrafish. Biol. Reprod. 2021, 104, 589–601. [Google Scholar] [CrossRef] [PubMed]
  12. Safian, D.; Bogerd, J.; Schulz, R.W. Igf3 Activates β-Catenin Signaling to Stimulate Spermatogonial Differentiation in Zebrafish. J. Endocrinol. 2018, 238, 245–257. [Google Scholar] [CrossRef]
  13. Nóbrega, R.H.; De Souza Morais, R.D.V.; Crespo, D.; De Waal, P.P.; De França, L.R.; Schulz, R.W.; Bogerd, J. Fsh Stimulates Spermatogonial Proliferation and Differentiation in Zebrafish via Igf3. Endocrinology 2015, 156, 3804–3817. [Google Scholar] [CrossRef]
  14. Zhao, C.; Zheng, S.; Dang, Y.; Wang, M.; Ren, Y. Identification of a New Insulin-like Growth Factor 3 (Igf3) in Turbot (Scophthalmus maximus): Comparison and Expression Analysis of IGF System Genes during Gonadal Development. Fishes 2023, 8, 240. [Google Scholar] [CrossRef]
  15. Wang, Y.; Li, Z.; Guo, Y.; Nong, C.; Ndandala, C.B.; Yang, H.; Huang, H.; Li, G.; Chen, H. Analysis on LncRNA and MRNA Expression Profiles of IGF3-Induced Ovarian Maturation in Spotted Scat (Scatophagus argus). Aquac. Rep. 2022, 27, 101367. [Google Scholar] [CrossRef]
  16. Song, F.; Wang, L.; Zhu, W.; Fu, J.; Dong, J.; Dong, Z. A Novel Igf3 Gene in Common Carp (Cyprinus carpio): Evidence for Its Role in Regulating Gonadal Development. PLoS ONE 2016, 11, e0168874. [Google Scholar] [CrossRef]
  17. Safian, D.; van der Kan, H.J.G.; Cresp, D.; Bogerd, J.; Schulz, R.W. Follicle-Stimulating Hormone Regulates Igfbp Gene Expression Directly or via Downstream Effectors to Modulate Igf3 Effects on Zebrafish Spermatogenesis. Front. Endocrinol. (Lausanne) 2017, 8, 328. [Google Scholar] [CrossRef] [PubMed]
  18. Song, F.; Wang, L.; Yu, Z.; Zhu, W.; Fu, J.; Dong, Z. Knockdown of Igf3 Gene by RNA Interference Causes Gonadal Development Inhibition of Common Carp (Cyprinus carpio). Aquac. Res. 2021, 52, 3006–3014. [Google Scholar] [CrossRef]
  19. Li, Z.; Brighton, C.; Guo, Y.; Zhou, Q.; Huang, C. Impact of IGF3 Stimulation on Spotted Scat (Scatophagus argus) Liver: Implications for a Role in Ovarian Development Impact of IGF3. Agric. Commun. 2023, 1, 100016. [Google Scholar] [CrossRef]
  20. Sun, Y.; Guo, C.Y.; Wang, D.D.; Li, X.F.; Xiao, L.; Zhang, X.; You, X.; Shi, Q.; Hu, G.J.; Fang, C.; et al. Transcriptome Analysis Reveals the Molecular Mechanisms Underlying Growth Superiority in a Novel Grouper Hybrid (Epinephelus fuscogutatus ♀ × E. lanceolatus ♂). BMC Genet. 2016, 17, 24. [Google Scholar] [CrossRef]
  21. Niu, J.; Sun, M.; Li, Z.; Wang, Z.; Kong, M.; Wang, Y.; Song, J.; Zhang, Q.; He, Y.; Qi, J. Whole Transcriptome Analysis Provides New Insight on Immune Response Mechanism of Golden Pompano (Trachinotus ovatus) to Amyloodinium ocellatum Infestation. Aquaculture 2022, 560, 738396. [Google Scholar] [CrossRef]
  22. Ma, X.; Wang, G.; Wu, L.; Liu, H.; Jiang, H.; Wang, L.; Liu, Q.; Wu, Q.; Tian, X.; Li, X. Dynamic Expression and Functional Analysis of Circular RNA in the Gonads of Chinese Soft-Shelled Turtles (Pelodiscus sinensis). Comp. Biochem. Physiol. Part D Genom. Proteom. 2021, 39, 100863. [Google Scholar] [CrossRef]
  23. Kasprzak, A. Insulin-like Growth Factor 1 (Igf-1) Signaling in Glucose Metabolism in Colorectal Cancer. Int. J. Mol. Sci. 2021, 22, 6434. [Google Scholar] [CrossRef]
  24. Hayes, J.; Volkoff, H. Characterization of the Endocrine, Digestive and Morphological Adjustments of the Intestine in Response to Food Deprivation and Torpor in Cunner, Tautogolabrus adspersus. Comp. Biochem. Physiol. A Mol. Integr. Physiol. 2014, 170, 46–59. [Google Scholar] [CrossRef] [PubMed]
  25. Tian, Y.M.; Chen, J.; Tao, Y.; Jiang, X.Y.; Zou, S.M. Molecular Cloning and Function Analysis of Insulin-like Growth Factor-Binding Protein 1a in Blunt Snout Bream (Megalobrama amblycephala). Dongwuxue. Yanjiu 2014, 35, 300–306. [Google Scholar] [CrossRef]
  26. Song, C.; Liu, B.; Xie, J.; Ge, X.; Zhao, Z. Comparative Proteomic Analysis of Liver Antioxidant Mechanisms in Megalobrama amblycephala Stimulated with Dietary Emodin. Sci. Rep. 2017, 7, 40356. [Google Scholar] [CrossRef] [PubMed]
  27. Yousefian, M.; Mousavi, S.E. The Mechanism of Reproduction and Hormonal Function in Finfish Species: A Review. Sci. Res. Essays 2011, 6, 3561–3570. [Google Scholar] [CrossRef]
  28. Ren, X.; Liu, J.; Ndandala, C.B.; Li, X.; Guo, Y.; Li, G.; Chen, H.; Wang, B. Physiological Effects and Transcriptomic Analysis of SbGnRH on the Liver in Pompano (Trachinotus ovatus). Front. Endocrinol. 2022, 13, 869021. [Google Scholar] [CrossRef]
  29. Liu, B.; Liang, Y.Y.; Guo, H.Y.; Liu, B.S.; Yang, J.W.; Zhang, N.; Xian, L.; Zhu, K.C.; Zhang, D.C. Genomic Structures of Insulin-like Growth Factor from Golden Pompano (Trachinotus ovatus) and Their Expression Responses to the Feed Types. Fish Physiol. Biochem. 2024, 50, 1791–1809. [Google Scholar] [CrossRef]
  30. Ma, Q.W.; Guo, H.Y.; Zhu, K.C.; Guo, L.; Liu, B.S.; Zhang, N.; Liu, B.; Yang, J.W.; Jiang, S.G.; Zhang, D.C. Dietary Taurine Intake Affects Growth and Taurine Synthesis Regulation in Golden Pompano, Trachinotus ovatus (Linnaeus 1758). Aquaculture 2021, 530, 735918. [Google Scholar] [CrossRef]
  31. Li, X.; Brighton Ndandala, C.; Zhou, Q.; Huang, C.; Li, G.; Chen, H. Molecular Cloning of Estrogen Receptor and Its Function on Vitellogenesis in Pompano (Trachinotus ovatus). Gen. Comp. Endocrinol. 2024, 346, 114403. [Google Scholar] [CrossRef] [PubMed]
  32. Ndandala, C.B.; Zhou, Q.; Li, Z.; Guo, Y.; Li, G. Identification of Insulin-like Growth Factor (IGF) Family Genes in the Golden Pompano, Trachinotus ovatus: Molecular Cloning, Characterization and Gene Expression. Int. J. Mol. Sci. 2024, 25, 2499. [Google Scholar] [CrossRef] [PubMed]
  33. Ndandala, C.B.; Guo, Y.; Ju, Z.; Fachri, M.; Mwemi, H.M.; Chen, H. Integrated LncRNA and MRNA Transcriptome Analyses of IGF1 and IGF2 Stimulated Ovaries Reveal Genes and Pathways Potentially Associated with Ovarian Development and Oocyte Maturation in Golden Pompano (Trachinotus ovatus). Animals 2025, 15, 1134. [Google Scholar] [CrossRef]
  34. Kim, D.; Langmead, B.; Salzberg1, S.L. HISAT: A Fast Spliced Aligner with Low Memory Requirements Daehwan HHS Public Access. Nat. Methods 2015, 12, 357–360. [Google Scholar] [CrossRef] [PubMed]
  35. Love, M.I.; Huber, W.; Anders, S. Moderated Estimation of Fold Change and Dispersion for RNA-Seq Data with DESeq2. Genome Biol. 2014, 15, 550. [Google Scholar] [CrossRef]
  36. Pertea, M.; Pertea, G.M.; Antonescu, C.M.; Chang, T.-C.; Mendell, J.T.; Salzberg, S.L. StringTie Enables Improved Reconstruction of a Transcriptome from RNA-Seq Reads. Nat. Biotechnol. 2015, 33, 290–295. [Google Scholar] [CrossRef]
  37. Trapnell, C.; Hendrickson, D.G.; Sauvageau, M.; Goff, L.; Rinn, J.L.; Pachter, L.; Author, N.B. Differential Analysis of Gene Regulation at Transcript Resolution with RNA-Seq NIH Public Access Author Manuscript. Nat. Biotechnol. 2013, 31, 46–53. [Google Scholar] [CrossRef]
  38. Lu, X.; Wei, H.; Yang, C.; Li, Q.; Li, P.; Chen, J.; Sun, Y.; Wen, H.; Jiang, M.; Wang, G. Effects of Dietary Protein Levels on Growth Performance and Liver Transcriptome Changes in Juvenile Top-Mouth Culter Erythroculter ilishaeformis. Aquac. Rep. 2021, 21, 100964. [Google Scholar] [CrossRef]
  39. Zhou, F.; Zhang, X.; Yao, G.; Chen, X.; Qi, M.; Zhou, Q.; Zhu, N.; Meng, Q.; Zhang, Y.; Ding, X. Transcriptomic Comparison of Liver Tissue across Different Largemouth Bass (Micropterus salmoides) Strains. Fishes 2023, 8, 558. [Google Scholar] [CrossRef]
  40. Kolditz, C.; Borthaire, M.; Richard, N.; Corraze, G.; Panserat, S.; Vachot, C.; Lefèvre, F.; Médale, F. Liver and Muscle Metabolic Changes Induced by Dietary Energy Content and Genetic Selection in Rainbow Trout (Oncorhynchus mykiss). Am. J. Physiol. Regul. Integr. Comp. Physiol. 2008, 294, R1154–R1164. [Google Scholar] [CrossRef]
  41. Ding, L.; Liu, Y.; Kang, M.; Wei, X.; Geng, C.; Liu, W.; Han, L.; Yuan, F.; Wang, P.; Wang, B.; et al. UPLC-QTOF/MS Metabolomics and Biochemical Assays Reveal Changes in Hepatic Nutrition and Energy Metabolism during Sexual Maturation in Female Rainbow Trout (Oncorhynchus mykiss). Biology 2022, 11, 1679. [Google Scholar] [CrossRef] [PubMed]
  42. Fu, Y.; Xu, Z.; Wen, B.; Gao, J.; Chen, Z. Gonad-Specific Transcriptomes Reveal Differential Expression of Gene and MiRNA Between Male and Female of the Discus Fish (Symphysodon aequifasciatus). Front. Physiol. 2020, 11, 754. [Google Scholar] [CrossRef] [PubMed]
  43. Zhang, L.; Li, X.; Yu, Y.; Zhang, L.; Dong, L.; Gan, J.; Mao, T.; Liu, T.; Peng, J.; He, L. Comparative Analyses of Liver Transcriptomes Reveal the Effect of Exercise on Growth, Glucose Metabolism, and Oxygen Transport-Related Genes and Signaling Pathways in Grass Carp (Ctenopharyngodon idella). Comp. Biochem. Physiol. Part A Mol. Integr. Physiol. 2021, 262, 111081. [Google Scholar] [CrossRef] [PubMed]
  44. Wang, T.; Liu, Z.-L.; Li, G.-L.; Mustapha, U.F.; Ndandala, C.B.; Shi, H.-J.; Zhu, C.-H.; Chen, H.-P.; Huang, Y.; Jiang, D.-N. Ovary Transcriptomic Analysis Reveals Regulation Effects of Dietary Fish Oil on Hormone, Lipid, and Glucose Metabolism in Female Adult Spotted Scat (Scatophagus argus). Front. Mar. Sci. 2022, 9, 1480. [Google Scholar] [CrossRef]
  45. Li, F.; Xing, Y.; Zhang, J.; Mu, J.; Ge, J.; Zhao, M.; Liu, L.; Gong, D.; Geng, T. Goose Hepatic IGFBP2 Is Regulated by Nutritional Status and Participates in Energy Metabolism Mainly through the Cytokine−Cytokine Receptor Pathway. Animals 2023, 13, 2336. [Google Scholar] [CrossRef]
  46. Yu, H.; Mo, H.; An, X.; Yao, M.; Gao, J.; Yu, J.; Xiong, D.; Liu, H.; Li, Y.; Wang, L. Autocrine/Paracrine Fibroblast Growth Factor 1 (FGF1) Enhances Systemic Lipid Metabolism in Rainbow Trout Fed with a High-Fat Diet by Elevating Uridine Levels through the AMPK Signaling Pathway and Activating the Upp2 Promoter via Irf1. Aquaculture 2025, 596, 741885. [Google Scholar] [CrossRef]
  47. Zhu, B.; Pardeshi, L.; Chen, Y.; Ge, W. Transcriptomic Analysis for Differentially Expressed Genes in Ovarian Follicle Activation in the Zebrafish. Front. Endocrinol. (Lausanne) 2018, 9, 593. [Google Scholar] [CrossRef]
  48. Yang, Y.; Zhou, H.; Hou, L.; Xing, K.; Shu, H. Transcriptional Profiling of Skeletal Muscle Reveals Starvation Response and Compensatory Growth in Spinibarbus hollandi. BMC Genom. 2019, 20, 938. [Google Scholar] [CrossRef]
  49. Song, Z.; Xiong, H.; Meng, X.; Ma, Q.; Wei, Y.; Li, Y.; Liu, J.; Liang, M.; Xu, H. Dietary Cholesterol Supplementation Inhibits the Steroid Biosynthesis but Does Not Affect the Cholesterol Transport in Two Marine Teleosts: A Hepatic Transcriptome Study. Aquac. Nutr. 2023, 2023, 2308669. [Google Scholar] [CrossRef]
  50. Yu, Z.B.; Mu, C.K.; Song, W.W.; Li, R.H.; Chen, Y.E.; Wang, C.L. Screening of Genes Related to Ovarian Development in the Swimming Crab, Portunus trituberculatus, by Suppression Subtractive Hybridization. Genet. Mol. Res. 2015, 14, 18675–18686. [Google Scholar] [CrossRef]
  51. Murakami, Y.; Ando, M.; Futamata, R.; Horibe, T.; Ueda, K.; Kinoshita, M.; Kobayashi, T. Targeted Deletion of Ecto-5′-Nucleotidase Results in Retention of Inosine Monophosphate Content in Postmortem Muscle of Medaka (Oryzias latipes). Sci. Rep. 2022, 12, 18588. [Google Scholar] [CrossRef] [PubMed]
  52. Sciara, A.A.; Somoza, G.M.; Arranz, S.E. Insulin-like Growth Factor-I of Pejerrey, Odontesthes Bonariensis: CDNA Characterization, Tissue Distribution and Expression Profiles after Growth Hormone Administration. J. Exp. Zool. Part A Ecol. Genet. Physiol. 2008, 309, 407–418. [Google Scholar] [CrossRef] [PubMed]
  53. Cerdá-Reverter, J.M.; Anglade, I.; Martínez-Rodríguez, G.; Mazurais, D.; Muñoz-Cueto, J.A.; Carrillo, M.; Kah, O.; Zanuy, S. Characterization of Neuropeptide Y Expression in the Brain of a Perciform Fish, the Sea Bass (Dicentrarchus labrax). J. Chem. Neuroanat. 2000, 19, 197–210. [Google Scholar] [CrossRef]
  54. Assan, D.; Huang, Y.; Mustapha, U.F.; Addah, M.N.; Li, G.; Chen, H. Fish Feed Intake, Feeding Behavior, and the Physiological Response of Apelin to Fasting and Refeeding. Front. Endocrinol. (Lausanne) 2021, 12, 798903. [Google Scholar] [CrossRef] [PubMed]
  55. Wei, R.; Zhou, C.; Yuan, D.; Wang, T.; Lin, F.; Chen, H.; Wu, H.; Xin, Z.; Yang, S.; Wang, Y.; et al. Characterization, Tissue Distribution and Regulation of NeuropeptideY in Schizothorax prenanti. J. Fish Biol. 2014, 85, 278–291. [Google Scholar] [CrossRef]
  56. Yokobori, E.; Azuma, M.; Nishiguchi, R.; Kang, K.S.; Kamijo, M.; Uchiyama, M.; Matsuda, K. Neuropeptide Y Stimulates Food Intake in the Zebrafish, Danio rerio. J. Neuroendocrinol. 2012, 24, 766–773. [Google Scholar] [CrossRef]
  57. Hosomi, N.; Furutani, T.; Takahashi, N.; Masumoto, T.; Fukada, H. Yellowtail Neuropeptide Y: Molecular Cloning, Tissue Distribution, and Response to Fasting. Fish. Sci. 2014, 80, 483–492. [Google Scholar] [CrossRef]
  58. Canosa, L.F.; Bertucci, J.I. The Effect of Environmental Stressors on Growth in Fish and Its Endocrine Control. Front. Endocrinol. (Lausanne) 2023, 14, 1109461. [Google Scholar] [CrossRef]
  59. Puckett, S. Analysis of the Effect of Feeding Regimen on GH/IGF Axis in Channel Catfish (Ictalurus punctatus). Undergraduate Honors Thesis, University of Arkansas, Fayetteville, AR, USA, 2012. Available online: https://scholarworks.uark.edu/baeguht/30 (accessed on 25 March 2025).
  60. Berishvili, G.; Baroiller, J.; Eppler, E.; Reinecke, M. General and Comparative Endocrinology Insulin-like Growth Factor-3 (IGF-3) in Male and Female Gonads of the Tilapia: Development and Regulation of Gene Expression by Growth Hormone (GH) And. Gen. Comp. Endocrinol. 2010, 167, 128–134. [Google Scholar] [CrossRef]
  61. Gabillard, J.C.; Kamangar, B.B.; Montserrat, N. Coordinated Regulation of the GH/IGF System Genes during Refeeding in Rainbow Trout (Oncorhynchus mykiss). J. Endocrinol. 2006, 191, 15–24. [Google Scholar] [CrossRef]
  62. Kajimura, S.; Hirano, T.; Visitacion, N.; Moriyama, S.; Aida, K.; Grau, E.G. Dual Mode of Cortisol Action on GH/IGF-I/IGF Binding Proteins in the Tilapia, Oreochromis mossambicus. J. Endocrinol. 2003, 178, 91–99. [Google Scholar] [CrossRef] [PubMed]
  63. Zhou, N.; Guo, C.; Du, J.; Xu, Q.; Li, J.; Huang, D.; Zheng, X.; Tu, L. PPP1R14B-Mediated Phosphorylation Enhances Protein Stability of RPS6KA1 to Promote Hepatocellular Carcinoma Tumorigenesis. Biochim. Biophys. Acta Mol. Cell Res. 2024, 1871, 119840. [Google Scholar] [CrossRef] [PubMed]
  64. Gao, Z.; Zhang, W.; Jiang, S.; Qiao, H.; Xiong, Y.; Jin, S.; Fu, H. Genome-Wide Association and Transcriptomic Analysis and the Identification of Growth-Related Genes in Macrobrachium nipponense. BMC Genom. 2024, 25, 1182. [Google Scholar] [CrossRef] [PubMed]
  65. Fernández Míguez, M.; Presa, P.; Puvanendran, V.; Tveiten, H.; Hansen, Ø.J.; Pérez, M. Gene Expression and Phenotypic Assessment of Egg Quality across Developmental Stages of Atlantic Cod throughout the Spawning Season. Int. J. Mol. Sci. 2024, 25, 7488. [Google Scholar] [CrossRef]
  66. Meng, F.; Sun, S.; Xu, X.; Yu, W.; Gan, R.; Zhang, L.; Zhang, W. Transcriptomic Analysis Provides Insights into the Growth and Maturation of Ovarian Follicles in the Ricefield Eel (Monopterus albus). Aquaculture 2022, 555, 738251. [Google Scholar] [CrossRef]
  67. Zhang, Y.; Liu, Y.; Shi, Y.; Bai, C.; Wang, T.; Ruan, F.; Hu, C. Upregulation of MMPs in Placentas of Patients with Gestational Diabetes Mellitus: Involvement of the PI3K/Akt Pathway. Heliyon 2024, 10, e32518. [Google Scholar] [CrossRef]
  68. Dong, Y.; Lyu, L.; Zhang, D.; Li, J.; Wen, H.; Shi, B. Integrated LncRNA and MRNA Transcriptome Analyses in the Ovary of Cynoglossus semilaevis Reveal Genes and Pathways Potentially Involved in Reproduction. Front. Genet. 2021, 12, 671729. [Google Scholar] [CrossRef]
  69. Li, S.; Zhou, Y.; Yang, C.; Fan, S.; Huang, L.; Zhou, T.; Wang, Q.; Zhao, R.; Tang, C.; Tao, M.; et al. Genomics Comparative Analyses of Hypothalamus Transcriptomes Reveal Fertility, Growth, and Immune-Related Genes and Signal Pathways in Different Ploidy Cyprinid Fish. Genomics 2021, 113, 595–605. [Google Scholar] [CrossRef]
  70. Xiang, X.; Huang, X.; Wang, J.; Zhang, H.; Zhou, W.; Xu, C.; Huang, Y.; Tan, Y.; Yin, Z. Transcriptome Analysis of the Ovaries of Taihe Black-Bone Silky Fowls at Different Egg-Laying Stages. Genes 2022, 13, 2066. [Google Scholar] [CrossRef]
  71. Yang, J.; Zeng, Z.; Wei, J.; Jiang, L.; Ma, Q.; Wu, M.; Huang, X.; Ye, S.; Li, Y.; Ma, D.; et al. Sema4d Is Required for the Development of the Hindbrain Boundary and Skeletal Muscle in Zebrafish. Biochem. Biophys. Res. Commun. 2013, 433, 213–219. [Google Scholar] [CrossRef]
  72. Nakada, C.; Satoh, S.; Tabata, Y.; Arai, K.; Watanabe, S. Transcriptional Repressor Foxl1 Regulates Central Nervous System Development by Suppressing Shh Expression in Zebra Fish. Mol. Cell. Biol. 2006, 26, 7246–7257. [Google Scholar] [CrossRef] [PubMed]
  73. Xu, Y.; Dong, P.; Sewo, D.Y.; Su, S.; Li, J.; Feng, W.; Liao, Y.; Tang, Y. Multi-Omics Analysis Unravels the Underlying Mechanisms of the Escape Response of the Common Strain Black Carp (Cyprinus carpio Var. Baisenensis). Aquac. Int. 2024, 32, 9547–9563. [Google Scholar] [CrossRef]
  74. DeKryger, W.; Chroneos, Z.C. Emerging Concepts of Myosin 18A Isoform Mechanobiology in Organismal and Immune System Physiology, Development, and Function. FASEB J. 2024, 38, e23649. [Google Scholar] [CrossRef] [PubMed]
  75. Itoh, N.; Nakayama, Y.; Konishi, M. Roles of FGFs As Paracrine or Endocrine Signals in Liver Development, Health, and Disease. Front. Cell Dev. Biol. 2016, 4, 30. [Google Scholar] [CrossRef]
  76. Jin, C.; Yan, K.; Wang, M.; Song, W.; Kong, X.; Zhang, Z. Identification, Characterization and Functional Analysis of Fibroblast Growth Factors in Black Rockfish (Sebastes schlegelii). Int. J. Mol. Sci. 2023, 24, 3626. [Google Scholar] [CrossRef]
  77. Kang, B.; Jiang, D.M.; Bai, L.; He, H.; Ma, R. Molecular Characterisation and Expression Profiling of the ENO1 Gene in the Ovarian Follicle of the Sichuan White Goose. Mol. Biol. Rep. 2014, 41, 1927–1935. [Google Scholar] [CrossRef]
  78. Holmes, R.S. Bioinformatic Studies of Vertebrate Enolases: Multifunctional Genes and Proteins. Open Access Bioinform. 2011, 3, 43–59. [Google Scholar] [CrossRef]
  79. Hall-Glenn, F.; Lyons, K.M. Roles for CCN2 in Normal Physiological Processes. Cell. Mol. Life Sci. 2011, 68, 3209–3217. [Google Scholar] [CrossRef]
  80. Lyche, J.L.; Nourizadeh-Lillabadi, R.; Almaas, C.; Stavik, B.; Berg, V.; Skare, J.U.; Alestrøm, P.; Ropstad, E. Natural Mixtures of Persistent Organic Pollutants (POP) Increase Weight Gain, Advance Puberty, and Induce Changes in Gene Expression Associated with Steroid Hormones and Obesity in Female Zebrafish. J. Toxicol. Environ. Health Part A Curr. Issues 2010, 73, 1032–1057. [Google Scholar] [CrossRef]
  81. Rollins, D.A.; Coppo, M.; Rogatsky, I. Minireview: Nuclear Receptor Coregulators of the P160 Family: Insights into Inflammation and Metabolism. Mol. Endocrinol. 2015, 29, 502–517. [Google Scholar] [CrossRef]
  82. Liu, M.; Ding, H.; Jin, C.; Wang, M.; Li, P.; Bao, Z.; Wang, B.; Hu, J. Theoretical Analysis and Expression Profiling of 17β-Hydroxysteroid Dehydrogenase Genes in Gonadal Development and Steroidogenesis of Leopard Coral Grouper (Plectropomus leopardus). Int. J. Mol. Sci. 2024, 25, 2180. [Google Scholar] [CrossRef] [PubMed]
Figure 1. Bar charts, Venn diagram, and volcano plot figures of identified differentially expressed (DE) mRNAs of different comparison groups. (A) Bar chart of DE mRNAs between comparison groups, (B) Venn diagrams of shared DE mRNAs between comparison groups IGF1, (C) volcano plot of DE mRNAs between control and IGF1 group, (D) volcano plot of DE mRNAs between control and IGF2, and (E) volcano plot of DE mRNAs between control and IGF3 comparison groups.
Fishes 10 00315 g001
Figure 2. Heatmaps showing the top 20 differentially expressed genes between liver control (LiC) and IGF-treated groups: (A) Li versus IGF1Li, (B) LiC versus IGF2Li, and (C) LiC versus IGF3Li. Gene/transcript IDs (e.g., MSTRG.102297, SCSFRI_TO_T_00007138) represent StringTie assembled and reference annotated transcripts, respectively. Expression values are color-coded red, indicating upregulation, or blue, indicating downregulation. Hierarchical clustering was applied to both genes and samples. Li denotes liver; C, control and T, treatment.
Fishes 10 00315 g002
Figure 3. GO enrichment analysis of DE mRNAs target genes between the control and treatment groups. (A) Control versus IGF1, (B) control versus IGF2, and (C) control versus IGF3. The upregulated and downregulated terms related to the biological process, cellular component, and molecular function are represented by red and light blue colors, respectively.
Fishes 10 00315 g003
Figure 4. KEGG pathway enrichment analysis of DE mRNAs target genes between the control and IGF groups. (A) Enrichment circle diagram, (B) control with IGF1, (C) control with IGF2, and (D) control with IGF3. The color of each spot represents the q-value for each pathway. The number of genes enriched in a pathway is represented by the size of its spot.
Fishes 10 00315 g004
Figure 5. Hypothetical indirect regulatory mechanism linking hepatic IGF stimulation to ovarian growth, development, and oocyte maturation in T. ovatus. Transcriptomic data from IGF1, IGF2, and IGF3 stimulation suggest involvement of shared and distinct signaling pathways, including PI3K/Akt/mTOR and MAPK/ERK. Black arrows indicate activation, green arrows denote shared pathways, red arrows highlight hypothesized physiological outcomes, and dotted lines denote the separation between IGF1, IGF2, and IGF3.
Fishes 10 00315 g005
Figure 6. RT-qPCR validation of RNA-Seq data. Relative gene expression was calculated using the 2−∆∆Ct method, and normalized against the β-actin reference gene. Results are presented as mean ± standard error (SEM) (n = 3). Statistical significance between control and treatment groups was evaluated using one-way analysis of variance (ANOVA), followed by Tukey’s post hoc test, with a threshold of p < 0.05. Asterisks denote statistical significance (* p < 0.05, ** p < 0.01). (A) Expression validation of 6 DE mRNAs (mmp11, ldlr, fgf12, fabp6, mmp15 and tc1a) in the control versus IGF1-treated groups, (B) expression validation of 6 DE mRNAs (tc1a, aldoa, samd9l, tm7sf2, hsd17b7, and nsdhl) in the control versus IGF2-treated groups and (C) expression validation of 7 DE mRNAs (foxn3, acta1a, Igfbp5, mmp15, slc2a2, elovl6, and hsd17b14) in the control versus IGF3-treated groups.
Fishes 10 00315 g006
Disclaimer/Publisher’s Note: The statements, opinions and data contained in all publications are solely those of the individual author(s) and contributor(s) and not of MDPI and/or the editor(s). MDPI and/or the editor(s) disclaim responsibility for any injury to people or property resulting from any ideas, methods, instructions or products referred to in the content.

