
Measurement, Spatiotemporal Evolution, and Spatial Spillover Effects of Carbon Sinks and Emissions from Shellfish and Algae Mariculture in China

Abstract
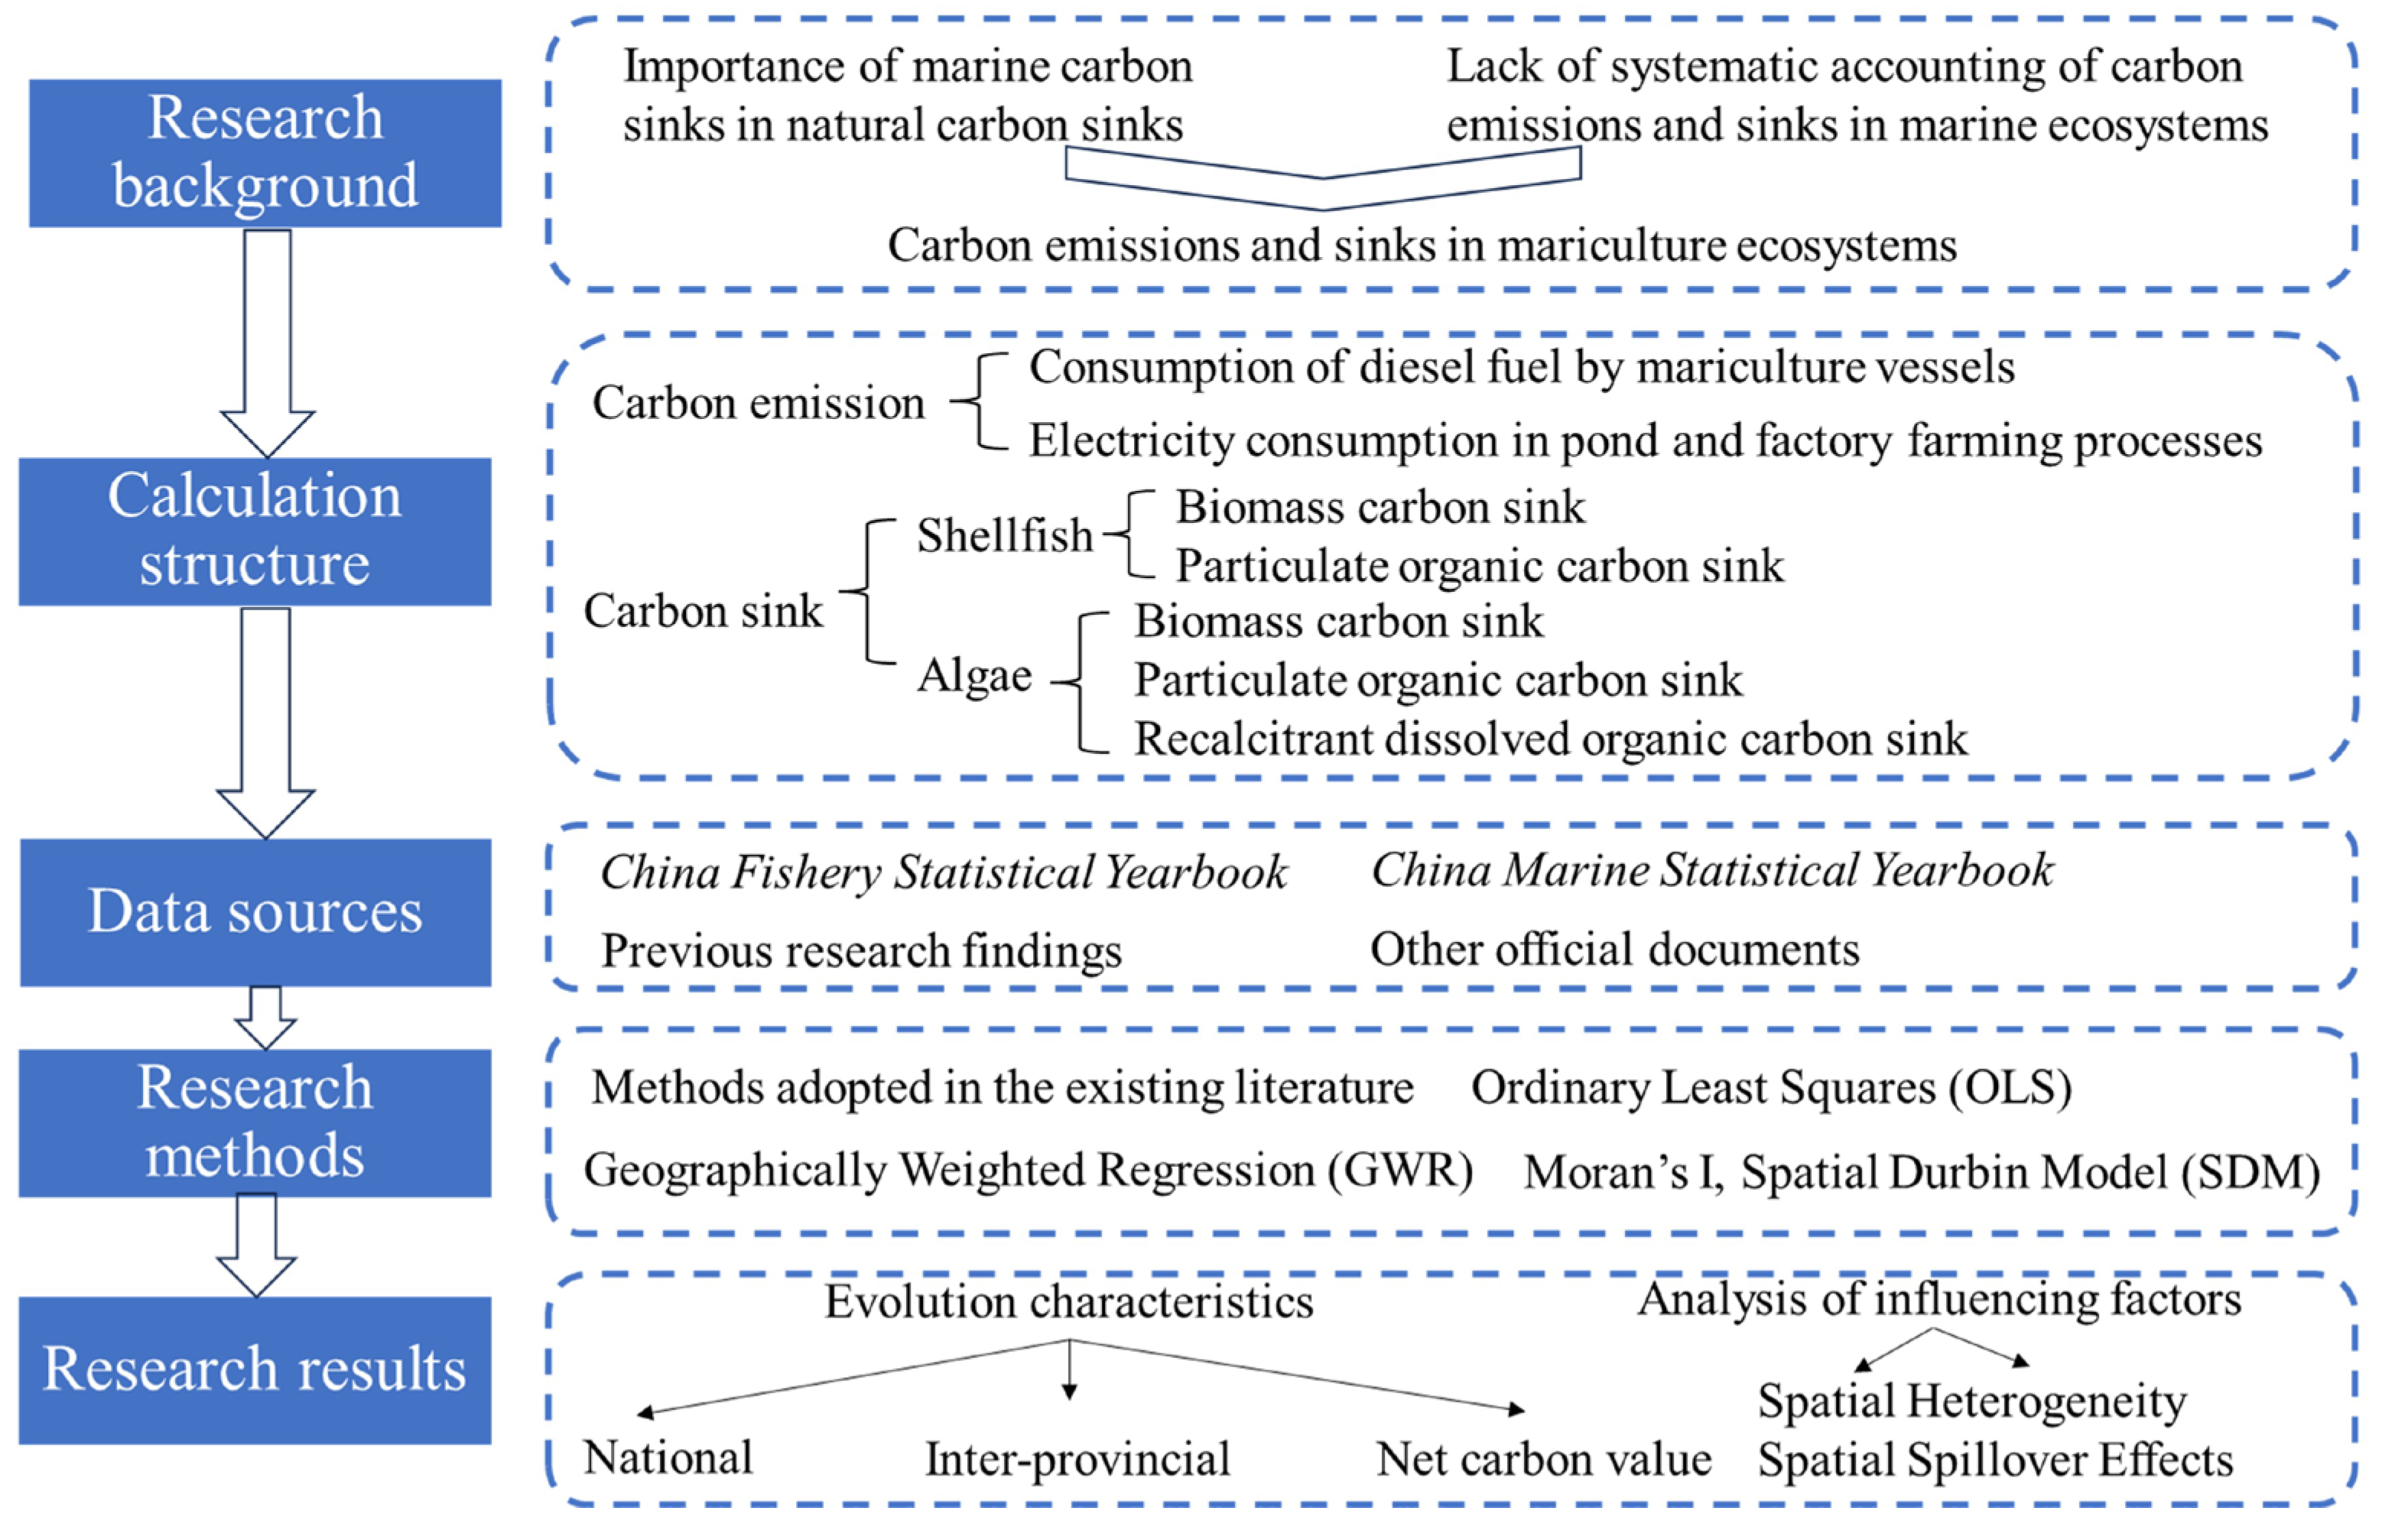
1. Introduction
2. Methods
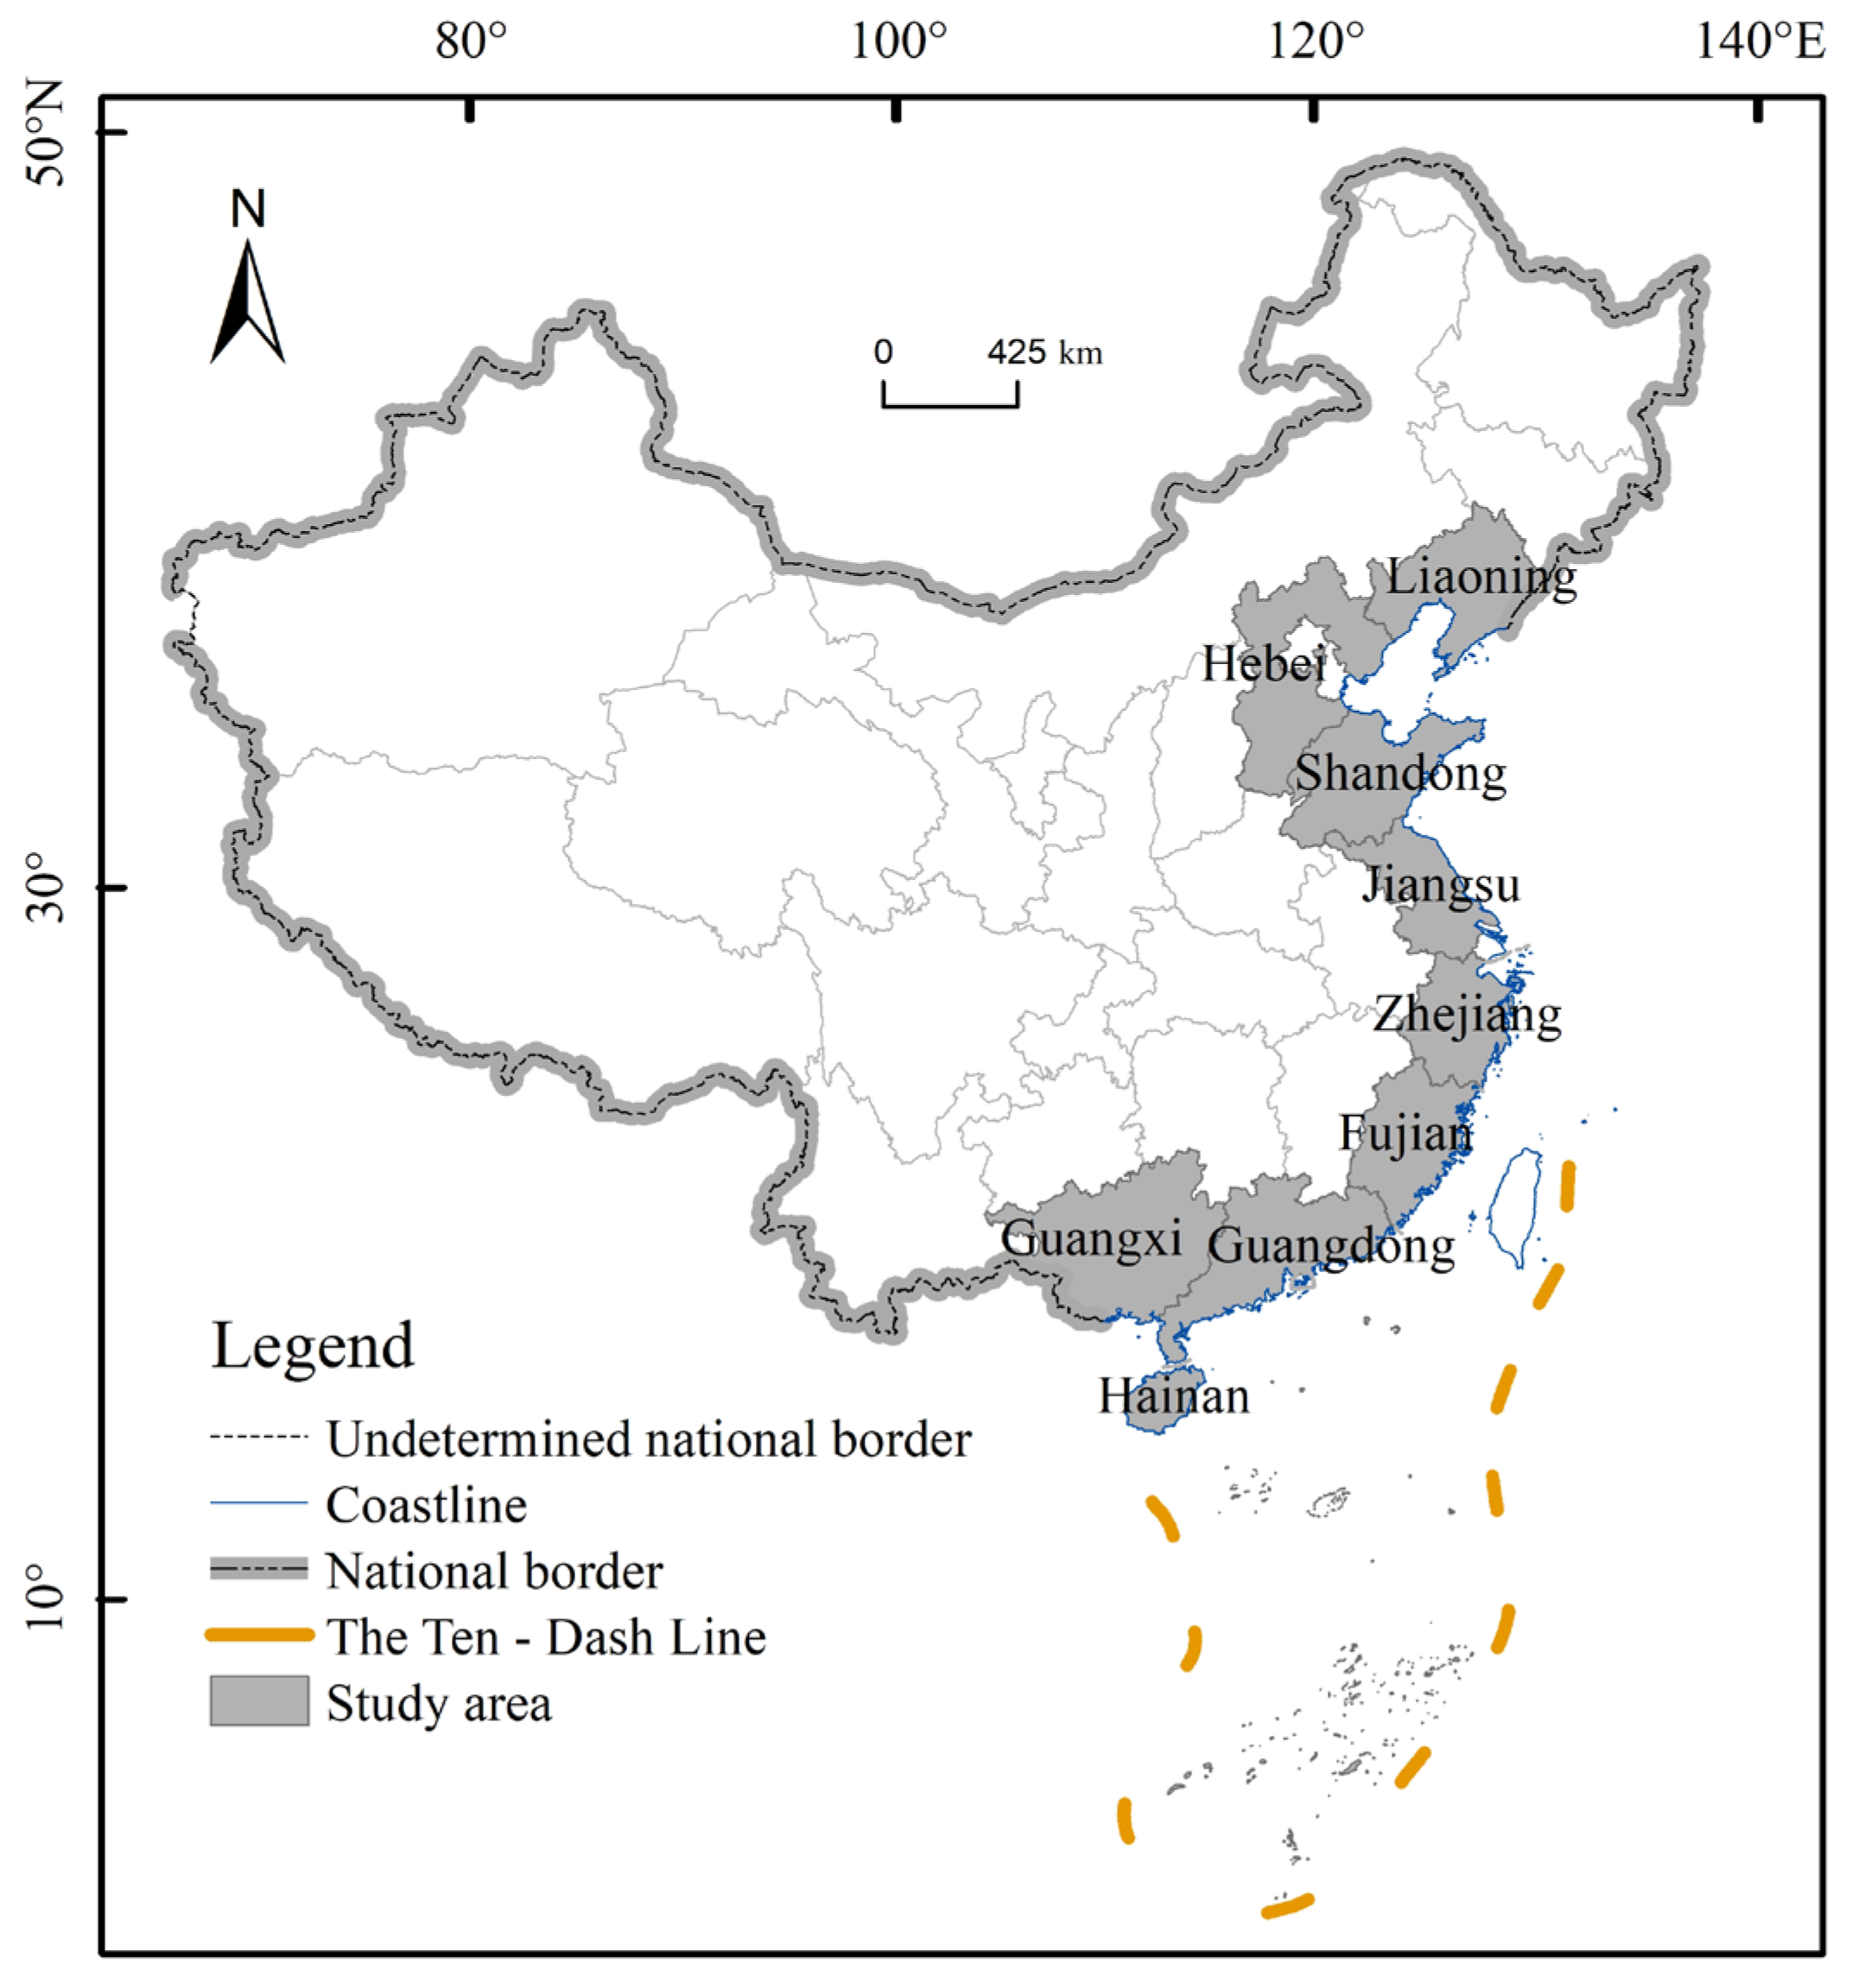
2.1. Study Area
2.2. Data Sources
- (1)
- Data on shellfish and algae production in mariculture, seaweed culture area, the power of mariculture fishing vessels, and pond and factory production in mariculture were obtained from the China Fisheries Statistical Yearbook (CFSY, 2008–2024).
- (2)
- Shellfish and algae biomass carbon sink correlation coefficients, including dry-to-wet coefficients for shellfish and algae, the specific gravity of shell and soft tissue in shellfish, the corresponding carbon content, and algal carbon content, were mainly derived from the research results of Sun et al. [30].
- (3)
- The ratio of carbon entering biological deposition to carbon removed by harvesting during shellfish aquaculture was obtained from Tang and Liu [31]. Conversion coefficients between net primary productivity (NPP) and gross primary productivity (GPP) for carbon sink accounting of RDOC carbon sinks in algae were obtained from Zhang et al. [32]. Conversion coefficients between GPP and DOC were obtained from Abdullah and Fredriksen [33] and Krause-Jensen and Duarte [34]. Conversion coefficients between DOC and RDOC [22] were obtained from previous studies. The average deposition rates for algae POC carbon sink accounting for seaweed farming areas were obtained from Zhang et al. [22] and Cai et al. [35]. The percentage of sedimentary organic carbon content in seaweed farming areas [36] was obtained from previous research results.
- (4)
- The conversion coefficient for diesel consumption by mariculture fishing vessels was obtained from the Reference Standard for Measuring Oil Consumption for Domestic Motorized Fishing Vessel Oil Price Subsidy of the Ministry of Agriculture and Rural Affairs. The carbon emission coefficient of diesel fuel was obtained from the General Rules for Calculating Comprehensive Energy Consumption (GB/T2589-2008) and the Guidelines for the Preparation of Provincial Greenhouse Gas Inventories (using raw coal as an example). The conversion coefficient of electric power consumption generated in the process of pond and factory aquaculture was obtained from Xu [28], and the carbon emission coefficient of electricity was obtained from the 2021 Electricity CO2 Emission Factors.
2.3. Method
2.3.1. Net Carbon Value
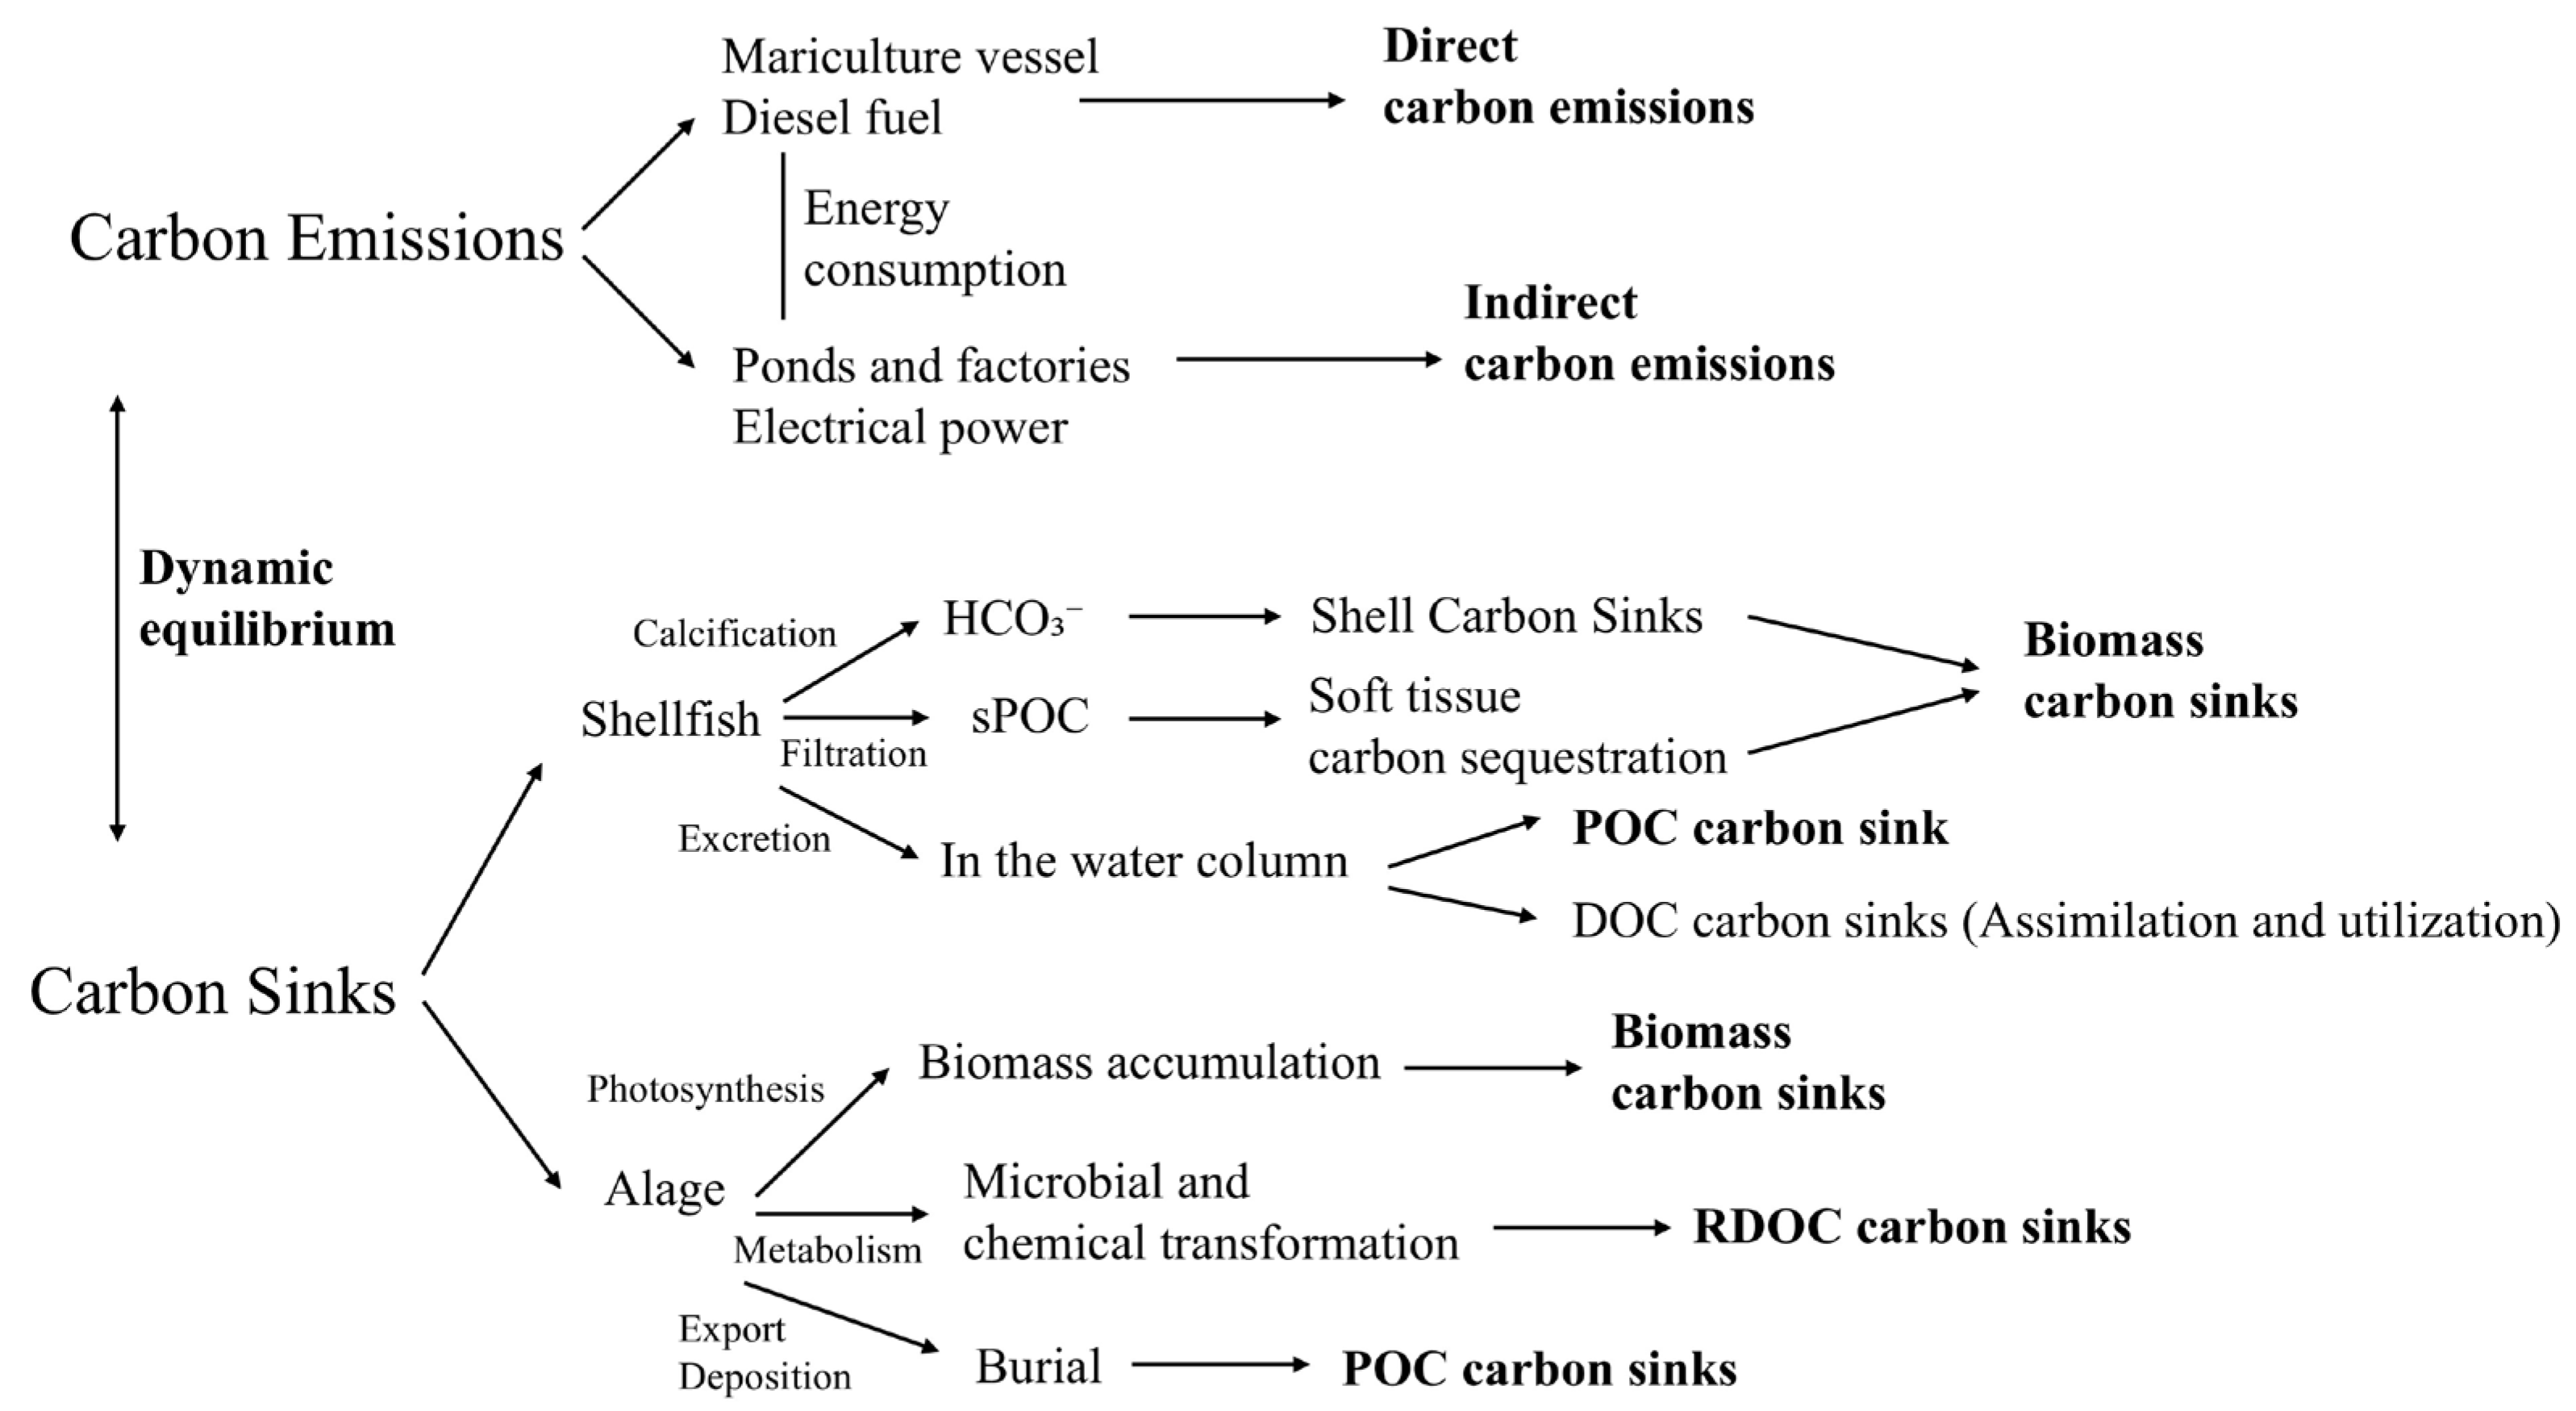
2.3.2. Total Carbon Emissions
2.3.3. Total Carbon Sinks
Shellfish Carbon Sinks
- (1)
- Shellfish biomass carbon sinks:
- (2)
- Shellfish POC carbon sinks:
Algal Carbon Sinks
- (1)
- Algal biomass carbon sinks:
- (2)
- Algal RDOC carbon sinks:
- (3)
- Algal POC carbon sinks:
2.3.4. Geographically Weighted Regression (GWR)
2.3.5. Spatial Durbin Model (SDM)
3. Results and Discussion
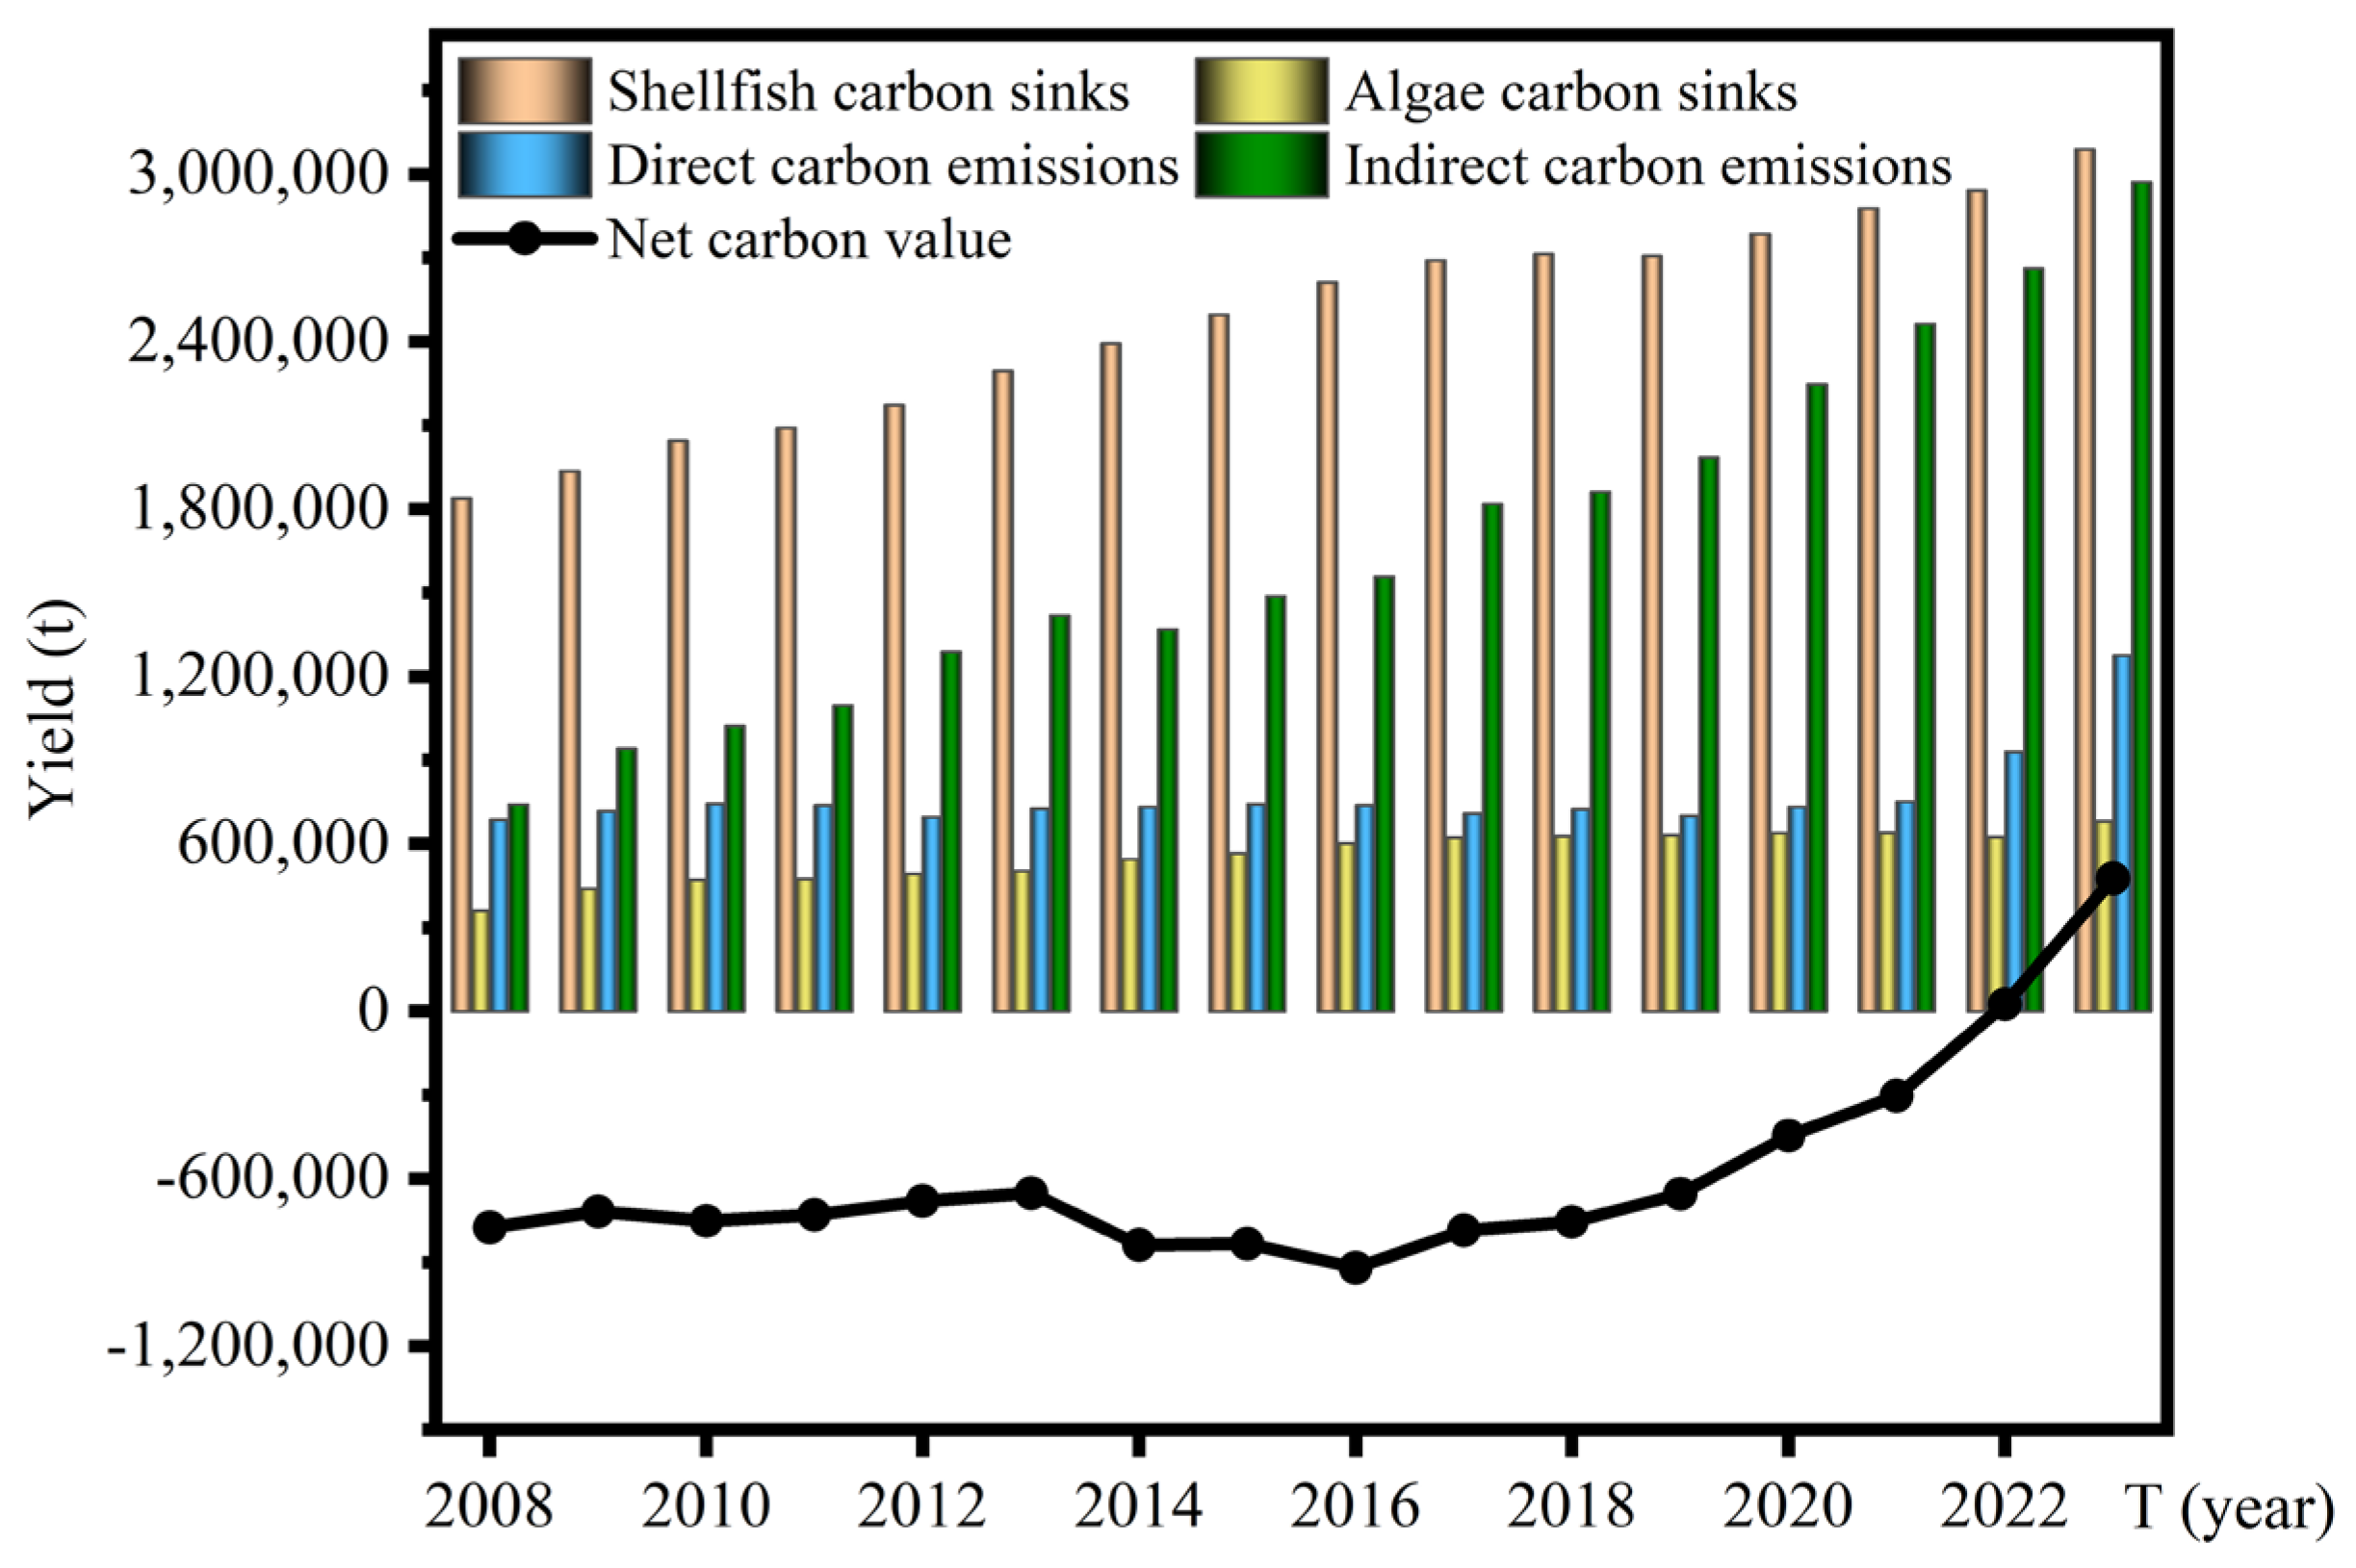
3.1. Spatial–Temporal Evolution Characterization of the National Perspective
3.2. Spatial–Temporal Evolution Characterization at the Provincial Scale
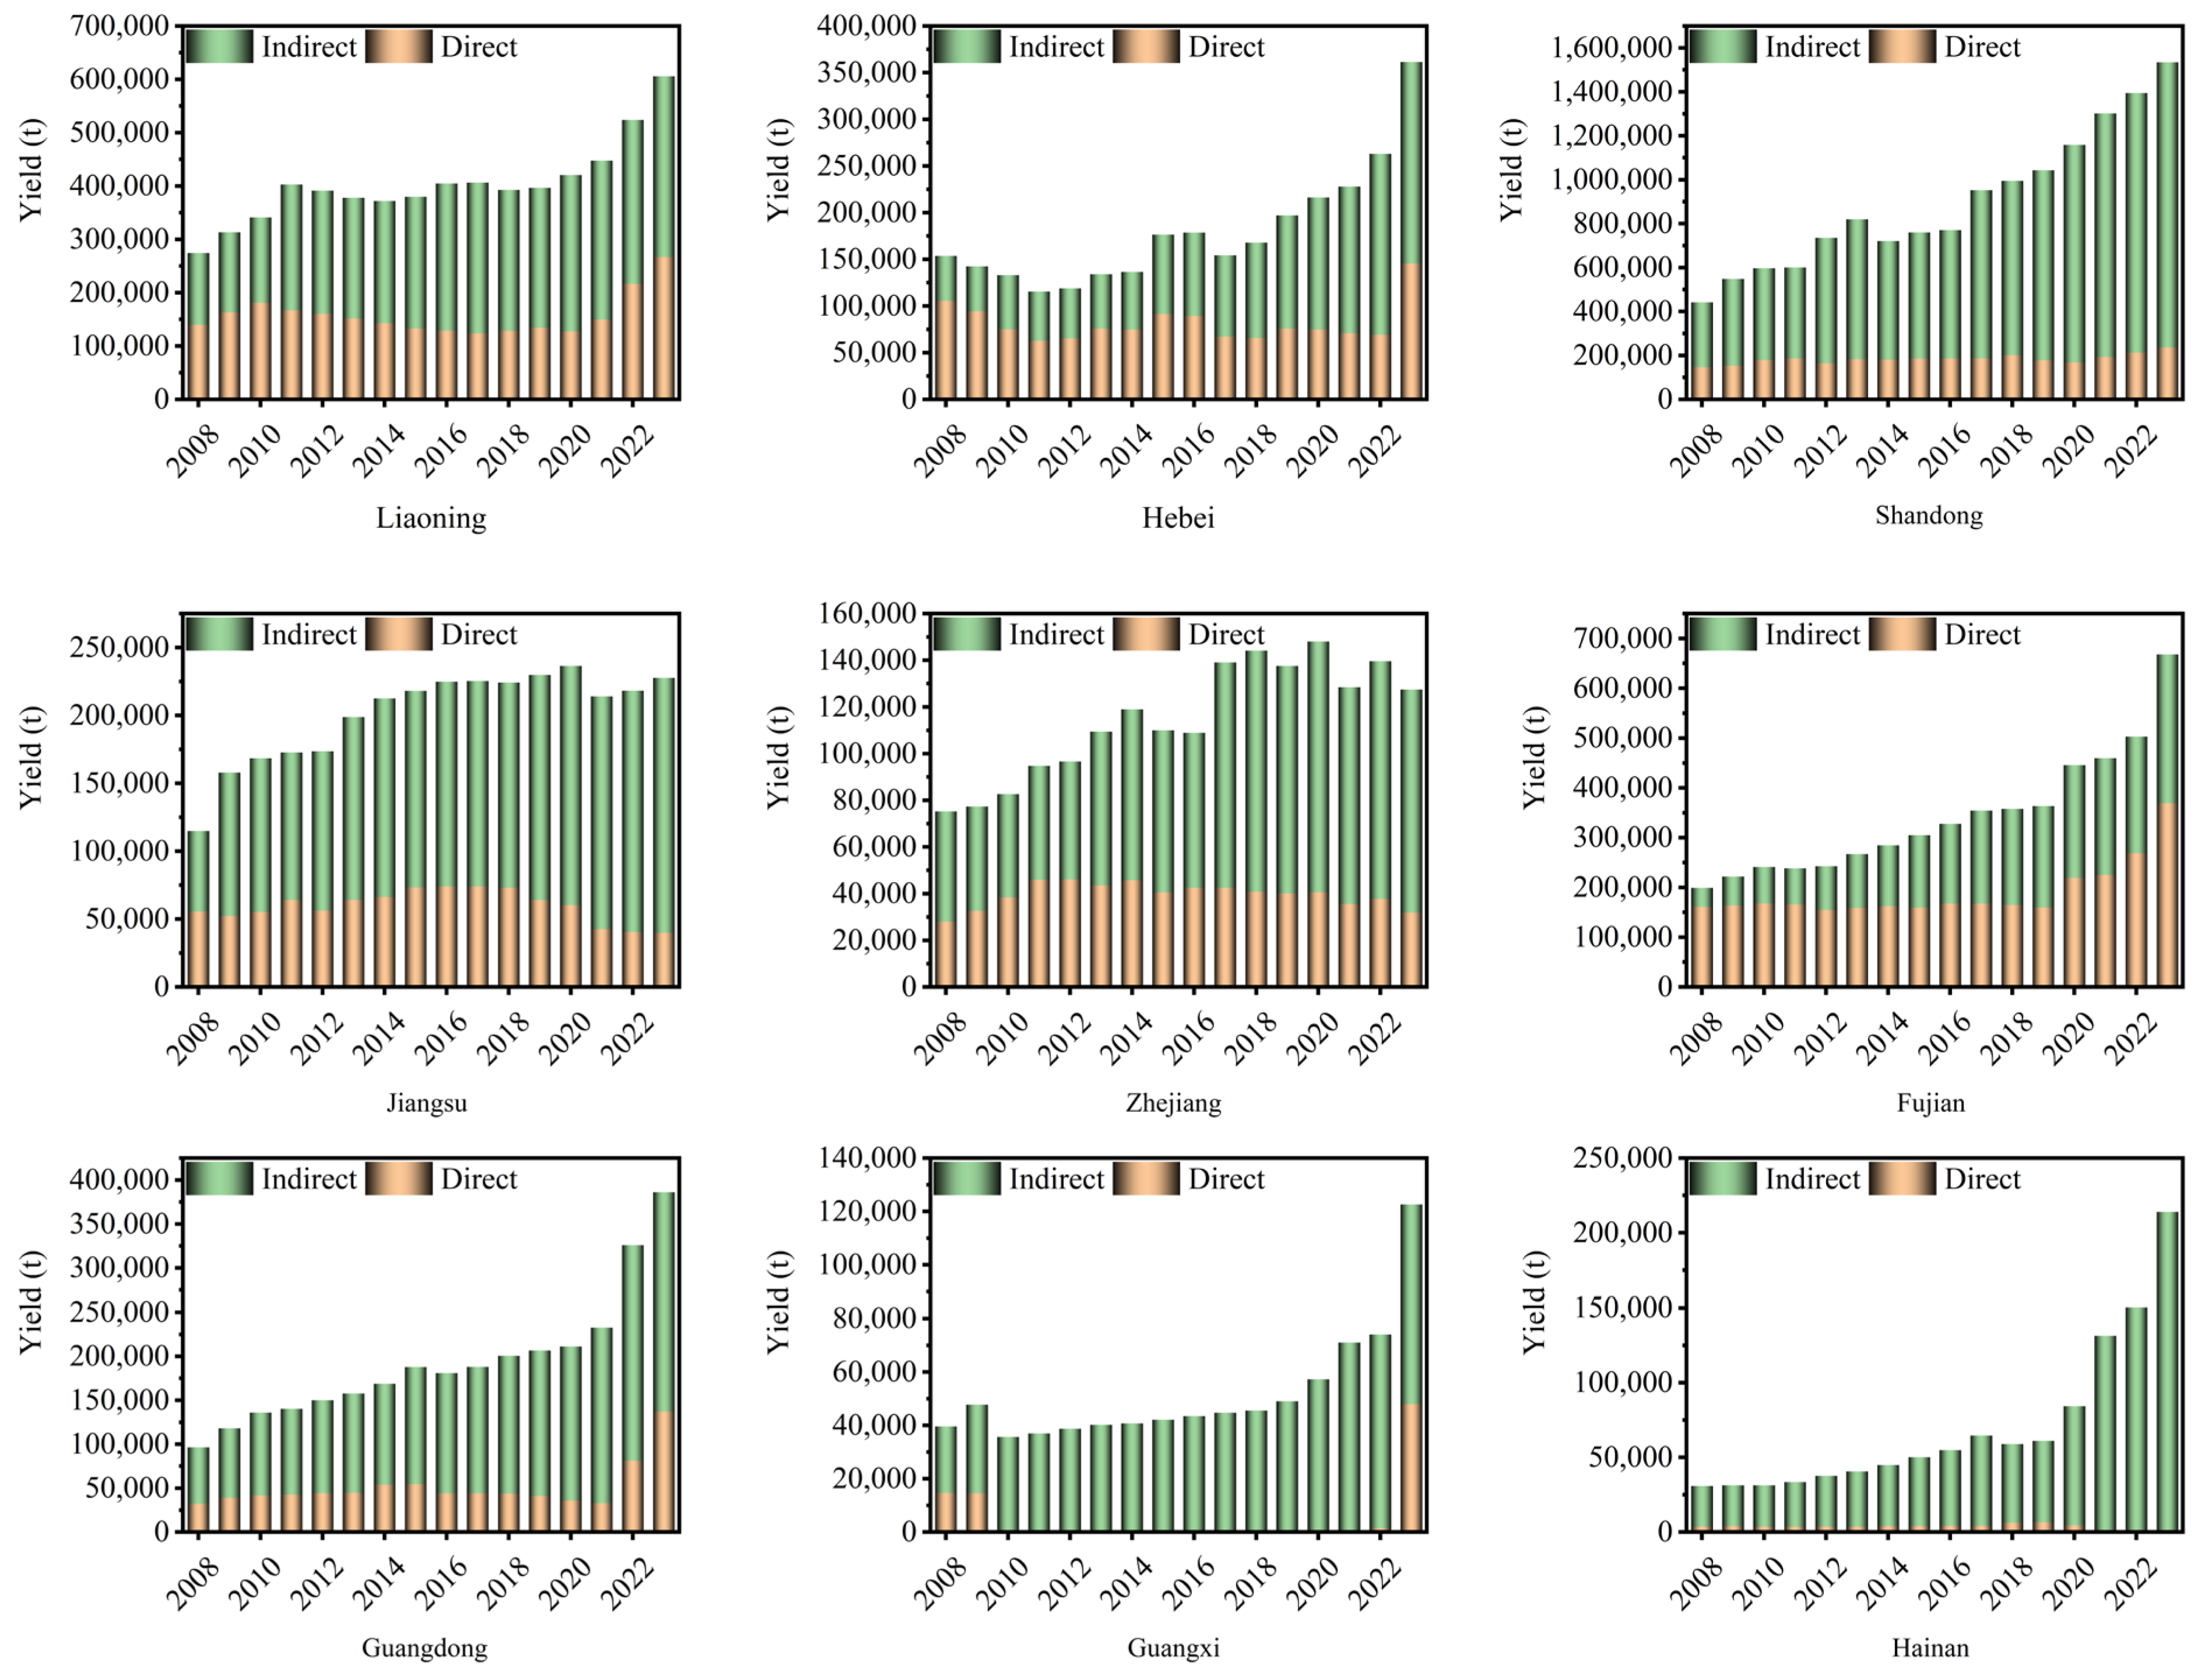
3.2.1. Spatiotemporal Evolution Analysis of Carbon Emissions from China’s Mariculture
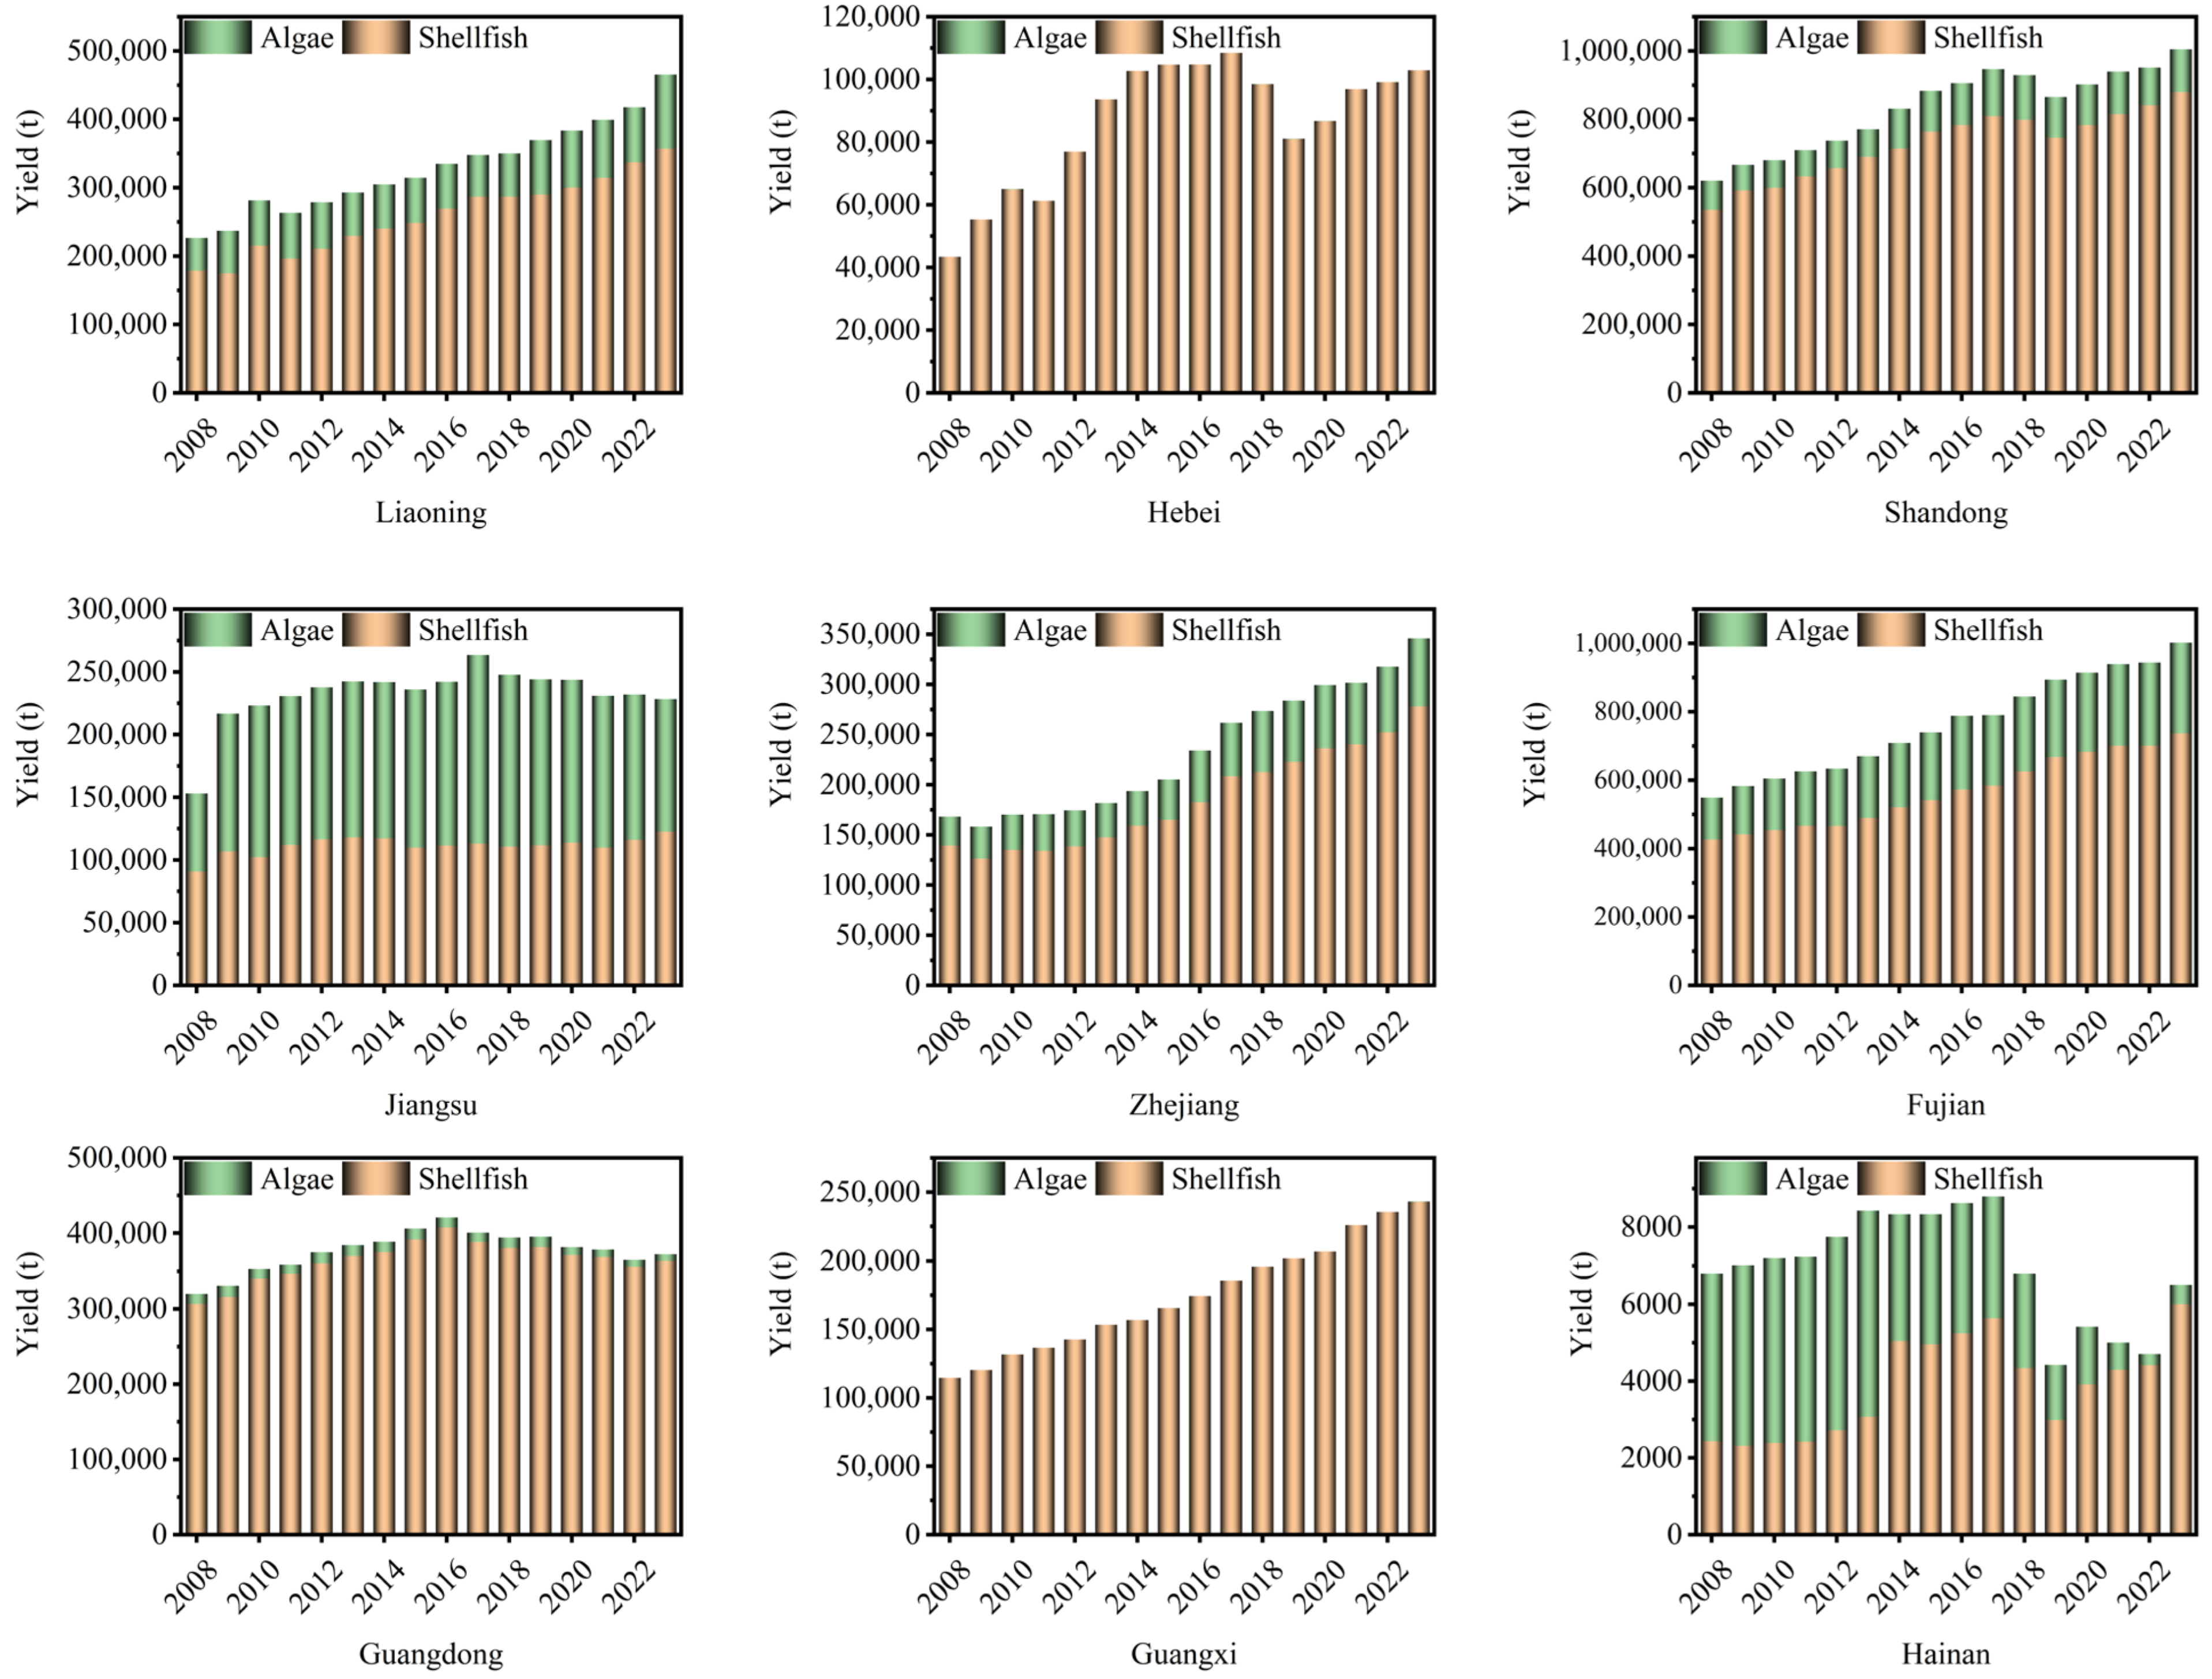
3.2.2. Spatiotemporal Evolution Analysis of Carbon Sinks in China’s Mariculture
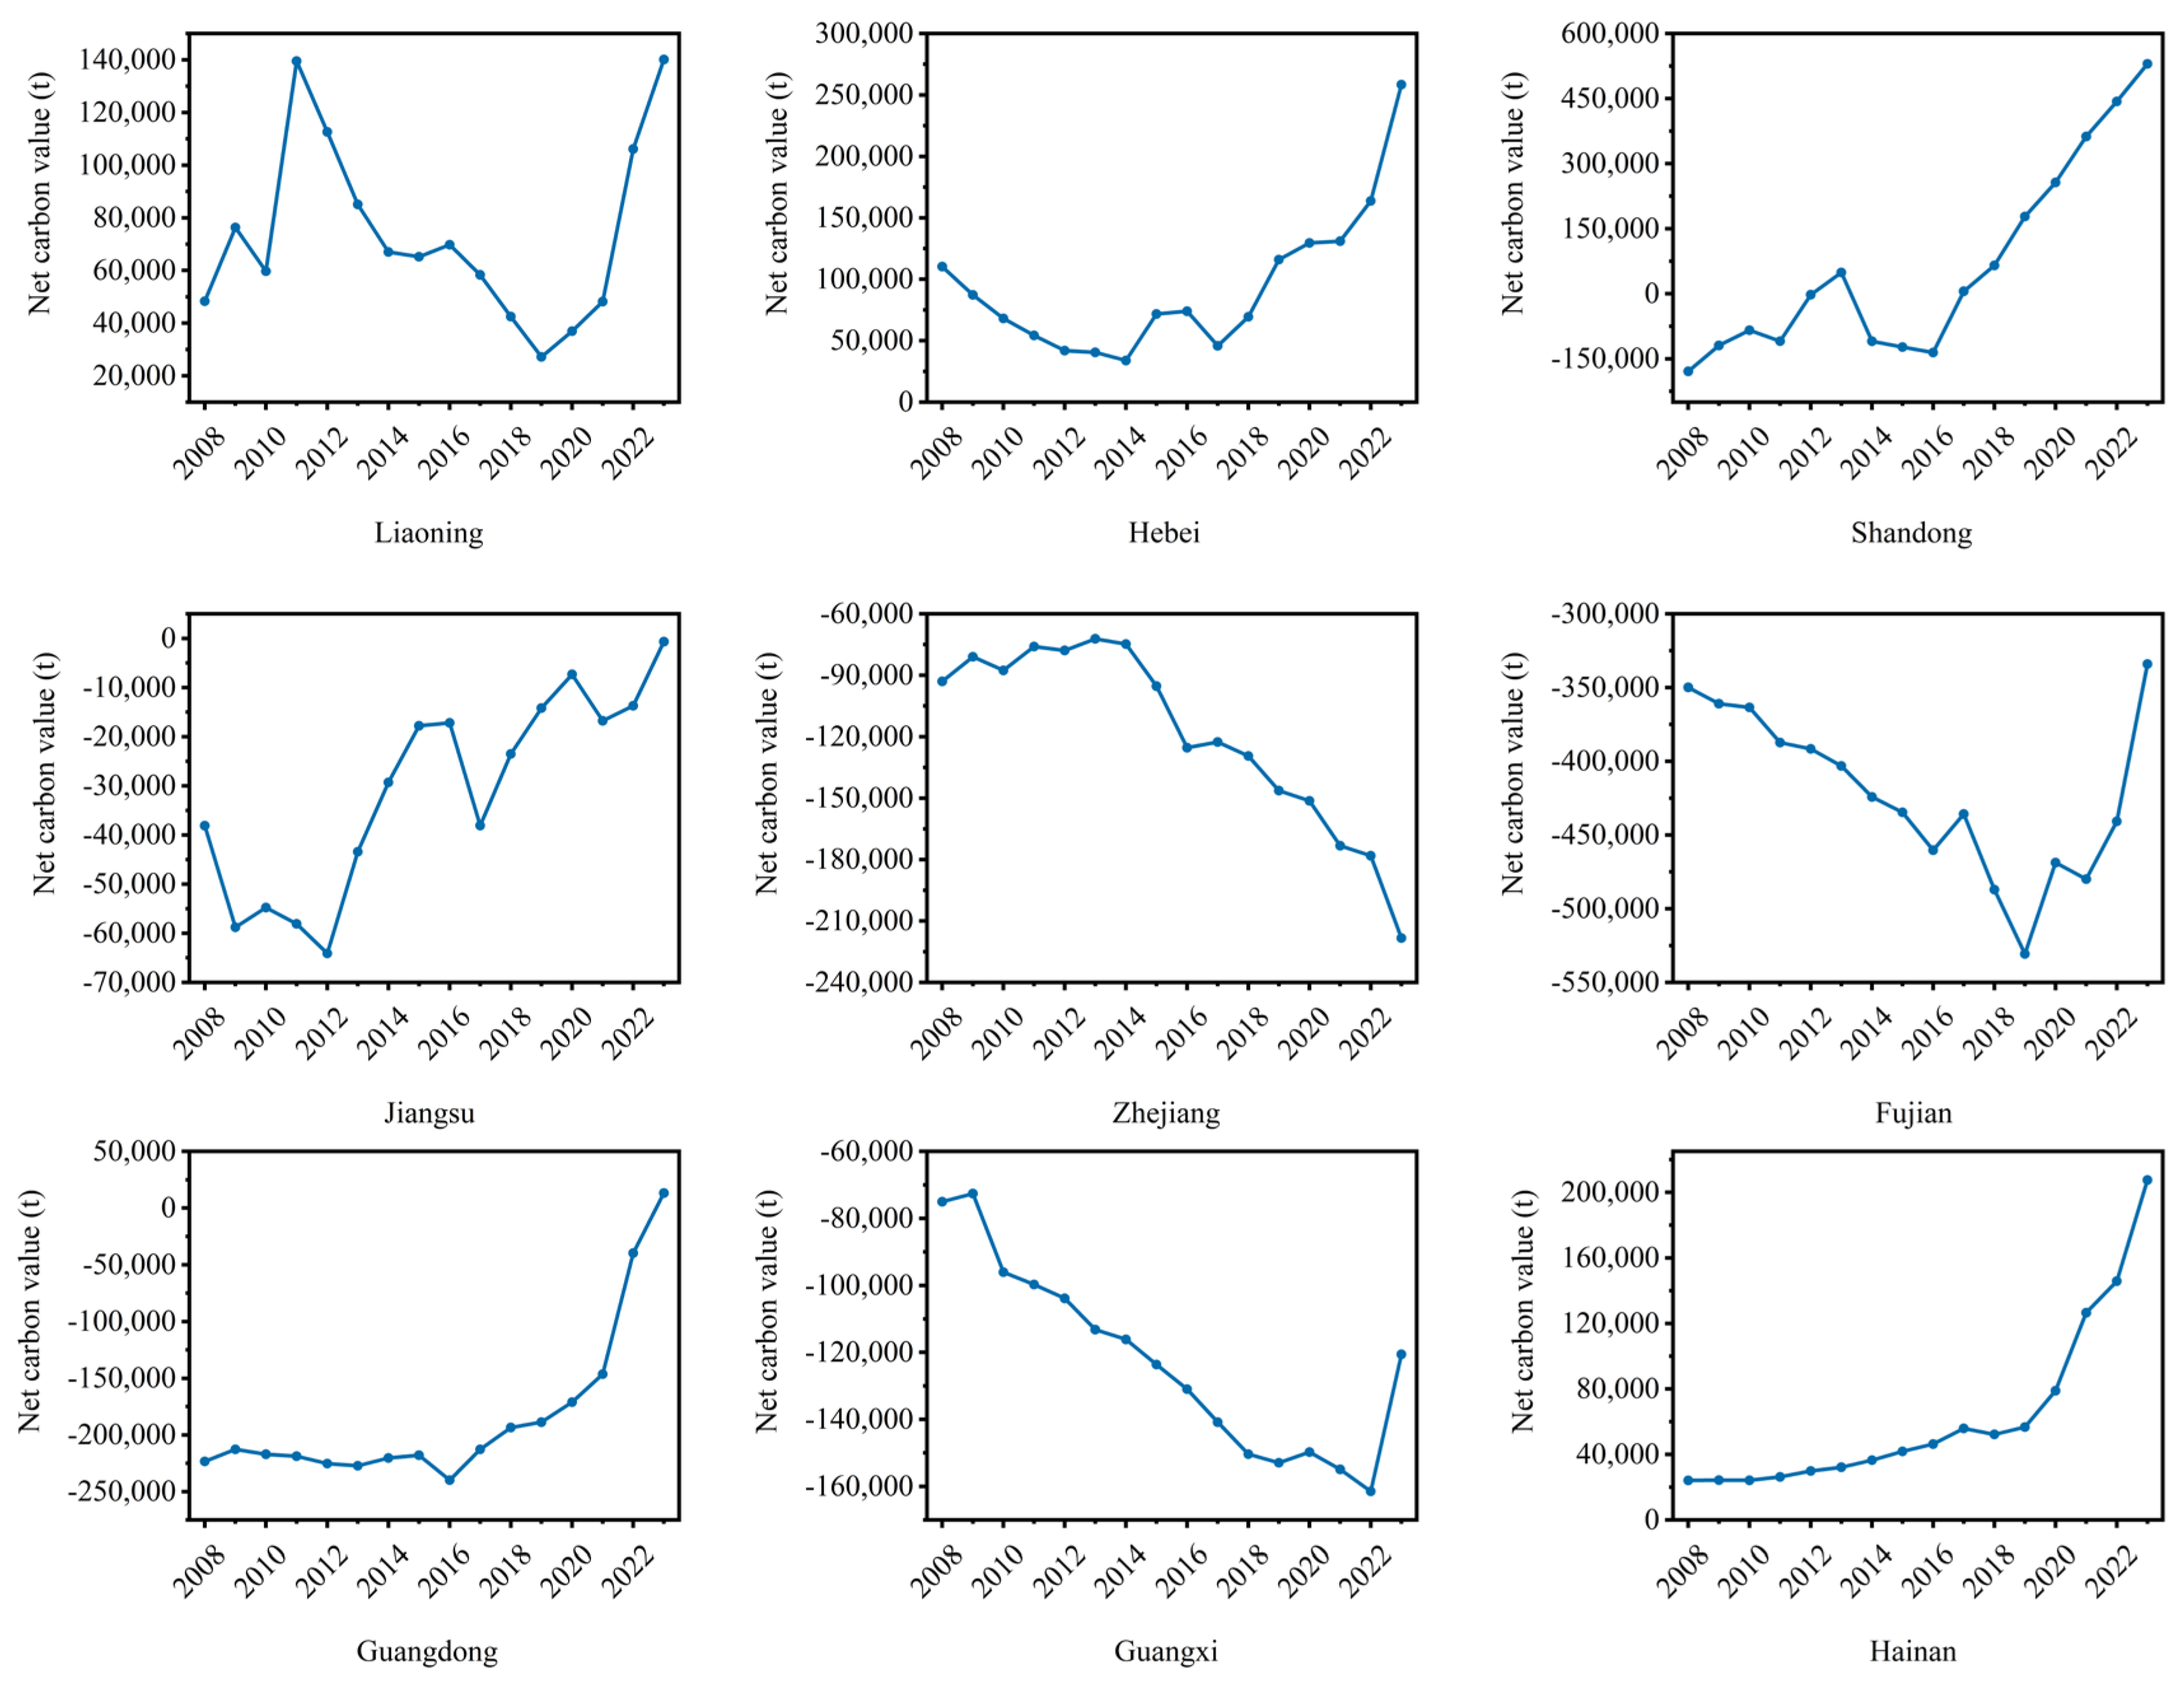
3.2.3. Spatiotemporal Evolution Analysis of Net Carbon Values in China’s Mariculture
4. Analysis of Influencing Factors on Carbon Emissions and Carbon Sinks from Mariculture in China
4.1. Variable Selection
4.2. Spatial Heterogeneity of Factors Influencing Carbon Emissions and Sinks
4.2.1. OLS Model and Results
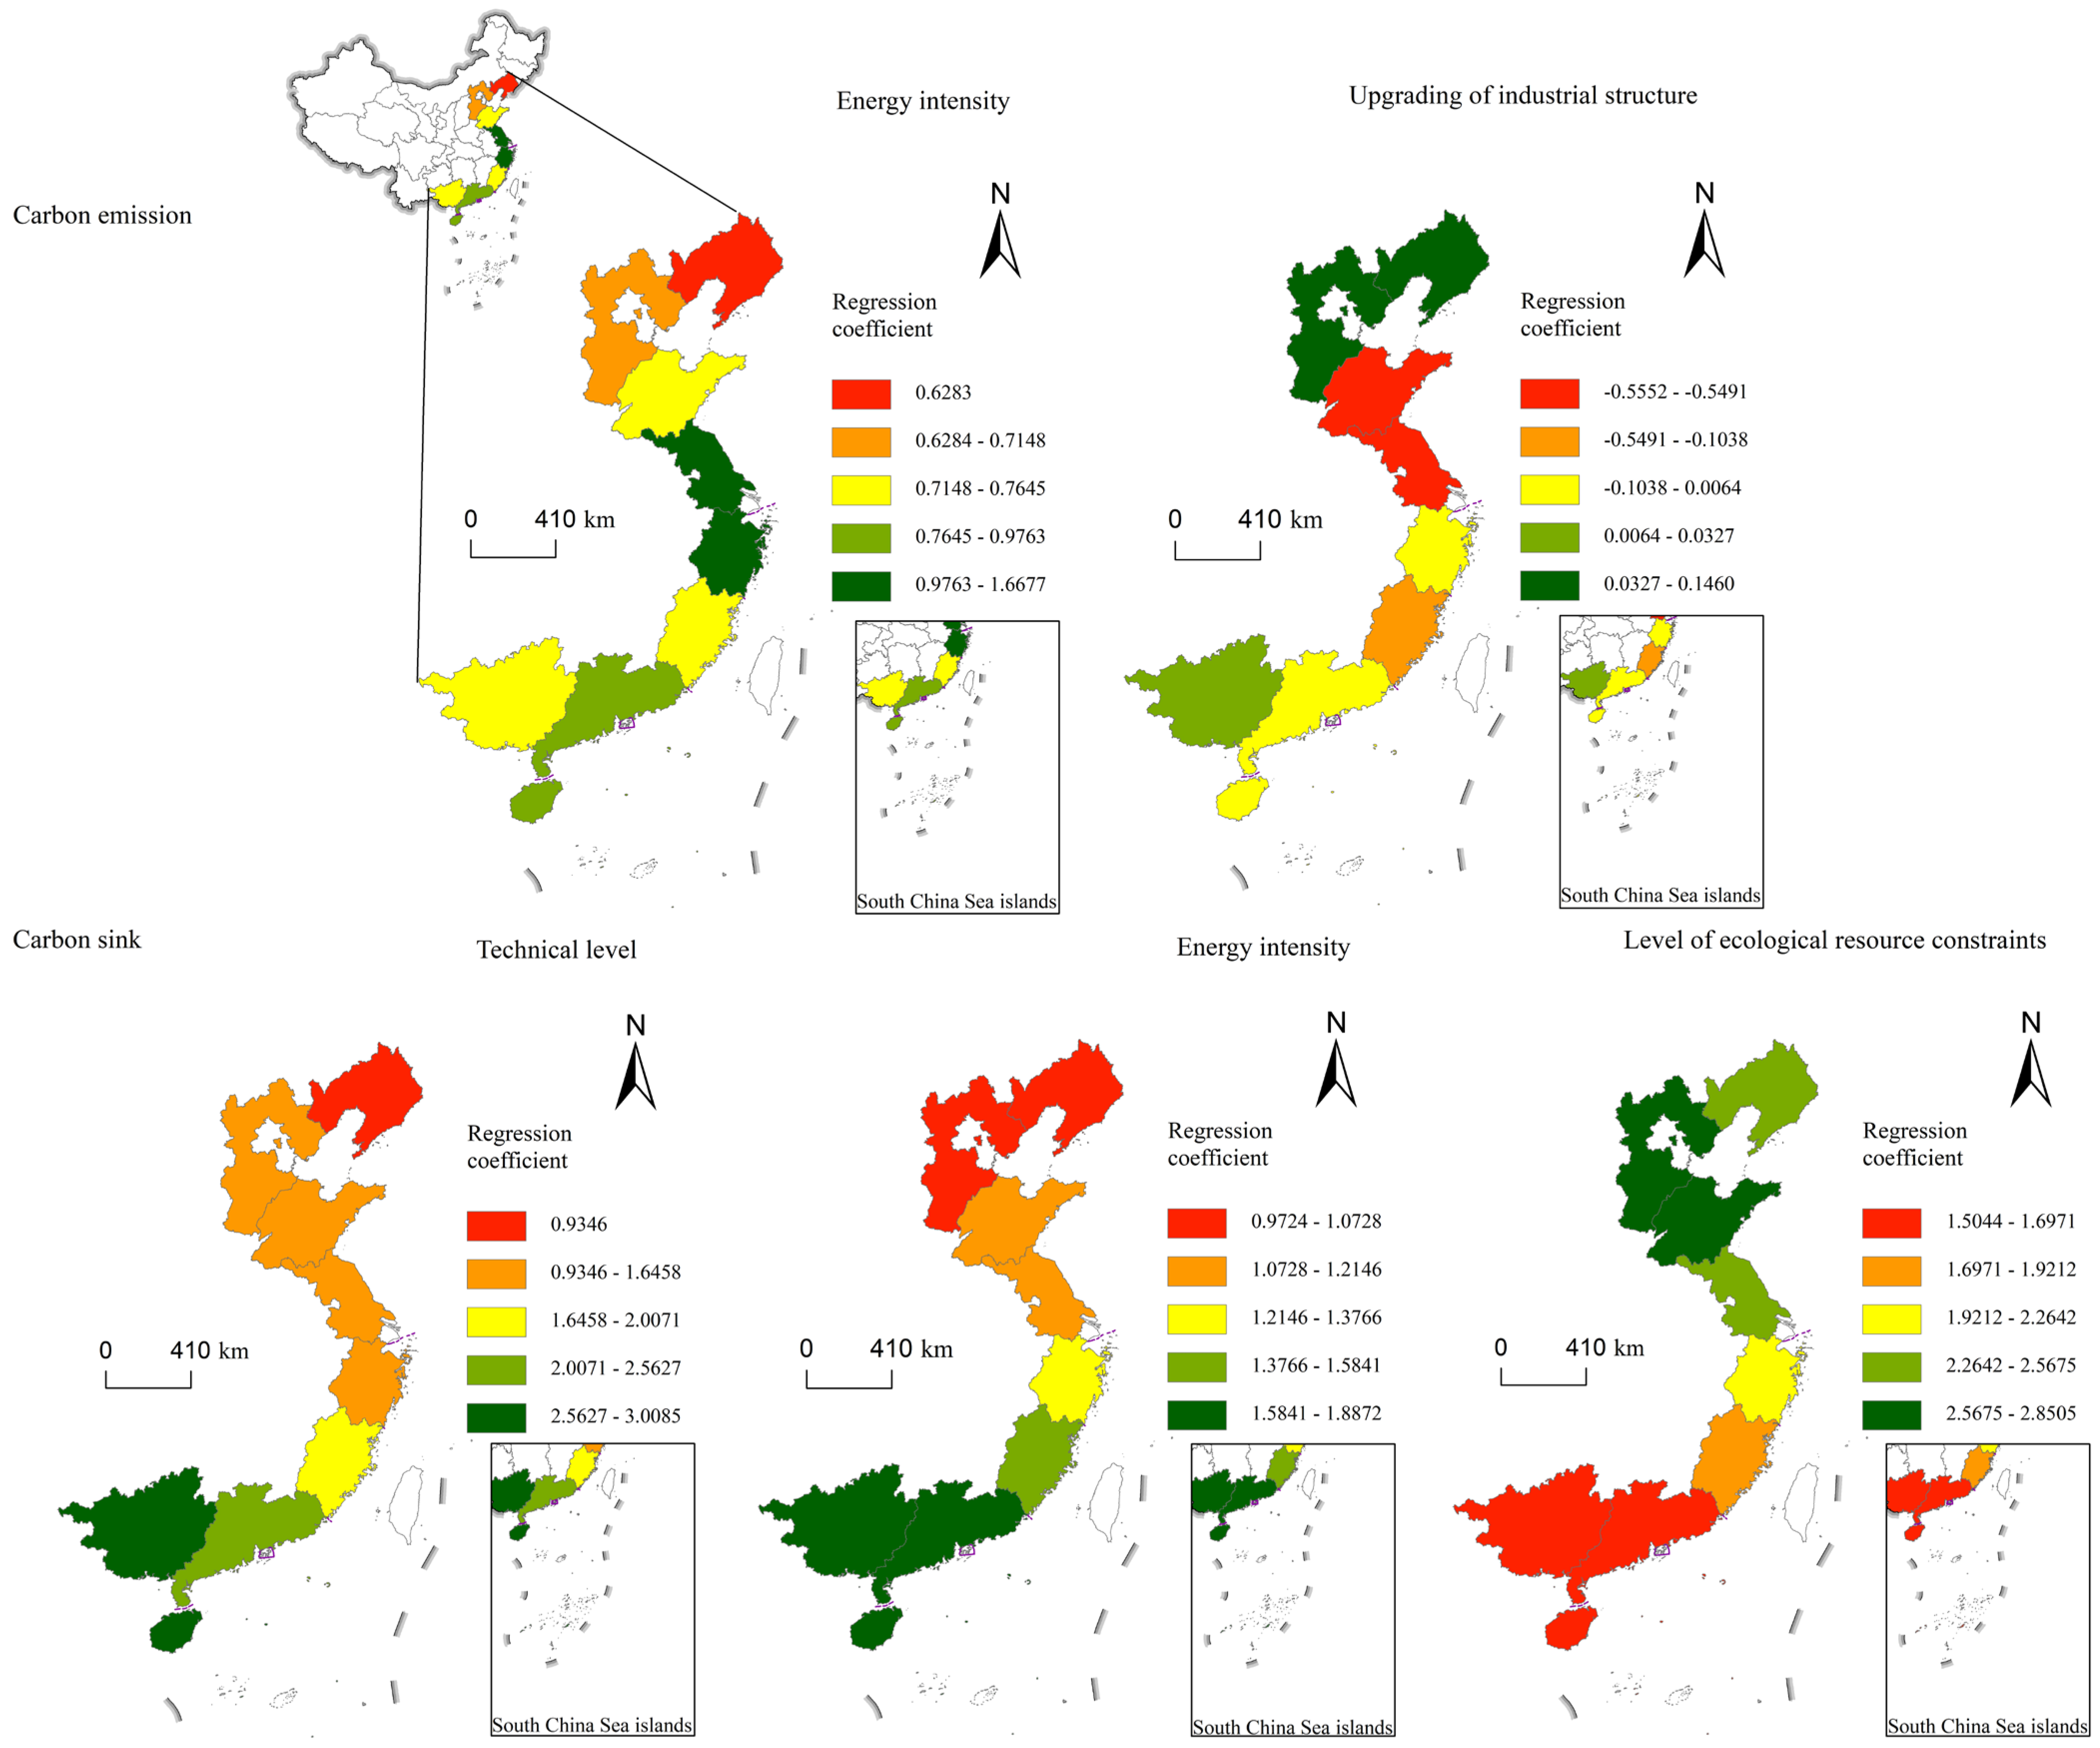
4.2.2. GWR Model and Results
4.2.3. Analysis and Discussion of Spatial Heterogeneity of Factors Influencing Carbon Emissions and Sinks
4.3. Spatial Spillover Effects of Factors Influencing Carbon Emissions and Sinks
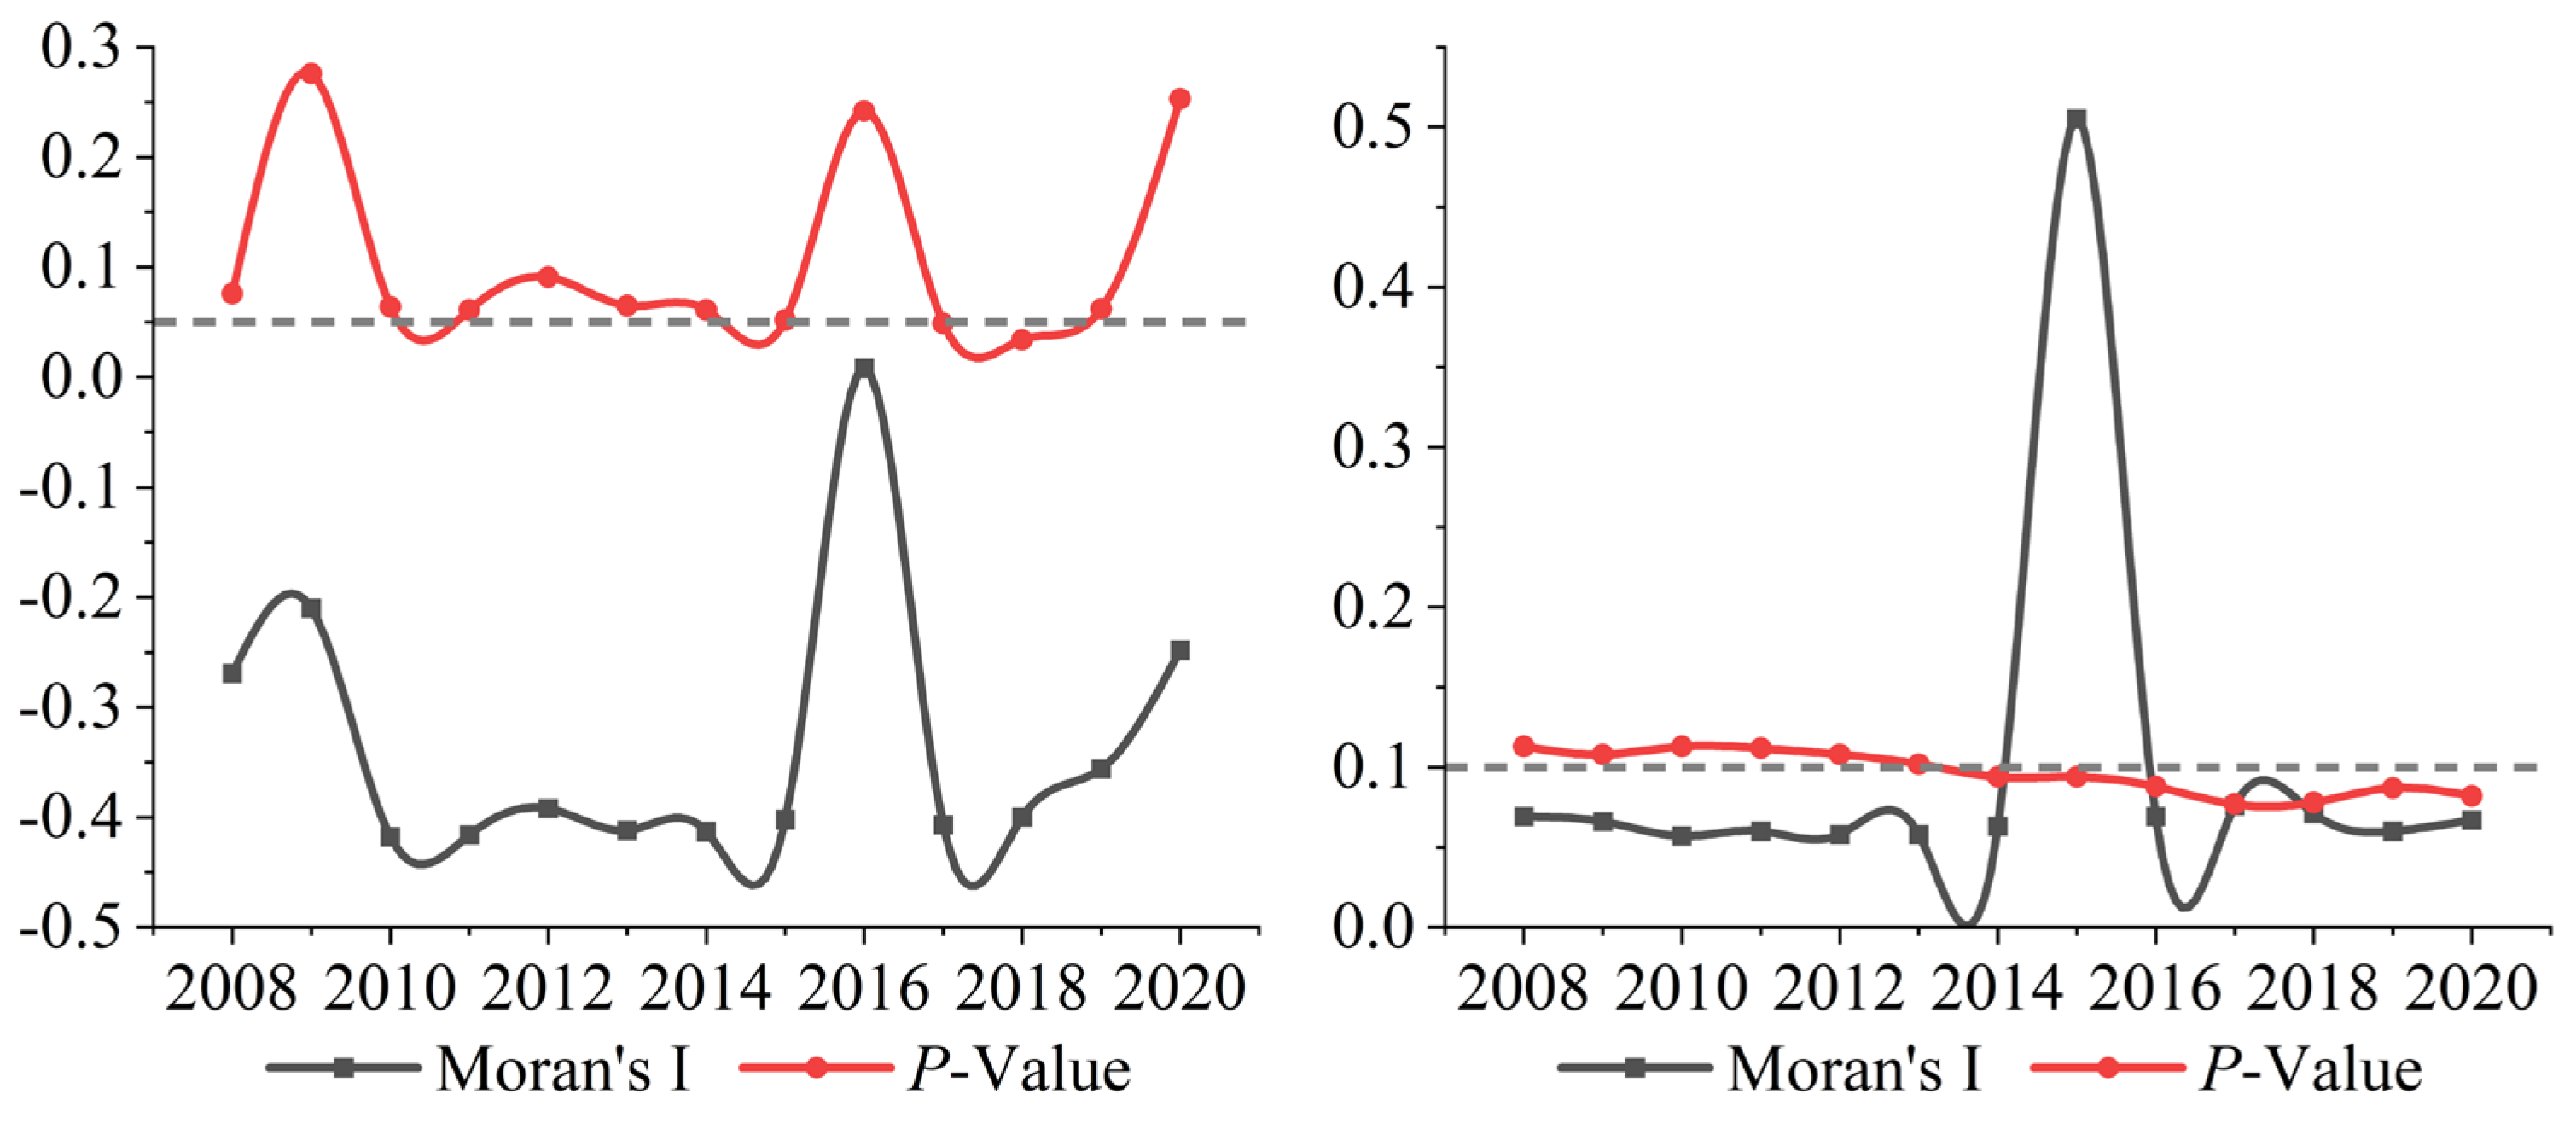
4.3.1. Autocorrelation Test Results
4.3.2. Model Applicability Tests
4.3.3. Analysis and Discussion of Spatial Spillover Effects of Factors Affecting Carbon Emissions and Sinks
5. Policy Recommendations
6. Conclusions and Prospects
6.1. Conclusions
6.2. Limitations and Future Research
Author Contributions
Funding
Institutional Review Board Statement
Informed Consent Statement
Data Availability Statement
Conflicts of Interest
References
- Chen, X.; Yu, Z.; Di, Q.; Wu, H. Assessing the marine ecological welfare performance of coastal regions in China and analysing its determining factors. Ecol. Indic. 2023, 147, 109942. [Google Scholar] [CrossRef]
- Zhou, Y.; Hao, F.; Meng, W.; Fu, J. Scenario analysis of energy-based low-carbon development in China. J. Environ. Sci. 2014, 26, 1631–1640. [Google Scholar] [CrossRef] [PubMed]
- Liu, F.; Zhang, Q.; van der A, R.J.; Zheng, B.; Tong, D.; Yan, L.; Zheng, Y.; He, K. Recent reduction in NOx emissions over China: Synthesis of satellite observations and emission inventories. Environ. Res. Lett. 2016, 11, 114002. [Google Scholar] [CrossRef]
- Jing, Q.; Bai, H.; Luo, W.; Cai, B.; Xu, H. A top-bottom method for city-scale energy-related CO2 emissions estimation: A case study of 41 Chinese cities. J. Clean. Prod. 2018, 202, 444–455. [Google Scholar] [CrossRef]
- Wang, H.; Chen, Z.; Wu, X.; Nie, X. Can a carbon trading system promote the transformation of a low-carbon economy under the framework of the porter hypothesis?—Empirical analysis based on the PSM-DID method. Energy Policy 2019, 129, 930–938. [Google Scholar] [CrossRef]
- Yu, S.; Horing, J.; Liu, Q.; Dahowski, R.; Davidson, C.; Edmonds, J.; Liu, B.; Mcjeon, H.; Mcleod, J.; Pralit, P.; et al. CCUS in China’s mitigation strategy: Insights from integrated assessment modeling. Int. J. Greenh. Gas Control 2019, 84, 204–218. [Google Scholar] [CrossRef]
- Zhang, H.; Zhang, X.; Yuan, J. Driving forces of carbon emissions in China: A provincial analysis. Environ. Sci. Pollut. Res. 2021, 28, 21455–21470. [Google Scholar] [CrossRef]
- Ma, X.; Yang, J.; Sun, D.; Zhang, R.; Xiao, X.; Xia, J. Fine allocation of sectoral carbon emissions at block scale and contribution of functional zones. Ecol. Inform. 2023, 78, 102293. [Google Scholar] [CrossRef]
- Chen, X.; Di, Q.; Hou, Z.; Yu, Z. Measurement of carbon emissions from marine fisheries and system dynamics simulation analysis: China’s northern marine economic zone case. Mar. Policy 2022, 145, 105279. [Google Scholar] [CrossRef]
- Peng, D.; Mu, Y.; Zhu, Y. Evaluating the level of coordinated development of fisheries economic growth and environmental quality in selected Chinese regions. Environ. Impact Assess. Rev. 2021, 89, 106605. [Google Scholar] [CrossRef]
- Feng, J.; Sun, L.; Yan, J. Carbon sequestration via shellfish farming: A potential negative emissions technology. Renew. Sustain. Energy Rev. 2023, 171, 113018. [Google Scholar] [CrossRef]
- Tsai, D.D.W.; Chen, P.; Chou, C.; Hsu, C.; Ramaraj, R. Carbon sequestration by alga ecosystems. Ecol. Eng. 2015, 84, 386–389. [Google Scholar] [CrossRef]
- Guan, H.; Sun, Z.; Wang, J. Decoupling analysis of net carbon emissions and economic growth of marine aquaculture. Sustainability 2022, 14, 5886. [Google Scholar] [CrossRef]
- Shi, X.; Xu, Y.; Dong, B.; Nishino, N. Mariculture carbon sequestration efficiency in China: Its measurement and socio-economic factor analysis. Sustain. Prod. Consum. 2023, 40, 101–121. [Google Scholar] [CrossRef]
- Luo, H.; Li, J.; Xie, S.; Yang, Y. Understanding and estimating the role of large-scale seaweed cultivation for carbon sequestration on a global scale over the past two decades. Sci. Total Environ. 2024, 955, 176966. [Google Scholar] [CrossRef]
- Liu, C.; Liu, G.; Casazza, M.; Yan, N.; Xu, L.; Hao, Y.; Franzese, P.; Yang, Z. Current status and potential assessment of China’s ocean carbon sinks. Environ. Sci. Technol. 2022, 56, 6584–6595. [Google Scholar] [CrossRef]
- Li, Z.; Zhang, L.; Wang, W.; Ma, M. Assessment of carbon emission and carbon sink capacity of China’s marine fishery under carbon neutrality target. J. Mar. Sci. Eng. 2022, 10, 1179. [Google Scholar] [CrossRef]
- Jia, D.; Liu, X.; Guan, X.; Guo, J.; Zhang, S.; Li, H.; Jin, Y.; Jun, S. Spatio-temporal differences and simulation studies of the carbon budget from fisheries in the northern marine economic circle of China. Front. Mar. Sci. 2024, 11, 1393659. [Google Scholar] [CrossRef]
- Wang, T.; Chuai, X.; Xiang, A.; Gu, Y.; Bie, M. Carbon budget and evaluation of marine industry in Jiangsu Province, China. Chin. J. Appl. Ecol. 2023, 34, 2527–2535. [Google Scholar]
- GB/T 20794-2006; Industrial Classification for Ocean Industries and Their Related Activities. Ministry of Natural Resources of the People’s Republic of China: Beijing, China, 2006.
- Guan, H.; Chen, Y.; Zhao, A. Carbon neutrality assessment and driving factor analysis of China’s offshore fishing industry. Water 2022, 14, 4112. [Google Scholar] [CrossRef]
- Zhang, Y.; Zhang, J.; Liang, Y.; Li, H.; Li, G.; Chen, X.; Zhao, P.; Jiang, Z.; Zou, D.; Liu, X.; et al. Carbon sequestration processes and mechanisms in coastal mariculture environments in China. Sci. China Earth Sci. 2017, 60, 2097–2107. [Google Scholar] [CrossRef]
- Jia, R.; Li, P.; Chen, C.; Liu, L.; Li, Z. Shellfish-algal systems as important components of fisheries carbon sinks: Their contribution and response to climate change. Environ. Res. 2023, 224, 115511. [Google Scholar] [CrossRef]
- Morris, J.; Humphreys, M. Modelling seawater carbonate chemistry in shellfish aquaculture regions: Insights into CO2 release associated with shell formation and growth. Aquaculture 2019, 501, 338–344. [Google Scholar] [CrossRef]
- Thomsen, J.; Haynert, K.; Wegner, K.M.; Melzner, F. Impact of seawater carbonate chemistry on the calcification of marine bivalves. Biogeosciences 2015, 12, 4209–4220. [Google Scholar] [CrossRef]
- Wu, H.; Zou, D.; Gao, K. Impacts of increased atmospheric CO2 concentration on photosynthesis and growth of micro-and macro-algae. Sci. China Ser. C Life Sci. 2008, 51, 1144–1150. [Google Scholar] [CrossRef] [PubMed]
- Yang, Y.; Luo, H.; Wang, Q.; He, Z.; Long, A. Large-scale Cultivation of Seaweed is Effective Approach to Increase Marine Carbon Sequestration and Solve Coastal Environmental Problems. Bull. Chin. Acad. Sci. 2021, 36, 259–269. [Google Scholar]
- Xu, H.; Zhang, Z.; Zhang, J.; Liu, H.; Zhao, P.; Shi, R.; Wang, J.; He, Y. The research and development proposals on fishery energy saving and emission reduction in China. J. Fish. China 2011, 35, 472–480. [Google Scholar]
- Wu, J.; Li, B. Spatio-temporal evolutionary characteristics of carbon emissions and carbon sinks of marine industry in China and their time-dependent models. Mar. Policy 2022, 135, 104879. [Google Scholar] [CrossRef]
- Sun, K.; Cui, X.; Su, Z.; Wang, Y. Spatio-temporal evolution and influencing factors of the economic value for mariculture carbon sinks in China. Geogr. Res. 2020, 39, 2508–2520. [Google Scholar]
- Tang, Q.; Liu, H. Strategy for carbon sink and its amplification in marine fisheries. Strategy Stud. Chin. Acad. Eng. 2016, 18, 68–73. [Google Scholar]
- Zhang, Y.; Xu, M.; Chen, H.; Adams, J. Global Pattern of NPP to GPP Ratio Derived from MODIS Data: Effects of Ecosystem Type, Geographical Location and Climate. Glob. Ecol. Biogeogr. 2009, 18, 280–290. [Google Scholar] [CrossRef]
- Abdullah, M.I.; Fredriksen, S. Production, Respiration and Exudation of Dissolved Organic Matter by the Kelp Laminaria Hyperborea along the West Coast of Norway. J. Mar. Biol. Assoc. UK 2004, 84, 887–894. [Google Scholar] [CrossRef]
- Krause-Jensen, D.; Duarte, C.M. Substantial Role of Macroalgae in Marine Carbon Sequestration. Nat. Geosci. 2016, 9, 737–742. [Google Scholar] [CrossRef]
- Cai, L.; Fang, J.; Liang, X. Natural Sedimentation in Large-Scale Aquaculture Areas of Sungo Bay, North China Sea. J. Fish. Sci. China 2003, 10, 305–310. (In Chinese) [Google Scholar]
- Xia, B.; Cui, Y.; Chen, B.; Cui, Z.; Qu, K.; Ma, F. Carbon and Nitrogen Isotopes Analysis and Sources of Organic Matter in Surface Sediments from the Sanggou Bay and Its Adjacent Areas, China. Acta Oceanol. Sin. 2014, 33, 48–57. [Google Scholar] [CrossRef]
- Xue, M.; Wang, C.; Zhao, J.; Li, M. Spatial Differentiation Pattern and Influencing Factors of Tourism Economy in the Yellow River Basin. Econ. Geogr. 2020, 40, 19–27. [Google Scholar]
- Kashki, A.; Karami, M.; Zandi, R.; Roki, Z. Evaluation of the effect of geographical parameters on the formation of the land surface temperature by applying OLS and GWR, A case study Shiraz City, Iran. Urban Clim. 2021, 37, 100832. [Google Scholar] [CrossRef]
- Lu, S.; Xiong, J. Spatial and temporal variation and influencing factors of agricultural green efficiency in the Yangtze River Economic Belt based on GWR. Sci. Geogr. Sin. 2023, 43, 337–348. [Google Scholar] [CrossRef]
- Foody, G.M. Geographical weighting as a further refinement to regression modelling: An example focused on the NDVI–rainfall relationship. Remote Sens. Environ. 2003, 88, 283–293. [Google Scholar] [CrossRef]
- Pribadi, D.O.; Pauleit, S. Peri-urban agriculture in Jabodetabek Metropolitan Area and its relationship with the urban socioeconomic system. Land Use Policy 2016, 55, 265–274. [Google Scholar] [CrossRef]
- Anselin, L. Spatial Econometrics: Methods and Models; Springer Science & Business Media: Dordrecht, The Netherlands, 1988. [Google Scholar]
- LeSage, J.; Pace, R.K. Introduction to Spatial Econometrics; Chapman and Hall/CRC: New York, NY, USA, 2009. [Google Scholar]
- Han, Y.; Zhang, Y.; Gao, X. Building a Diversified Food Supply System: Potentials and Propostal for China’s Fishery Development. Issues Agric. Econ. 2024, 108–119. [Google Scholar] [CrossRef]
- Mao, W.; Wang, W.; Du, J. Study on the Energy-saving Effect of Marine Green Aquaculture in China. J. Agrotech. Econ. 2024, 106–123. [Google Scholar] [CrossRef]
- Li, X.; Zhao, H.; Gu, B.; Chen, Y. Carbon sinks/sources’ spatiotemporal heterogeneity and their spatial response to economic-social factors in relatively developed regions: A case of China’s coastal area. J. Environ. Manag. 2024, 354, 120494. [Google Scholar] [CrossRef]
- Tian, P.; Wang, H.; Li, J.; Liu, Y.; Zhang, H.; Zhong, J.; Gong, H. Spatiotemporal variation characteristics and system dynamic simulation of China’s marine fishery carbon emissions. Res. Sci. 2023, 45, 1074–1090. [Google Scholar] [CrossRef]
- Wang, B.; Zhai, L.; Han, L.; Zhang, H. Industrial restructuring, changes in marine spatial resources and economic growth in marine fisheries. Stat. Decis. 2020, 36, 96–100. [Google Scholar]
- Yu, L.; Jiang, Q. The impact of heterogeneous environmental regulation on the green development of fisheries in China. Sci. Geogr. Sin. 2024, 44, 319–328. [Google Scholar]
- Zeng, B. Spatial Pattern and Influencing Factors of Carbon Emission Efficiency of Fishery Economy in the Yangtze River Economic Belt. Contemp. Econ. Manag. 2019, 41, 44–48. [Google Scholar]
- Zhang, Y.; Ji, J. The Decoupling and Influencing Factors Analysis of Blue Granary Eco-Economy system. J. Agrotech. Econ. 2020, 94–106. [Google Scholar]
- Su, Y.; Ning, L. “Marine Food System”: Study on the Dynamic Relationship among Marine Ecological Resources, Fishery Science and Technology Innovation and Fishery Economic Development—Empirical Evidence of PVAR Model Based on Panel Data. Ecol. Econ. 2022, 38, 99–104. [Google Scholar]
- Dong, J.; Meng, Y.; Ding, Z. Spatial differentiation and influencing factors of innovation output at county scale in China. World Reg. Stud. 2023, 32, 88–102. [Google Scholar]
- Deng, J.; Chen, T.; Zhang, Y. Effect of Collaborative Innovation on High-Quality Economic Development in Beijing–Tianjin–Hebei Urban Agglomeration—An Empirical Analysis Based on the Spatial Durbin Model. Mathematics 2023, 11, 1909. [Google Scholar] [CrossRef]

| Year | Liaoning | Hebei | Shandong | Jiangsu | Zhejiang | Fujian | Guangdong | Guangxi | Hainan | Total Area (ha) |
|---|---|---|---|---|---|---|---|---|---|---|
| 2008 | 411,556 | 109,755 | 426,217 | 160,089 | 96,139 | 120,704 | 189,717 | 47,380 | 12,983 | 1,574,540 |
| 2009 | 630,700 | 121,013 | 441,403 | 172,754 | 94,514 | 133,942 | 194,766 | 50,670 | 15,247 | 1,855,009 |
| 2010 | 763,101 | 123,810 | 500,946 | 192,426 | 93,905 | 137,636 | 199,258 | 51,287 | 14,529 | 2,076,898 |
| 2011 | 751,387 | 134,264 | 512,126 | 201,073 | 90,839 | 142,315 | 203,410 | 52,212 | 14,646 | 2,102,272 |
| 2012 | 813,035 | 134,682 | 523,705 | 199,352 | 89,747 | 145,486 | 201,834 | 53,249 | 15,845 | 2,176,935 |
| 2013 | 942,050 | 117,928 | 546,814 | 193,807 | 89,358 | 154,453 | 197,198 | 54,001 | 16,791 | 2,312,400 |
| 2014 | 928,503 | 122,434 | 548,487 | 188,657 | 88,178 | 161,418 | 193,691 | 54,233 | 16,691 | 2,302,292 |
| 2015 | 933,068 | 117,533 | 563,198 | 181,829 | 85,881 | 166,075 | 194,861 | 55,015 | 17,138 | 2,314,598 |
| 2016 | 698,400 | 124,800 | 604,800 | 185,480 | 78,701 | 153,000 | 166,200 | 45,400 | 32,323 | 2,089,104 |
| 2017 | 698,400 | 107,583 | 610,377 | 192,390 | 75,954 | 155,739 | 161,690 | 47,022 | 31,715 | 2,080,870 |
| 2018 | 693,190 | 111,404 | 570,857 | 186,641 | 80,924 | 162,464 | 165,614 | 47,844 | 21,372 | 2,040,310 |
| 2019 | 661,817 | 107,041 | 561,501 | 179,951 | 82,019 | 163,713 | 164,990 | 49,822 | 20,510 | 1,991,364 |
| 2020 | 650,719 | 105,341 | 580,350 | 177,629 | 82,535 | 163,144 | 164,719 | 52,277 | 17,595 | 1,994,309 |
| 2021 | 647,606 | 104,185 | 608,376 | 171,106 | 81,466 | 164,641 | 166,805 | 64,255 | 15,881 | 2,024,321 |
| 2022 | 677,201 | 105,587 | 617,464 | 172,188 | 83,439 | 167,953 | 166,596 | 67,393 | 15,594 | 2,073,415 |
| 2023 | 773,974 | 105,022 | 646,026 | 171,452 | 84,255 | 177,321 | 172,133 | 69,075 | 14,673 | 2,213,931 |
| Parameters | Coefficient | T Value | p Value | Standard Deviation | VIF |
|---|---|---|---|---|---|
| Energy intensity | 0.790 | 9.091 | 0.000 * | 0.087 | 1.053 |
| Upgrading of industrial structure | −0.150 | −2.399 | 0.000 * | 0.063 | 1.053 |
| R2 | 0.421 | ||||
| Adjusted R2 | 0.411 | ||||
| Join F(P) | 0.000 * | ||||
| Jarque-Bera Test | 8.916 | ||||
| AICc | 253.188 |
| Parameters | Coefficient | T Value | p Value | Standard Deviation | VIF |
|---|---|---|---|---|---|
| Technical level | 2.157 | 6.139 | 0.000 * | 0.351 | 1.370 |
| Industrial structure | 0.597 | 0.559 | 0.480 | 1.068 | 2.899 |
| Energy intensity | 1.402 | 8.204 | 0.000 * | 0.171 | 3.395 |
| Level of ecological resource constraints | 2.426 | 4.344 | 0.002 * | 0.559 | 1.150 |
| R2 | 0.691 | ||||
| Adjusted R2 | 0.680 | ||||
| Join F(P) | 0.000 * | ||||
| Jarque-Bera Test | 2.216 | ||||
| AICc | 276.735 |
| Parameters | Bandwidth | Residual Squares | Sigma | AICc | R2 | Adjusted R2 |
|---|---|---|---|---|---|---|
| Value | 0.115 | 2.242 | 0.138 | −92.491 | 0.977 | 0.976 |
| Parameters | Bandwidth | Residual Squares | Sigma | AICc | R2 | Adjusted R2 |
|---|---|---|---|---|---|---|
| Value | 0.433 | 47.058 | 0.634 | 242.818 | 0.780 | 0.774 |
| Test Item | Test Value | p-Value |
|---|---|---|
| LM (SAR) | 96.484 | 0.000 |
| Robust LM (SAR) | 19.519 | 0.000 |
| LM (SEM) | 79.725 | 0.000 |
| Robust LM (SEM) | 2.760 | 0.097 |
| Hausman (Fixed Effect) | 8.23 | 0.016 |
| Wald (SAR) | 29.25 | 0.000 |
| Wald (SEM) | 8.17 | 0.017 |
| LR (SAR) | 27.01 | 0.000 |
| LR (SEM) | 21.98 | 0.000 |
| Test Item | Test Value | p-Value |
|---|---|---|
| LM (SAR) | 70.222 | 0.000 |
| Robust LM (SAR) | 5.153 | 0.000 |
| LM (SEM) | 82.310 | 0.000 |
| Robust LM (SEM) | 17.241 | 0.097 |
| Hausman (Fixed Effect) | 123.26 | 0.016 |
| Wald (SAR) | 25.87 | 0.000 |
| Wald (SEM) | 27.53 | 0.017 |
| LR (SAR) | 61.29 | 0.000 |
| LR (SEM) | 97.39 | 0.000 |
| Variables | Local Effect | Neighborhood Effect | Total Effect |
|---|---|---|---|
| Energy intensity | 0.671 *** | 0.581 *** | 1.252 *** |
| (6.95) | (2.84) | (7.03) | |
| Upgrading of industrial structure | −0.280 *** (−4.22) | −0.460 *** (−4.92) | −0.740 *** (−5.95) |
| rho | −0.551 *** | ||
| (−3.81) | |||
| sigma2_e | 0.339 *** | ||
| (−7.31) | |||
| Observations | 117 | ||
| R-squared | 0.403 |
| Variables | Local Effect | Neighborhood Effect | Total Effect |
|---|---|---|---|
| Technical level | 7.834 *** | −4.893 *** | 2.941 |
| (7.38) | (−2.93) | (1.36) | |
| Energy intensity | 1.432 *** | 1.203 *** | 2.635 *** |
| (16.09) | (5.66) | (11.75) | |
| Level of ecological resource constraints | 3.399 *** (8.86) | 0.209 (0.27) | 3.608 *** (3.91) |
| rho | −0.484 *** | ||
| (−3.54) | |||
| sigma2_e | 0.195 *** | ||
| (−8.07) | |||
| Observations | 117 | ||
| R-squared | 0.781 |
Disclaimer/Publisher’s Note: The statements, opinions and data contained in all publications are solely those of the individual author(s) and contributor(s) and not of MDPI and/or the editor(s). MDPI and/or the editor(s) disclaim responsibility for any injury to people or property resulting from any ideas, methods, instructions or products referred to in the content. |
© 2025 by the authors. Licensee MDPI, Basel, Switzerland. This article is an open access article distributed under the terms and conditions of the Creative Commons Attribution (CC BY) license (https://creativecommons.org/licenses/by/4.0/).
Share and Cite
Zeng, H.; Wu, X.; Chen, X.; Wang, H. Measurement, Spatiotemporal Evolution, and Spatial Spillover Effects of Carbon Sinks and Emissions from Shellfish and Algae Mariculture in China. Fishes 2025, 10, 301. https://doi.org/10.3390/fishes10070301
Zeng H, Wu X, Chen X, Wang H. Measurement, Spatiotemporal Evolution, and Spatial Spillover Effects of Carbon Sinks and Emissions from Shellfish and Algae Mariculture in China. Fishes. 2025; 10(7):301. https://doi.org/10.3390/fishes10070301
Chicago/Turabian StyleZeng, Han, Xuexue Wu, Xiaoyu Chen, and Haohan Wang. 2025. "Measurement, Spatiotemporal Evolution, and Spatial Spillover Effects of Carbon Sinks and Emissions from Shellfish and Algae Mariculture in China" Fishes 10, no. 7: 301. https://doi.org/10.3390/fishes10070301
APA StyleZeng, H., Wu, X., Chen, X., & Wang, H. (2025). Measurement, Spatiotemporal Evolution, and Spatial Spillover Effects of Carbon Sinks and Emissions from Shellfish and Algae Mariculture in China. Fishes, 10(7), 301. https://doi.org/10.3390/fishes10070301