Article

Insights into the Process of Fish Diversity Pattern Changes and the Current Status of Spatiotemporal Dynamics in the Three Gorges Reservoir Area Using eDNA

by
Jiaxin Huang
1,
Yufeng Zhang
1,
Xiaohan Dong
1,
Xinxin Zhou
1,
Zhihao Liu
1,
Qiliang Chen
1,
Fan Chen
2,* and
Yanjun Shen
1,*
1
Laboratory of Water Ecological Health and Environmental Safety, Chongqing Normal University, Chongqing 401331, China
2
Hubei Skilled Talents Training Research Center, Changjiang Polytechnic, Wuhan 430074, China
*
Authors to whom correspondence should be addressed.
Fishes 2025, 10(6), 295; https://doi.org/10.3390/fishes10060295
Submission received: 9 April 2025 / Revised: 11 June 2025 / Accepted: 16 June 2025 / Published: 18 June 2025

Abstract

:
The ecological consequences of the construction and operation of the Three Gorges Reservoir, particularly its unique operation strategy of storing clear water and releasing turbid water, exerts a profound influence on the composition and dynamics of local fish communities. To date, detailed and comprehensive research on seasonal changes in the fish community across the entire reservoir remains scarce. This study aims to fill this research gap by systematically investigating fish diversity through a comprehensive assessment of six main river reaches and eight major tributaries. The investigation employs environmental DNA (eDNA) technology across three critical life-cycle stages: breeding, feeding, and overwintering periods. A total of 124 fish species were recorded, comprising 10 orders, 20 families, and 80 genera. The comparative analyses of historical data suggest a significant decline in lotic and endemic fish populations, accompanied by a concurrent increase in lentic, eurytopic, and non-native fish species. Notably, the composition of fish communities exhibited similarities between breeding and overwintering periods. This study highlights the occurrence of significant seasonal fluctuations in the fish communities, showing a preference for reservoir tails and tributaries as optimal habitats. Water temperature has a predominant influence on structuring fish communities within aquatic ecosystems. This study investigates variations in the biodiversity of fish communities using historical data, with a focus on changes linked to reservoir operations and water impoundment activities. By integrating historical data, this research examines changes in fish diversity that are associated with water storage processes. It provides foundational data on the current composition and diversity of fish communities within the watershed, elucidating the spatiotemporal variations in fish diversity and the mechanisms by which environmental factors influence these communities. Furthermore, the current study serves as a valuable reference for understanding the changes in fish communities within other large reservoirs.
Key Contribution: This study addresses a significant knowledge gap by examining the temporal dynamics and seasonal variations of fish assemblages throughout the Three Gorges Reservoir area, providing critical insights for ecological management and sustainable development in this region.

1. Introduction

As an integral component of aquatic ecosystems, fish possess substantial ecological and economic significance. Serving as top-tier consumers within these systems, they not only respond sensitively to water quality, but also serve as indicators of aquatic ecological health [1]. Fish diversity serves as a key indicator of both the structural complexity and functional integrity of aquatic ecosystems and biological communities. It plays a critical role in maintaining the stability and resilience of aquatic ecosystems. Therefore, understanding fish diversity is not only vital for ensuring the rational conservation and sustainable management of fisheries resources, but also serves as a cornerstone for biodiversity conservation efforts [2]. Before the construction of the Three Gorges Reservoir (TGR), this region hosted critical habitats and spawning grounds for numerous rare, endemic, and commercially important fish species, serving as a natural riverine ecosystem, wherein the water levels remained below 80 m prior to impoundment [3,4]. This region boasts a remarkable aquatic biodiversity, supporting 261 fish species, of which 112 are endemic. Marking the highest proportion of endemic fish species in any region or water system across China, this area plays a critical role as a biodiversity hotspot in the country [5].
In recent decades, population growth in conjunction with accelerated industrial and agricultural expansion has intensified ecological pressures on fishery ecosystems. A multitude of anthropogenic activities, including untreated sewage discharge, large-scale hydraulic engineering projects, intensive navigation operations, commercial shipping, and unsustainable fishing practices, pose significant threats to aquatic biodiversity and its critical habitats [5]. Additionally, the construction of hydroelectric dams has caused irreversible damage to river ecosystems by disrupting their structural integrity and ecological functions. Moreover, the expansion of hydroelectric infrastructure poses a significant threat to fish biodiversity, primarily through the alteration of natural hydrological regimes, the fragmentation and degradation of aquatic habitats, as well as facilitating invasive species colonization. These changes collectively undermine the stability and resilience of freshwater ecosystems [6]. The construction of the Three Gorges Dam (TGD) commenced in 1993 and was completed in 2009 [7], resulting in the formation of the TGR. Spanning the Yangtze River, between the cities of Chongqing and Yichang, the TGR is 663 km long, covers a total area of 1084 square kilometers, and has a reservoir capacity of 39.3 billion cubic meters [4]. The construction and inundation of the TGD transformed the regional ecosystem into a reservoir environment, as a result of which the fish spawning grounds in the middle section of the Yangtze River’s upper reaches were lost. The aquatic habitat within the reservoir area has been transformed from a singular riverine environment into a complex habitat, characterized by a gradient of lentic, slow-flowing, and lotic waters. This ecological transformation has led to a significant reduction in fish species diversity within the reservoir, accompanied by substantial restructuring of the fish assemblage [8]. Since 2010, the TGR has been fully operational, with water levels consistently fluctuating between 145 and 175 m annually [9]. The operational regime of the reservoir, distinguished by clear-water impoundment and turbid-water discharge, encompasses four distinct phases: a high water level stage (November to April), a drainage period (late May–early June), a low water level stage (June–August), and an impounding phase (September–October) [10]. The protracted deviations from seasonal patterns in regard to the water levels, coupled with changes in the hydrological conditions, have substantially affected the structure and diversity of fish communities.
The influences on fish communities have been extensively studied. Between 2005 and 2006, prior to and during the second stage of impoundment, the fish community components exhibited a pronounced and immediate transition from lotic to lentic [3]. The spawning activities of drifting-egg fishes were significantly influenced by reservoir regulation and storage; consequently, minimal spawning intensity was observed prior to mid-June [11]. Additionally, reservoir impoundment in the TGR region had a significant effect on the community structure of local fish populations, altering their species composition and abundance [12]. The similarity of fish species in backwater regions influenced by reservoir impoundment exceeded that observed in natural reaches unaffected by such impoundment [13]. And, furthermore, the growth of fish populations was significantly impaired under both low- and high-water conditions compared with those fish populations in areas immediately downstream of the dam [14]. However, existing studies have predominantly focused on specific sections of the mainstream and tributaries, resulting in insights that are limited to particular micro-habitats. Consequently, there is a lack of comprehensive and systematic comparative research addressing the broader ecological impacts of the reservoir.
Previous research has primarily employed traditional fishing techniques, which are characterized by their time-intensive and labor-demanding nature, thereby limiting the scope of the research areas. In January 2020, the Chinese government officially implemented a 10-year fishing prohibition policy, further constraining traditional fish monitoring and assessment methodologies. An alternative to these conventional survey methods is the utilization of genetic analyses through environmental DNA (eDNA) sampling [15]. Specifically, eDNA refers to DNA extracted from environmental samples, including soil, sediments, water, or snow [16]. All organisms shed skin cells, feces, urine, mucus, and gametes, resulting in the presence of extracellular and intracellular DNA in the water column, which can be detected for up to approximately 60 days [15]. Moreover, eDNA can be collected and analyzed to determine the presence of specific fish species. Compared to traditional survey methods, eDNA technology offers a more cost-effective and non-invasive approach to monitoring fish communities. Currently, eDNA technology is extensively utilized in the study of aquatic organisms [17,18,19,20].
In this paper, we employed eDNA technology to analyze the changes in fish communities and diversity in the TGR. Given that May, September, and December are the breeding, feeding, and overwintering seasons for most fish [21], we conducted our investigations during these months in 2022. In May, the reservoir enters a drainage period, during which the water level decreases from 175 m to 145 m. From September, the impoundment period begins, leading to a gradual increase in the reservoir water levels back to 175 m. By December, the reservoir stabilizes at an elevation of 175 m. Based on the existing literature, this study advances three research hypotheses: (1) The construction of the TGD has significantly transformed the structure of the fish communities in the reservoir area, with the extent of the ecological impact specifically influenced by the distance from the dam and elevation differences across distinct river reaches. (2) The fish species diversity is hypothesized as being higher in tributaries compared to the main stem of the reservoir system, likely due to differing hydrodynamic conditions. (3) The composition of the fish communities is expected to exhibit pronounced spatiotemporal variations across seasonal cycles, linked to their specific life history traits and physiological activities, such as reproduction, migration, and feeding behaviors.

2. Materials and Methods

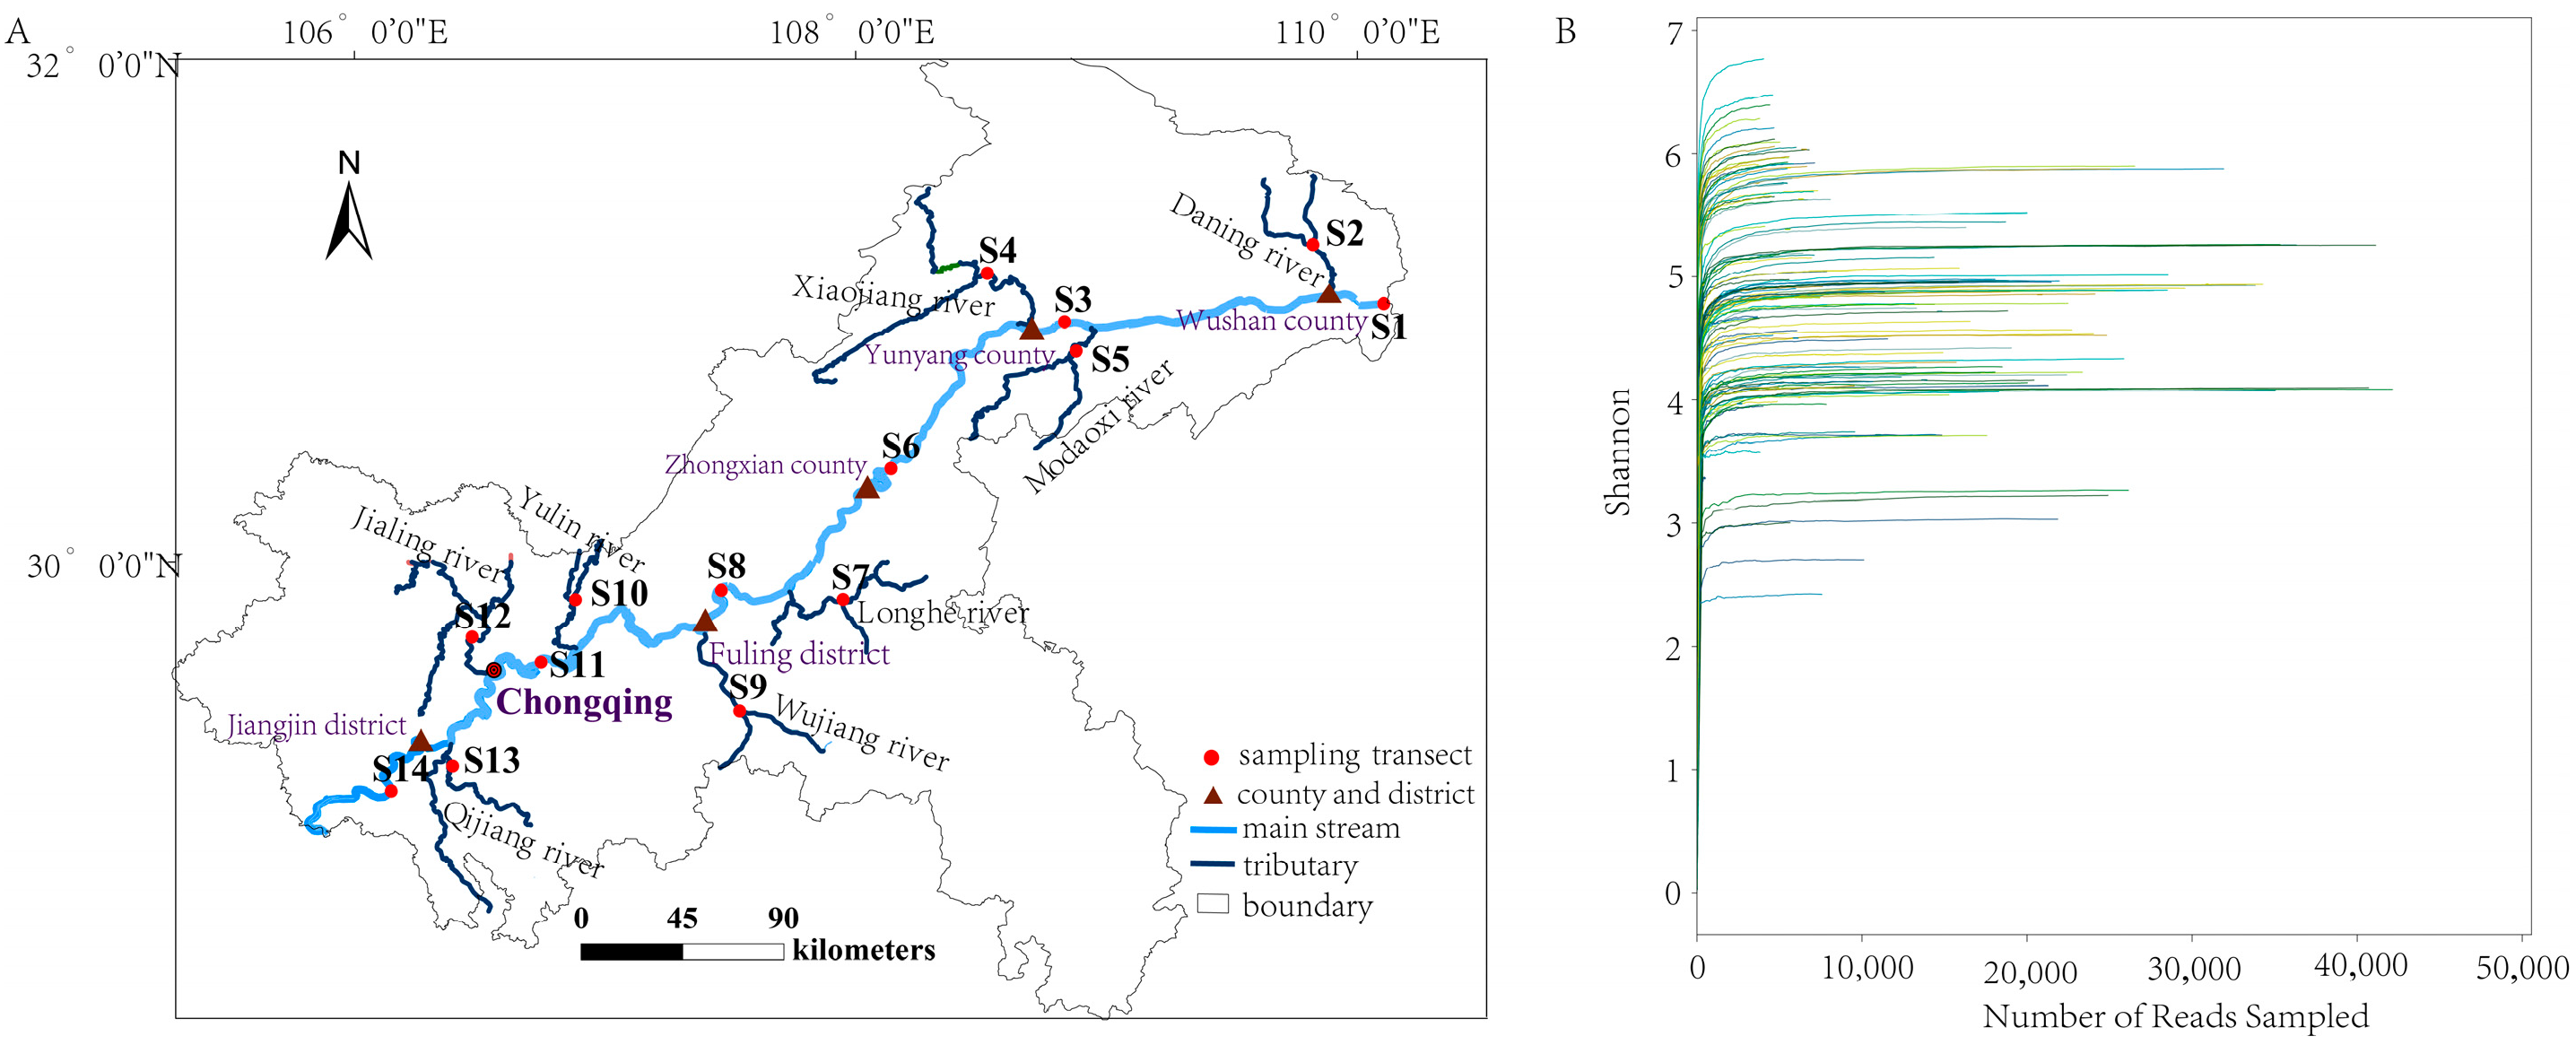
2.1. Study Area and Historical Data Collection

Considering the geographic characteristics of the basin, its water system, and the diversity of the habitats, this study established a total of six mainstream sampling transects (S1, S3, S6, S8, S11, S14) and eight significant primary tributary sampling transects (S2, S4, S5, S7, S9, S10, S12, S13) within the Three Gorges Reservoir area (Figure 1A). The historical inventory of fish species was compiled using relevant survey data from various periods within the watershed, specifically from 1994 [22], 2005–2008 [23,24,25], 2013–2015 [26], and 2017–2019 [12].

2.2. eDNA Water Sampling and Environmental Properties Measurements

Following approval from the pertinent fishery regulatory authorities, water samples were collected in May, September, and December 2022, at each designated sampling transect. During the collection process, a specialized water collector was utilized to obtain 8 to 10 L of composite water samples from various strata, including the surface, middle, and bottom layers. Subsequently, six liters of the composite samples were evenly distributed into three 2 L polyethylene bottles, resulting in three parallel samples [27]. Each sampling transect was sampled three times, yielding a total of 126 samples. Before the experiment, the water collectors and polyethylene bottles were disinfected with a 10% bleach solution, and disposable gloves were promptly replaced after each sampling to avoid contamination [28]. The collected samples, stored under refrigerated conditions, were filtered through a 0.45 µm mixed cellulose filter membrane (Whatman, Maidstone, UK) using vacuum filtration equipment within 24 h and stored at −80 °C until DNA extraction [20]. A negative control utilizing sterile double-distilled water (ddH2O) was established during the filtration process to assess the presence of any exogenous DNA contamination throughout the experiments. Additionally, all the experimental apparatuses were sterilized both before and after extraction and, subsequently, rinsed with distilled water to eliminate residual DNA, thereby preventing cross-contamination between the samples [19].
Environmental factors, including the pH, transparency (TRA), dissolved oxygen (DO), water temperature (WT), electrical conductivity (EC), total dissolved solids (TDS), chemical oxygen demand (COD), total phosphorus (TP), total nitrogen (TN), and ammonia nitrogen (NH3-N) were measured at each sampling time. The measurement methods were as follows: a portable pH meter, a Secchi disk, a portable dissolved oxygen meter, a thermometer, a portable measuring instrument, and spectrophotometry. The longitude, latitude, and altitude were measured using GPS at the time of the initial sampling.

2.3. eDNA Processing, PCR Amplification, and Sequencing

Prior to conducting eDNA processing, PCR amplification, and sequencing, corresponding experiments are first performed on all the negative controls. Sample processing will only proceed when the corresponding PCR reactions involving the negative controls test negative. The specific processing steps are as follows: the total DNA from the membrane was extracted using a PowerWater DNA Isolation Kit (Carlsbad, CA, USA), and its quality was assessed via 1% agarose gel electrophoresis. The extracted DNA was subsequently stored at −80 °C, until further analysis using PCR amplification [29]. Tele02 primers (forward primer: 5′-AAA CTC GTG CCA GCC ACC-3′; reverse primer: 3′-GGG TAT CTA ATC CCA GTT TG-5′) were selected for the PCR amplification of the mitochondrial 12s RNA gene [30]. The reaction system had a total volume of 20 µL, consisting of 4 µL of 5 × FastPfu Buffer, 2 µL of dNTPs (2.5 mmol/L), 0.8 µL of upstream primer (5 μmol/L), 0.8 µL of downstream primer, 0.4 µL of FastPfu polymerase, and 10 ng of template DNA, which was then made up to 20 µL by adding ddH2O. The reaction procedure was as follows: 95 °C for 5 min, 35 cycles (95 °C for 30 s, 55 °C for 30 s, 72 °C for 45 s), 72 °C for 10 min. The PCR products passed the 2% agarose gel electrophoresis test and then were subject to high-throughput sequencing using the Illumina NovaSeq 6000 sequencing platform. Prior to high-throughput sequencing, the PCR amplicons were purified first and indexed with barcode adapters, with subsequent purification and concentration normalization of the amplified products carried out through the use of a quantitative assessment.

2.4. Bioinformatics Analysis

The raw reads from all the samples were initially filtered, and high-quality sequence fragments were assembled based on their overlapping relationships [31,32]. The processing pipeline included the following steps: The terminal bases with Phred quality scores below 20 were systematically trimmed. Subsequently, a sliding window approach (10 bp window size) was implemented to evaluate the average read quality, with truncation initiated from the window start position if the mean quality score within the window fell below the threshold of 20. Finally, reads shorter than 100 bp after processing were excluded from the downstream analyses. Subsequently, the quality sequences for each sample were obtained by demultiplexing according to the barcode and primer sequences, with sequence orientation corrected based on the positive and negative orientations of the barcodes and primers. Following sequence processing, paired-end reads were merged into single contiguous sequences using FLASH software (version 1.2.7), through the identification and alignment of overlapping regions between forward and reverse reads. Chimeras were then removed using a combination of de novo and reference-based approaches, using Usearch software (version 10) and the gold database. Furthermore, primers were removed using Cutadapt (v 4.0, https://cutadapt.readthedocs.io/, accessed on 18 January 2023), and high-quality sequences were clustered into molecular operational taxonomic units (MOTUs), with a sequence similarity threshold of ≥99%, using Usearch software (version 10) [33]. The representative MOTU sequences were aligned, classified, and annotated using the BLASTn tool and the UCLUST algorithm, according to both the MitoFish database (http://mitofish.aori.u-tokyo.ac.jp, accessed on 16 February 2023) and the NCBI database (http://www.ncbi.nlm.nih.gov/, accessed on 27 March 2023), thereby generating an OTU relative abundance table. During the analysis, sequences that did not match fish species in three parallel samples from each sampling section were excluded, while matched sequences were processed according to their mean values. The screening criteria parameters for the OTU annotation analysis were an identity value ≥ 97%, an E-value ≤ 10−5, and a cover ≥ 0.9. The OTUs matched to the same species were combined, and if an OTU could not be classified at the species level, statistics were generated at higher taxonomic levels [34]. OTUs with fewer than 10 reads and low-frequency sequences (<0.1% of reads per taxon in each sample) were eliminated to mitigate the impact of contamination or sequencing errors in regard to false-positive results [35,36]. Taxa that appeared at least twice across the three parallel samples were retained to minimize the influence of occasional OTUs on the experimental results. Rarefaction curves were constructed using the “mothur” package in R, based on the number of sampled sequences and their corresponding OTU counts [37]. A flattening of the curve indicates an adequate amount of sequencing data (Figure 1B).
The effective scientific names, taxonomic statuses, ecological types, alien fishes, and endemic fishes from the upper reaches of the Yangtze River were categorized according to the literature [12,22,26,38,39,40]. The classification of nationally protected fish was based on the List of Wild Animals under State Key Conservation (revised on 1 February 2021).

2.5. Analysis of Temporal and Spatial Changes

To investigate the spatial and temporal variability of fish communities, the number of fish species, ecotypes, and diversity indices were analyzed comparatively. Principal Coordinates Analysis (PCoA) and multiple comparisons among different groups were conducted to assess the differences and significance of the fish communities. To enhance accuracy and mitigate sample-specific variations arising from inconsistent data quantities, abundance data from direct clustering annotations were normalized relative to the minimum data size per sample. Furthermore, when the reservoir operates at its lowest water level of 145 m in summer, it submerges Fuling county in Chongqing city; conversely, at its highest water level of 175 m in winter, it submerges Jiangjin county in Chongqing city (Wu, 2021) [13]. Based on water level variability, we divided the study area into two groups, namely the reservoir group (S1–S7) and the tail of the reservoir group (S8–S14), with Fuling county serving as the boundary. The sampling area was further categorized into lacustrine (S1–S7), transitional (S8–S12), and riverine (S13–S14) zones to compare diversity indices and the number of species detected. Three representative sampling transects were selected from the mainstream to represent these zones, with differences compared using the diversity index from three parallel samples at each transect. S6 represents the lacustrine zone, S11 the transitional zone, and S14 the riverine zone. Additionally, the study area was divided into mainstream and tributary groups for the comparative analysis. To assess the significance of the differences, Fisher’s Least Significant Difference (LSD) test, after confirming the homogeneity of variance and normality, and Scheffé’s Method were utilized [41,42]. The comparative analysis of the species ecotypes was illustrated using percentage stacked bar charts. The data analysis was conducted using R version 4.4.1 (http://www.R-project.org, accessed on 9 April 2024) and IBM SPSS Statistics version 27 (http://www.spss.com, accessed on 9 April 2024).

2.6. Correlation Analysis of Environmental Factors

The Detrended Correspondence Analysis (DCA) indicated that the first axis length was 2.78. Redundancy Analysis (RDA) was employed to investigate the principal environmental factors and assess their impact on fish communities. Before the analysis, the Hellinger transformation method was applied to the species abundance data. An RDA plot was generated using R version 4.4.1, and the “rdacca.hp” package, developed by Lai J. et al., was utilized to determine the explanatory power of single canonical analysis variables. This study utilized the “rdacca.hp” package in R to calculate the explanatory power of each environmental factor, encompassing three distinct types: unique, average. share, and individual [43].

3. Results

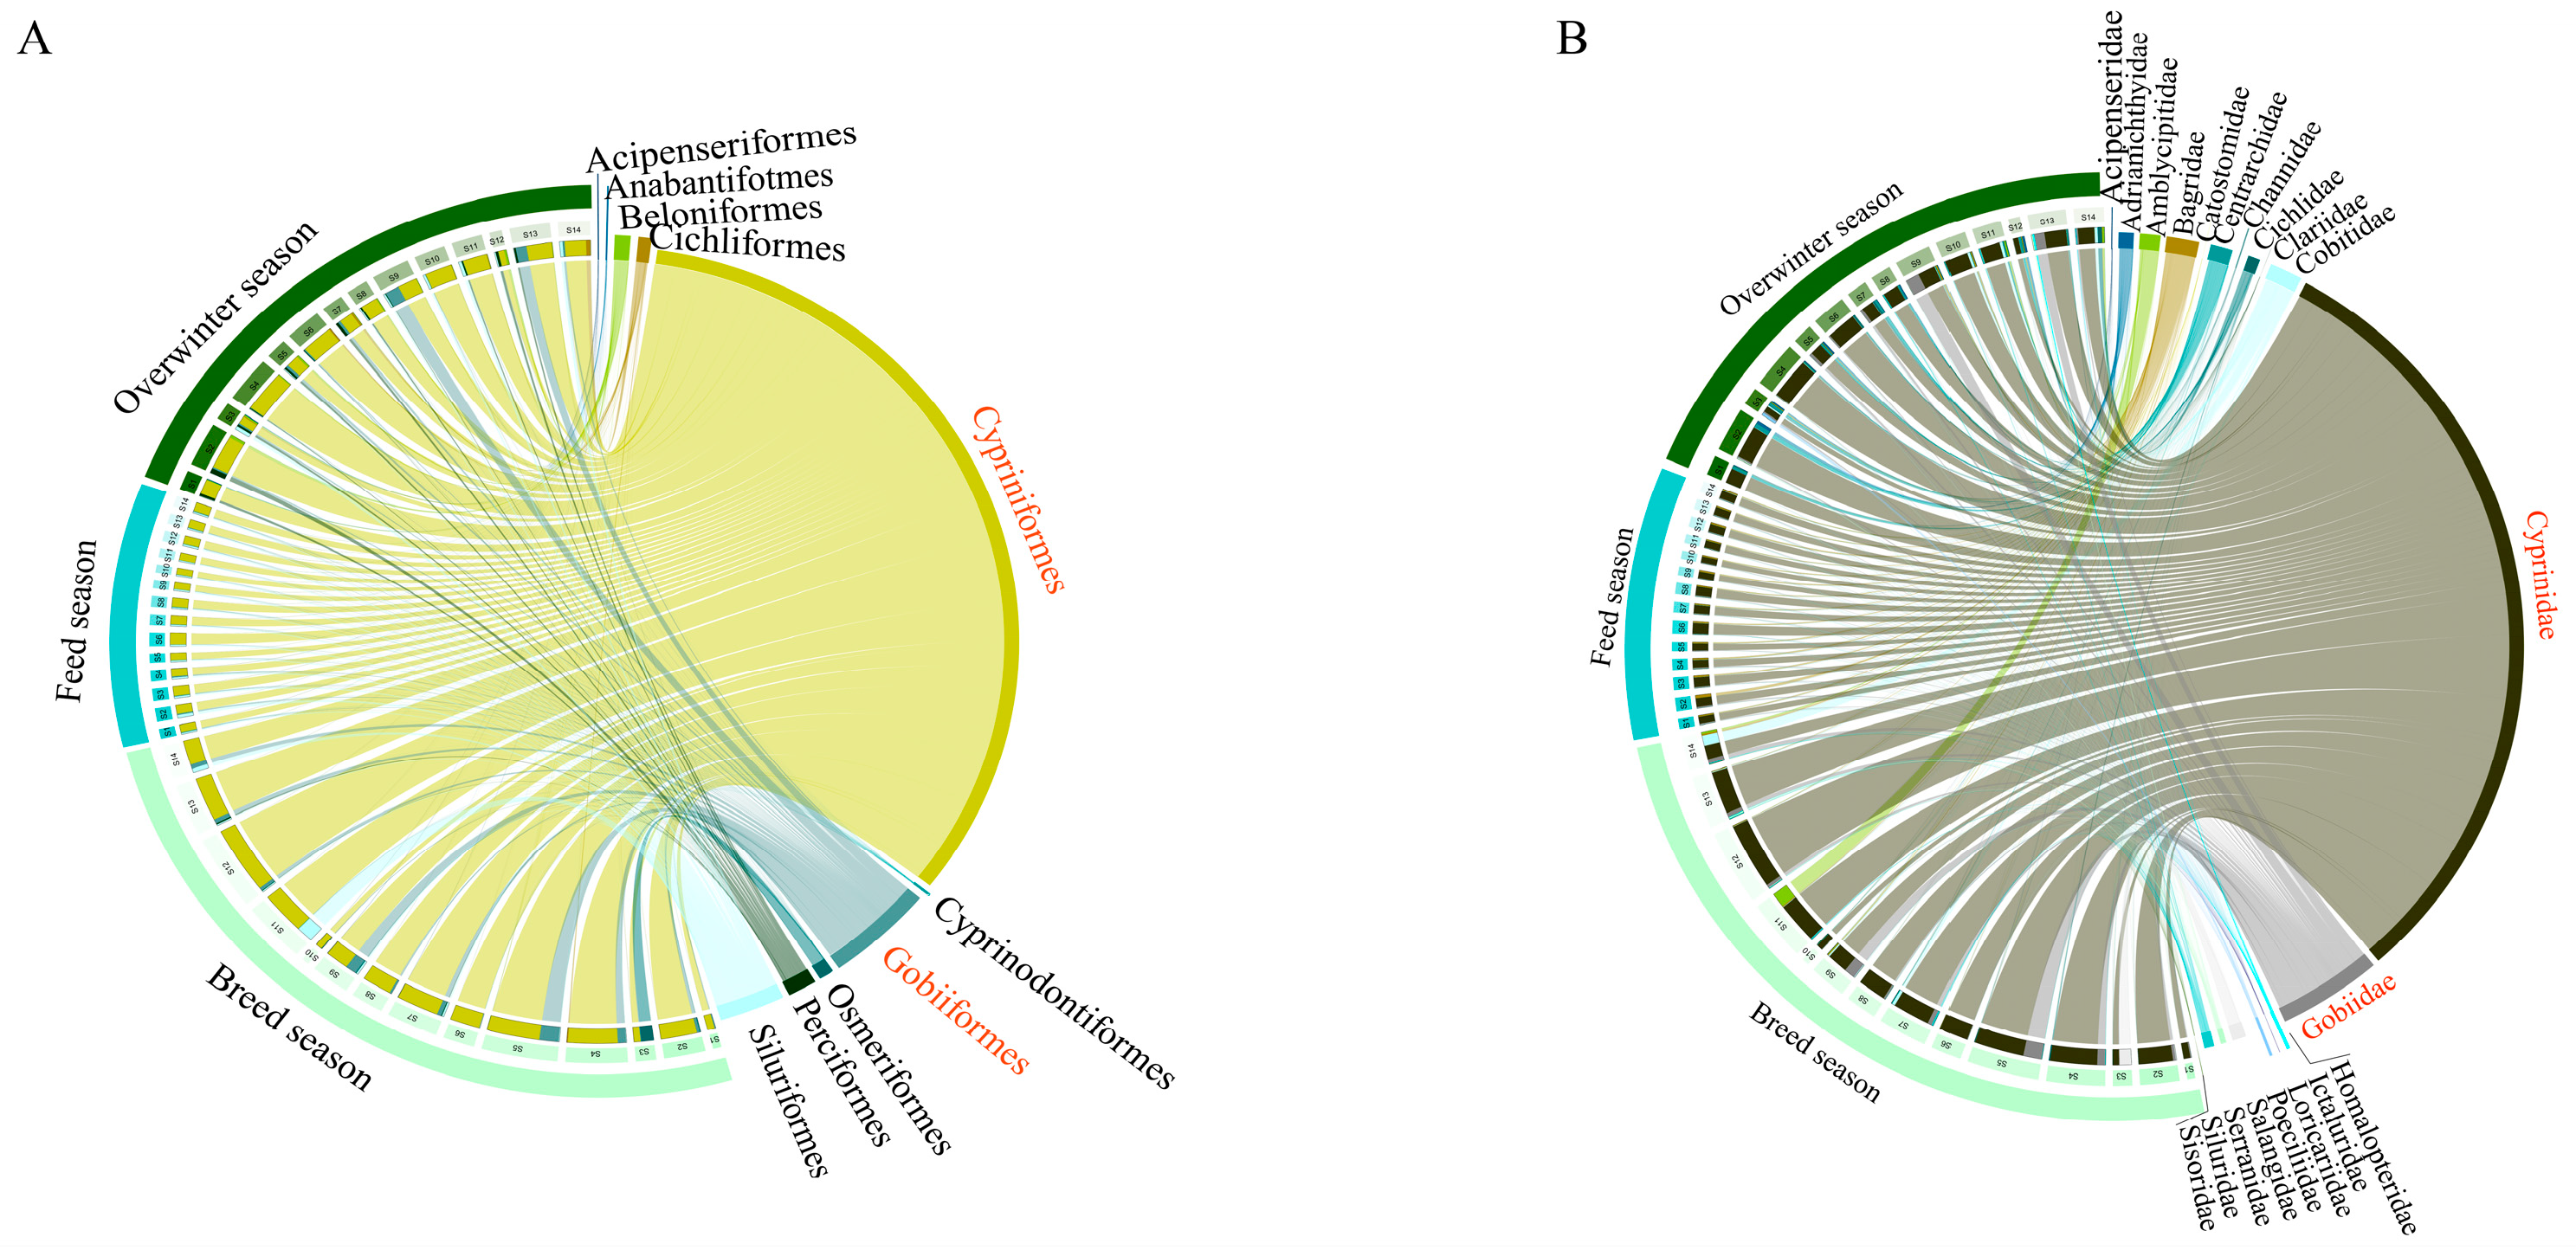
3.1. Current Status of Fish Species Composition

Following rigorous quality control procedures, including the filtration of low-quality sequences, chimera removal, the exclusion of non-fish sequences, and inter-replicate averaging, the three independent surveys collectively yielded over 6.57 million high-quality sequences. Subsequent clustering analysis, coupled with manual curation, identified 124 molecular operational taxonomic units (MOTUs), corresponding to 124 fish species, classified into 10 orders, 20 families, and 80 genera (Table S1). Specifically, the breeding season produced over 3.32 million sequences, clustered into 103 MOTUs (103 species; 9 orders, 17 families, 70 genera; Table S2), while the feeding season generated 0.95 million sequences, forming 104 MOTUs (104 species; 10 orders, 19 families, 68 genera; Table S3), and the overwintering season yielded 2.30 million sequences, resulting in 96 MOTUs (96 species; 8 orders, 15 families, 66 genera; Table S4). These include 8 nationally protected fish species, 23 endemic fish species from the upper reaches of the Yangtze River, and 15 alien fish species. A total of 89 fish species from the 2017–2019 traditional survey method results were detected using eDNA technology and 56 species were not detected, with 61.38% coverage in terms of the eDNA results. These findings suggest moderate reliability of the eDNA results. In terms of taxonomic composition, the highest proportion of species and sequences belonged to the order Cypriniformes (Table 1), comprising 70.16% and 77.52%, respectively, followed by the orders Siluriformes and Perciformes. At the family level, Cyprinidae represented the highest percentage of fish species (Table 1) and the highest number of sequences (Table 1), accounting for 56.45% and 74.12%, respectively. The top five genera with high sequence abundance are Cyprinus, Carassius, Ancherythroculter, Hemiculter, and Rhinogobius. The results on the fish sequence abundance at both the order level (Figure 2A) and family level (Figure 2B) for each sampling section in different seasons showed that Cypriniformes and Cyprinidae exhibited the greatest abundance, being present in all the sampling locations, followed by Gobiiformes and Gobiidae. The lowest number of fish sequences was collected during the feeding season. Additionally, we focused on the distribution of two nationally prioritized invasive alien fish species for management purposes, Coptodon zillii and Pterygoplichthys pardalis, across different seasons and sampling transects (Figure 3). It can be seen from the figure that C. zillii was detected in the mainstream and tributaries (the Xiaojiang river and the Modaoxi river) during the breeding season (Figure 3A) and widely distributed in the reservoir area during both the feeding season (Figure 3B) and overwintering season (Figure 3C). Pterygoplichthys pardalis exhibited higher sequence abundance in the mainstream and tributaries only (the Xiaojiang river and the Qijiang river) during the feeding and overwintering seasons.

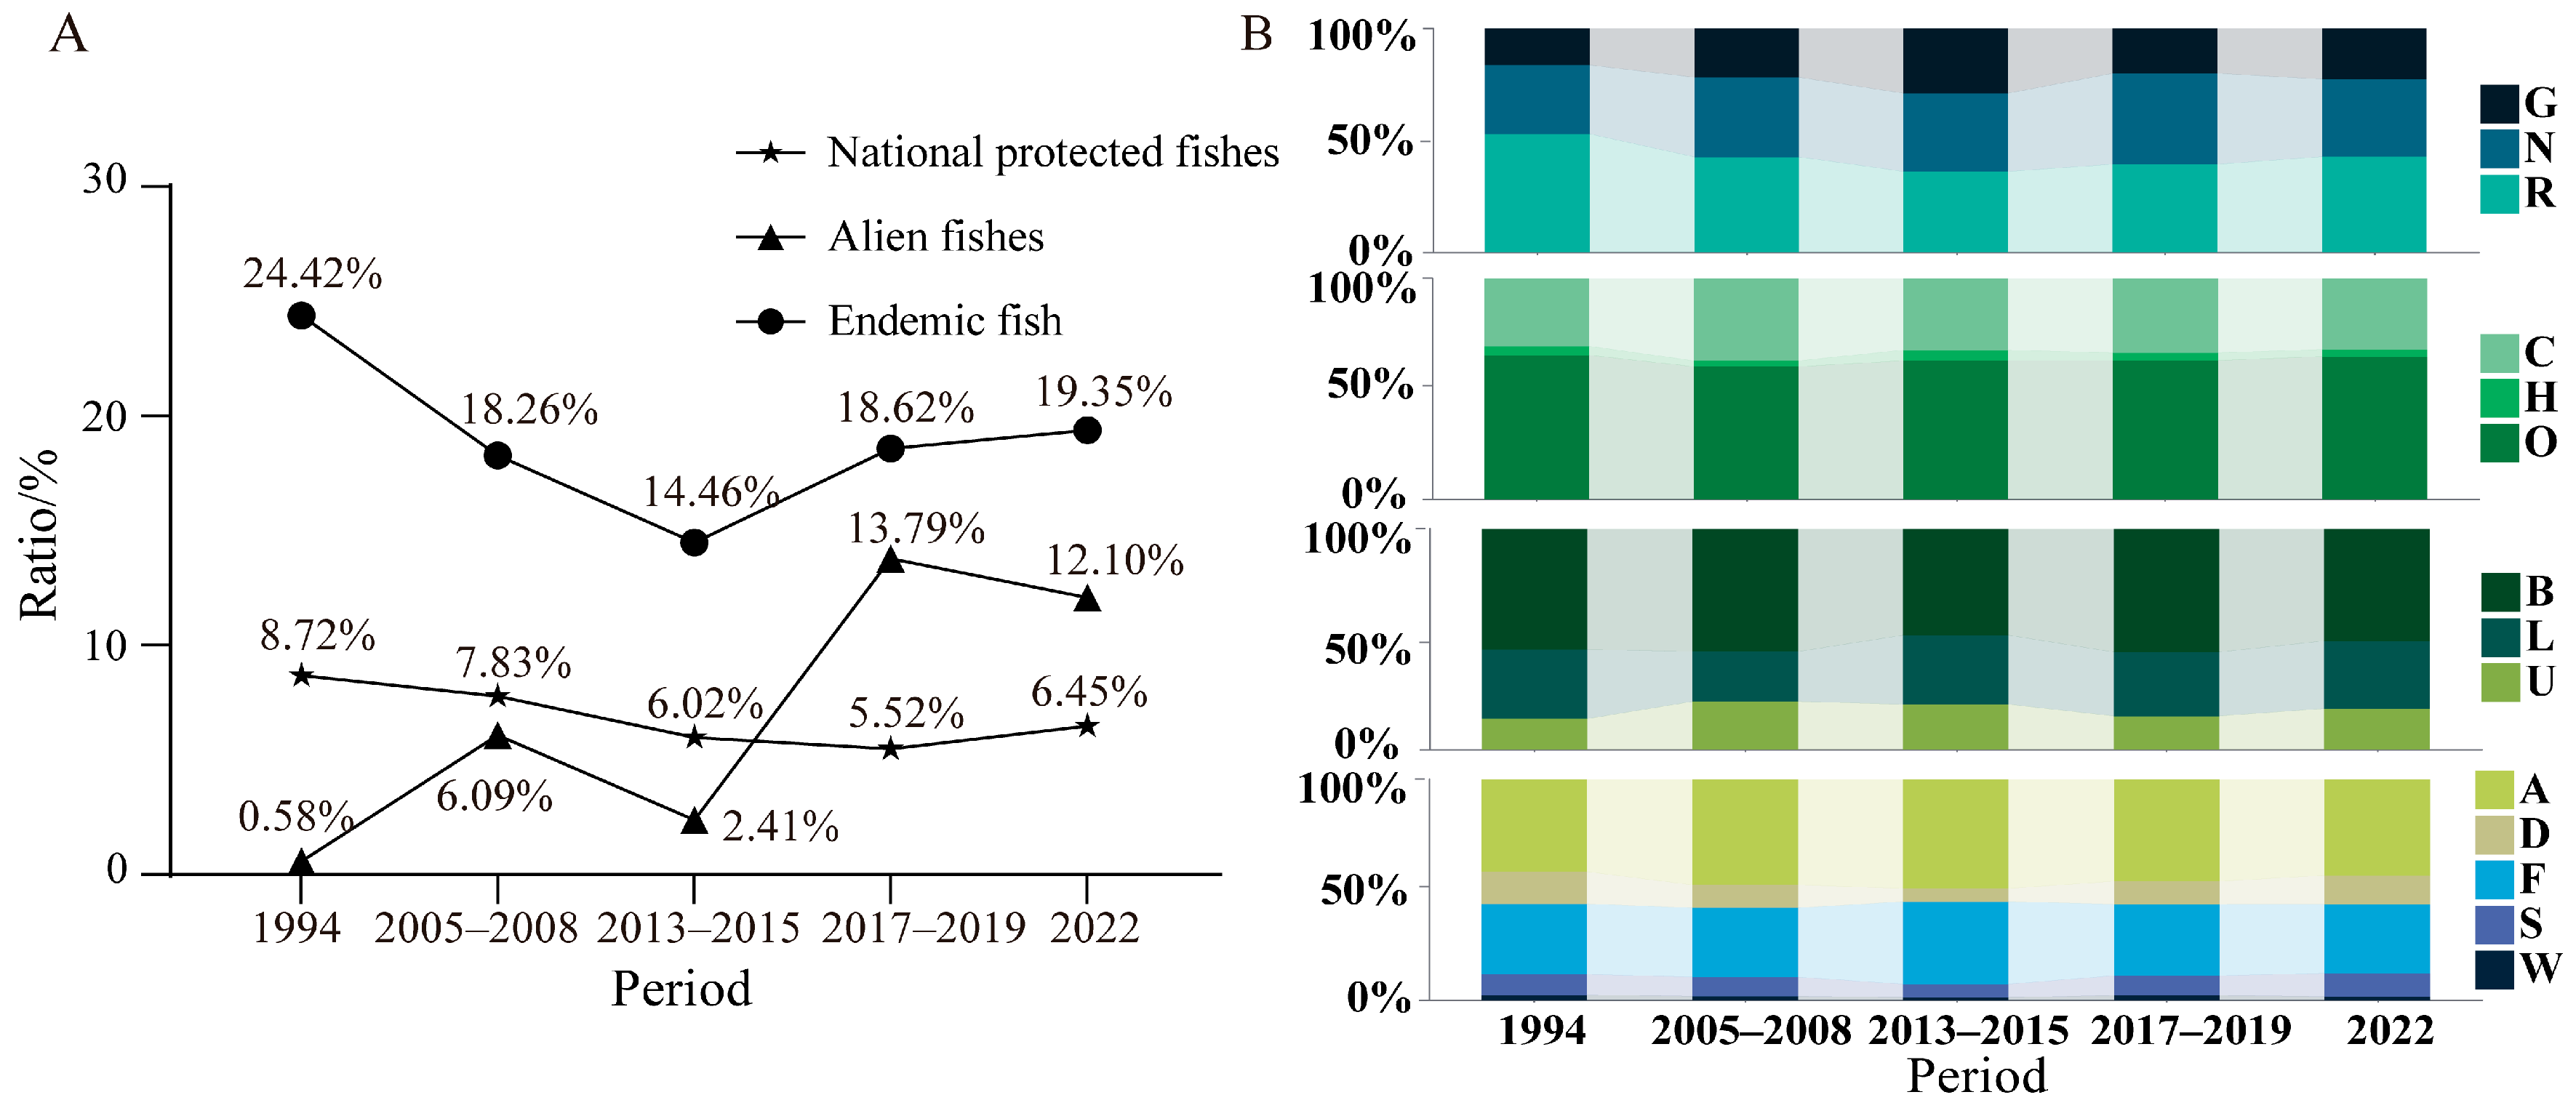
3.2. Changes in Patterns of Fish Community

The comparative analysis, utilizing historical data, revealed significant fluctuations in the number of alien and endemic fish species in the upper reaches of the Yangtze River, exhibiting distinct upward and downward trends, respectively. From the onset of the TGD construction until its completion, the percentage of alien fish species increased rapidly. Following the reservoir achieving full operational status, the percentage of alien fish species experienced a slight decline; however, the percentage of alien fish species subsequently rose again and remains elevated to the present day, significantly surpassing pre-dam construction levels. Conversely, the proportion of endemic fish species declined markedly during the TGD construction and the initial phase of reservoir operation, although it gradually increased after the reservoir stabilized, while remaining lower than the level observed prior to dam construction. Additionally, there is a slight downward trend in the number of nationally protected fish species, which has decreased compared to previous levels (Figure 4A). A comparative analysis of the fish ecotype composition across different periods indicates that the composition of fish with varying habitat and water layer preferences fluctuates considerably, while the composition based on food preferences and spawning types remains relatively stable (Figure 4B). The number of lotic fish has decreased, whereas the numbers of eurytopic and lentic fish have shown a notable increase. The composition of fish species categorized by water layer preferences has fluctuated, but has returned to proportions similar to those observed at the beginning of reservoir construction in 1994. Detailed information regarding the ecotypes of the fish species and their presence during each period is provided in Table S5.

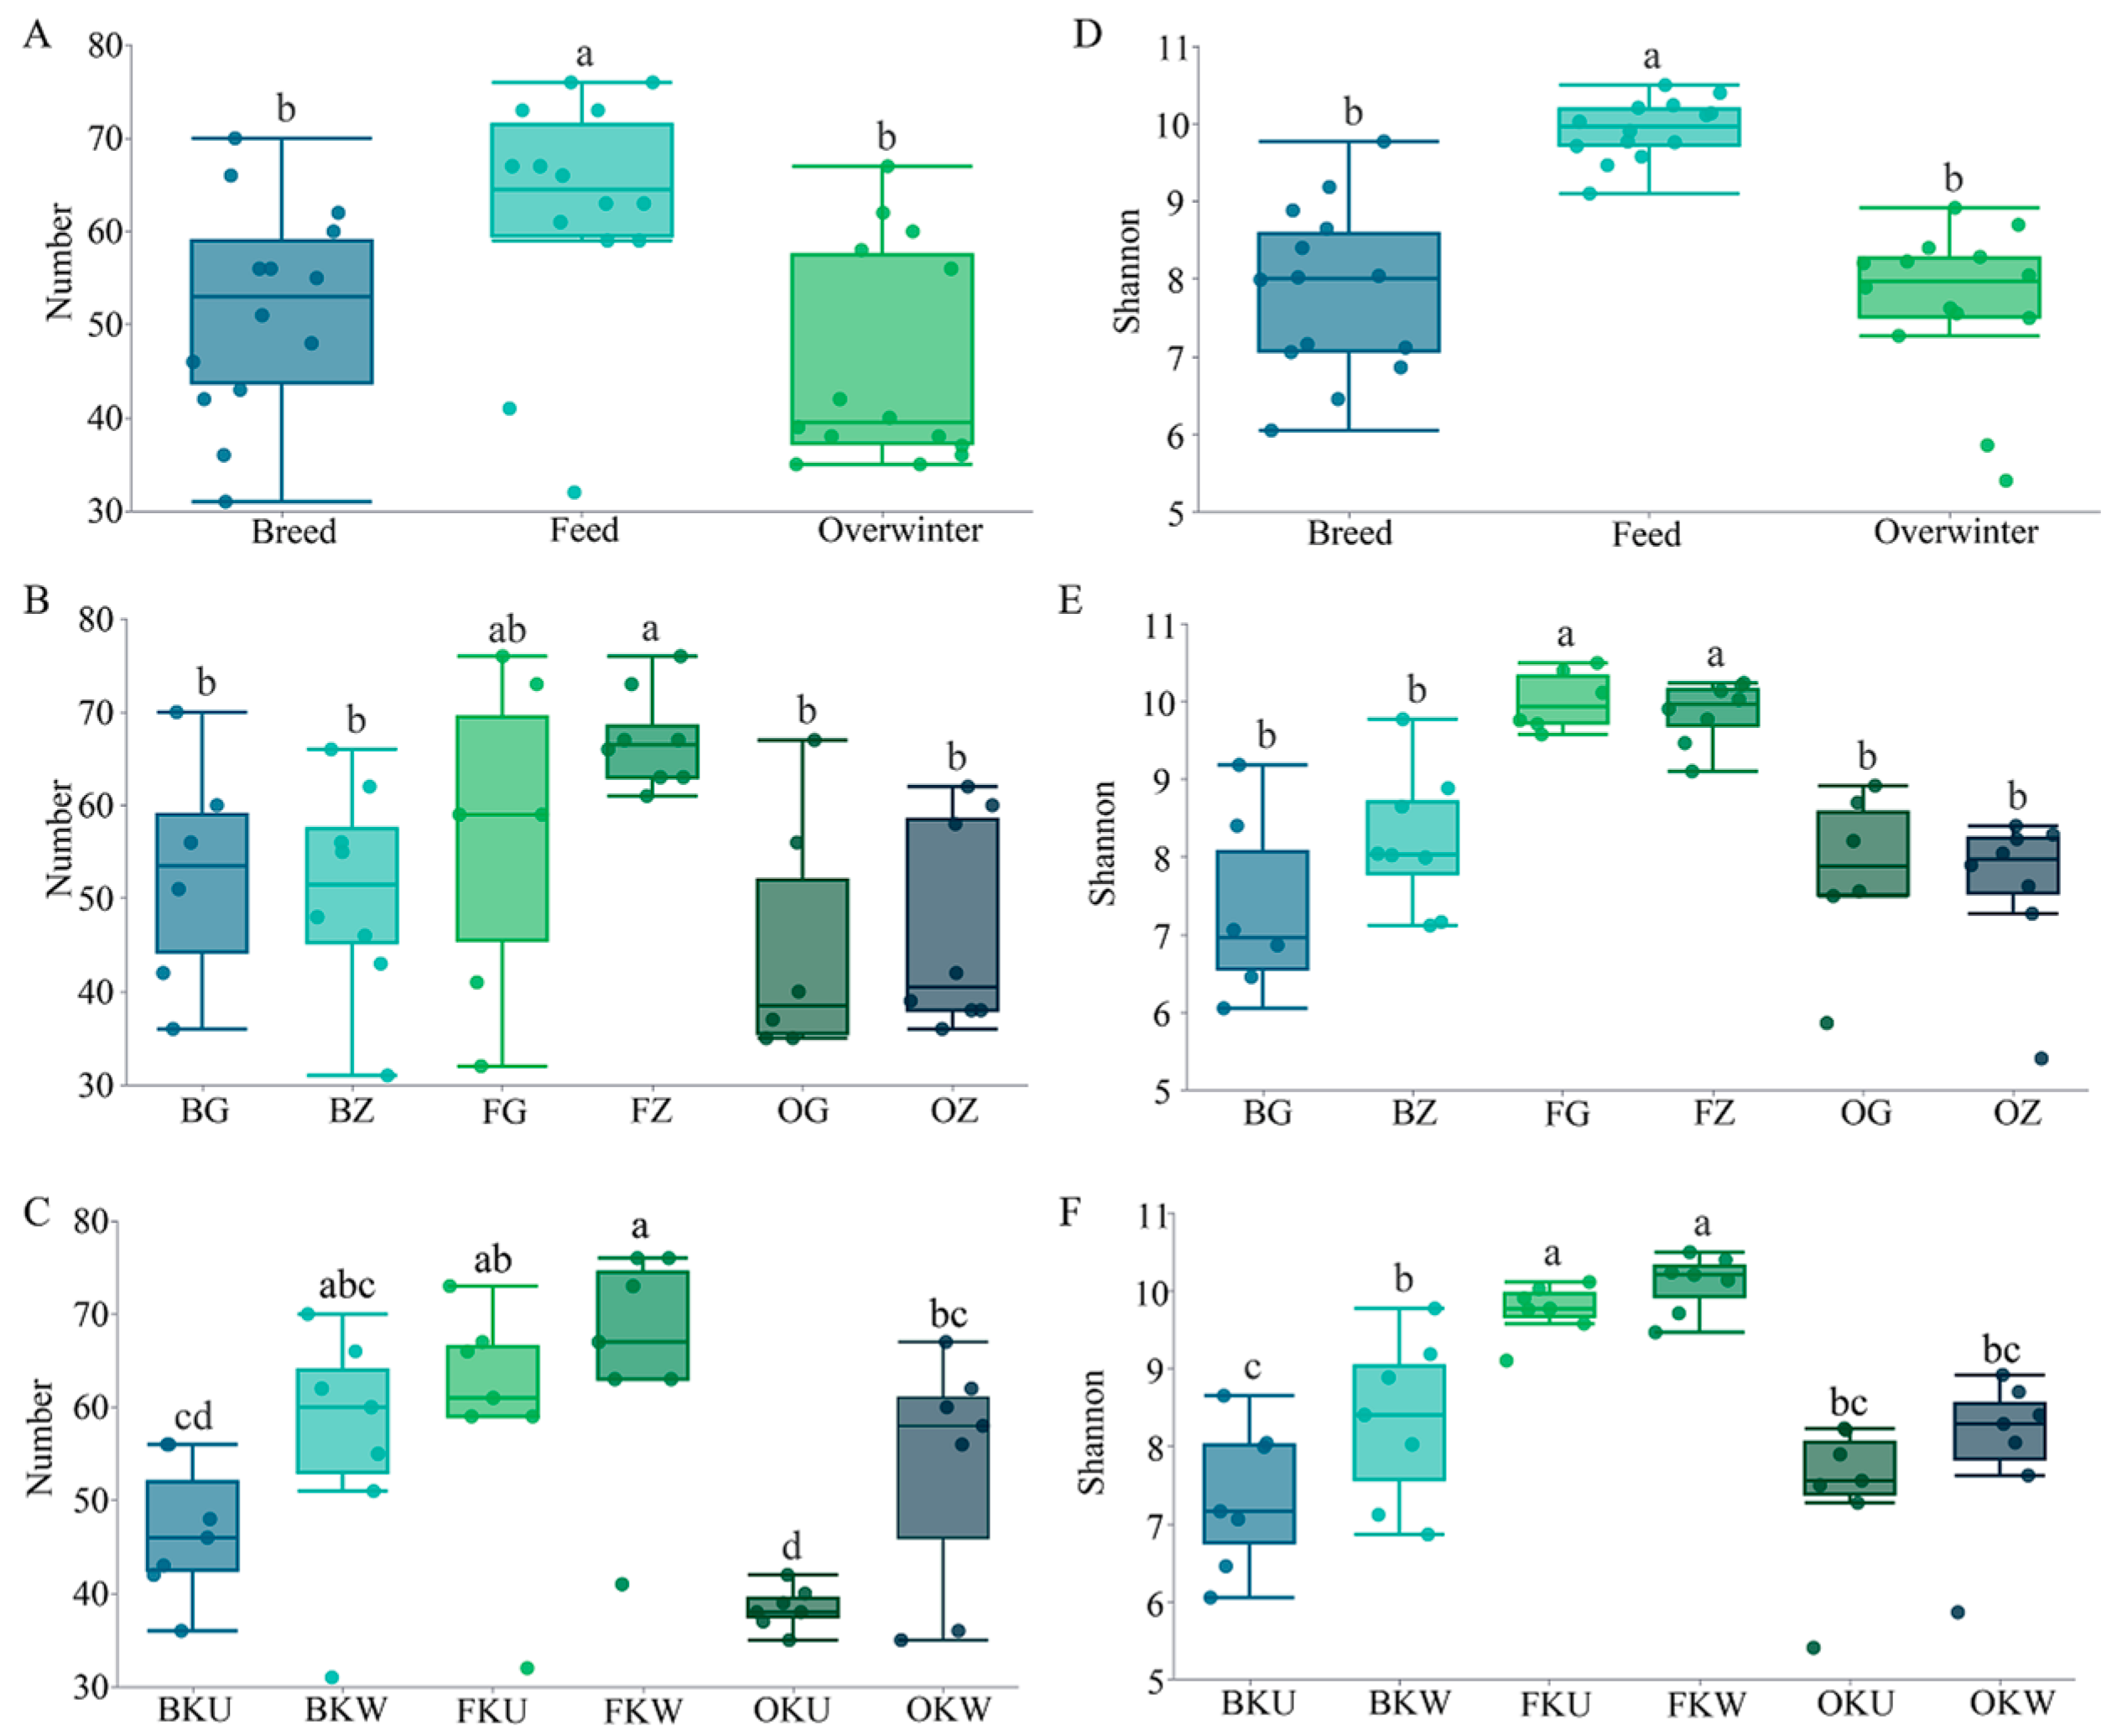
3.3. Current Status of Spatiotemporal Dynamics of Fish Diversity

The number of fish species collected at each sampling transect revealed significant differences between the overall breeding and overwintering seasons compared to the feeding season (Figure 5A). The median number of fish species collected during the feeding season was higher than that observed in the other two seasons. The comparative analyses further indicated that the species count in the tributary group during the feeding season differed significantly from that in the other seasonal groups (Figure 5B), and a significant difference was also noted between the overwintering reservoir group and the tail group (Figure 5C). Additionally, the species count in the overwintering riverine group was significantly different from that of the lacustrine group (Table S6).
The results in terms of the alpha diversity indices for each sampling transect are presented in Table 2. The Shannon index exhibited significant differences between the feeding season and both the breeding and overwintering seasons (Figure 5D). Comparisons of the Shannon index among the groups indicated no significant differences within the same season, except for a notable difference between the reservoir and tail groups during the breeding season (Figure 5E and Figure 6F). Significant differences in the Shannon index were observed between the riverine zone and both the lacustrine and transition zones during the breeding season (Table S6). Furthermore, comparisons across the three typical sampling transects revealed significant differences between the lacustrine and riverine zones overall and within each season (Table S7).
Information on the various ecotypes of the fish detected in this study is presented in Table S8. The composition of species ecotypes is characterized by two dimensions: the number of species and the number of sequences. No apparent differences in composition were observed at the species number level when comparing the three seasons. The highest percentage of fish species across all seasons was found to be lotic, omnivorous, benthopelagic, adhesive egg-laying, medium-aged, small, and non-migratory fish (Figure 6A). The highest percentage of sequences across all seasons was eurytopic, omnivorous, adhesive egg-laying, small, and migratory fish. In terms of water layer preferences, benthopelagic fish dominated during the breeding season, while lower mesopelagic fish were predominant during the feeding season; the proportion of pelagic fish sequences was highest in the overwintering season. Regarding sexual maturity types, the highest proportion of medium-aged fish sequences was observed during both the breeding and overwintering seasons, whereas the highest proportion of low-aged fish sequences was found during the feeding season (Figure 6D). The results of the comparisons at the species number level for the mainstream and tributary groups were consistent with the overall comparisons across the three seasons, revealing no apparent differences between the groups (Figure 6B). During the breeding season, the number of sequences for lotic and migratory fish in the mainstream group was greater than in the tributary group, while the reverse was true during the overwintering season, with no significant differences noted during the feeding season (Figure 6E). Furthermore, both the number of sequences and species of lotic fish in the tail group were greater than those in the reservoir group, while migratory fish were less numerous during both the breeding and overwintering seasons (Figure 6C,F).
The PCoA indicated highly significant differences among the three seasons. Notably, the samples from the breeding and overwintering seasons are closely aligned on the graph, whereas the samples from the feeding season are more distantly positioned (Figure 7A). The grouping results demonstrate that the samples from different groups within the same season are closer together on the graph, exhibiting less variation, while the grouping for the feeding season is distinctly separate from that of the other seasons, indicating significant differences (Figure 7B,C). The results of multiple comparisons among the different groups are shown in Table 3, revealing no significant differences between the groups within the same season (e.g., BG vs. BZ, BKU vs. BKW, and FG vs. FZ).

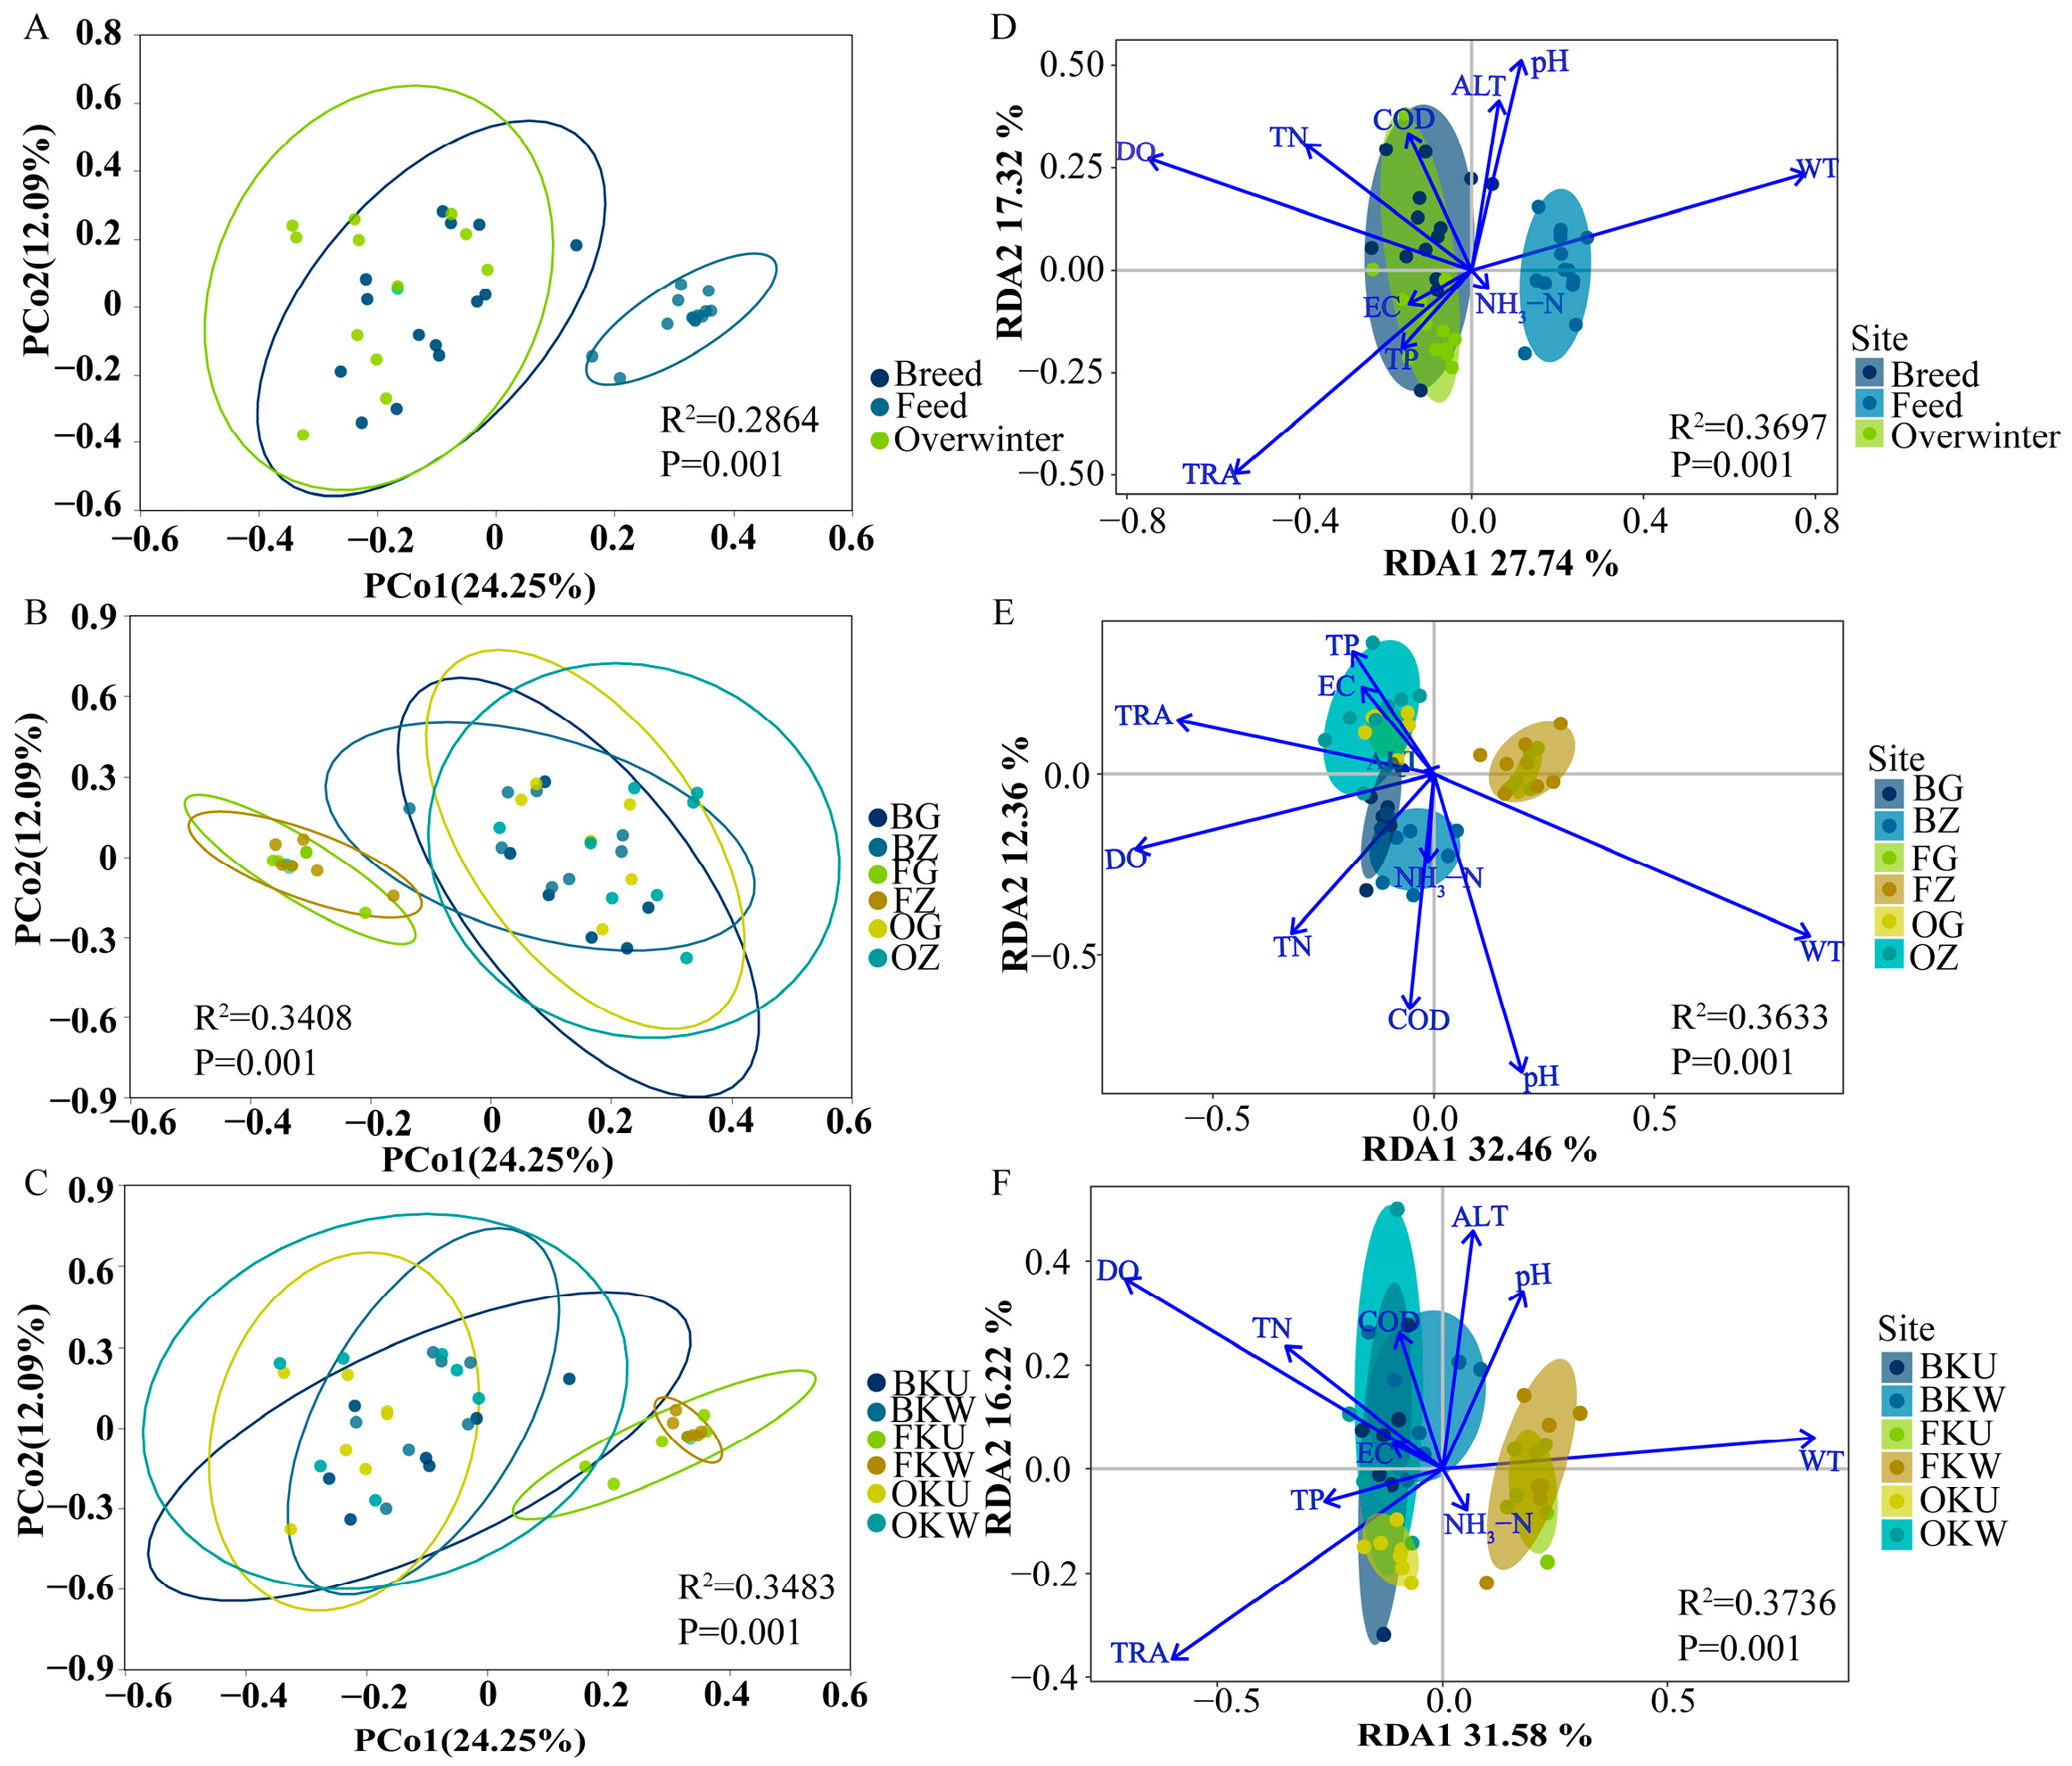
3.4. Effects of Environmental Factors on Fish Communities

The percentage variation in the fish communities explained by each environmental factor based on the RDA is presented in Table 4. Due to the strong collinearity between the EC and TDS (vif. cca > 10), the TDS was excluded from subsequent analyses. The correlations between the RDA axes and environmental factors across different groupings are presented in Tables S9–S11. With the exception of altitude, COD, and EC, all the environmental factors significantly influenced the fish communities. WT exhibited the highest unique, average. share, and individual explanatory power regarding changes in the fish communities, followed by DO and TRA. Moreover, the ratio of individual explanatory power of the WT to the total explanatory power of all the factors was the highest.
The results of the group mapping indicated that WT primarily affected the fish community during the feeding season, whereas during other seasons, the fish communities were predominantly influenced by environmental factors such as TRA, DO, and TN (Figure 7D). Total nitrogen exerted a greater influence on the mainstream and reservoir groups, while NH3-N had a more pronounced effect on the tributary group during the breeding season. Total phosphorus significantly impacted the mainstream, tributary, and reservoir groups during the overwintering season (Figure 7E,F).
Additionally, the closer proximity of the points during the breeding and overwintering seasons resulted in higher similarity in terms of the fish community composition and more comparable responses to environmental factors (Figure 7D). The analysis of mainstream and tributary groupings revealed that these groups exhibited greater compositional differences during the breeding season compared to other seasons. In regard to the latter, the mainstream and tributary groups were more closely aligned; furthermore, the mainstream group was more clustered, while the tributary group was more dispersed (Figure 7E). A comparison of the reservoir group with the tail group indicated that all the points were more dispersed and varied during the breeding season. In contrast, during the feeding and overwintering seasons, the points in the tail group were more dispersed, while those in the reservoir group were closer together and exhibited greater compositional similarity (Figure 7F).

4. Discussion

4.1. Reservoir Construction Has Significantly Altered Fish Community Structure

Between 2005 and 2006, before and during the second stage of impoundment of the TGR, the percentage of lentic fish increased and the percentage of lotic fish decreased in the Wanzhou and Fuling reaches [3]. A comparative analysis of the data from three periods (1988–1989, 2005–2008, and 2017–2019) revealed a significant decline in the number of indigenous and lotic fish species, alongside an increase in the number of alien species in the mainstream and nine important tributaries [12]. This study analyzed data from four historical periods related to the study area and compared them in terms of percentages to elucidate changes in the fish species composition. The findings indicated a marked decrease in endemic fish species and an increase in alien fish species, as well as a reduction in the proportion of lotic fish species and a rise in the proportion of lentic and eurytopic fish species due to the water storage process. These results further suggest that the water storage process in the TGR significantly impacts the structure of fish communities. Following habitat loss, degradation, migratory corridor blockage, and other environmental changes, declines in fish diversity may occur much later. Notably, in the mainstream of the TGR basin, the current decline in endemic fish species and populations is likely to worsen. Therefore, it is essential to enhance the protection of lotic and endemic fish species. The flow rate of the mainstream in the reservoir area has diminished due to the construction of the TGD, making the protection of the area at the end of the reservoir, which approximates a natural stream segment, crucial for the conservation of lotic fish. Furthermore, safeguarding important tributaries, enhancing habitats, and establishing artificial fish nests to mitigate the adverse effects of hydroelectric projects are vital for the preservation of fish diversity.

4.2. Significant Differences Between Seasons in Regard to the Fish Community

The species-level analyses, including the alpha diversity index and PCoA, indicate that the fish community composition is similar between the breeding and the overwintering seasons, while the feeding season differs significantly from both of the other seasons. This pattern may be attributed to the fact that the breeding and overwintering seasons coincide with high-water reservoir operations, whereas the feeding season occurs during low-water operations. Research on the temporal variation in fish diversity in the Yunyang section (S3) of the reservoir indicates that changes in the water level are primary factors influencing fish community dynamics [44]. A survey conducted along the mainstream river sections within the reservoir area, from Zigui county to Chaotianmen in Chongqing, found no significant differences in the mean fish density during the breeding and overwintering seasons [21]. This somewhat aligns with the findings in the present investigation. The results of multiple comparisons among the different groups revealed no significant spatial differences within the seasons. Notably, the number of tributary species during the feeding season differed significantly from the other seasons, suggesting that tributaries provide favorable habitats for fish during low-water levels in the reservoir area.
Furthermore, there was a significant difference in fish species richness between the reservoir group and the tail group during the overwintering season, particularly in the riverine zone. Fish diversity in the riverine and transition zones also varied compared to the lacustrine zone across different seasons, indicating that fish tend to thrive in the tail of the reservoir, away from the main reservoir environment. Relevant studies have shown that the peak spawning activities of drifting-egg fish in the reservoir group occur from mid-June to mid-July, with minimal spawning activity before early June. In contrast, large-scale spawning occurs in the tail group in mid-May [11]. This suggests that reservoir operations impact the reproductive behavior of fish, with the reservoir group being more affected than the tail group. This may explain the higher number of fish species observed during the feeding season and the greater species richness in the tail group throughout the year.
The composition of fish ecological types reveals that the proportion of lotic fish species and the numbers of sequences in the reservoir group is lower than in the tail group across all seasons, while the proportion of lentic and eurytopic fish species is higher in the reservoir group. This may indicate that the construction of the TGR has altered natural stream conditions, compelling lotic fish to migrate upstream in search of suitable habitats with appropriate current velocities [13]. In contrast, the tail of the reservoir retains more habitat for lotic fish than the reservoir group. Additionally, the sequence ratios of lotic fish are greater in the mainstream than in the tributaries during the breeding season, while the reverse is true during the overwintering season, suggesting that lotic fish prefer to breed in the mainstream and overwinter in the tributaries.

4.3. The Influence of Environmental Factors on the Spatiotemporal Distribution of Fish

The correlation analysis of the environmental factors showed that WT significantly influences the distribution of fish communities. This influence may stem from the weak exchange capacity of the reservoir water body, the elevated nutrient salt content across all the regions, and water temperature acting as a controlling factor in regard to the characteristics of the water ecosystem in the TGR, thereby exerting a pronounced impact on fish populations [45]. Additionally, temperature plays a crucial role in both the gonadal and embryonic development in fish. Successful gonad maturation, egg activity, and normal development depend on maintaining the water temperature at optimal levels. Furthermore, water temperature can indirectly affect fish communities by influencing phytoplankton, a primary food source for fish [46]. The interaction among various environmental factors also impacts fish populations; for instance, the WT affects the DO concentration, which subsequently influences the biological and microbial activity, pH, and other parameters [47]. TN and TP primarily affected the mainstream and reservoir groups during the breeding and overwintering seasons, indicating that the nutrient content of the reservoir’s mainstream significantly influences fish communities, particularly in the section near the reservoir’s head. Previous studies have shown that during the stable operational period of the reservoir, TN and TP inputs from the backwater section of the Daning river (S2) are three and ten times higher than inputs from the upstream runoff, respectively. The nitrification of organic nitrogen in the soil during high-water levels in the reservoir may serve as the main source of nitrate in the water [10,48]. The accumulation of both phosphorus and nitrogen can lead to eutrophication, which adversely affects fish health. Excessive ammonia nitrogen levels can cause various stress injuries in fish, including oxidative stress, growth retardation, and lesions in the gill epithelium and other organs and tissues [49]. Therefore, it is essential to manage the water ecosystem in the head section of the reservoir during periods with high-water levels.
Differences in fish composition and their response to environmental factors in the mainstream and tributary streams during the breeding season may be linked to the necessity for specific spawning sites. Moreover, the fish composition in the mainstream group exhibited greater consistency across all the seasons, and elevation did not significantly affect the fish community, suggesting that the ecological environment in the mainstream remains relatively uniform within the reservoir area.

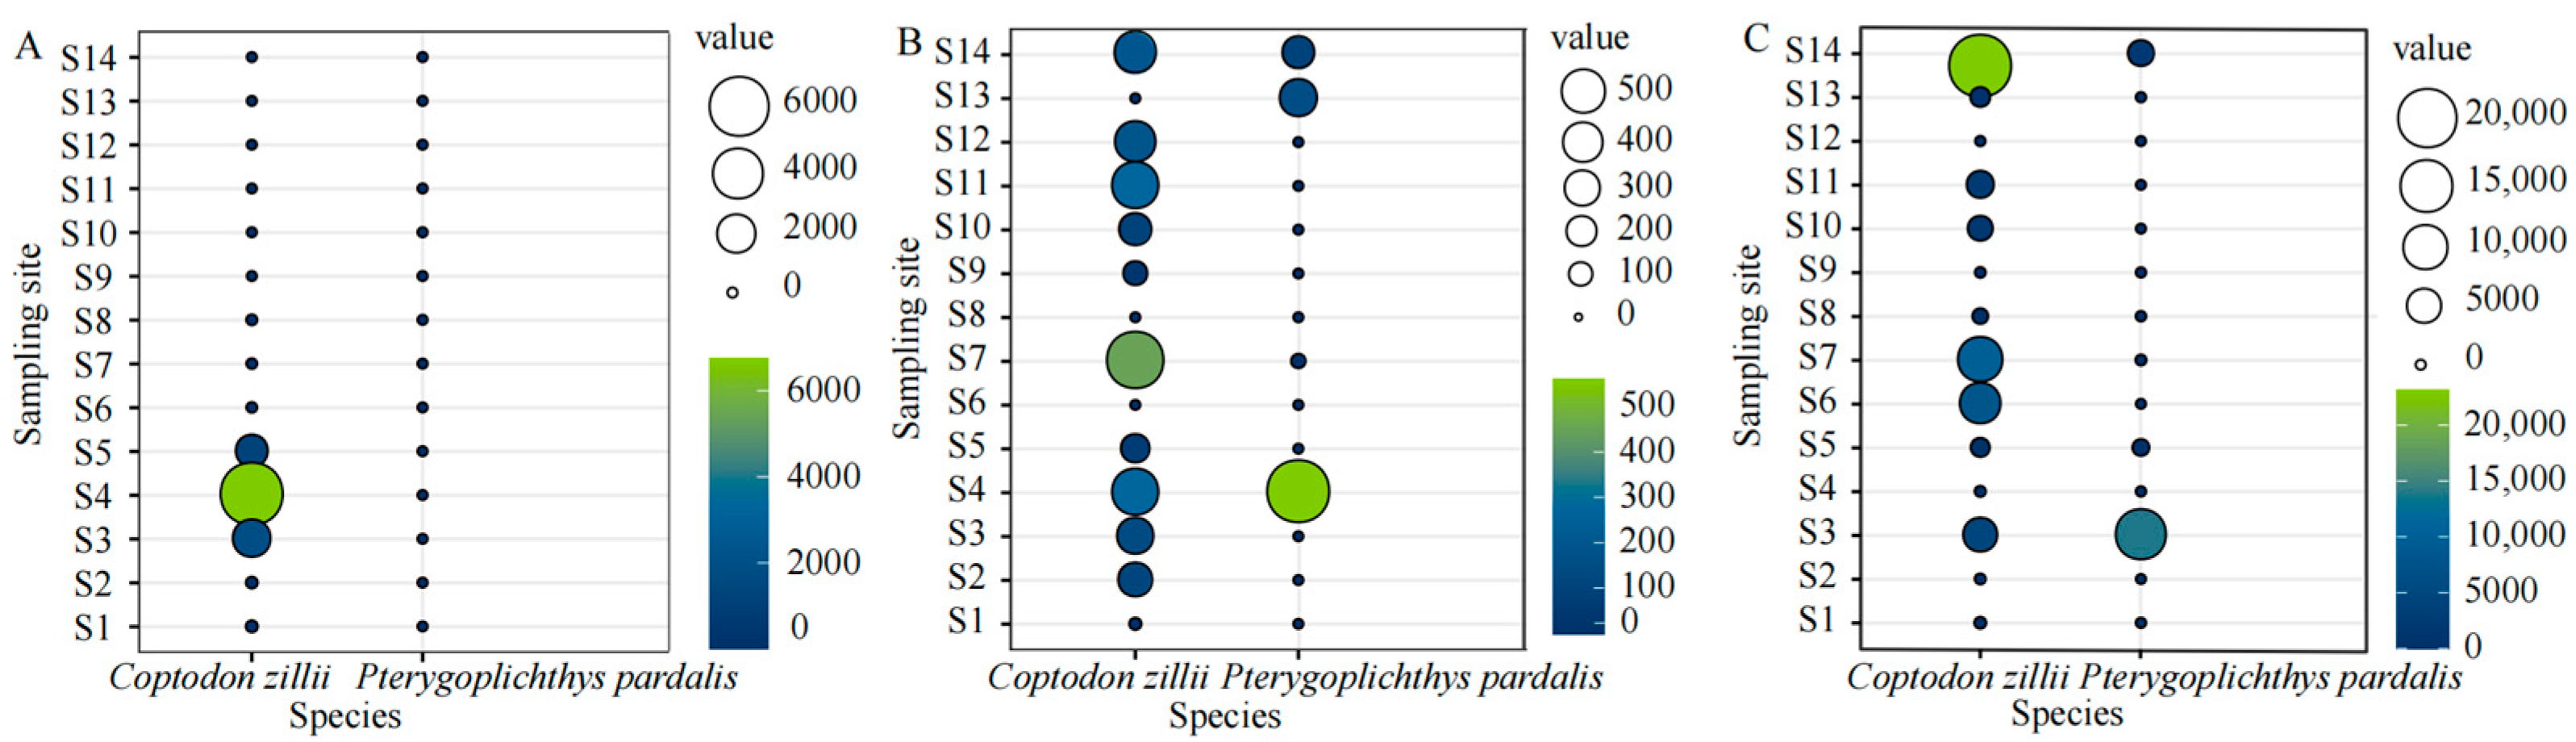
4.4. Alien Fish Need to Be Controlled

In particular, eDNA technology enables the detection of species presence or absence without the need to capture or directly observe individual organisms [50]. This technology exhibits high sensitivity, which is crucial for the early detection of alien fish species once they enter natural water bodies. As a non-invasive monitoring technique, eDNA technology is more sensitive than traditional detection methods, facilitating efficient detection and tracking of invasive fish. Ficetola et al. were pioneers in applying this technique within aquatic biology, utilizing it for the first time to monitor the distribution of the invasive American bullfrog (Rana catesbeiana) [17]. Jerde et al. further employed eDNA technology to monitor the invasion of Cyprinidae fish in the Great Lakes of North America, revealing that the invasion ranges of Aristichthys nobilis and Hypophthalmichthys molitrix had exceeded regulatory areas [18]. However, research utilizing eDNA technology in regard to the priority invasive alien species in the TGR area is lacking. The “List of Priority Invasive Alien Species for Management” is China’s official document regarding invasive alien species. This study successfully detected two species listed in this catalog: C. zillii and P. pardalis. C. zillii demonstrates strong physiological tolerance (to low oxygen, starvation, high ammonia nitrogen, etc.), multiple spawning periods each year, and strong dietary plasticity [51]. The potential ecological impacts of C. zillii may include a reduction in native fish diversity through predation on native fish eggs, competition for food resources, and aggressive behavior during the breeding season, which can adversely affect the habitat and reproductive activities of other fish species [52]. P. pardalis [53] exhibits robust survival and reproductive capabilities, due to its lower water quality and food requirements compared to other fish species. Its primary hazards include damaging riverbanks and dams, disrupting the local aquatic food chain, destroying fishing gear and fishery production, and affecting nutrient cycling within the water body. The results of this study indicate that the invasion and diffusion of C. zillii is pronounced, with both invasive fish species detected at higher sequence abundances in the mainstream and tail sections of the reservoir. Consequently, these two alien fish species necessitate special attention, with targeted removal efforts prioritized in the reservoir’s head area, alongside dynamic tracking, monitoring, and enhanced regulatory protection. Additionally, comprehensive background data collection for these two species using traditional fish resource survey methods is essential to fully map their distribution and density in the TGR area. Furthermore, human activities are the primary drivers of invasive alien fish species. The presence of C. zillii in water bodies primarily originates from escapes from fish farms, while P. pardalis are often released by ornamental fish enthusiasts. Therefore, strengthening regulations on farmed fish and ornamental fish releases is imperative.

4.5. The Limitations of the eDNA Method

The eDNA method demonstrates high efficiency in detecting fish diversity, and its adoption over traditional survey methods can significantly reduce the associated labor required and costs. However, eDNA technology has several limitations. For one thing, the identification of fish DNA does not necessarily confirm the presence of the species at the sampling transect, as identification may result from DNA contamination. Consequently, our analysis must rely on data from fishing surveys, observations, and reports to substantiate the likelihood of fish residing in our study area. Another limiting factor is the quantitative correlation between eDNA sequences and actual species abundance. Although the most prevalent sequences in our eDNA analysis align with the most common local species, the relationship between sequence abundance and fish population size remains unclear. Therefore, quantitative measurements derived from eDNA data do not provide insights into total fish biomass and may not be directly comparable to results obtained from traditional survey methods [54]. Additionally, eDNA technology faces limitations due to primer preferences and sequences that inadequately distinguish closely related species [55]. The uncertainty surrounding the mechanisms by which various environmental conditions influence eDNA concentrations presents further challenges for field investigations of environmental DNA [56,57].
Future research could enhance the accuracy of the findings and provide a more comprehensive understanding of biodiversity dynamics by integrating eDNA technology with traditional fishing and acoustic survey techniques, expanding the study’s scope to encompass additional sampling locations, and extending survey durations.

4.6. Recommendations for the Conservation of Fish Diversity in Large Reservoirs

While hydropower development offers substantial economic benefits, it also introduces numerous ecological challenges. To effectively address the relationship between hydropower development and sustainable development, the following conservation recommendations are put forward based on the research findings.
Protecting critical tributary habitats and establishing nature reserves are essential measures. The findings from this study indicate that fish diversity in tributaries surpasses that in the mainstem region, particularly in tributaries that are closer to natural river segments and farther from dams. It is crucial to maintain water quality monitoring to prevent pollution and algal blooms. The development of lake water bodies within reservoirs poses a significant risk to water quality, and the deterioration of mainstem water quality often adversely impacts tributary water quality, threatening fish survival. Additionally, mapping the dispersal pathways of invasive fish and identifying resources within watersheds is vital for effective control and targeted removal, utilizing eDNA technology, alongside traditional fishing survey methods.

5. Conclusions

This study examined the spatial and temporal variations in fish community structure and diversity across different life stages, including breeding, feeding, and overwintering periods, within the Three Gorges Reservoir. The investigation utilized eDNA technology to assess these dynamics throughout the year. We investigated how fish communities are impacted by environmental conditions. Using historical data, we examined how the composition of fish communities changed over time. We presented comprehensive baseline data on the fish species composition and richness to characterize the ecological status of fish communities in the basin, while also documenting the spatiotemporal patterns of two prioritized invasive fish species to inform management decisions.
The results indicate that, during the impoundment process, the abundance of lotic fish species in the reservoir area declined notably, while the abundance of lentic, eurytopic, and alien fish species increased. Currently, the watershed is predominantly inhabited by lentic and eurytopic, omnivorous, benthopelagic, adhesive egg-laying, medium-aged, small, and non-migratory fish. The populations of the invasive fish species, C. zillii and P. pardalis, require effective management, especially in the reservoir’s head area. The fish community composition and diversity were similar between the breeding and overwintering seasons, with a higher number of fish species and lotic fish observed in the tributaries and the tail of the reservoir. Except for altitude, COD and EC, all the environmental factors significantly affected the fish communities, with WT exerting the greatest influence. During the feeding season, fish are primarily affected by the WT, while nutrient salts, DO, and TRA primarily influence fish during the overwintering and breeding seasons.
Moreover, the findings demonstrated that the fish community structure has been significantly altered by the combined effects of the TGD construction and human activities. River sections located in close proximity to the dam and at lower elevations are more heavily subjected to the influence of the dam, resulting in prolonged lacustrine habitats that have undergone a complete transformation from their natural riverine characteristics. In contrast, river sections located farther from the dam experience reduced impacts, suggesting that their ecological integrity and hydrological functions could potentially be restored. Notably, fish diversity in the riverine zone at the tail end of the reservoir exceeds that observed in the lacustrine zone. In comparison with the mainstream river system, fish diversity in the tributaries generally exhibits significantly higher levels of diversity. Despite potential shifts in spawning behavior among certain fish species influenced by environmental factors within the reservoir area, our findings reveal that the composition of fish communities during the breeding season exhibited similarities to their overwintering counterparts. This observation may be attributed to the comparatively elevated water levels maintained throughout the breeding season. These results warrant further investigation to elucidate the underlying mechanisms involved and ecological implications.

Supplementary Materials

The following supporting information can be downloaded at: https://www.mdpi.com/article/10.3390/fishes10060295/s1. Table S1: List of fish species based on eDNA; Table S2: Average sequence numbers of each fish species at each sampling section during the breeding season. The total number corresponding to each sampling section is the number of fish species detected at that section; Table S3: Average sequence numbers of each fish species at each sampling section during the feeding season. The total number corresponding to each sampling section is the number of fish species detected at that section; Table S4: Average sequence numbers of each fish species at each sampling section during the overwintering season. The total number corresponding to each sampling section is the number of fish species detected at that section; Table S5: Historical list of fish based on historical information and references; Table S6: Comparison of diversity indices and number of species grouped in lacustrine, transition and riverine zones; Table S7: Comparison results of diversity indices of three typical sampling sections; Table S8: List of fish ecological type; Table S9: Correlation between RDA axes and environmental factors under seasonal grouping; Table S10: Correlation between RDA axes and environmental factors under mainstream-tributary grouping; Table S11: Correlation between RDA axes and environmental factors under reservoir area grouping.

Author Contributions

Y.S. conceived this study; Y.Z., J.H., X.D., X.Z., Z.L. and Q.C. conducted the experiments; J.H. and Y.Z. analyzed the data and drafted the manuscript; Y.S., Y.Z. and F.C. revised the manuscript critically and approved the final manuscript. All authors have read and agreed to the published version of the manuscript.

Funding

This study was supported by the National Natural Science Foundation of China (Grant No. 32202939).

Institutional Review Board Statement

This study is based on environmental DNA (eDNA) analysis and does not involve the use of physical fish specimens. The institutional review board statement is not applicable.

Informed Consent Statement

Not applicable.

Data Availability Statement

The raw sequences are available from the NCBI (https://dataview.ncbi.nlm.nih.gov, accessed on 27 March 2023) under the following accession numbers SRR28717302-SRR28717427.

Conflicts of Interest

The authors declare that they have no known competing financial interests or personal relationships that could have appeared to influence the work reported in this paper.

References

  1. Yang, Z.; Yu, Y. Investigation of Fish Biodiversity in Baima Lake Based on Environmental DNA Metabarcoding. Environ. Monit. Forewarning 2024, 16, 57–69. [Google Scholar] [CrossRef]
  2. Zhou, Z.; Tong, A.; Wu, Y.; Shui, B.; Hu, C.; Wang, J. The impact of rare species loss on species diversity and functional diversity of fish communities. Acta Ecol. Sin. 2025, 45, 252–264. [Google Scholar] [CrossRef]
  3. Gao, X.; Zeng, Y.; Wang, J.; Liu, H. Immediate impacts of the second impoundment on fish communities in the Three Gorges Reservoir. Environ. Biol. Fishes 2010, 87, 163–173. [Google Scholar] [CrossRef]
  4. Xiang, R.; Wang, L.; Li, H.; Tian, Z.; Zheng, B. Temporal and spatial variation in water quality in the Three Gorges Reservoir from 1998 to 2018. Sci. Total Environ. 2021, 768, 144866. [Google Scholar] [CrossRef]
  5. Duan, X. Studies on Fish Resources and the Fishes of Early Life History Stage in the Upper Yangtze River. Master’s Thesis, Huazhong Agricultural University, Hangzhou, China, 2008. [Google Scholar]
  6. Pereira, H.R.; Gomes, L.F.; Soares, P.T.; Martins, P.R.; Pelicice, F.M.; Teresa, F.B.; Vieira, L.C.G. Long-term responses of fish diversity to river regulation: A multi-metric approach. Environ. Biol. Fishes 2021, 104, 71–84. [Google Scholar] [CrossRef]
  7. Zhang, Q.; Lou, Z. The environmental changes and mitigation actions in the Three Gorges Reservoir region, China. Environ. Sci. Policy 2011, 14, 1132–1138. [Google Scholar] [CrossRef]
  8. He, Y.; Chen, W.; Chen, J.; Zeng, W.; Zhang, X.; Yang, T.; Zhai, D.; Liu, H.; Xiong, F.; Wang, Y. Application of DNA Barcode for Fish Diversity in the Three Gorges Reservoir Area. Sichuan J. Zool. 2023, 42, 508–518. [Google Scholar] [CrossRef]
  9. Bao, Y.; Gao, P.; He, X. The water-level fluctuation zone of Three Gorges Reservoir—A unique geomorphological unit. Earth-Sci. Rev. 2015, 150, 14–24. [Google Scholar] [CrossRef]
  10. Zheng, B.; Zhao, Y.; Qin, Y.; Ma, Y.; Han, C. Input characteristics and sources identification of nitrogen in the three main tributaries of the Three Gorges Reservoir, China. Environ. Earth Sci. 2016, 75, 1219. [Google Scholar] [CrossRef]
  11. Li, M.; Ma, Q.; Chen, L.; Liu, H. Natural reproduction and hydrologic requirements of pelagophil fish in the three gorges reservoir. Acta Hydrobiol. Sin. 2019, 43, 84–96. [Google Scholar] [CrossRef]
  12. Wei, N.; Zhang, Y.; Wu, F.; Shen, Z.; Ru, H.; Ni, Z. Current Status and Changes in Fish Assemblages in the Three Gorges Reservoir. Resour. Environ. Yangtze Basin 2021, 30, 1858–1869. [Google Scholar]
  13. Wu, X. Fish Diversity in Tributaries of the Three Gorges Reservoir and Its Responses to the Reservoir Formation. Master’s Thesis, Southwest University, Chongqing, China, 2021. [Google Scholar] [CrossRef]
  14. Wei, X.; Hu, H.; Liu, L.; Wang, Y.; Pei, D. Influence of large reservoir operation on change patterns of fish community assembly and growth adaption at low and high-water levels. Ecol. Indic. 2023, 155, 111019. [Google Scholar] [CrossRef]
  15. Rourke, M.L.; Fowler, A.M.; Hughes, J.M.; Broadhurst, M.K.; DiBattista, J.D.; Fielder, S.; Wilkes Walburn, J.; Furlan, E.M. Environmental DNA (eDNA) as a tool for assessing fish biomass: A review of approaches and future considerations for resource surveys. Environ. DNA 2022, 4, 9–33. [Google Scholar] [CrossRef]
  16. Rees, H.C.; Maddison, B.C.; Middleditch, D.J.; Patmore, J.R.; Gough, K.C. The detection of aquatic animal species using environmental DNA–a review of eDNA as a survey tool in ecology. J. Appl. Ecol. 2014, 51, 1450–1459. [Google Scholar] [CrossRef]
  17. Ficetola, G.F.; Miaud, C.; Pompanon, F.; Taberlet, P. Species detection using environmental DNA from water samples. Biol. Lett. 2008, 4, 423–425. [Google Scholar] [CrossRef]
  18. Jerde, C.L.; Mahon, A.R.; Chadderton, W.L.; Lodge, D.M. “Sight–unseen” detection of rare aquatic species using environmental DNA. Conserv. Lett. 2011, 4, 150–157. [Google Scholar] [CrossRef]
  19. Wang, M.; Yang, S.; Wang, W.; Duan, C.; Liu, Z.; Chen, Q.; Li, Y.; Shen, Y. Fish diversity in chongqing section of the national nature reserve for rare and endemic fish in the upper yangtze river based on eDNA technology. Acta Hydrobiol. Sin. 2022, 46, 2–16. [Google Scholar] [CrossRef]
  20. Xu, N.; Chang, J. Preliminary Study on Fish Species Detection in the Middle and Lower Yangtze River Using Environmental DNA. J. Hydroecol. 2016, 37, 49–55. [Google Scholar] [CrossRef]
  21. He, S.; Ni, D.; Xie, W.; Tang, C.; Deng, H.; Duan, X.; Tian, H.; Shao, J.; Wang, K.; Zhang, H. Characteristics and changes of fish distribution in the mainstem of the three gorges reservoir area at the beginning of the ten-year fishing ban. Acta Hydrobiol. Sin. 2024, 49, 022502-1–022502-12. [Google Scholar] [CrossRef]
  22. Ding, R. Sichuan Fish Chronicles; Sichuan Science and Technology Press: Chengdu, China, 1994. [Google Scholar]
  23. Shao, X.; Li, D.; Cai, Q. The composition of the fish community in xiangxi bay and resources evaluation. Acta Hydrobiol. Sin. 2006, 30, 70–74. [Google Scholar]
  24. Wu, Q.; Duan, X.; Xu, S.; Xiong, C.; Chen, D. Studies on Fishery Resources in the Three Gorges Reservoir of the Yangtze River. Freshw. Fish. 2007, 37, 70–75. [Google Scholar] [CrossRef]
  25. Yang, S.; Gao, X.; Ma, B.; Kong, Y.; Liu, H. Seasonal Dynamics of Fish Community in Mudong Section of the Three Gorges Reservoir of the Yangtze River, China. Chin. J. Appl. Env. Biol. 2010, 16, 555–560. [Google Scholar]
  26. Dong, C.; Yang, Z.; Gong, Y.; Tang, H. Fish resource status and biodiversity conservation in the main channel of Three Gorges Reservoir. J. Hydroecol. 2019, 40, 15–21. [Google Scholar]
  27. Luo, J. Using Environmental DNA to Explore Fish Diversity in Lakes of the Central Yunnan Plateau. Master’s Thesis, Yunnan University, Kunming, China, 2019. [Google Scholar]
  28. Pilliod, D.S.; Goldberg, C.S.; Arkle, R.S.; Waits, L.P. Estimating occupancy and abundance of stream amphibians using environmental DNA from filtered water samples. Can. J. Fish. Aquat. Sci. 2013, 70, 1123–1130. [Google Scholar] [CrossRef]
  29. Chen, Y. Research on the Application of Environmental DNA Technology in the Investigation of Fish Resources in the Upper Liuchong River. Master’s Thesis, Southwest University, Chongqing, China, 2020. [Google Scholar] [CrossRef]
  30. Taberlet, P.; Bonin, A.; Zinger, L.; Coissac, R. Environmental DNA: For Biodiversity Research and Monitoring; Oxford University Press: Oxford, UK, 2018. [Google Scholar] [CrossRef]
  31. Bolger, A.M.; Lohse, M.; Usadel, B. Trimmomatic: A flexible trimmer for Illumina sequence data. Bioinformatics 2014, 30, 2114–2120. [Google Scholar] [CrossRef]
  32. Magoč, T.; Salzberg, S.L. FLASH: Fast length adjustment of short reads to improve genome assemblies. Bioinformatics 2011, 27, 2957–2963. [Google Scholar] [CrossRef] [PubMed]
  33. Edgar, R.C. Updating the 97% identity threshold for 16S ribosomal RNA OTUs. Bioinformatics 2018, 34, 2371–2375. [Google Scholar] [CrossRef]
  34. Miya, M.; Sato, Y.; Fukunaga, T.; Sado, T.; Poulsen, J.; Sato, K.; Minamoto, T.; Yamamoto, S.; Yamanaka, H.; Araki, H. MiFish, a set of universal PCR primers for metabarcoding environmental DNA from fishes: Detection of more than 230 subtropical marine species. R. Soc. Open Sci. 2015, 2, 150088. [Google Scholar] [CrossRef]
  35. Schnell, I.B.; Bohmann, K.; Gilbert, M.T.P. Tag jumps illuminated–reducing sequence–to–sample misidentifications in metabarcoding studies. Mol. Ecol. Resour. 2015, 15, 1289–1303. [Google Scholar] [CrossRef]
  36. Shu, L. Assessment of Fish Diversity Based on Environmental DNA Technology: Kinetics of Embryonic Development, Primer Evaluation and Monitoring of Fish Diversity in Erhai Lake. Ph.D. Thesis, Southwest University, Chongqing, China, 2022. [Google Scholar]
  37. Schloss, P.D.; Westcott, S.L.; Ryabin, T.; Hall, J.R.; Hartmann, M.; Hollister, E.B.; Lesniewski, R.A.; Oakley, B.B.; Parks, D.H.; Robinson, C.J.; et al. Introducing mothur: Open-source, platform-independent, community-supported software for describing and comparing microbial communities. Appl. Environ. Microbiol. 2009, 75, 7537–7541. [Google Scholar] [CrossRef]
  38. Li, T.; Tang, L.; Wang, L.; An, L.; Wang, J.; Mo, K.; Chen, Q. Impacts of hydropower development on the distribution of fish populations and changes in ecotypes—A case study of the Xiluodu to Xiangjiaba river section. Acta Ecol. Sin. 2020, 40, 13. [Google Scholar]
  39. Yang, H.; Shen, L.; He, Y.; Tian, H.; Gao, L.; Wu, J.; Mei, Z.; Wei, N.; Wang, L.; Zhu, T. Status of aquatic organisms resources and their environments in Yangtze River system (2017–2021). Aquac. Fish. 2024, 9, 833–850. [Google Scholar] [CrossRef]
  40. Yang, M.; Sheng, P.; Zhang, Y.; Guo, L.; Wang, H.; Gao, X.; Chen, Y. Characteristics of fish assemblages of poyang lake at the initial stage of the fishing ban. Acta Hydrobiol. Sin. 2022, 46, 1569–1579. [Google Scholar] [CrossRef]
  41. Surhone, L.M.; Tennoe, M.T.; Henssonow, S.F. Scheffé’s Method; Wiley: New York, NY, USA, 2010. [Google Scholar]
  42. Williams, L.J.; Abdi, H. Fisher’s least significant difference (LSD) test. Encycl. Res. Des. 2010, 218, 840–853. [Google Scholar]
  43. Lai, J.; Zou, Y.; Zhang, J.; Peres-Neto, P.R. Generalizing hierarchical and variation partitioning in multiple regression and canonical analyses using the rdacca. hp R package. Methods Ecol. Evol. 2022, 13, 782–788. [Google Scholar] [CrossRef]
  44. Zhang, W. Temporal and Spatial Changes of Fish Community Structure and Diversity in the Three Gorges Reservoir Area. Master’s Thesis, Jianghan University, Wuhan, China, 2023. [Google Scholar]
  45. Luo, Z.; Zhang, Y.; Zheng, B.; Fu, G.; Lu, Z. Analysis of aquatic environmental characters in Three Gorges Reservoir of China at early reserving stage. Resour. Environ. Yangtze Basin 2005, 14, 780–785. [Google Scholar] [CrossRef]
  46. Zhang, X.; Hu, Y.; Yang, W.; Li, W.; Yang, S. Effect of water temperature on the life activities of temperate freshwater fish. J. Hydroecol. 2021, 42, 117–122. [Google Scholar] [CrossRef]
  47. Dai, L.; Li, H.; Chen, X. Study on Water Temperature Structure and Its Impact on Water Quality at Reservoir Area. HongShui River 2010, 29, 30–35. [Google Scholar]
  48. Luo, Z.-X.; Bo, Z.; Zheng, B.-H.; Zhang, Y. Nitrogen and phosphorus loadings in branch backwater reaches and the reverse effects in the main stream in Three Gorges Reservoir. China Environ. Sci. 2007, 27, 208–212. [Google Scholar]
  49. Wang, X.; Yang, X.; Peng, H.; Dai, J.; Yang, T. Research Progress on Effects of Ammonia Nitrogen Stress on Life Activities of Fish. J. Aquac. 2024, 8, 18–24. [Google Scholar] [CrossRef]
  50. Thomsen, P.F.; Willerslev, E. Environmental DNA–An emerging tool in conservation for monitoring past and present biodiversity. Biol. Conserv. 2015, 183, 4–18. [Google Scholar] [CrossRef]
  51. Younes, A.; Saito, H.; Tani, S.; Ikeo, R.; Kawai, K. Metagenomic analysis of gut microbiome from tilapia species across several regions in Japan. Aquaculture 2023, 576, 739809. [Google Scholar] [CrossRef]
  52. Xing, Y.; Tang, S.; Temesgen, T.; Zhao, J. Invasion and management implications of Coptodon zillii in China. Chin. J. Ecol. 2024, 44, 645–653. [Google Scholar]
  53. Liu, F.; Wei, H.; Hu, Y.; Gu, D.; Mou, X.; Luo, D.; Xu, M. Age and growth characteristic of invasive fish Pterygoplichthys pardalis in the Liuxi River. Freshw. Fish. 2019, 49, 22–30. [Google Scholar] [CrossRef]
  54. Zhang, S.; Zheng, Y.; Zhan, A.; Dong, C.; Zhao, J.; Yao, M. Environmental DNA captures native and non-native fish community variations across the lentic and lotic systems of a megacity. Sci. Adv. 2022, 8, eabk0097. [Google Scholar] [CrossRef]
  55. Mishra, P.; Kumar, A.; Nagireddy, A.; Mani, D.N.; Shukla, A.K.; Tiwari, R.; Sundaresan, V. DNA barcoding: An efficient tool to overcome authentication challenges in the herbal market. Plant Biotechnol. J. 2016, 14, 8–21. [Google Scholar] [CrossRef]
  56. Shogren, A.J.; Tank, J.L.; Egan, S.P.; Bolster, D.; Riis, T. Riverine distribution of mussel environmental DNA reflects a balance among density, transport, and removal processes. Freshw. Biol. 2019, 64, 1467–1479. [Google Scholar] [CrossRef]
  57. Strickler, K.M.; Fremier, A.K.; Goldberg, C.S. Quantifying effects of UV-B, temperature, and pH on eDNA degradation in aquatic microcosms. Biol. Conserv. 2015, 183, 85–92. [Google Scholar] [CrossRef]
Figure 1. (A) The map of the sampling transects was created using ArcGIS 10.8. A total of 126 samples was collected in May, September, and December 2022. (B) Rarefaction curve for a total of 126 samples, each line represents one sample.
Fishes 10 00295 g001
Figure 2. Circos species relationship charts: (A) represents species composition at the order level and (B) represents species composition at the family level. The lengths of the outermost bands represent the total number of sequences in different seasons and classification levels. The bands corresponding to different sampling transects represent the composition of the number of species sequences at different classification levels. S1–S14 are arranged clockwise to represent 14 sampling transects.
Fishes 10 00295 g002
Figure 3. Bubble maps of two priority invasive alien species for management purposes: (A) represents breeding season, (B) represents feeding season, and (C) represents overwintering season. The size and different colors of the bubbles indicate the quantity of the sequence.
Fishes 10 00295 g003
Figure 4. (A) Line graph of the percentage of different types of fish over time; (B) percentage stacked bar chart of four different species ecotypes over time. The fish are classified into three ecological types based on their preference for flow velocity: N, lentic fish; R, lotic fish; G, eurytopic fish. The fish are classified into three ecological types based on their preference for food characteristics: H, phytophagous fish; O, omnivorous fish; C: carnivorous fish. The fish are classified into three ecological types based on their preference for water layers: U, pelagic fish; L, lower mesopelagic fish; B, benthopelagic fish. The fish are classified into five ecological types based on the characteristics of fish spawning: A, adhesive egg; D, sinking egg; F, drifting egg; W, floating egg; S, special modality.
Fishes 10 00295 g004
Figure 5. Box plots, with significant differences marked by letters: (AC) mapping of the number of species collected at each sample site; (DF) mapping of Shannon index. BG stands for breeding season mainstream group, BZ stands for breeding season tributary group, FG stands for feeding season mainstream group, FZ stands for feeding season tributary group, OG stands for overwintering season mainstream group, OZ stands for overwintering season tributary group, BKU stands for breeding season reservoir group, BKW stands for breeding season tail of the reservoir group, FKU stands for feeding season reservoir group, FKW stands for feeding season tail of the reservoir group, OKU stands for overwintering season reservoir group, and OKW stands for overwintering season tail of the reservoir group. The presence of the same letter means there is no significant difference, and the absence of the same letter means that there is a significant difference.
Fishes 10 00295 g005
Figure 6. Percentage stacked bar chart for seven different species ecotypes: (AC) mapping of the number of species; (DF) mapping of the number of sequences. Fish are classified according to age at first sexual maturity and length, and whether they are migratory or not, into the following categories: low, ≤1 year old; medium, 2–4 years old; high, >4 years old; small, <20 cm; middle, 20–40 cm; large, >40 cm; Y, migratory fishes; N, non-migratory fishes. Refer to Figure 4 and Figure 6 for the definitions of the remaining abbreviations.
Fishes 10 00295 g006
Figure 7. PCoA and RDA diagrams: PCoA of the composition of fish communities (AC); results from RDA on the relationships between environmental factors and fish communities (DF). WT, DO, TRA, NH3-N, ALT, TN, COD, TP, and EC stand for water temperature, dissolved oxygen, transparency, ammonia nitrogen, altitude, total nitrogen, chemical oxygen demand, total phosphorus, and electrical conductivity. Refer to Figure 5 for the definitions of the remaining abbreviations.
Fishes 10 00295 g007
Table 1. Number of species and sequences at family level and their proportions.
OrderFamilySpecies (Proportion)Sequences (Proportion)
CypriniformesCyprinidae70 (56.45%)4,872,927 (74.12%)
Cobitidae13 (10.48%)200,496 (3.05%)
Homalopteridae3 (2.42%)22,907 (0.35%)
Catostomidae1 (0.81%)362 (0.01%)
SiluriformesBagridae9 (7.26%)216,718 (3.3%)
Amblycipitidae3 (2.42%)118,661 (1.8%)
Sisoridae3 (2.42%)3072 (0.05%)
Siluridae2 (1.61%)61,210 (0.93%)
Clariidae1 (0.81%)1018 (0.02%)
Ictaluridae1 (0.81%)1589 (0.02%)
Loricariidae1 (0.81%)17,188 (0.26%)
PerciformesSerranidae4 (3.22%)33,800 (0.51%)
Centrarchidae2 (1.61%)133,513 (2.03%)
GobiiformesGobiidae3 (2.42%)613,293 (9.33%)
CichliformesCichlidae2 (1.61%)73,640 (1.12%)
OsmeriformesSalangidae2 (1.61%)81,411 (1.24%)
AcipenseriformesAcipenseridae1 (0.81%)6257 (0.09%)
AnabantiformesChannidae1 (0.81%)8824 (0.13%)
BeloniformesAdrianichthyidae1 (0.81%)98,840 (1.5%)
CyprinodontiformesPoeciliidae1 (0.81%)8973 (0.14%)
Table 2. Alpha diversity indices for each sampling transect.
SampleChao1RichnessShannonSimpsonACE
BS18525.2238226.04840.11548574.17
BS256,014.6219,8507.15890.124665,521.95
BS329,719.9810,1907.05660.110430,245.73
BS493,441.3127,9647.99010.050097,345.04
BS5140,481.7037,2408.64790.0323156,216.50
BS649,424.5915,1356.45190.163859,649.74
BS786,236.6223,8588.03940.051591,036.82
BS836,861.7413,0166.86070.091738,379.46
BS934,133.6916,6398.02030.030834,761.52
BS1018,585.1990698.88220.011719,828.23
BS11101,692.9034,2118.39980.0455108,518.10
BS1275,562.5132,5807.11420.124081,265.38
BS1393,942.1035,3079.77130.015091,855.06
BS1463,992.5224,3649.18280.026162,782.31
FS143,252.4211,78210.11200.005346,333.38
FS236,191.8111,7439.09990.025440,027.40
FS351,309.3212,8179.75720.018453,520.79
FS443,607.6313,0049.90420.007547,677.50
FS529,127.0411,5529.76820.006032,985.07
FS643,148.6215,4919.57460.009147,538.16
FS741,431.7313,80710.02310.006647,616.64
FS840,782.1713,8869.70920.006847,026.40
FS927,423.3010,6479.46430.009731,990.83
FS1034,713.30934310.20630.006438,112.42
FS1139,974.0111,50110.39640.005240,562.15
FS1251,773.6712,87410.23810.005655,564.40
FS1346,715.3112,55310.13640.007050,341.60
FS1455,802.9415,06410.49630.006060,927.68
OS119,451.2797717.49450.047118,882.00
OS251,074.5419,5037.89200.044948,498.48
OS321,029.1910,4918.20380.023620,231.17
OS424,421.1211,6355.40160.220723,544.02
OS524,640.1411,6128.22680.025523,687.44
OS643,024.3316,2457.55360.076242,510.28
OS720,677.2291457.26730.053319,769.00
OS818,092.0186255.85830.173619,465.20
OS937,733.2716,0877.62110.051537,498.15
OS1039,206.7816,6648.28440.038138,735.13
OS1135,626.1017,2248.69650.022235,421.48
OS1217,542.5286148.04340.032617,289.62
OS1348,119.5819,1168.39850.032347,007.66
OS1445,194.0119,6908.91540.020646,244.19
Notes: B, F, and O stand for breeding, feeding, and overwintering seasons.
Table 3. Multiple comparison results for different groups.
PairsR2p
Breed vs. Feed0.28950.0010 **
Breed vs. Overwinter0.09810.0010 **
Feed vs. Overwinter0.35010.0010 **
BG vs. BZ0.08620.3508
BG vs. FG0.33990.0050 **
BG vs. FZ0.34630.0025 **
BG vs. OG0.14490.0538
BG vs. OZ0.12300.0538
BZ vs. FG0.31140.0025 **
BZ vs. FZ0.31470.0025 **
BZ vs. OG0.15060.0038 **
BZ vs. OZ0.13400.0120 *
FG vs. FZ0.04940.8690
FG vs. OG0.37210.0038 **
FG vs. OZ0.37280.0025 **
FZ vs. OG0.37680.0025 **
FZ vs. OZ0.38310.0025 **
OG vs. OZ0.06930.6332
BKU vs. BKW0.08310.3490
BKU vs. FKU0.28290.0025 **
BKU vs. FKW0.32310.0038 **
BKU vs. OKU0.13510.0135 *
BKU vs. OKW0.12310.0259 *
BKW vs. FKU0.34120.0025 **
BKW vs. FKW0.37760.0025 **
BKW vs. OKU0.19500.0025 **
BKW vs. OKW0.11690.1313
FKU vs. FKW0.09780.2331
FKU vs. OKU0.39860.0025 **
FKU vs. OKW0.34140.0083 **
FKW vs. OKU0.44920.0038 **
FKW vs. OKW0.37230.0025 **
OKU vs. OKW0.08920.3386
Notes: B, F, and O stand for breeding, feeding, and overwintering seasons. G, Z, KU, and KW stand for mainstream group, tributary group, reservoir group, and tail of the reservoir group. BG stands for breeding season mainstream group, other abbreviations have similar meanings, and so on; * p < 0.05, ** p < 0.01.
Table 4. Information on each environmental factor based on RDA analysis.
NameUniqueAverage. ShareIndividualI. Perc (%)p
WT0.03450.02870.063219.870.001 **
DO0.01620.02500.041212.960.001 **
TRA0.02650.01070.037211.700.003 **
pH0.01070.02110.031810.000.001 **
NH3-N0.02690.00140.02838.900.044 *
ALT0.02150.00430.02588.110.958
TN0.00970.01430.02407.550.001 **
COD0.01970.00300.02277.140.384
TP0.01690.00560.02257.080.007 **
EC0.02260.00080.02186.860.503
Notes: WT, DO, TRA, NH3-N, ALT, TN, COD, TP, and EC stand for water temperature, dissolved oxygen, transparency, ammonia nitrogen, altitude, total nitrogen, chemical oxygen demand, total phosphorus, and electrical conductivity. Unique refers to the explanatory power of each factor alone in regard to changes in community structure, without the influence of other environmental factors. Average. share refers to the average explanatory power of each factor in regard to changes in community structure when all the environmental factors work together. Individual refers to the total effect of each factor in regard to all factor interactions, including the unique effects of the factor itself and its interactions with other factors. I. Perc (%) is the proportion of the individual explanatory power of each factor to the total explanatory power of all the factors, expressed as a percentage; * p < 0.05, ** p < 0.01.
Disclaimer/Publisher’s Note: The statements, opinions and data contained in all publications are solely those of the individual author(s) and contributor(s) and not of MDPI and/or the editor(s). MDPI and/or the editor(s) disclaim responsibility for any injury to people or property resulting from any ideas, methods, instructions or products referred to in the content.

