Abstract
Revealing taxonomic, functional, and phylogenetic dimensions of biodiversity is critical for the effective conservation and management of aquatic organisms in freshwater ecosystems subjected to multiple threats. Fish biodiversity patterns in river ecosystems exhibit complex spatiotemporal variation influenced by hydrological connectivity and the dispersal ability of species within the river network. This study utilized eDNA metabarcoding to investigate fish communities in three subtropical mountain rivers, aiming to uncover the community structure and spatiotemporal dynamics of the multidimensional biodiversity of fish communities across varying positions within the river network. The three biodiversity indices of the fish communities at the confluence were significantly greater than those of the mainstream community in the dry season, whereas the phylogenetic diversity of the fish community at the tributaries during the wet season was significantly greater than that in the mainstream. This likely reflected the unique spatial configuration of confluences and the seasonal dispersal of fish in the river network. The results of this study highlighted the important role of confluences and tributaries in river networks and the fact that they need to be prioritized to conserve riverine fish diversity.
Key Contribution:
This study revealed the spatial and temporal dynamics of fish community structure and multidimensional biodiversity across different river network positions. Our results highlighted that confluences and tributaries serve as biodiversity hotspots and should be prioritized in conservation planning.
1. Introduction
Freshwater ecosystems support a disproportionately high level of global biodiversity, with fish communities playing essential ecological and economic roles [1,2]. However, these ecosystems are facing severe anthropogenic pressures, leading to marked reductions in fish diversity and abundance [3,4,5]. The efficient monitoring of fish communities and a comprehensive understanding of biodiversity patterns are thus critical for informing conservation priorities and guiding adaptive river management [6].
Biodiversity comprises multiple dimensions [7,8,9], including taxonomic diversity (TD), which captures species richness and composition [10,11]; functional diversity (FD), which describes the variation in species’ ecological roles based on trait differences [12]; and phylogenetic diversity (PD), which reflects the evolutionary relationships among species [13]. Although TD is widely used in biodiversity assessments, neglecting FD and PD can obscure critical aspects of ecosystem functioning and evolutionary distinctiveness, thereby hindering the development of effective conservation and management strategies [14,15,16]. An integrated assessment of TD, FD, and PD offers a more holistic understanding of community assembly processes and ecosystem resilience [17,18].
In river ecosystems, fish biodiversity varies systematically with their position in the river network [6]. The river continuum concept suggests that fish diversity in headwater streams is generally lower than in downstream reaches due to environmental filtering effects, such as fast-flowing water, that limit the suitability of headwater habitats for many species [19,20]. Confluences are key junctions where tributaries and mainstreams converge, generating complex spatial structures and distinct environmental conditions that enhance local habitat heterogeneity [21,22]. Confluences usually present high species richness and unique community compositions because they are important pathways for the dispersal of organisms in adjacent mainstreams and tributaries [23,24]. For example, Czeglédi et al. [25] reported that compared to those at other tributary sites, fish communities at tributary confluences presented the highest species richness. Similarly, the phylogenetic diversity of fish communities at confluences is greater than that in tributaries and mainstem streams [6]. However, fish biodiversity patterns within river networks can exhibit marked seasonal variation [25,26,27]. However, the taxonomic, functional, and phylogenetic diversity patterns of fish communities across different positions within river networks (e.g., tributary, mainstream, and confluence), as well as their seasonal dynamics, remain insufficiently understood.
Recently, eDNA metabarcoding, which identifies species based on genetic fragments released by organisms into water bodies, has been widely used for monitoring fish communities and diversity because it is labor-saving and noninvasive to ecosystems [9,28]. Along with fish taxonomic information, eDNA also has high efficiency and accuracy in detecting the functional diversity and phylogenetic diversity of fish communities [29,30,31]. In this study, based on eDNA metabarcoding technology, a cross-seasonal fish community investigation was conducted at different river network positions (tributary, mainstream, and confluence) in three subtropical mountain rivers. For fish communities in three different habitats, we hypothesized that (1) the diversity of the fish communities in tributaries is low because the habitat structure of tributaries is simple and fish are mostly specialized species adapted to this environment, and (2) the fish community at the confluence has the highest biodiversity as species from tributaries and the mainstream may appear at the confluence. This study revealed the patterns of fish diversity in river networks and may contribute to the conservation and management of river fish diversity.
2. Materials and Methods
2.1. Study Area and Sampling Sites
The Wannan Mountain region (WMR) is located in the southern Anhui, China, where most mountains and hills are 500–1000 m above sea level. Influenced by the subtropical monsoon climate, the annual precipitation in the mountainous areas of southern Anhui varies between 1100 and 2500 mm, 60% of which is concentrated between May and August. The average annual temperature in the WMR is between 15.5 and 16 °C. The main river systems in the WMR include the Qiupu River, the Qingyi River, and the Shuiyang River, which are the main tributaries in the lower reaches of the Yangtze River (Table S1). The gradient of these rivers ranges from 1 to 5‰, and the bottom is mostly rocky. In this study, eDNA surveys were conducted in the Qiupu River, Qingyi River, and Shuiyang River Basins in August 2023 and January 2024. The eight sites in each basin were distributed across tributaries, main streams, and confluences, and 24 sites were investigated in the three basins each season (Figure 1). Based on the method of Strahler [32], tributary and mainstream sampling sites were located on first- or second-order streams and on fourth- or higher-order streams, respectively. Confluence sites were defined as the intersections of second- and third-order streams, or third- and fourth-order streams.
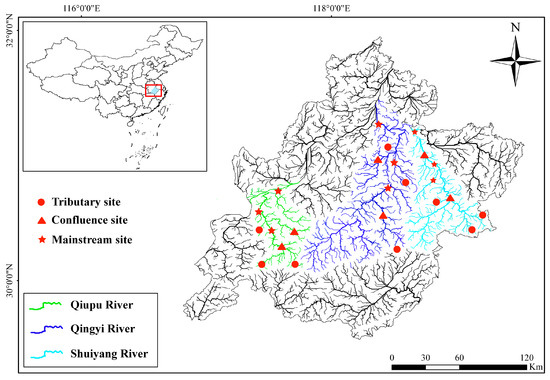
Figure 1.
Location of the sampling areas and distribution of the sampling sites.
2.2. Water Sample Collection
2.2.1. Collection and Processing of eDNA
To minimize the potential influence of hydrological variability on eDNA detection, all sampling was conducted under baseflow conditions, with sites subject to recent heavy rainfall or sudden discharge events systematically excluded. Sampling was consistently performed between 09:00 and 16:00 to mitigate potential biases arising from diel fluctuations in water temperature. Before collecting water samples, the sampling bottles and hydrophore sampler were cleaned with 10% bleach, and the operators changed to fresh sterilized gloves when new water samples were collected while sampling. Composite samples were obtained for a comprehensive survey of fish species at each sampling site. Specifically, 1 L water samples were collected from the left, middle, and right sections of the river. In the wadable river sections, we also considered different microhabitats, such as riffles and pools. Three replicates were set for each sampling site. The water samples obtained from different replicates at each site were mixed with 3 L of water and used for subsequent filtration and eDNA extraction. A blank control was established with 3 L of distilled water to assess potential contamination by field collection. The water samples were concentrated on mixed cellulose filter membranes (Jinteng 0.45 µm, Tianjin, China) using a vacuum pump within 4–8 h. To avoid cross-contamination between sampling sites, all equipment was sterilized before and after each water sample was filtered [33]. The filter membranes enriched with eDNA were transferred to cryopreservation tubes and stored at −80 °C until further processing.
Total DNA was extracted using PowerWater DNA Isolation Kits (Qiagen, Shanghai, China) following the manufacturer’s instructions. Following the amplification system and PCR procedure described by Zhang et al. [34], the mitochondrial 12S rRNA region was amplified by PCR using the primers Tele02_F (5′-AAACTCGTGCCAGCCACC-3′) and Tele02_R (5′-GGGTATCTAATCCCAGTTTG-3′) [35]. Moreover, the negative and blank controls were amplified using the same PCR protocol to assess potential contamination. The PCR products were analyzed by 2% agarose gel electrophoresis, and the target bands were purified and recovered. The samples were subsequently submitted to Lingen Biotechnology Co., Ltd. (Shanghai, China) for sequencing on the Illumina MiSeq platform. The original sequences were filtered by Trimmomatic v.0.36 [36] to remove low-quality and chimeric sequences. Based on the overlap between the original reads, paired reads were merged into sequences using FLASH v.1.2.11 [37]. Using de novo and reference sequence methods, chimeras were removed using the Usearch software [38] and the Gold database. Sequence clustering was performed using Usearch v.10 based on a similarity threshold of ≥97% [39]. The most abundant sequences were selected as the representative sequences for each operational taxonomic unit (OTU), which refers to a cluster of similar DNA sequences used as a proxy for a species in metabarcoding studies. Preliminary taxonomic identification was conducted by comparing representative sequences with those in the NCBI GenBank database using the Blastn tool, with parameters set to a similarity of ≥97%, coverage of ≥0.9, and e-value ≤ −10−5 [40]. Further species classification was performed based on a self-built database [41]. The self-built 12S rRNA database was constructed using muscle samples from previously captured fish specimens, along with public sequences from NCBI for species listed above that have not yet been collected. Our self-built database encompasses nearly all the fish species recorded in the drainage area. In cases of discrepancies between the results obtained from the self-built and NCBI databases, the findings from the self-built database were prioritized. OTUs with a relative abundance below 0.001% were excluded [42], and species unrelated to the study area were also removed (e.g., native fish species that are only found in the upper reaches of the Yangtze River). Using this process, the species composition in each basin was determined.
2.2.2. Functional Traits
To assess the functional composition of fish communities in different habitats (i.e., tributary, mainstream, and confluence), 9 morphological metrics that reflect feeding, migration, and habitat use behaviors were selected (Table S2). These morphological metrics for most species are based on individual measurements collected during historical surveys [43,44]. For species that have not been measured historically, morphological metrics were obtained from published data. Based on these 9 morphological metrics, we identified and calculated seven functional traits for subsequent analysis: relative eye size, mouth gape position, relative gut length, eye position, body shape, body height, and Caudal peduncle depth (Table S2).
2.2.3. Phylogenetic Tree Construction
The representative sequences of the most abundant OTUs assigned to each species were used to infer phylogenetic relationships among species. The maximum likelihood (ML) method was used to construct the phylogenetic tree, and the nearest neighbor interchange (NNI) algorithm was applied to optimize its topology [45,46]. The bootstrapping (n = 1000) method was subsequently used to assess the stability and confidence of the tree [47]. The phylogenetic tree was constructed and evaluated using the MEGA 7.0 software [48].
2.2.4. Data Analysis
A Venn analysis was performed to determine the differences in species composition among the three habitats, and the VennDiagram package was used for the Venn analysis [49]. A permutational multivariate analysis of variance (PERMANOVA) was applied to assess variations in fish community composition across the three habitat types. To identify specific species driving these differences among habitat types, a similarity percentage analysis (SIMPER) was performed. Both PERMANOVA and SIMPER analyses were conducted using the vegan package [50]. Based on habitat preferences, fish species were classified into three ecological types: (1) stream species, typically characterized by smaller body size and primarily inhabiting streams with moderate flow velocity and clear water conditions; (2) riverine species, predominantly occurring in deeper-water habitats within the main river channel; and (3) generalist species, exhibiting flexible distributions across both tributary and main channel environments. Based on OTU relative abundance data, we examined the distribution patterns of these three ecological fish types across the three distinct habitat categories.
Alpha diversity was calculated based on the relative abundance of species to assess the differences in community diversity within each habitat. The Shannon index and species richness were used as surrogates for the TD of the fish communities. The functional richness (FRic), which reflects the volume of the convex hull formed by the species in the communities, was used to reflect the functional diversity of the fish communities [51]. Phylogenetic diversity is reflected by the sum of the shortest branch lengths of the phylogenetic tree that corresponds to all species in the community [52]. The TD of the fish communities across different habitats was calculated using the Vegan package in R [50]. The mFD package was used to calculate the functional richness, and the picante package was used to evaluate the phylogenetic diversity of the fish communities in the WMR [53,54]. The differences in the diversity indices between different river habitats were determined by one-way analysis of variance (ANOVA) [55]. All differences were considered to be statistically significant at p < 0.05. ANOVA was conducted using the stats package. All analyses were performed using R 4.4.0 [56].
3. Results
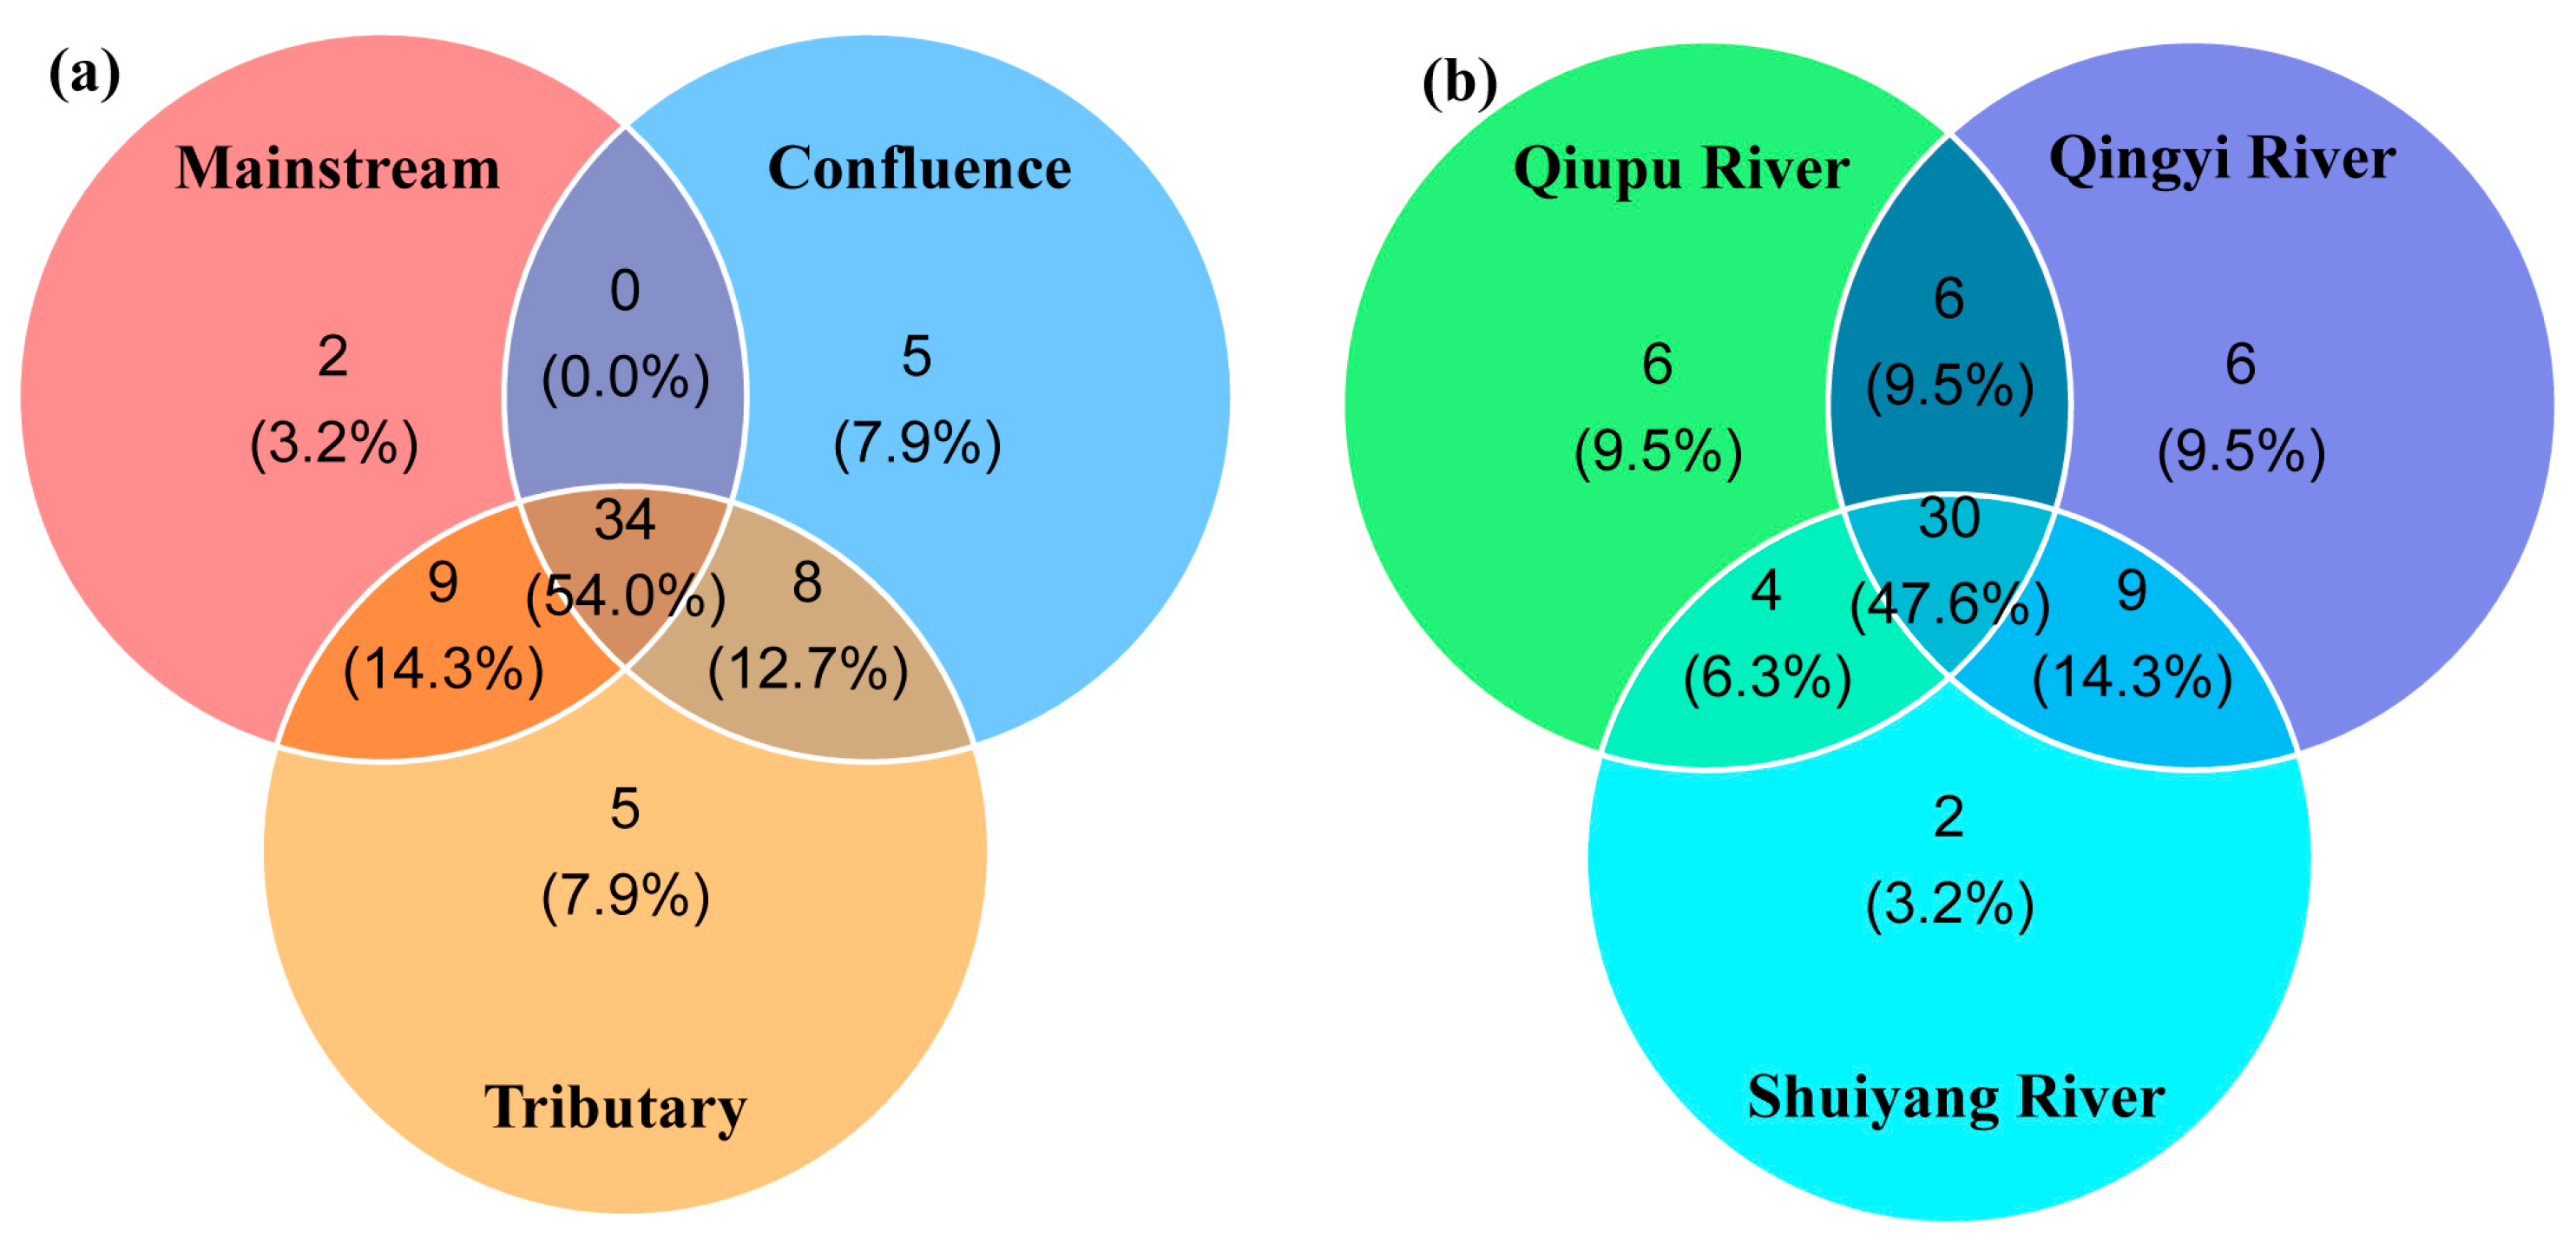
In total, 48 samples were collected during the two seasons. No bands were detected in the negative controls. After the samples were amplified, high-throughput sequencing was performed to generate 26,766,078 raw reads. After quality control and filtering, 9,374,315 reads were retained. During the two seasons, 63 species were identified in the WMR, representing five orders, 15 families, and 47 genera. Specifically, 60 species were observed during the wet season, whereas 51 species were recorded during the dry season. Cypriniformes and Perciformes accounted for 63.36% and 10.62%, respectively. A total of 34 species were shared by all three types of habitats, accounting for 54.0% of the fish species recorded while sampling (Figure 2a). Across the three river basins, a total of 30 fish species were shared, accounting for 47.6% of the total species richness. Qiupu River and Qingyi River each supported six unique species, whereas Shuiyang River harbored two species exclusive to its basin.
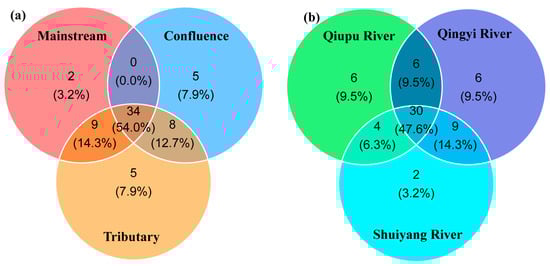
Figure 2.
Number of fish species detected among the three types of habitats (a) and the three river basins (b).
The results of PERMANOVA revealed a statistically significant difference in fish community structures across the three habitat types (p = 0.045). The SIMPER identified Cyprinus carpio, Carassius auratus, Zacco platypus, and Aristichthys nobilis as the primary species contributing to the observed differences in fish community composition, collectively accounting for more than 40% of the variation among habitats (Supplementary Material S1).
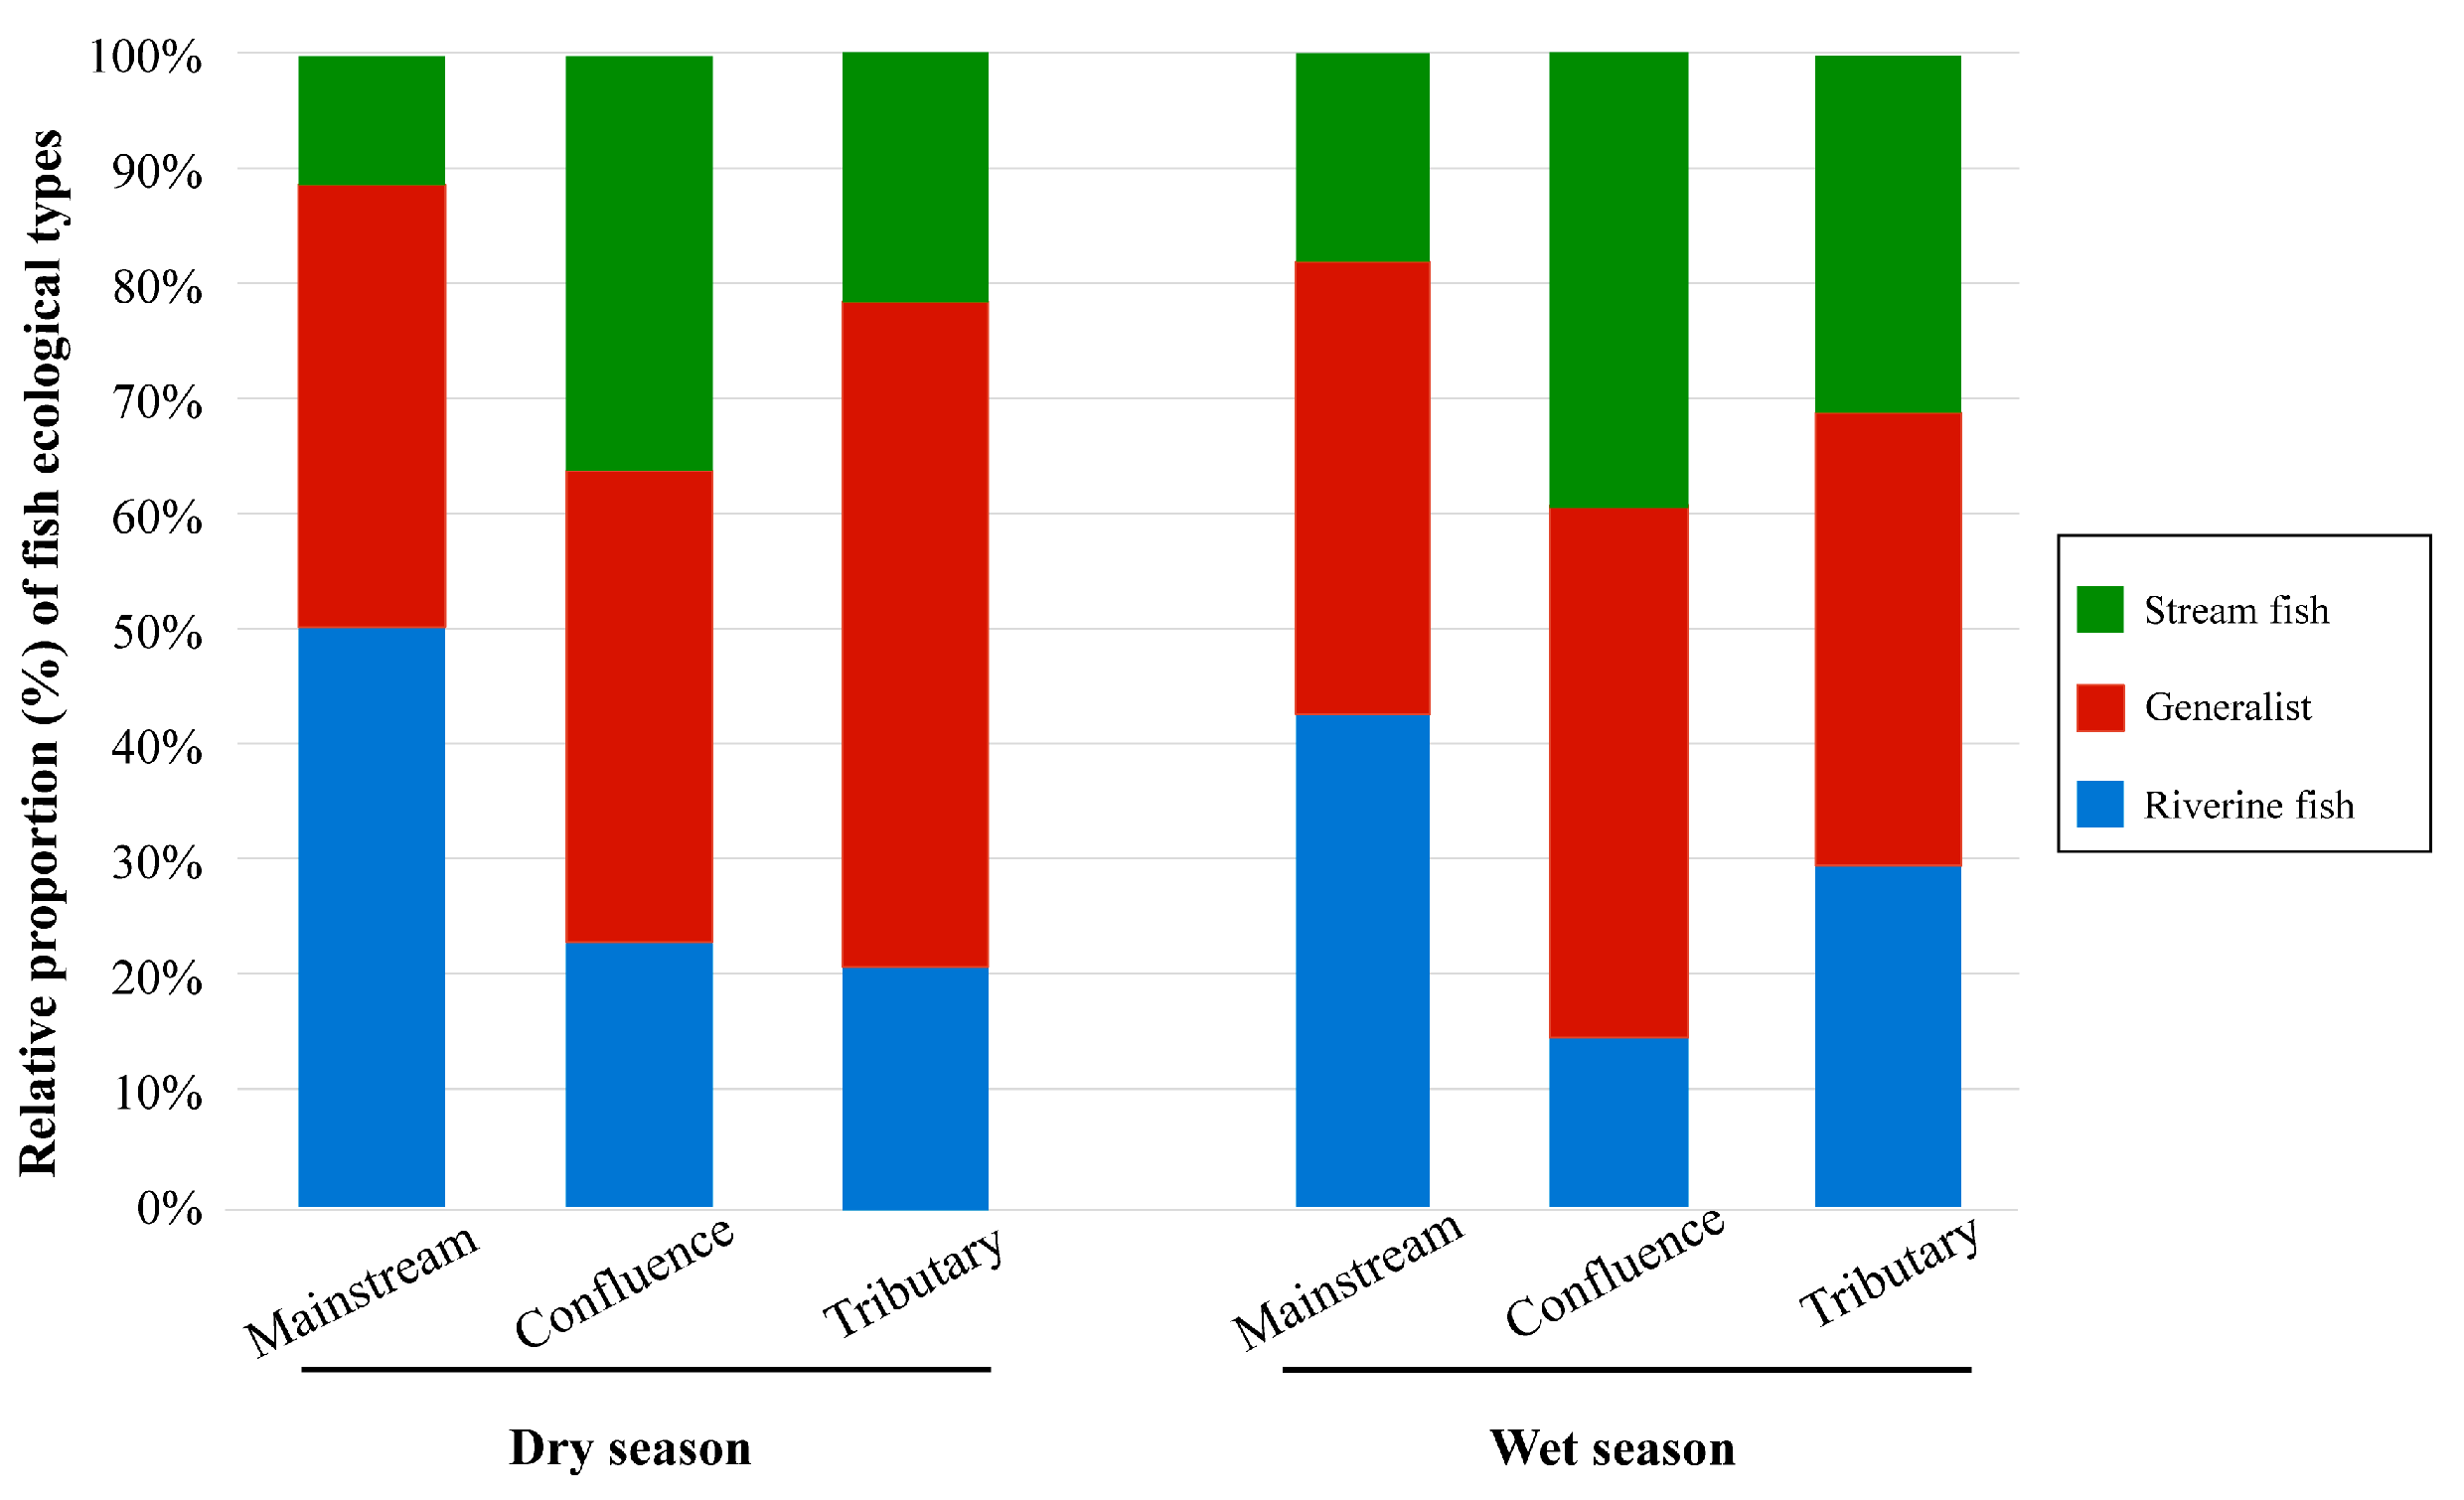
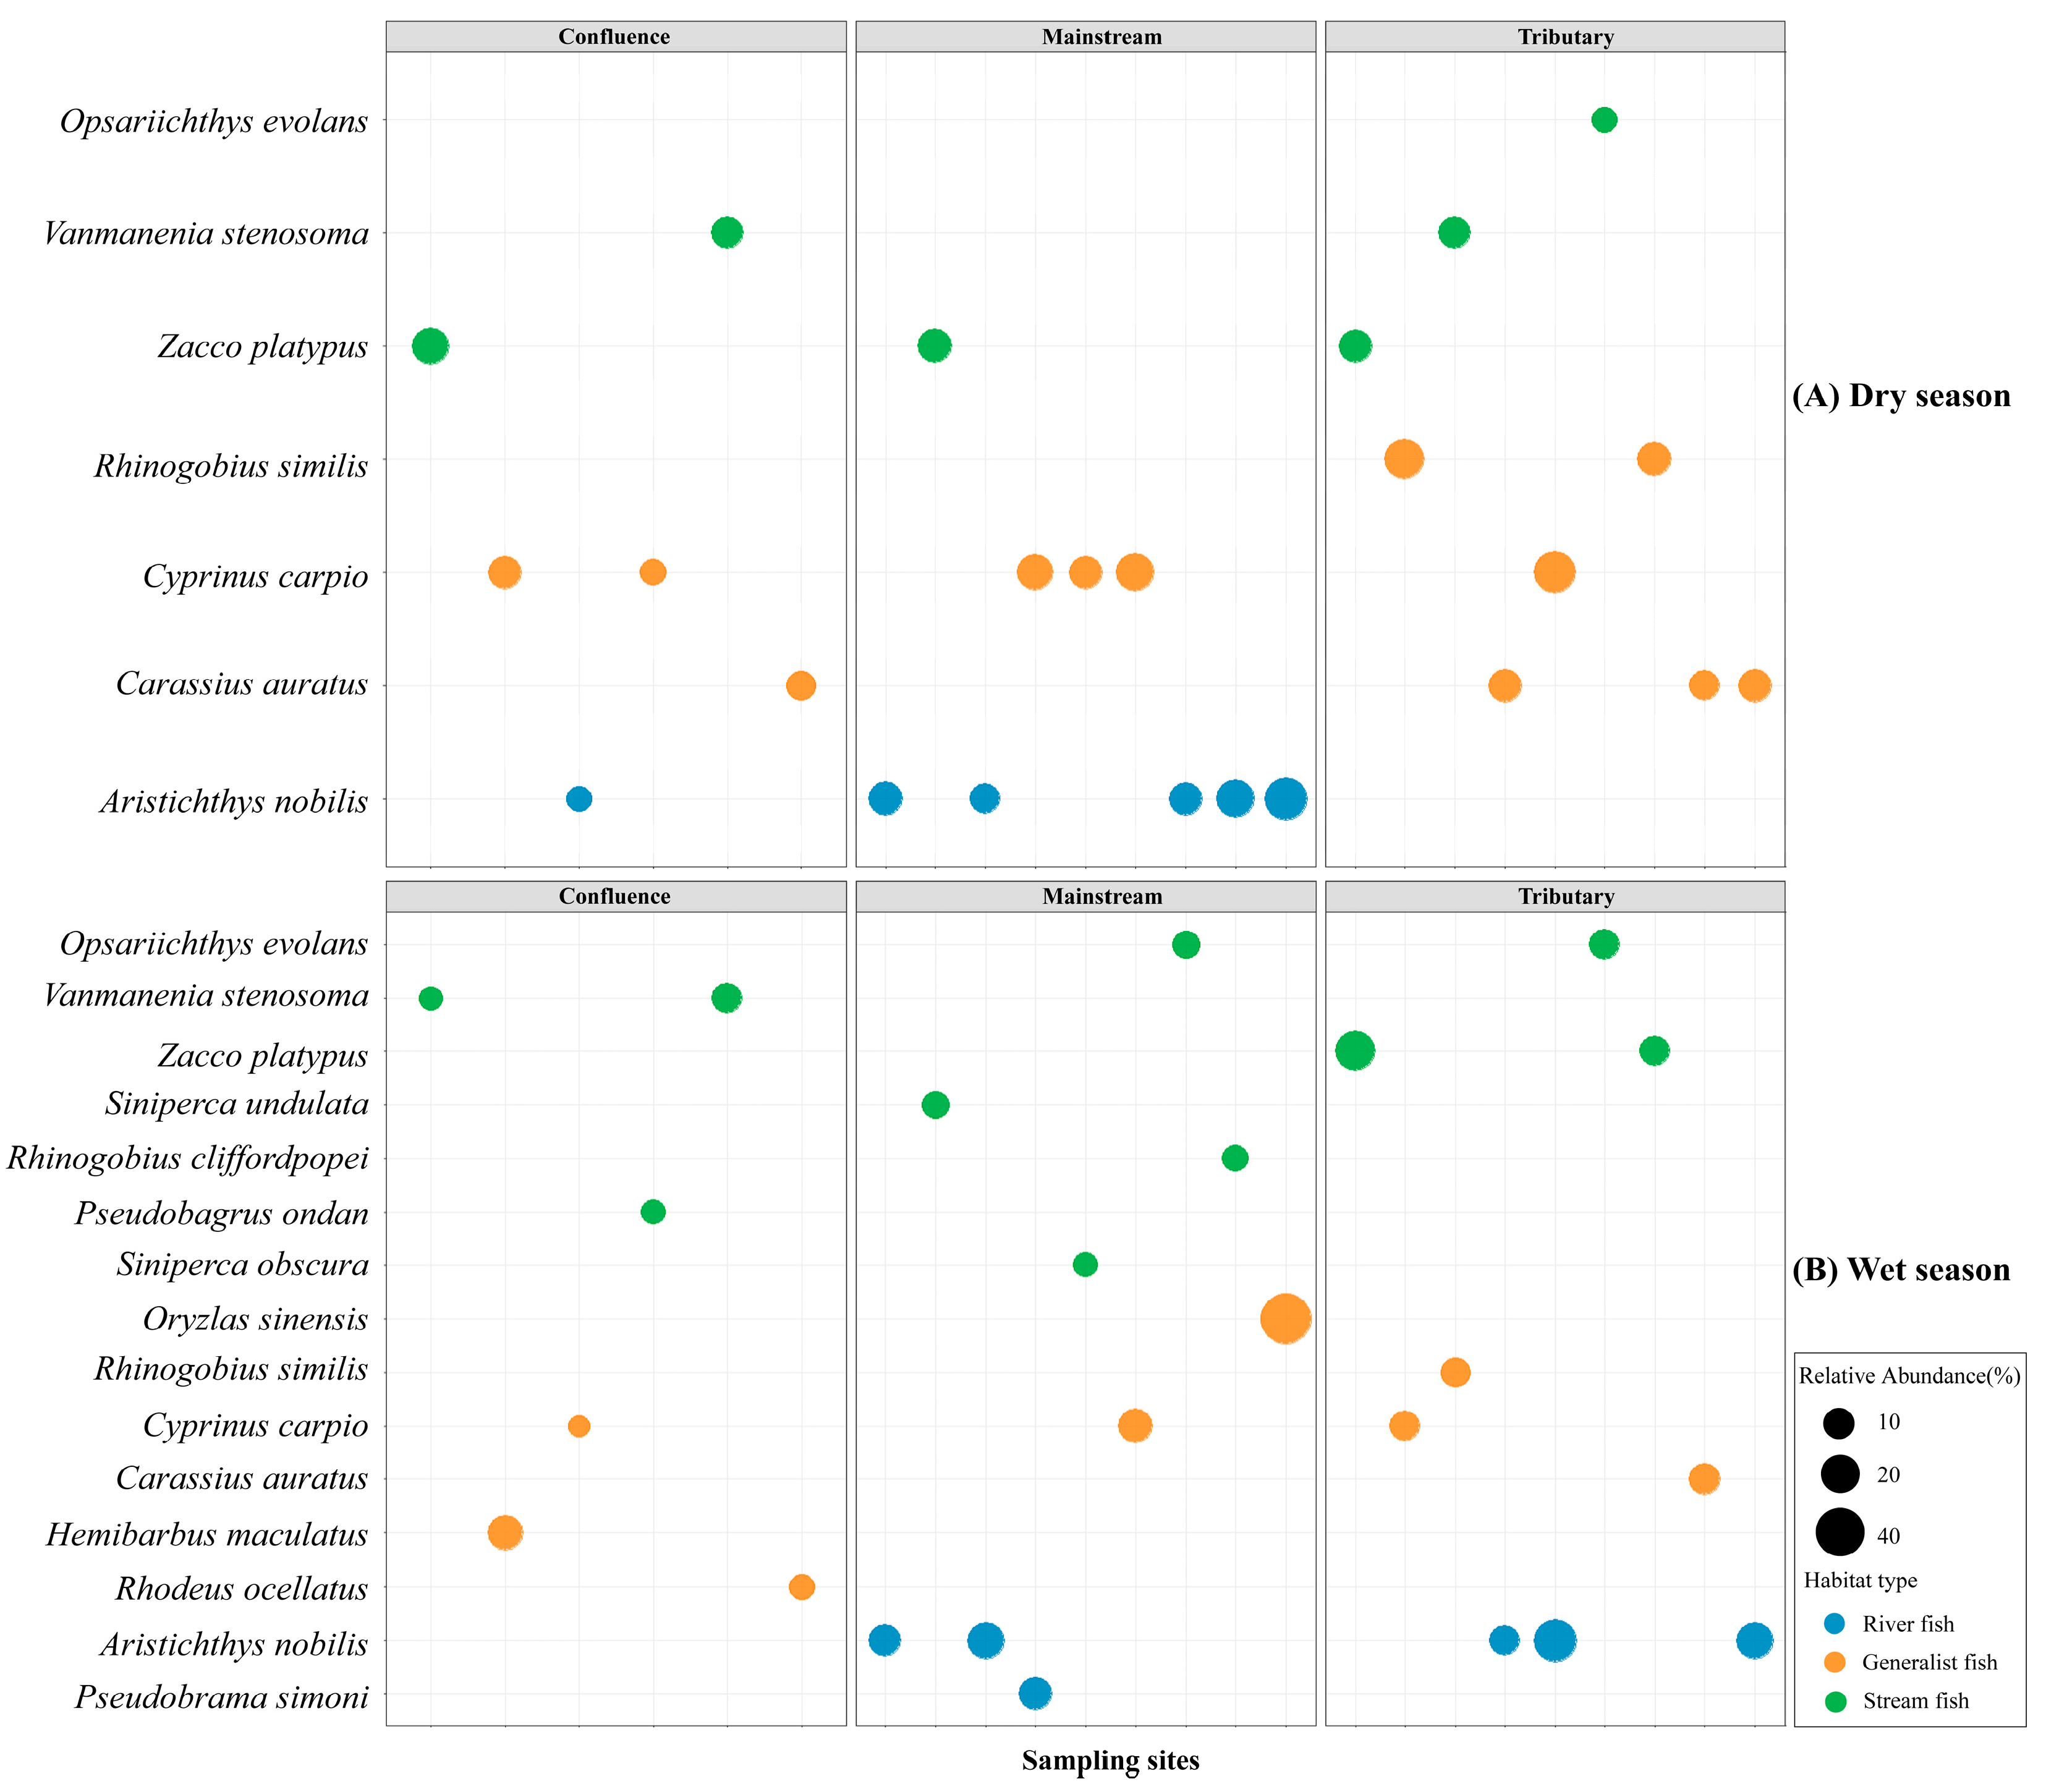
Fish belonging to different ecological groups showed distinct distribution patterns across the three habitat types (Figure 3 and Figure 4). Riverine fish represent the dominant group in the mainstream, comprising 50.4% and 42.5% of the assemblage during the dry and wet seasons, respectively. Generalist species constituted a notable proportion in each habitat, with an average relative abundance of 43.6%. Stream fish represented the smallest proportion among all ecological groups, with a mean relative abundance of 26.1%, and were primarily concentrated at river confluences during both seasons (Figure 3). In different habitats, the dominant species of riverine and generalist fish exhibited relative consistency. For instance, Aristichthys nobilis was the dominant species within riverine fish group, while Cyprinus carpio and Carassius auratus were prevalent in the generalist fish group, all showing high relative abundance across the three habitats (Figure 4, Figures S1 and S2). In the stream fish group, the dominant species vary across habitat types. For example, the Vanmanenia stenosoma was the dominant species in tributaries and confluences but is rarely observed in the mainstream.
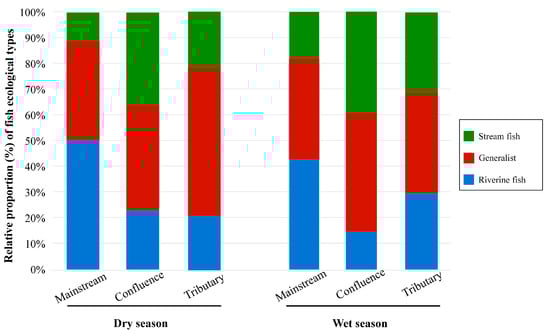
Figure 3.
Relative OUT percentage of each species type in different habitats of rivers.

Figure 4.
Distribution of dominate fish species across three habitat types between dry (A) and wet season (B) based on the relative abundance of OTUs. The complete list of species is provided in Figures S1 and S2 in the Supplementary Materials.
The biodiversity analysis revealed that although confluence sites generally exhibited higher diversity, the magnitude and statistical significance of this pattern varied across rivers (Table S3). In the Qiupu River, both confluence and tributary sites exhibited significantly higher phylogenetic diversity than mainstream sites. In the Qingyi River, phylogenetic diversity was also significantly higher at tributary sites compared to mainstream segments. In contrast, in the Shuiyang River, taxonomic diversity was significantly greater at confluence sites than at mainstream locations.
The Shannon diversity across various river network positions showed consistent patterns in both seasons, with the highest values observed at river confluences, followed by tributary sites, and the lowest values at the mainstream locations (Figure 5). Additionally, during the dry season, a significant difference (p = 0.019) was found in the Shannon index values of the fish communities between the main stream and the confluence. The functional richness of the community in the tributaries was the highest during the wet season, followed by that in the confluence, while that in the mainstream was the lowest (Figure 5). In contrast, during the dry season, the highest functional richness was observed at the confluence, followed by the tributaries, and the mainstream had the lowest functional richness. A significant difference was found between the confluence and mainstream communities (p = 0.027). For phylogenetic diversity, a significant difference was found between the tributaries and the main stream during the wet season (p = 0.039). The phylogenetic diversity of the community was the highest in the tributaries, followed by the confluence, with the lowest diversity in the main stream. In the dry season, the phylogenetic diversity of the confluence community was the highest, followed by that of the tributaries, with the main stream showing the lowest diversity. A significant difference in phylogenetic diversity was observed between the main stream and the confluence (p = 0.033) (Figure 5).
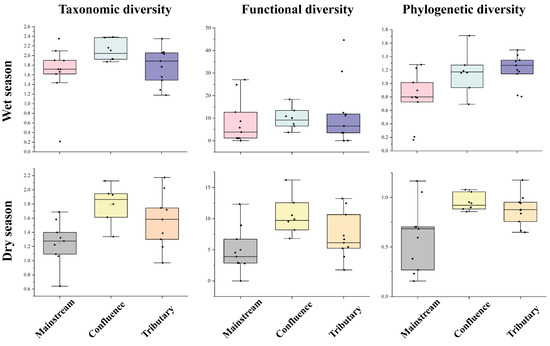
Figure 5.
Taxonomic, functional, and phylogenetic diversity of fish communities at different river network positions across seasons. The Y-axis represents the diversity index value for each habitat type. The black dots represent the diversity values of each fish community.
4. Discussion
The biodiversity pattern of fish communities in river networks is an important research topic in river ecology, but the multidimensional diversity distribution pattern of fish communities in different river network locations is unclear. In this study, using the eDNA metabarcoding method, we analyzed the fish community structure in tributaries, main streams, and confluences of mountain rivers, as well as the taxonomic, functional, and phylogenetic diversity distribution patterns of the fish communities.
4.1. Comparison of eDNA Metabarcoding and Traditional Monitoring in the WMR
In this study, the eDNA metabarcoding results were not entirely consistent with previous findings from traditional survey methods, such as electrofishing and gillnetting [28]. Among the 63 species detected based on eDNA in this study, except for two alien species (Coptodon zillii and Micropterus salmoides), all other species have been recorded in previous fish investigations, which documented 42 species [43,57]. These results underscore the high efficiency of eDNA metabarcoding in fish surveys. However, the discrepancy may also be attributed to the focus of previous traditional surveys on stream headwaters, which likely resulted in the underrepresentation of fish species inhabiting the middle and lower reaches [43].
Compared to the more comprehensive list of fish species in the WMR [58], which recorded a total of 104 species, many fish species were not detected in this study based on eDNA metabarcoding. The eDNA monitoring results suggested that it was less effective in distinguishing some closely related fish species, such as Acheilognathus species. There is a possibility that multiple cryptic species exist within this genus [59]; however, the limited availability of molecular reference data constrained the taxonomic resolution of the eDNA-based approach, preventing accurate species-level discrimination. In addition, detecting small and demersal fish using eDNA extracted from water samples in streams is difficult because their genetic segments may be more concentrated in the bottom sediment [41,60,61]. Some species, such as Odontobutis potamophilus, exhibit specialized spawning behaviors by depositing eggs in crevices between riverbed stones or in burrows within the substrate, which may further limit the release of detectable eDNA into the surrounding water. However, in this study, eight fish species were detected only at the confluence, including some small benthic fish, such as Odontobutis potamophilus and Leptobotia bellacauda. The genetic fragments of these fish from nearby tributaries were likely released into the water environment at confluences due to specific sediment transport processes and hydrological conditions, such as turbulent water flow caused by the separation zone and shear layer [24]. Despite the efficiency of eDNA metabarcoding, methodological limitations remain critical for accurate biodiversity assessments [28]. Our study highlights potential biases against detecting small-bodied, benthic fish species, or closely related fish species. To mitigate these limitations, future efforts should prioritize the enrichment of local genetic reference databases, development of taxon-specific primers, and inclusion of sediment-based eDNA sampling approaches [61,62].
Due to potential false-positive and false-negative errors, the results of eDNA metabarcoding may deviate from the actual scenario [63,64]. For example, eDNA may detect fish species that are not present in the watershed or fail to identify certain fish due to eDNA degradation [65]. Establishing a local database of fish in the study area can enable accurate classification and identification [9,66]. Several studies have reported the composition and distribution of fish in the WMR, and in another study, we obtained sufficient fish samples to construct a local database of fish [43,57,67]. In this study, we detected the endangered fish species Pseudorasbora elongata in the Qiupu River based on the self-built database. This species is characterized by a small wild population and a narrow distribution range [68]. eDNA monitoring offers a novel approach for identifying the distribution range of rare species and implementing targeted conservation strategies for their populations.
4.2. Variations in Fish Community Composition and Biodiversity Across Different Habitats
The compositions of the fish communities in the mainstream and tributaries usually differ greatly because of their distinct habitats [21]. The confluences can serve as an environmental filter and limit the dispersal of fish from tributaries to the mainstream [25]. However, in this study, the fish communities in the mainstream and tributaries shared 25 species, accounting for 78.1% and 69.4% of the total species in the fish communities in the mainstream and tributaries, respectively. The PD of the fish communities in the tributaries was significantly greater than that in the mainstream in the wet season. These results did not support our first hypothesis, and we probably underestimated the dispersal process of fish in the river network [69,70]. We found several typical mainstream species in the fish communities of the tributaries, such as Culter mongolicus, Aristichthys nobilis, and Mylopharyngodon piceus. Owing to the unidirectional mobility of eDNA in rivers, these results indicated that mainstream fish can migrate upstream in tributaries, highlighting the role of tributaries in providing reproduction, foraging, and refuge for fish [70,71].
Mainstreams and tributaries provide diverse habitats to fish throughout different stages of their lives. For example, the greater water depths of the mainstream provide overwintering habitats for fish, whereas tributaries provide habitats for fish to forage and reproduce [72,73]. The confluence is the transition zone between the main stream and tributaries, in which the hydrological regime and material transport are regulated by the tributaries and the main stream, resulting in a complex and seasonal habitat [24,74]. In this study, the TD of the fish community in the confluence area was significantly greater than that in the mainstream area during the dry season, which was consistent with our second hypothesis. This may be related to the life history of the fish in the river network. Yuan et al. 2023 reported that the TD of fish communities at the confluence of the Yangtze River and Poyang Lake was greater in spring than in autumn because greater connectivity allowed fish from the lakes to enter the confluence [24]. We hypothesized that in the rivers of the WMR, fish from tributaries disperse to the confluence during the dry season to overwinter, thus increasing the TD of the fish communities at confluences. The changes in FD and PD during the dry season also showed similar patterns, which also supported our hypothesis to some extent that fish from tributaries increased the biodiversity of the fish communities at the confluence.
Our results underscore the importance of tributaries and confluences as critical biodiversity nodes within river networks, a finding consistent with habitat heterogeneity theory and metacommunity dynamics [23,74]. The elevated multidimensional biodiversity observed at confluences during the dry season suggests these areas function as ecological sinks by integrating species pools from adjacent habitats through seasonal dispersal, an observation aligning well with the “confluence effect” described in dendritic riverine systems [22]. Such confluence zones play pivotal roles as connectivity corridors, facilitating critical seasonal fish migrations between tributary spawning sites and mainstream overwintering habitats [69]. These findings advocate strongly for prioritizing the conservation of confluence areas, particularly through measures aimed at maintaining hydrological connectivity and mitigating habitat fragmentation, such as dam construction and removal strategies. Tributaries, characterized by elevated biodiversity during wet seasons, serve as refugia for specialized species (e.g., Vanmanenia stenosoma), further emphasizing the need for targeted sediment management and microhabitat preservation. Consequently, river management strategies should explicitly include protection and restoration of these habitats, recognizing their disproportionate contribution to regional biodiversity. Integrating eDNA-based biodiversity assessments into adaptive river management frameworks could operationalize these insights, enabling dynamic and responsive habitat protection strategies tailored to seasonal variability.
5. Conclusions
There are seasonal differences in the diversity distribution patterns of fish communities at different river network locations, which may be related to the hydrological regime of the river and the life history of fish. This study highlighted the importance of confluences and tributaries in river networks, which should be prioritized in the monitoring, conservation, and management of river fish.
Supplementary Materials
The following supporting information can be downloaded at: https://www.mdpi.com/article/10.3390/fishes10040175/s1, Figure S1: Distribution of different fish species across three habitat types in the dry season based on the relative abundance of OTUs; Figure S2: Distribution of different fish species across three habitat types in the dry season based on the relative abundance of OTUs; Table S1: Climatic and geomorphological features of the three river basins; Table S2: Fish morphological features and functional traits; Table S3: Tukey HSD Test results for pairwise comparisons of taxonomic (TD), functional (FD), and phylogenetic diversity (PD) among site types across river basins.
Author Contributions
Conceptualization, C.Z.; Data curation, Y.W., W.Y. and S.L.; Formal analysis, Z.L.; Funding acquisition, C.Z.; Investigation, Z.L., Y.W., W.Y., S.L. and G.S.; Methodology, Z.L., W.Y. and C.Z.; Software, Y.W.; Supervision, C.Z.; Writing—original draft, Z.L. and C.Z.; Writing—review and editing, Z.L. and C.Z. All authors have read and agreed to the published version of the manuscript.
Funding
This work was supported by the National Natural Science Foundation of China [grant number 32201310]; the Natural Science Foundation of Universities of Anhui Province [grant number KJ2021A0117]; the Monitoring of Aquatic Living Resources in Key Waters of Anhui Province [grant number 2023AHNYNC016XQ]; and the Fund of Province Key Laboratory of Aquaculture & Stock Enhancement [grant number AHSC202301].
Institutional Review Board Statement
This study is approved by the Academic Ethics Committee of Anhui Normal University (Approval Code: AHNU-ET2022023; Approval Date: 9 March 2022).
Informed Consent Statement
Not applicable.
Data Availability Statement
The data can be obtained from the authors upon reasonable request.
Acknowledgments
We thank Xiao Chen for his help in the construction of the eDNA database.
Conflicts of Interest
The authors declare that they have no conflicts of interest.
References
- Hiddink, J.G.; MacKenzie, B.R.; Rijnsdorp, A.; Dulvy, N.K.; Nielsen, E.E.; Bekkevold, D.; Heino, M.; Lorance, P.; Ojaveer, H. Importance of fish biodiversity for the management of fisheries and ecosystems. Fish. Res. 2008, 90, 6–8. [Google Scholar] [CrossRef]
- McIntyre, P.B.; Reidy Liermann, C.A.; Revenga, C. Linking freshwater fishery management to global food security and biodiversity conservation. Proc. Natl. Acad. Sci. USA 2016, 113, 12880–12885. [Google Scholar] [CrossRef] [PubMed]
- Dudgeon, D.; Arthington, A.H.; Gessner, M.O.; Kawabata, Z.I.; Knowler, D.J.; Lévêque, C.; Sullivan, C.A. Freshwater biodiversity: Importance, threats, status and conservation challenges. Biol. Rev. 2006, 81, 163–182. [Google Scholar] [CrossRef] [PubMed]
- Reid, A.J.; Carlson, A.K.; Creed, I.F.; Eliason, E.J.; Gell, P.A.; Johnson, P.T.; Cooke, S.J. Emerging threats and persistent conservation challenges for freshwater biodiversity. Biol. Rev. 2019, 94, 849–873. [Google Scholar] [CrossRef] [PubMed]
- Su, G.; Logez, M.; Xu, J.; Tao, S.; Villéger, S.; Brosse, S. Human impacts on global freshwater fish biodiversity. Science 2021, 371, 835–838. [Google Scholar] [CrossRef]
- Altermatt, F. Diversity in riverine metacommunities: A network perspective. Aquat. Ecol. 2013, 47, 365–377. [Google Scholar] [CrossRef]
- McGill, B.J.; Dornelas, M.; Gotelli, N.J.; Magurran, A.E. Fifteen forms of biodiversity trend in the Anthropocene. Trends Ecol. Evol. 2015, 30, 104–113. [Google Scholar] [CrossRef]
- Brumm, K.J.; Hanks, R.D.; Baldwin, R.F.; Peoples, B.K. Accounting for multiple dimensions of biodiversity to assess surrogate performance in a freshwater conservation prioritization. Ecol. Indic. 2021, 122, 107320. [Google Scholar] [CrossRef]
- Wang, J.; Chen, L.; Tang, W.; Heino, J.; Jiang, X. Effects of dam construction and fish invasion on the species, functional and phylogenetic diversity of fish assemblages in the Yellow River Basin. J. Environ. Manag. 2021, 293, 112863. [Google Scholar] [CrossRef]
- Pollock, L.J.; Thuiller, W.; Jetz, W. Large conservation gains possible for global biodiversity facets. Nature 2017, 546, 141–144. [Google Scholar] [CrossRef]
- Zhang, C.; Zhu, R.; Sui, X.; Li, X.; Chen, Y. Understanding patterns of taxonomic diversity, functional diversity, and ecological drivers of fish fauna in the Mekong River. Glob. Ecol. Conserv. 2021, 28, e01711. [Google Scholar] [CrossRef]
- Strecker, A.L.; Olden, J.D.; Whittier, J.B.; Paukert, C.P. Defining conservation priorities for freshwater fishes according to taxonomic, functional, and phylogenetic diversity. Ecol. Appl. 2011, 21, 3002–3013. [Google Scholar] [CrossRef]
- Lin, L.; Deng, W.; Huang, X.; Kang, B. Fish taxonomic, functional, and phylogenetic diversity and their vulnerabilities in the largest river in southeastern China. Ecol. Evol. 2021, 11, 11533–11548. [Google Scholar] [CrossRef] [PubMed]
- Villéger, S.; Brosse, S.; Mouchet, M.; Mouillot, D.; Vanni, M.J. Functional ecology of fish: Current approaches and future challenges. Aquat. Sci. 2017, 79, 783–801. [Google Scholar] [CrossRef]
- Winter, M.; Devictor, V.; Schweiger, O. Phylogenetic diversity and nature conservation: Where are we? Trends Ecol. Evol. 2013, 28, 199–204. [Google Scholar] [CrossRef] [PubMed]
- Blanchet, S.; Helmus, M.R.; Brosse, S.; Grenouillet, G. Regional vs. local drivers of phylogenetic and species diversity in stream fish communities. Freshw. Biol. 2014, 59, 450–462. [Google Scholar] [CrossRef]
- Wang, S.; Yan, Z.; Hänfling, B.; Zheng, X.; Wang, P.; Fan, J.; Li, J. Methodology of fish eDNA and its applications in ecology and environment. Sci. Total Environ. 2021, 755, 142622. [Google Scholar] [CrossRef]
- Lin, L.; Liu, Y.; Lin, H.; Kang, B. Considering species functional and phylogenetic rarity in the conservation of fish biodiversity. Divers. Distrib. 2024, 30, e13804. [Google Scholar] [CrossRef]
- Fernandes, C.C.; Podos, J.; Lundberg, J.G. Amazonian ecology: Tributaries enhance the diversity of electric fishes. Science 2004, 305, 1960–1962. [Google Scholar] [CrossRef]
- Doretto, A.; Piano, E.; Larson, C.E. The River Continuum Concept: Lessons from the past and perspectives for the future. Can. J. Fish. Aquat. Sci. 2020, 77, 1853–1864. [Google Scholar] [CrossRef]
- Rice, S.P.; Kiffney, P.; Greene, C.; Pess, G.R. The ecological importance of tributaries and confluences. In River Confluences, Tributaries and the Fluvial Network; John Wiley & Sons: Chichester, UK, 2008; pp. 209–226. [Google Scholar]
- Boddy, N.C.; Booker, D.J.; McIntosh, A.R. Confluence configuration of river networks controls spatial patterns in fish communities. Landsc. Ecol. 2019, 34, 187–201. [Google Scholar] [CrossRef]
- Grant, E.H.C.; Lowe, W.H.; Fagan, W.F. Living in the branches: Population dynamics and ecological processes in dendritic networks. Ecol. Lett. 2007, 10, 165–175. [Google Scholar] [CrossRef]
- Yuan, S.; Qiu, J.; Tang, H.; Xu, L.; Xiao, Y.; Liu, M.; Gualtieri, C. Fish community traits near a large confluence: Implications for its nodal effects in the river ecosystem. J. Hydrol. 2023, 626, 130335. [Google Scholar] [CrossRef]
- Czeglédi, I.; Sály, P.; Takács, P.; Dolezsai, A.; Nagy, S.A.; Erős, T. The scales of variability of stream fish assemblages at tributary confluences. Aquat. Sci. 2016, 78, 641–654. [Google Scholar] [CrossRef]
- Duarte, C.; Antão, L.H.; Magurran, A.E.; de Deus, C.P. Shifts in fish community composition and structure linked to seasonality in a tropical river. Freshw. Biol. 2022, 67, 1789–1800. [Google Scholar] [CrossRef]
- Shen, Y.; Zhou, X.; Zhang, Y.; Zhang, J.; Li, Q.; Chen, Q.; Luo, Y. Important fish diversity maintenance status of the tributaries in a hotspot fish conservation area in the upper Yangtze River revealed by eDNA metabarcoding. Sci. Rep. 2024, 14, 24128. [Google Scholar] [CrossRef] [PubMed]
- Yao, M.; Zhang, S.; Lu, Q.; Chen, X.; Zhang, S.Y.; Kong, Y.; Zhao, J. Fishing for fish environmental DNA: Ecological applications, methodological considerations, surveying designs, and ways forward. Mol. Ecol. 2022, 31, 5132–5164. [Google Scholar] [CrossRef]
- Marques, V.; Castagné, P.; Polanco, A.; Borrero-Pérez, G.H.; Hocdé, R.; Guérin, P.É.; Villéger, S. Use of environmental DNA in assessment of fish functional and phylogenetic diversity. Conserv. Biol. 2021, 35, 1944–1956. [Google Scholar] [CrossRef]
- Condachou, C.; Milhau, T.; Murienne, J.; Brosse, S.; Villéger, S.; Valentini, A.; Mouillot, D. Inferring functional diversity from environmental DNA metabarcoding. Environ. DNA 2023, 5, 934–944. [Google Scholar] [CrossRef]
- Gu, S.; Deng, Y.; Wang, P.; Li, C.; Shi, D.; Wang, S. Assessing riverine fish community diversity and stability by eDNA metabarcoding. Ecol. Indic. 2023, 157, 111222. [Google Scholar] [CrossRef]
- Strahler, A.N. Quantitative analysis of watershed geomorphology. Eos Trans. AGU 1957, 38, 913–920. [Google Scholar]
- Balasingham, K.D.; Walter, R.P.; Mandrak, N.E.; Heath, D.D. Environmental DNA detection of rare and invasive fish species in two Great Lakes tributaries. Mol. Ecol. 2018, 27, 112–127. [Google Scholar] [CrossRef]
- Zhang, S.; Zhao, J.; Yao, M. A comprehensive and comparative evaluation of primers for metabarcoding eDNA from fish. Methods Ecol. Evol. 2020, 11, 1609–1625. [Google Scholar] [CrossRef]
- Taberlet, P.; Coissac, E.; Pompanon, F.; Brochmann, C.; Willerslev, E. Towards next-generation biodiversity assessment using DNA metabarcoding. Mol. Ecol. 2012, 21, 2045–2050. [Google Scholar] [CrossRef] [PubMed]
- Bolger, A.M.; Lohse, M.; Usadel, B. Trimmomatic: A flexible trimmer for Illumina sequence data. Bioinformatics 2014, 30, 2114–2120. [Google Scholar] [CrossRef] [PubMed]
- Magoč, T.; Salzberg, S.L. FLASH: Fast length adjustment of short reads to improve genome assemblies. Bioinformatics 2011, 27, 2957–2963. [Google Scholar] [CrossRef]
- Edgar, R.C. Search and clustering orders of magnitude faster than BLAST. Bioinformatics 2010, 26, 2460–2461. [Google Scholar] [CrossRef]
- Zhang, S.; Zheng, Y.; Zhan, A.; Dong, C.; Zhao, J.; Yao, M. Environmental DNA captures native and non-native fish community variations across the lentic and lotic systems of a megacity. Sci. Adv. 2022, 8, eabk0097. [Google Scholar] [CrossRef]
- Zou, K.; Chen, J.; Ruan, H.; Li, Z.; Guo, W.; Li, M.; Liu, L. eDNA metabarcoding as a promising conservation tool for monitoring fish diversity in a coastal wetland of the Pearl River Estuary compared to bottom trawling. Sci. Total Environ. 2020, 702, 134704. [Google Scholar] [CrossRef]
- Liu, Z.; Hu, C.; You, W.; Li, S.; Wu, Y.; Liang, Y.; Chu, L.; Yan, Y.; Zhang, C. Comparison between environmental DNA metabarcoding and traditional survey method to identify community composition and assembly of stream fish. Ecol. Evol. 2024, 14, e70627. [Google Scholar] [CrossRef]
- Li, F.; Zhang, Y.; Altermatt, F.; Yang, J.; Zhang, X. The effects of environmental factors on species interactions in urban ecosystems. Environ. Sci. Technol. 2023, 57, 7828–7839. [Google Scholar] [CrossRef]
- Yan, Y.; Wang, H.; Zhu, R.; Chu, L.; Chen, Y. Influences of low-head dams on the fish assemblages in the headwater streams of the Qingyi watershed, China. Environ. Biol. Fish. 2013, 96, 495–506. [Google Scholar] [CrossRef]
- Li, Q.; Li, Y.; Jiang, M.; Wang, Y.; Xu, D.; Chu, L.; Yan, Y. Effects of low-head dams on fish assemblages in subtropical streams: Context dependence on local habitat and landscape conditions. Ecol. Indic. 2021, 121, 107190. [Google Scholar] [CrossRef]
- Stamatakis, A. RAxML-VI-HPC: Maximum likelihood-based phylogenetic analyses with thousands of taxa and mixed models. Bioinformatics 2006, 22, 2688–2690. [Google Scholar] [CrossRef]
- Robinson, D.F.; Foulds, L.R. Comparison of phylogenetic trees. Math. Biosci. 1981, 53, 131–147. [Google Scholar] [CrossRef]
- Hillis, D.M.; Bull, J.J. An empirical test of bootstrapping as a method for assessing confidence in phylogenetic analysis. Syst. Biol. 1993, 42, 182–192. [Google Scholar] [CrossRef]
- Kumar, S.; Stecher, G.; Li, M.; Knyaz, C.; Tamura, K. MEGA7: Molecular Evolutionary Genetics Analysis Version 7.0 for bigger datasets. Mol. Biol. Evol. 2016, 33, 1870–1874. [Google Scholar] [CrossRef]
- Chen, H.; Boutros, P.C. VennDiagram: A package for the generation of highly-customizable Venn and Euler diagrams in R. BMC Bioinform. 2011, 12, 35. [Google Scholar] [CrossRef]
- Oksanen, J.; Blanchet, F.G.; Kindt, R.; Legendre, P.; Minchin, P.R.; O’Hara, B.; Simpson, G.L.; Solymos, P.; Stevens, M.H.H.; Wagner, H. Vegan: Community Ecology Package. R Package Version 2015, 2, 321–326. [Google Scholar]
- Cornwell, W.K.; Schwilk, D.W.; Ackerly, D.D. A trait-based test for habitat filtering: Convex hull volume. Ecology 2006, 87, 1465–1471. [Google Scholar] [CrossRef]
- Faith, D.P. Conservation evaluation and phylogenetic diversity. Biol. Conserv. 1992, 61, 1–10. [Google Scholar] [CrossRef]
- Magneville, C.; Loiseau, N.; Albouy, C.; Casajus, N.; Claverie, T.; Escalas, A.; Leprieur, F.; Maire, E.; Mouillot, D.; Villéger, S. mFD: An R package to compute and illustrate the multiple facets of functional diversity. Ecography 2022, 2022, e05904. [Google Scholar] [CrossRef]
- Kembel, S.W.; Cowan, P.D.; Helmus, M.R.; Cornwell, W.K.; Morlon, H.; Ackerly, D.D. Picante: R tools for integrating phylogenies and ecology. Bioinformatics 2010, 26, 1463–1464. [Google Scholar] [CrossRef] [PubMed]
- Zimmerman, D.W.; Zumbo, B.D. The effect of violating the homogeneity of variance assumption in analysis of variance. J. Exp. Educ. 1993, 61, 55–67. [Google Scholar]
- R Core Team. R: A Language and Environment for Statistical Computing; R Foundation for Statistical Computing: Vienna, Austria, 2023. [Google Scholar]
- Zhang, D.; Qiao, J.; He, J.; Chu, L.; Yan, Y. A longitudinal gradient in the taxonomic, functional, and phylogenetic diversity of freshwater fish in a subtropical river system. Hydrobiologia 2023, 850, 1175–1187. [Google Scholar] [CrossRef]
- Diao, Z.; Shen, J. Fishes and their geographical distribution in the mountainous areas of southern Anhui. Anhui Agric. Sci. 1981, 1, 82–88. [Google Scholar]
- Chang, C.H.; Li, F.; Shao, K.T.; Lin, Y.S.; Morosawa, T.; Kim, S.; Koo, H.; Kim, W.; Lee, J.-S.; Mayden, R.L.; et al. Phylogenetic relationships of Acheilognathidae (Cypriniformes: Cyprinoidea) as revealed from evidence of both nuclear and mitochondrial gene sequence variation: Evidence for necessary taxonomic revision in the family and the identification of cryptic species. Mol. Phylogenet. Evol. 2014, 81, 182–194. [Google Scholar]
- Duarte, S.; Simões, L.; Costa, F.O. Current status and topical issues on the use of eDNA-based targeted detection of rare animal species. Sci. Total Environ. 2023, 872, 166675. [Google Scholar] [CrossRef]
- Turner, C.R.; Uy, K.L.; Everhart, R.C. Fish environmental DNA is more concentrated in aquatic sediments than surface water. Biol. Conserv. 2015, 183, 93–102. [Google Scholar] [CrossRef]
- Sakata, M.K.; Watanabe, T.; Maki, N.; Ikeda, K.; Kosuge, T.; Okada, H.; Minamoto, T. Determining an effective sampling method for eDNA metabarcoding: A case study for fish biodiversity monitoring in a small, natural river. Limnology 2021, 22, 221–235. [Google Scholar] [CrossRef]
- Guillera-Arroita, G.; Lahoz-Monfort, J.J.; van Rooyen, A.R.; Weeks, A.R.; Tingley, R. Dealing with false-positive and false-negative errors about species occurrence at multiple levels. Methods Ecol. Evol. 2017, 8, 1081–1091. [Google Scholar] [CrossRef]
- Furlan, E.M.; Gleeson, D.; Hardy, C.M.; Duncan, R.P. A framework for estimating the sensitivity of eDNA surveys. Mol. Ecol. Resour. 2016, 16, 641–654. [Google Scholar] [CrossRef] [PubMed]
- Jerde, C.L. Can we manage fisheries with the inherent uncertainty from eDNA? J. Fish Biol. 2021, 98, 341–353. [Google Scholar] [CrossRef]
- Burian, A.; Mauvisseau, Q.; Bulling, M.; Domisch, S.; Qian, S.; Sweet, M. Improving the reliability of eDNA data interpretation. Mol. Ecol. Resour. 2021, 21, 1422–1433. [Google Scholar] [CrossRef] [PubMed]
- Li, Q.; Zhang, Y.; Wang, R.; Chu, L.; Li, Y.; Yan, Y. Low-head dams induce biotic homogenization/differentiation of fish assemblages in subtropical streams. Ecol. Evol. 2022, 12, e9156. [Google Scholar] [CrossRef]
- Kong, D.; Cui, G.; Yang, J. Threatened fishes of the world: Pseudorasbora elongata Wu, 1939 (Cyprinidae). Environ. Biol. Fish. 2006, 76, 107–108. [Google Scholar]
- Radinger, J.; Wolter, C. Patterns and predictors of fish dispersal in rivers. Fish Fish. 2014, 15, 456–473. [Google Scholar] [CrossRef]
- Cathcart, C.N.; Gido, K.B.; McKinstry, M.C.; MacKinnon, P.D. Patterns of fish movement at a desert river confluence. Ecol. Freshw. Fish 2018, 27, 492–505. [Google Scholar] [CrossRef]
- Penaluna, B.E.; Allen, J.M.; Arismendi, I.; Levi, T.; Garcia, T.S.; Walter, J.K. Better boundaries: Identifying the upper extent of fish distributions in forested streams using eDNA and electrofishing. Ecosphere 2021, 12, e03332. [Google Scholar] [CrossRef]
- Starcevich, S.J.; Howell, P.J.; Jacobs, S.E.; Sankovich, P.M. Seasonal movement and distribution of fluvial adult bull trout in selected watersheds in the mid-Columbia River and Snake River basins. PLoS ONE 2012, 7, e37257. [Google Scholar] [CrossRef]
- He, T.; Li, X.; Zheng, Y.; Liu, J. Comparative analysis of fish distribution between main stream and tributaries in Chongqing district of the Yangtze River. Freshw. Fish. 2016, 46, 47–51. [Google Scholar]
- Rice, S.P. Tributary connectivity, confluence aggradation and network biodiversity. Geomorphology 2017, 277, 6–16. [Google Scholar] [CrossRef]


Disclaimer/Publisher’s Note: The statements, opinions and data contained in all publications are solely those of the individual author(s) and contributor(s) and not of MDPI and/or the editor(s). MDPI and/or the editor(s) disclaim responsibility for any injury to people or property resulting from any ideas, methods, instructions or products referred to in the content. |
© 2025 by the authors. Licensee MDPI, Basel, Switzerland. This article is an open access article distributed under the terms and conditions of the Creative Commons Attribution (CC BY) license (https://creativecommons.org/licenses/by/4.0/).