Article

YOLOv8-BaitScan: A Lightweight and Robust Framework for Accurate Bait Detection and Counting in Aquaculture

1
Anhui Provincial Key Laboratory of Embryo Development and Reproductive Regulation, Fuyang 236037, China
2
School of Biology and Food Engineering, Fuyang Normal University, Fuyang 236037, China
3
School of Information and Artificial Intelligence, Anhui Agricultural University, Hefei 230036, China
4
Key Laboratory of Agricultural Sensors, Ministry of Agriculture and Rural Affairs, Hefei 230036, China
*
Author to whom correspondence should be addressed.
Fishes 2025, 10(6), 294; https://doi.org/10.3390/fishes10060294
Submission received: 7 May 2025 / Revised: 6 June 2025 / Accepted: 16 June 2025 / Published: 17 June 2025

Abstract

Excessive bait wastage is a major issue in aquaculture, leading to higher farming costs, economic losses, and water pollution caused by bacterial growth from unremoved residual bait. To address this problem, we propose a bait residue detection and counting model named YOLOv8-BaitScan, based on an improved YOLO architecture. The key innovations are as follows: (1) By incorporating the channel prior convolutional attention (CPCA) into the final layer of the backbone, the model efficiently extracts spatial relationships and dynamically allocates weights across the channel and spatial dimensions. (2) The minimum points distance intersection over union (MPDIoU) loss function improves the model’s localization accuracy for bait bounding boxes. (3) The structure of the Neck network is optimized by adding a tiny-target detection layer, which improves the recall rate for small, distant bait targets and significantly reduces the miss rate. (4) We design the lightweight detection head named Detect-Efficient, incorporating the GhostConv and C2f-GDC module into the network to effectively reduce the overall number of parameters and computational cost of the model. The experimental results show that YOLOv8-BaitScan achieves strong performance across key metrics: The recall rate increased from 60.8% to 94.4%, mAP@50 rose from 80.1% to 97.1%, and the model’s number of parameters and computational load were reduced by 55.7% and 54.3%, respectively. The model significantly improves the accuracy and real-time detection capabilities for underwater bait and is more suitable for real-world aquaculture applications, providing technical support to achieve both economic and ecological benefits.
Key Contribution: We propose a bait detection algorithm based on improved YOLOv8n, which achieves high detection accuracy while maintaining being lightweight and provides technical support for intelligent feeding.

1. Introduction

In aquaculture, low bait utilization has led to rising farming costs and water pollution, posing serious challenges for the industry [1]. Statistics show that bait costs account for 40–60% of the total aquaculture expenses [2]. Therefore, improving bait utilization efficiency has become a pressing issue. In practice, dynamically adjusting feeding strategies based on the amount of residual bait is key to improving bait utilization and reducing water pollution risks [3]. However, there are still many challenges in accurately identifying and counting bait residues in aquaculture ponds. In complex underwater environments, bait detection is hindered by challenges such as bait aggregation, overlapping targets, missed detections of small or distant objects, and background noise caused by fish movement. These factors significantly affect detection accuracy and pose major obstacles to reliable bait residue recognition. In previous research work, many scholars have attempted to use acoustic methods to detect residual bait underwater. Llorens et al. utilized ultrasonic echo methods to enable the quantification of residual bait [4]. However, these acoustic systems rely on particle-specific acoustic signatures [5], and sonar-based methods often produce monochromatic, low-resolution images that limit detection performance [6]. In addition, acoustic equipment is usually expensive, which further limits its widespread use in practical production.
With the rapid advancement of machine vision, many researchers have applied it to bait detection. Foster et al. [7] proposed an image analysis algorithm to achieve automatic target identification and tracking. Parsonage et al. [8] developed a computer vision system to provide real-time feedback on bait particle consumption. Atoum et al. [9] achieved continuous detection of bait particles in video frames by applying a correlation filter to identify residual bait within local regions. An SVM classifier was used to suppress detection errors, providing a foundation for intelligent bait-feeding control. Li et al. [10] proposed an adaptive threshold segmentation method for detecting residual bait particles in underwater images. However, traditional machine vision methods struggle with complex backgrounds and small targets, limiting their effectiveness in practical applications.
Deep learning can automatically extract high-dimensional features from large datasets, resulting in significantly higher accuracy compared to traditional machine learning methods [11]. Currently, deep learning techniques have been widely used in aquaculture [12]: Rauf et al. [13] used deep convolutional neural networks to automatically identify fish based on visual features. Fernandes et al. [14] applied image segmentation techniques to predict weight and carcass traits of Nile tilapia. Labao and Naval [15] proposed a fish detection system based on deep network architecture for robust detection and counting of fish targets in a variety of biological backgrounds and lighting conditions. Zhao et al. [16] applied a particle advection method to extract motion features from the entire fish population, eliminating the need for tracking and foreground segmentation. They also used augmented motion-captured images and recurrent neural networks to accurately identify, localize, and classify abnormal fish behavior in intensive aquaculture environments. Xu et al. [17] proposed a fish species identification model based on SE-ResNet152 with class-balanced focal loss, addressing the overfitting caused by sample imbalance. However, these algorithms still fall short of meeting real-time detection requirements in practical aquaculture settings [18].
The YOLO family of algorithms offers a promising solution for real-time object detection. As representative single-stage detectors, they are known for their high accuracy and fast inference speed and have been widely applied in aquaculture tasks. Cai et al. [19] proposed an enhanced fish detection and counting method by using the YOLOv3 and MobileNet architectures. The method improves detection accuracy by incorporating a fixed selection strategy into the original YOLOv3 framework. Hu et al. [20] improved average model accuracy by 27.21% and reduced computational cost by approximately 30% by applying dense concatenation and de-redundancy techniques to the feature extraction module of the YOLOv4 backbone. These enhancements make the algorithm more suitable for practical aquaculture environments. In addition, the YOLO algorithm also shows strong advantages in small target detection tasks in underwater environments [21]. Even in low light environments and turty water environments, the YOLO algorithm can show excellent algorithm adaptability and complete the detection task well [22].
The complexity of underwater imaging and the small size of bait particles [23] make the YOLO algorithm prone to positional prediction errors. Moreover, bait particles often appear in clusters or overlap due to occlusion, while distant targets occupy only a few pixels in the image, making them especially prone to missed detection. Background noise from swimming fish and other dynamic elements further complicates the detection process [24].
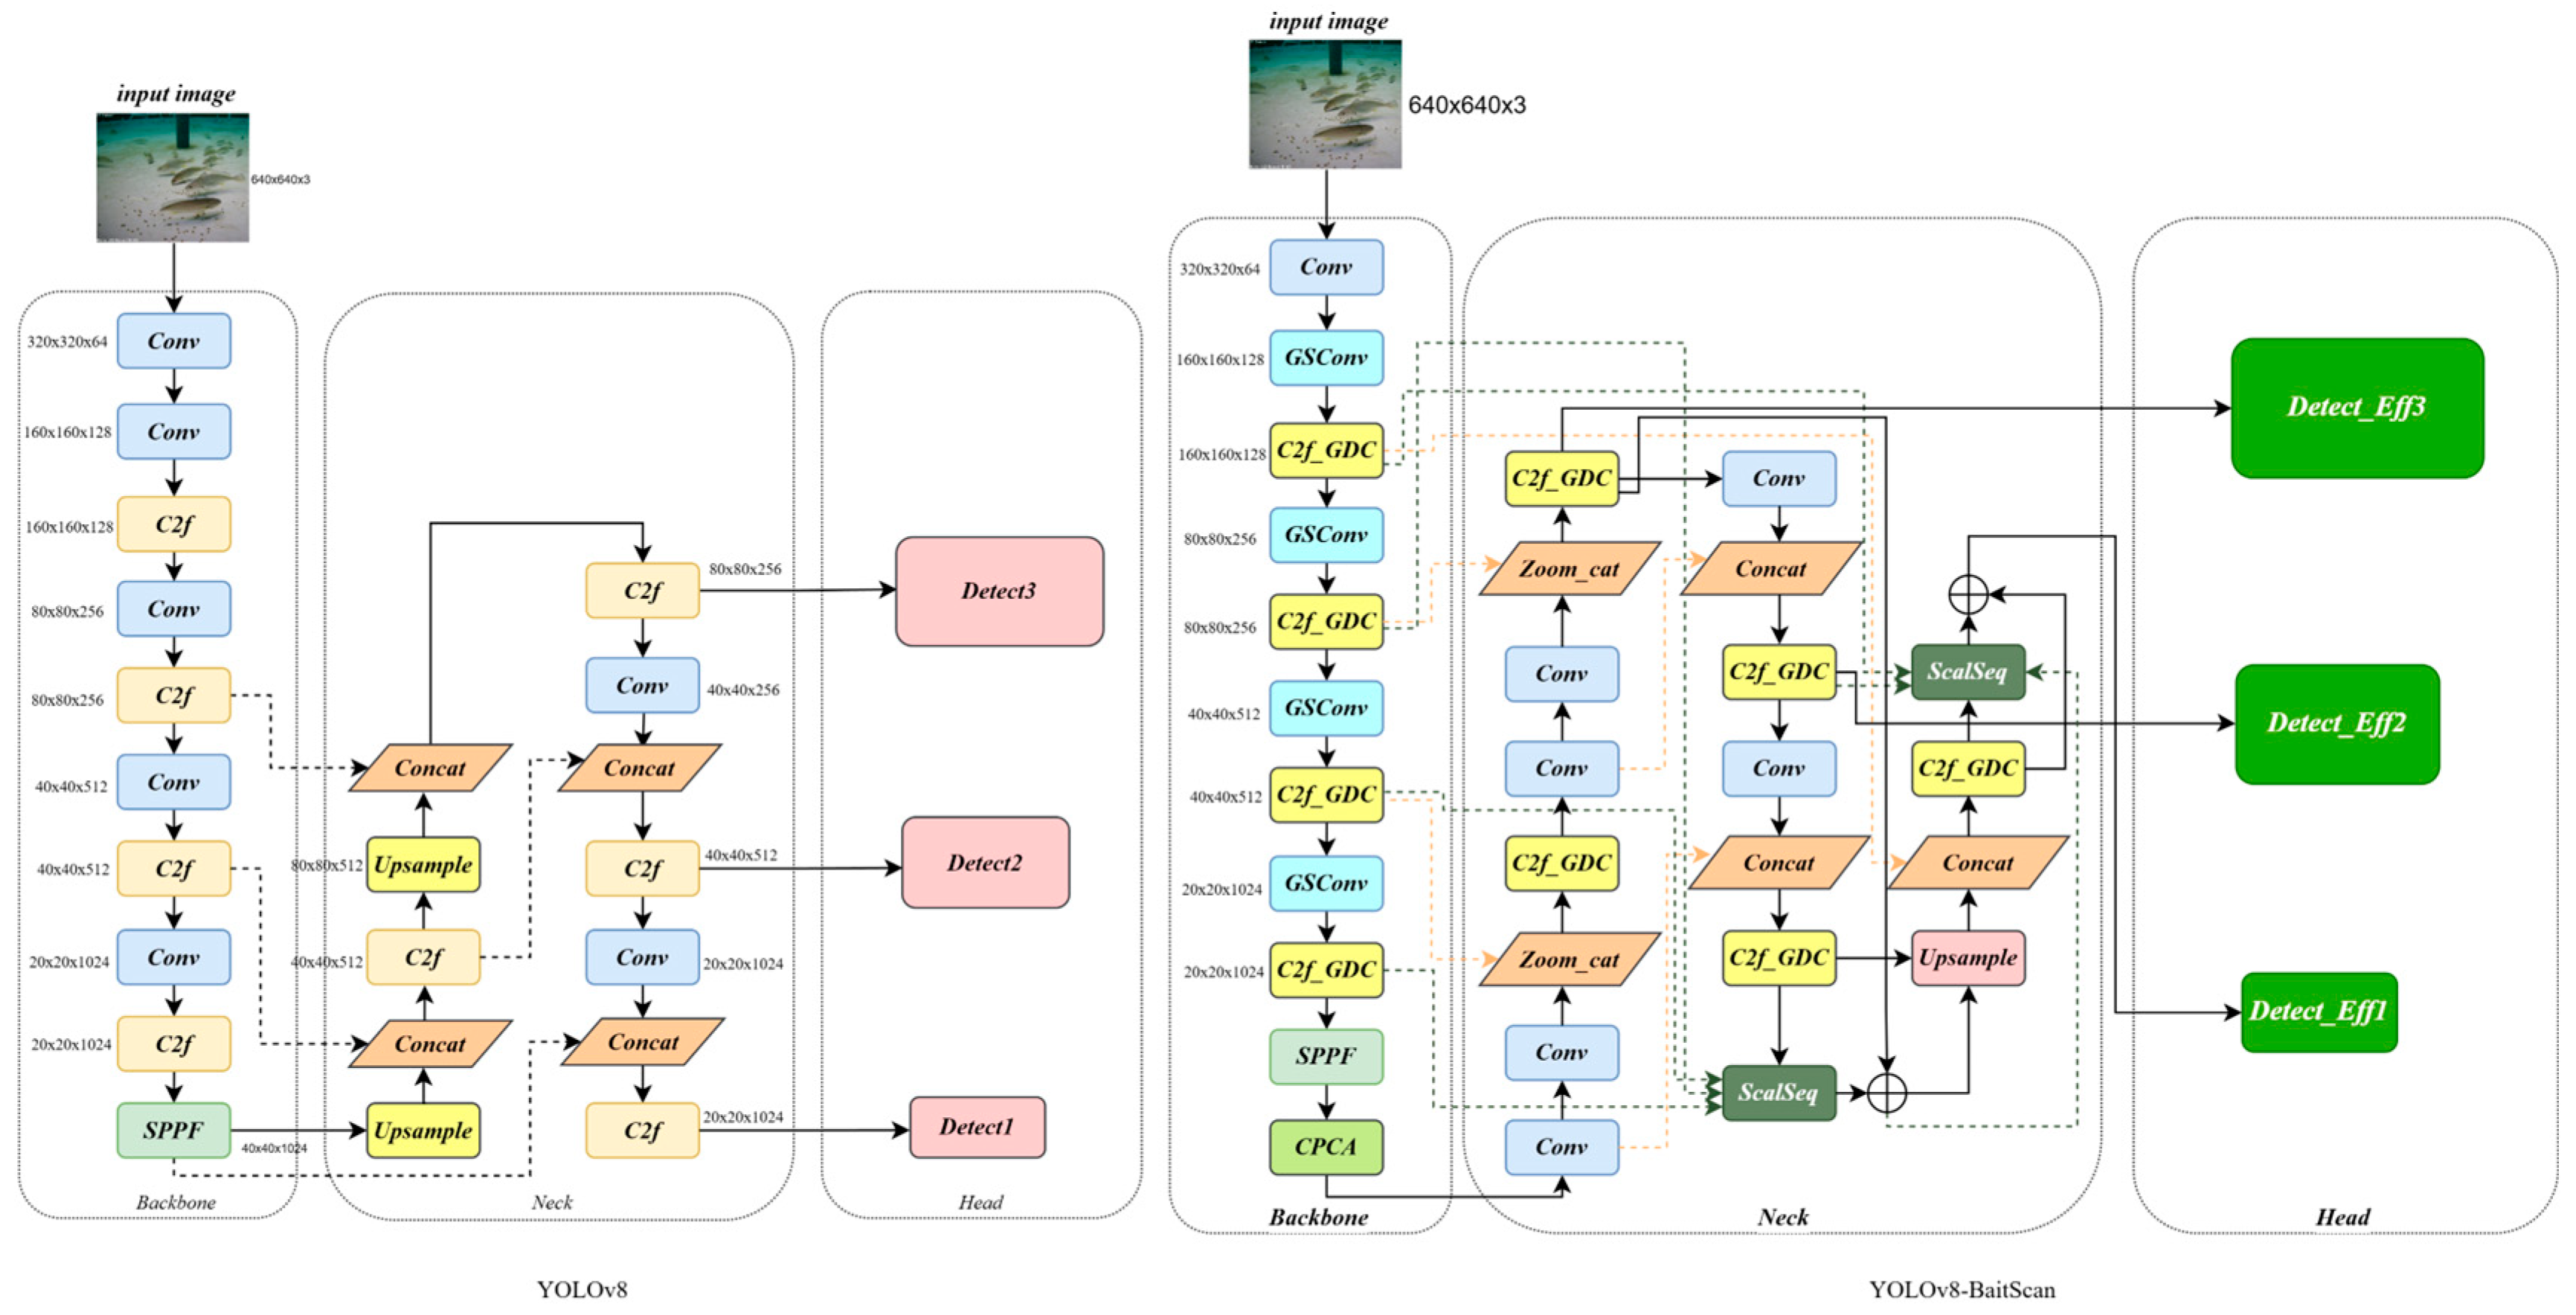
Therefore, this paper proposes an improved YOLOv8n-based method for more efficient and accurate detection and counting of bait residues. The approach is designed to address key challenges such as target aggregation, occlusion, missed detections of small distant baits, and interference from complex underwater backgrounds. By removing redundant operations, the model is streamlined for higher efficiency and better suitability in real-world aquaculture environments.
The remainder of this paper is organized as follows: Section 2 presents the dataset and algorithmic improvements; Section 3 analyzes the results of ablation experiments; Section 4 discusses the experimental findings in depth; and Section 5 concludes this study.

2. Materials and Methods

2.1. Data Collection and Processing

The data for this experiment were obtained from the publicly available dataset [25] and were further processed. The size of the experimental platform was 3 m × 3 m × 1.2 m, and the water depth was 0.7 m. In order to ensure the stability and controllability of the experimental environment, the dissolved oxygen content of the pool was 7.0 ± 1.0 mg/L, and the water temperature was 13–16 °C, creating a suitable breeding environment for fish growth and behavior observation. Feeding was performed every 24 h at 14:00 Beijing time during the data collection period to establish a stable eating behavior pattern. Each feeding was carried out in batches, and the single feeding amount was 0.15–0.20% of the fish’s body weight, and the total feeding amount was 1.5–2.0% of the fish’s body weight. Data were collected on the remaining baits in the culture tank 25 min after the fish had eaten. Data were captured with an underwater HD industrial camera positioned at the edge of the circulating aquaculture unit 45 cm from the bottom at a 45-degree angle to the bottom. Due to the limited number of images in the initial dataset, we expanded the dataset through random flipping, cropping, and other augmentation techniques to improve model training efficacy, data augmentation examples on pepper imagesas shown in Figure 1. The augmented dataset, which contains 924 images, was randomly divided into training, validation, and test sets in an 8:1:1 ratio.
The expanded dataset was annotated using LabelImg with the following guidelines: Baits were annotated if 50% or more of their volume was visible. In cases of overlapping baits, each was annotated independently. This process yielded 22,444 labeled samples, which provided high-quality annotated data for subsequent model training.

2.2. Proposed YOLOv8-BaitScan

YOLOv8n was selected as the baseline network for our experiments. However, the lightweight architecture of YOLOv8n limits its feature extraction capability, leading to reduced detection accuracy for baits. To address this limitation, we propose YOLOv8-BaitScan, an improved network based on YOLOv8n, designed to achieve higher bait counting accuracy and efficiency. Figure 2 shows the comparison between the improved YOLOv8-BaitScan and the original structure of YOLOv8. The specific improvements are as follows: (1) A channel prior convolutional attention (CPCA) mechanism is integrated into the final layer of the backbone network. This module enhances feature extraction by dynamically weighting channel and spatial dimensions while preserving prior channel information. (2) Adopt the MPDIoU loss function to strengthen the accuracy of bounding box regression and significantly improve the network’s localization ability for tiny bait targets. (3) A multi-scale sequence feature fusion module is introduced to improve multi-scale information extraction, combining global semantic data from various scales to capture detailed spatial information of small targets. Additionally, a dedicated detection layer for tiny targets is added to the head, while the large-target detection layer is removed to minimize computational redundancy without compromising performance. (4) To achieve real-time monitoring, the redundancy in the number of model parameters and computation is reduced by introducing the GhostConv and C2f-GDC modules, and the lighter detection head Detect-Efficient is designed to significantly improve the real-time detection performance of the model.

2.2.1. CPCA Attention Mechanisms

The attention mechanism is a computational method inspired by the human visual system. It enables models to prioritize task-critical regions or channels during image processing, thereby enhancing performance in vision-related tasks. The mechanism fundamentally operates through weight assignment. For a given input feature map, the mechanism dynamically computes attention weights across spatial locations and channels. This process emphasizes salient regions or channels while suppressing redundant or irrelevant features.
CPCA (channel prior convolutional attention) [26] is an efficient attention mechanism that dynamically assigns weights across channel and spatial dimensions, enhancing the network’s feature representation capability. This mechanism extracts spatial relationships via a multi-scale deep convolutional module while preserving a priori channel information, enabling the network to focus on channels and salient regions containing critical information.
The CPCA architecture comprises a channel attention module and a spatial attention module, as illustrated in Figure 3. Specifically, the input feature maps are first processed by the channel attention module: The channel attention module aggregates the spatial information of the input features through average pooling and maximum pooling operations to generate feature maps representing the global information of the channels, as in Equation (1):
C A F = σ M L P A v g P o o l F + M L P M a x P o o l F
where F denotes the input feature map, σ denotes the sigmoid activation function, and AvgPool and MaxPool denote the average pooling and maximum pooling, respectively.
Subsequently, the spatial information is further processed by a shared MLP and combined with the original features to generate the channel attention map. After multiplying the channel attention map with the input features element by element, the channel priori information incorporating the channel weights is obtained. Next, the channel prior information is fed into the spatial attention module. This module extracts spatial relations using deep convolution, generates the spatial attention map, and fuses the channel and spatial attention through the channel blending operation, as in Equation (2):
S A F = C o n v 1 x 1 i = 0 3 B r a n c h i D w C o n v F
where DwConv denotes deep convolution, and Branchi denotes the ith branch with different convolution kernel sizes for capturing multi-scale information. Eventually, the fused spatial attention graph is multiplied element by element with the channel a priori information again to generate a more refined feature representation as output. This process significantly improves the network’s ability to perceive important regions and key information and enhances the differentiation and robustness of the feature representation.
In this study, the CPCA mechanism is introduced into the bait small target detection task, making full use of its ability to focus on the key regions and extract key information. By guiding the network to focus on the region containing the bait target to be detected, CPCA effectively improves the detection accuracy of small targets. Aiming at the problem that the model does not pay enough attention to the actual bait area, which leads to insufficient detection accuracy, the CPCA mechanism can dynamically adjust the model’s attention to different regions to achieve more attention to the area with bait samples so as to obtain more delicate features and finally improve the detection accuracy.

2.2.2. MPDIoU Loss Function

Bounding box regression (BBR) [27] is widely used in object detection for precise target localization. A well-designed loss function plays a critical role in improving regression accuracy.
MPDIoU loss [28], a novel loss function based on the minimum point distance (MPD), is proposed to optimize bounding box regression. Its geometric parameters are illustrated in Figure 4.
The calculation formula is shown in Equations (3) and (4):
M P D I o U = A B A B d 1 2 w 2 + h 2 d 2 2 w 2 + h 2
L o s s M P D I o U = 1 M P D I o U
where (xigt, yigt) denotes the actual labeled bounding box coordinates, and (xipre, yipre) denotes the predicted bounding box coordinates. The distances are calculated as follows: d12 = (x1pre − x1gt)2+(y1pre − y1gt)2, d22 = (x2pre − x2gt)2 + (y2pre − y2gt)2. MPDIoU evaluates the overlap degree by measuring the distance between the predicted and actual bounding boxes.
MPDIoU, as a new metric, improves the accuracy and efficiency of bounding box regression by comparing the similarity between the predicted bounding box and the actual labeled bounding box in the bounding box regression process. It focuses on optimizing the detection performance of small and complex boundary targets in the target detection and segmentation task and overcomes the shortcomings of traditional IoU loss in small target processing and boundary matching. Therefore, the MPDIoU loss is introduced in this study to enhance the model’s localization accuracy for bait targets and solve the problem of predicting bounding box duplication in the case of overlapping bait particles. In addition, in terms of model training, the mathematical calculation formula of MPDIoU loss is easier, which can enhance the convergence speed of the model to some extent and shorten the model training time during the training process.

2.2.3. Neck Network Optimization and Replacement of Small Target Detection Layer

Given the characteristics of the small-target bait detection dataset, where some bait targets are small in size and distributed over long distances, the traditional P3, P4, and P5 detection layers have a low recall rate for long-distance small-target baits. To solve this issue, the detection head configuration was optimized through extensive experiments. The redundant P5 large-target detection layer, which was not contributing to small-target detection, was removed, and a P2 detection layer was added to significantly enhance recall for long-distance small-target baits. Additionally, to further enhance the ScalSeq [29] module’s ability to fuse multi-scale features, the structure of the Neck network was optimized by adding a new ScalSeq layer to the original one, enabling deeper fusion of feature information from the P2, P3, and P4 layers, as shown in Figure 5. With this improvement, the model can capture the detailed features of tiny targets more efficiently and shows excellent detection performance, especially at long distances and in complex backgrounds. The optimized Neck network not only improves the detection accuracy of the overall model but also significantly improves the efficiency and robustness of the bait target counting task, which provides new technical ideas and practical tools for the field of small target detection.
The size of the newly added P2 detection layer is 160 × 160, which is able to retain more spatial details of the target, and its receptive field is smaller, which is more suitable for perceiving local regional details without ignoring small target information. The traditional deep detection layers P5 and P6 often blur or disappear the small target information because of multiple downsampling, while the P2 layer is located in the shallow layer of the model and can retain the complete key features such as the edge and texture of the small target. Due to the small size and irregular shape of bait particles in intensive aquaculture, the introduction of P2 layer can make the model detect these small target bait more accurately and then significantly improve the accuracy of model detection.

2.2.4. GhostConv and C2f-GDC Modules and Detect-Efficient

To balance detection accuracy with model parameters and computation, this study introduces the GhostConv [30] and C2f-GDC modules and designs a lightweight detection head, Detect-Efficient. This approach significantly reduces both computational cost and the number of model parameters while maintaining detection accuracy, providing a more efficient solution for practical use.
As shown in Figure 6, the structure of GhostConv consists of three main steps: standard convolution, Ghost feature generation, and feature map stitching. First, GhostConv performs preliminary feature extraction on the input image by standard convolution operation and, at the same time, compresses the number of channels to reduce the computational complexity. Then, the Ghost module is used to generate more feature maps by simple linear operations on the preliminary generated feature maps, thus enriching the feature representation. Finally, all generated feature maps are stitched together to form the final output feature maps. In this way, GhostConv significantly reduces the number of parameters and computational complexity, while preserving detailed feature information.
In this study, we developed the C2f-GDC module by combining DynamicConv [31] with GhostBottleNeck and incorporating it into the C2f module, as shown in Figure 7. The structure of DynamicConv adaptively adjusts the weight of the convolution kernel according to the features of the input image. This alleviates the computational burden caused by a large number of stacked convolutional layers. In the C2f module, we replace the original BottleNeck structure with GhostBottleNeck. GhostBottleNeck consists of two stacked Ghost Modules. The first Ghost Module acts as an extension layer, increasing the number of channels to enrich feature representation. The second Ghost Module compresses the number of channels to align the output with the shortcut paths. Finally, a shortcut connection links the inputs and outputs, ensuring efficient feature delivery.
The detection head is a critical component of the YOLO family of algorithms. Located at the end of the network, it is primarily responsible for target localization and classification. However, the detection head contributes significantly to the overall computational complexity of the YOLOv8 network. To better balance computation and detection accuracy, this study proposes a more lightweight detection head named Detect-Efficient, with a structural comparison to the traditional detection head shown in Figure 8. The traditional YOLOv8 detection head typically extracts information sequentially through two 3 × 3 convolutions and one 1 × 1 convolution, followed by separate calculations for Bbox-loss and Cls-loss. However, this structure suffers from parameter and computational redundancy in the information extraction process.
To address this issue, we propose an improvement strategy: Before calculating Bbox-loss and Cls-loss independently, we allow both tasks to share the features extracted by the convolution layers. Additionally, we replace the original convolution layers with PConv [32] (see Figure 9), which significantly reduces both parameters and computational load. This optimization greatly improves the efficiency of the Detect-Efficient head.

3. Results

3.1. Assessment of Indicators

Precision, recall, and F1-score are commonly used metrics to evaluate the correctness of object detection, with their calculation formulas shown in Equations (5)–(7). Precision is used to indicate the percentage of correctly predicted baits in the prediction results, recall indicates the percentage of correctly predicted baits to the total number of all baits, and the F1-score value, as a composite metric, is the reconciled average of precision and recall. Param and GFLOPS are model parametric and computational metrics, respectively, typically used to assess the computational complexity of the model. These metrics will be employed to evaluate the model’s performance before and after optimization in the subsequent sections of this study.
P r e c i s o n = T P T P + F P
R e c a l l = T P T P + F N
F 1 s c o r e = 2 * P r e c i s i o n * R e c a l l P r e c i s i o n + R e c a l l
A P = n = 1 N R n R n 1 P n
m A P = 1 N 0 1 P R d R N
In this context, TP (True Positive) denotes correctly detected bait samples, FN (False Negative) denotes samples incorrectly identified as background, TN (True Negative) denotes samples correctly identified as background, and FP (False Positive) denotes samples incorrectly identified as bait. AP represents the area under the precision–recall (PR) curve and is used to measure the average accuracy of the model for a single category, with its value ranging from 0 to 1, as shown in Equation (8), where Pn is the precision value of the NTH point, Rn is the recall value of the NTH point, and N is the number of samples on the P-R curve. mAP denotes the average accuracy of multiple categories (single-category detection in this study) and is calculated as shown in Equation (9). mAP@50 and mAP@50:95 are the two metrics commonly used in mAP. mAP@50 indicates the average accuracy of the model at an IoU threshold of 0.5, while mAP@50:95 represents the average of mAP values calculated at IoU thresholds ranging from 0.5 to 0.95 (i.e., mAP@50, mAP@55, …, mAP@90, and mAP@95).

3.2. Experimental Parameter Setting

The experimental platform is shown in Table 1. The experimental hyperparameter settings are shown in Table 2. The experimental hyperparameters refer to the optimal hyperparameter settings given by the official authorities and are adjusted appropriately according to the specific experimental requirements.

3.3. Ablation Experiment

In order to verify that the improved algorithm has superior detection accuracy as well as speed for the bait counting task, the baseline model YOLOv8n is compared with the seven improved models based on YOLOv8n, and the results are shown in Table 3. The experimental environment and parameter settings were kept consistent during this experiment to ensure the credibility of the experimental results. In addition, pre-trained weights were loaded in the training process to ensure the reliability of the experimental results.
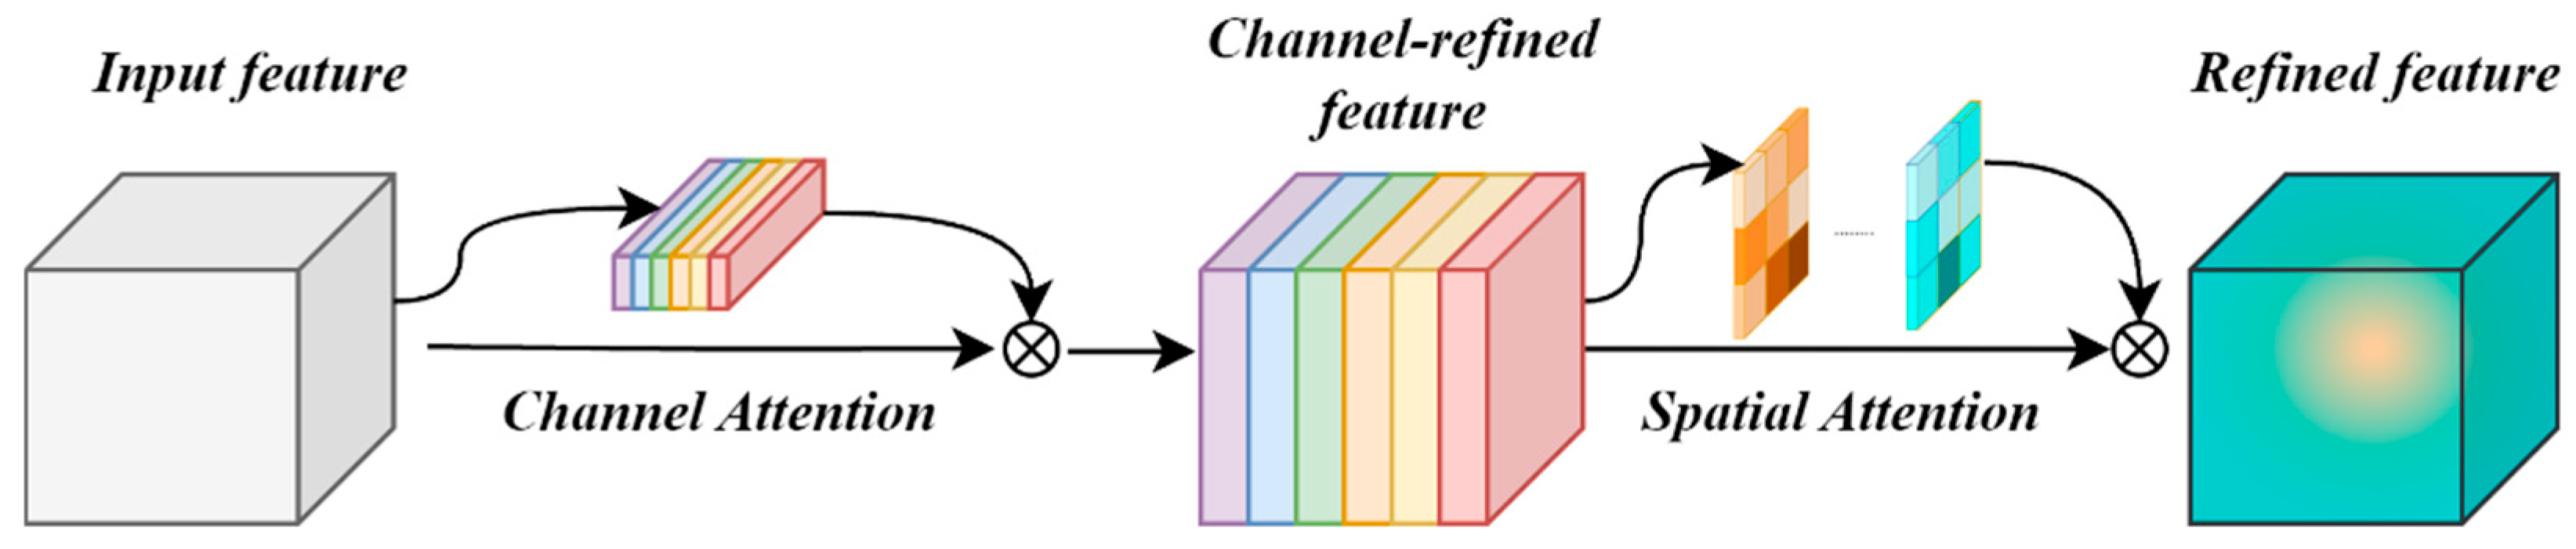
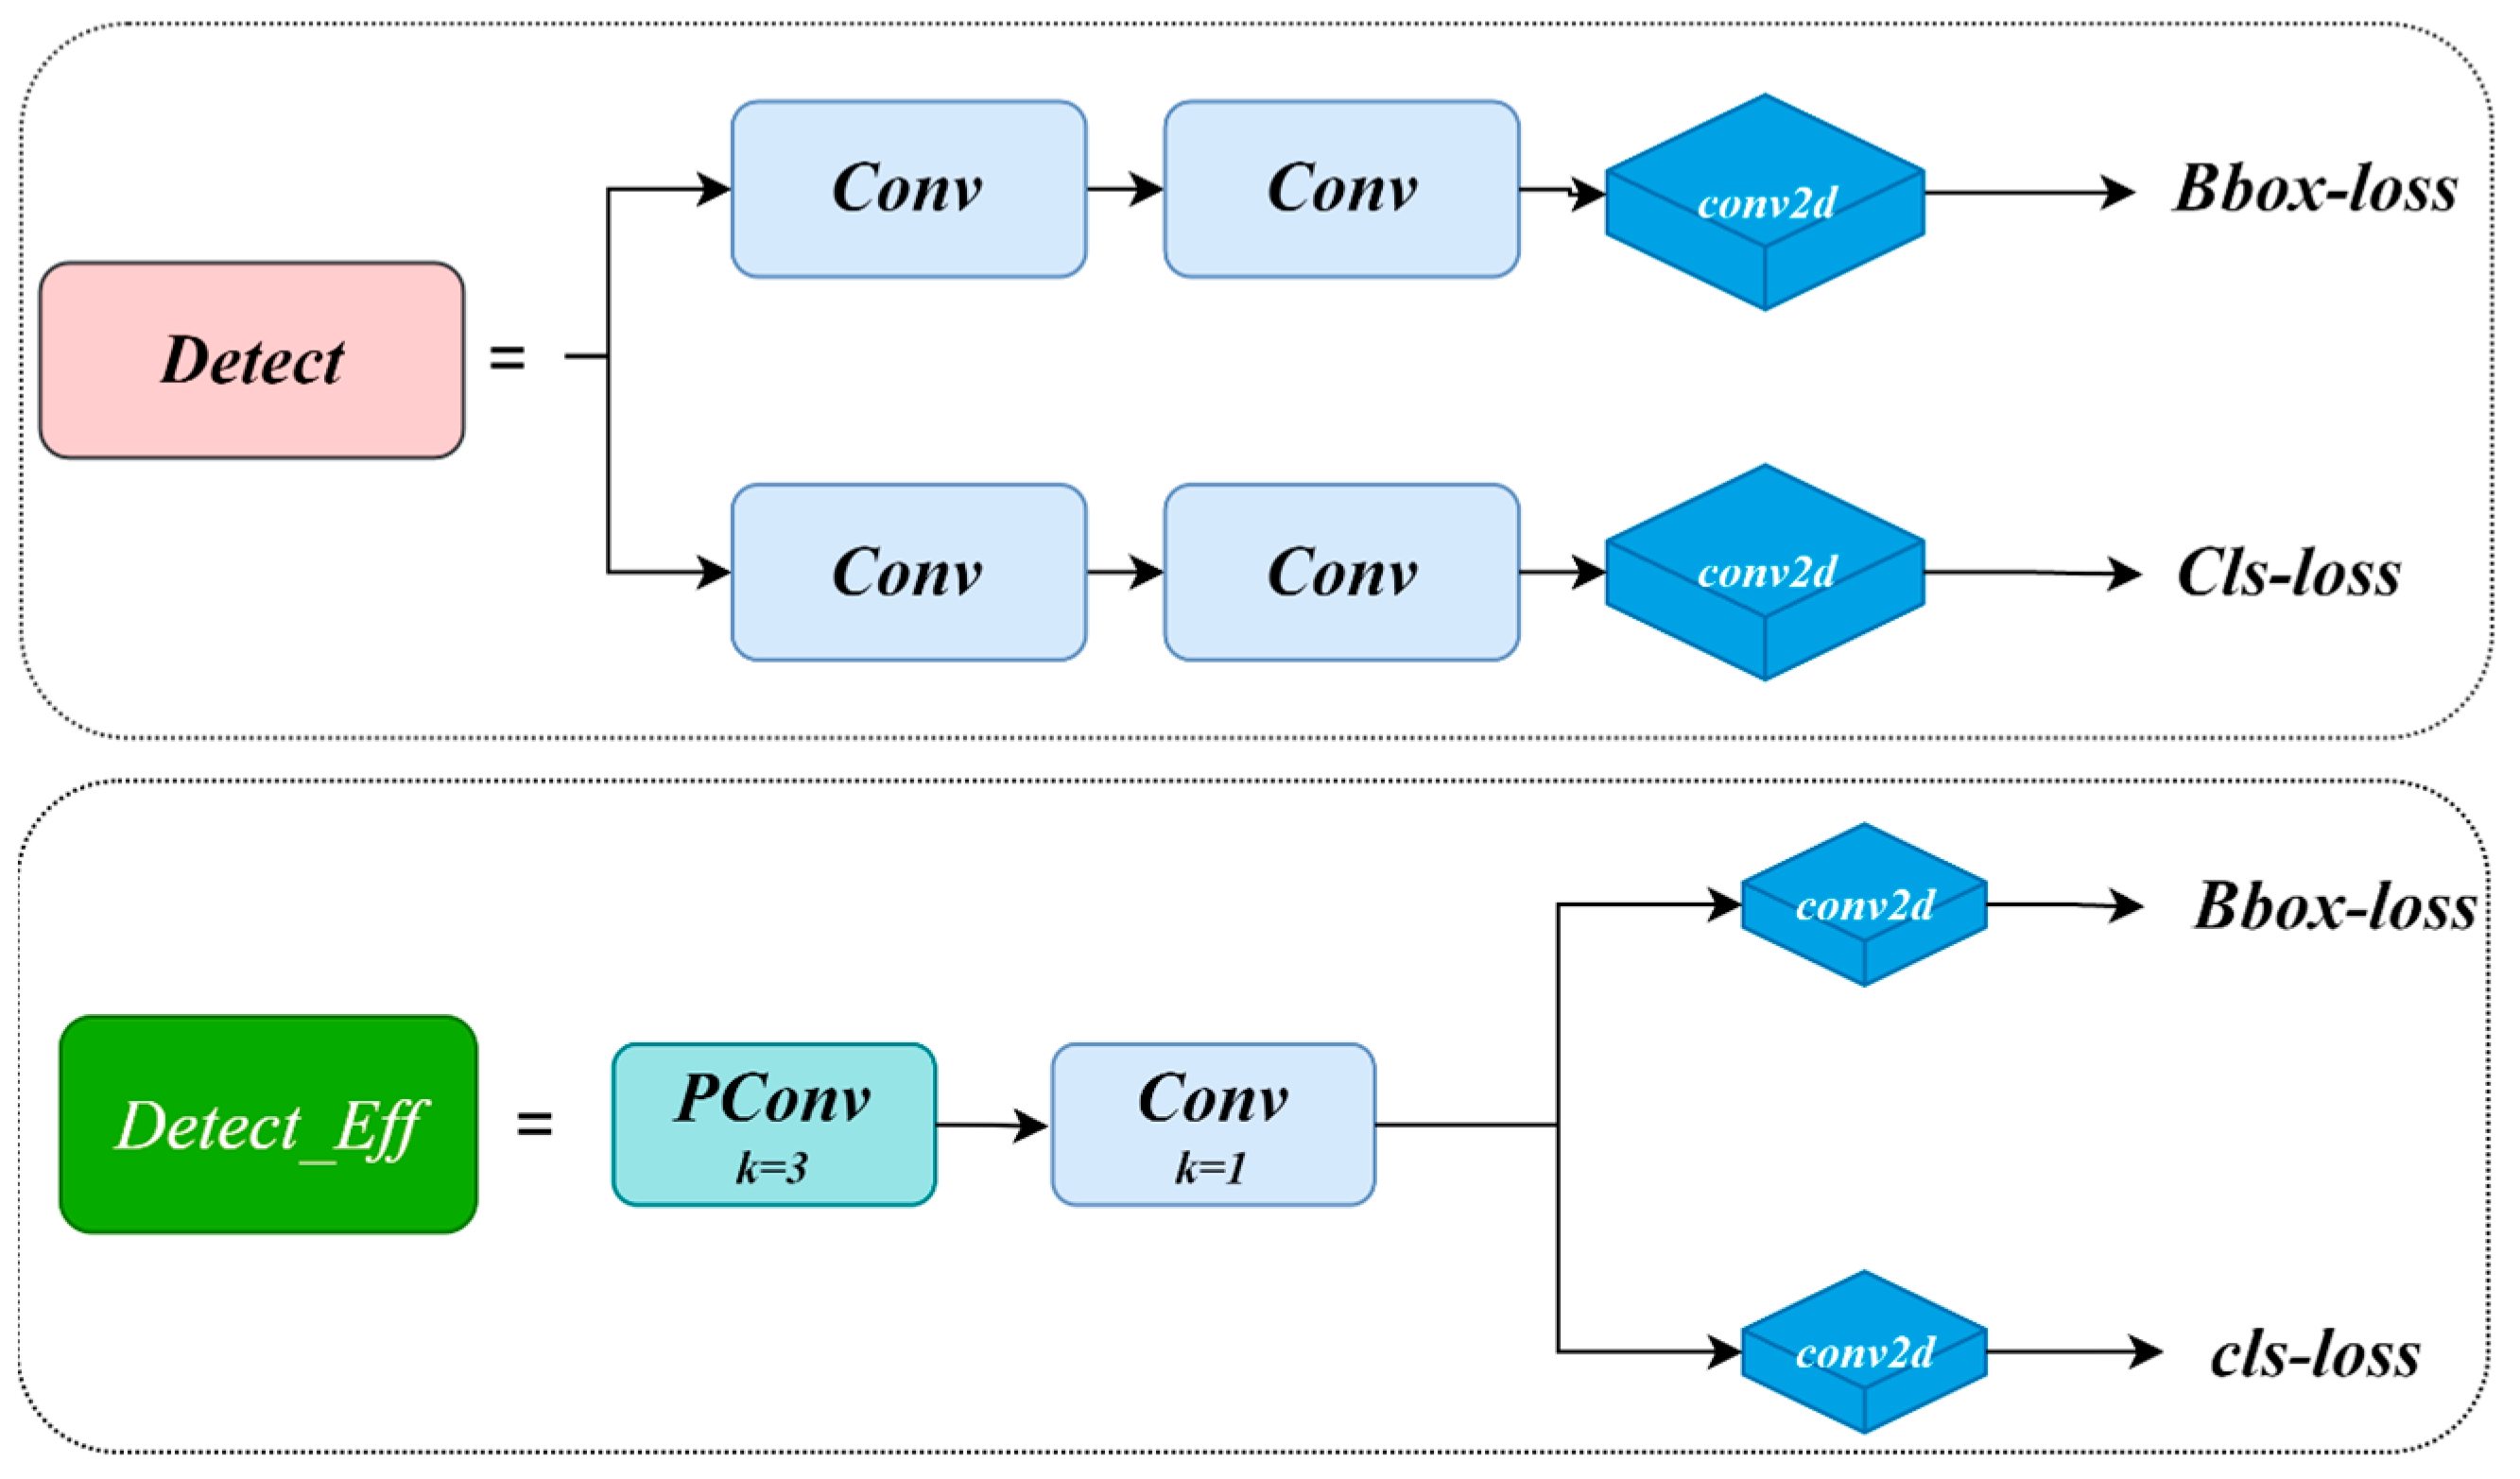
Applying the CPCA attention mechanism to the Backbone enhances the network’s focus on small bait regions, thereby improving detection precision. The MPDIoU loss further boosts detection performance by increasing localization accuracy and addressing bounding box duplication caused by overlapping bait particles. The improved Neck network and newly designed detection head significantly increase the recall of small, long-distance bait targets by effectively fusing multi-scale feature sequences. GhostConv and C2f-GDC reduce the model’s parameter count and computational cost with only a minimal impact on overall accuracy. Detect-Efficient, the proposed lightweight detection head, further reduces complexity by introducing PConv and enabling feature sharing across convolution layers. Additionally, with PConv, the convolutional kernel dynamically adjusts its range by ignoring missing or invalid data points, which leads to a notable improvement in detection accuracy.
Ultimately, the YOLOv8-BaitScan proposed in this study achieves significant performance improvements compared to the baseline YOLOv8n. Specifically, it improves recall by 33.6%, mAP@50 by 17%, mAP@50:95 by 10.6%, and F1-score by 18%. At the same time, the number of parameters and GFLOPS are reduced by 55.7% and 54.3%, respectively.

3.3.1. Analysis of the Effect of Introducing the CPCA Attention Mechanism

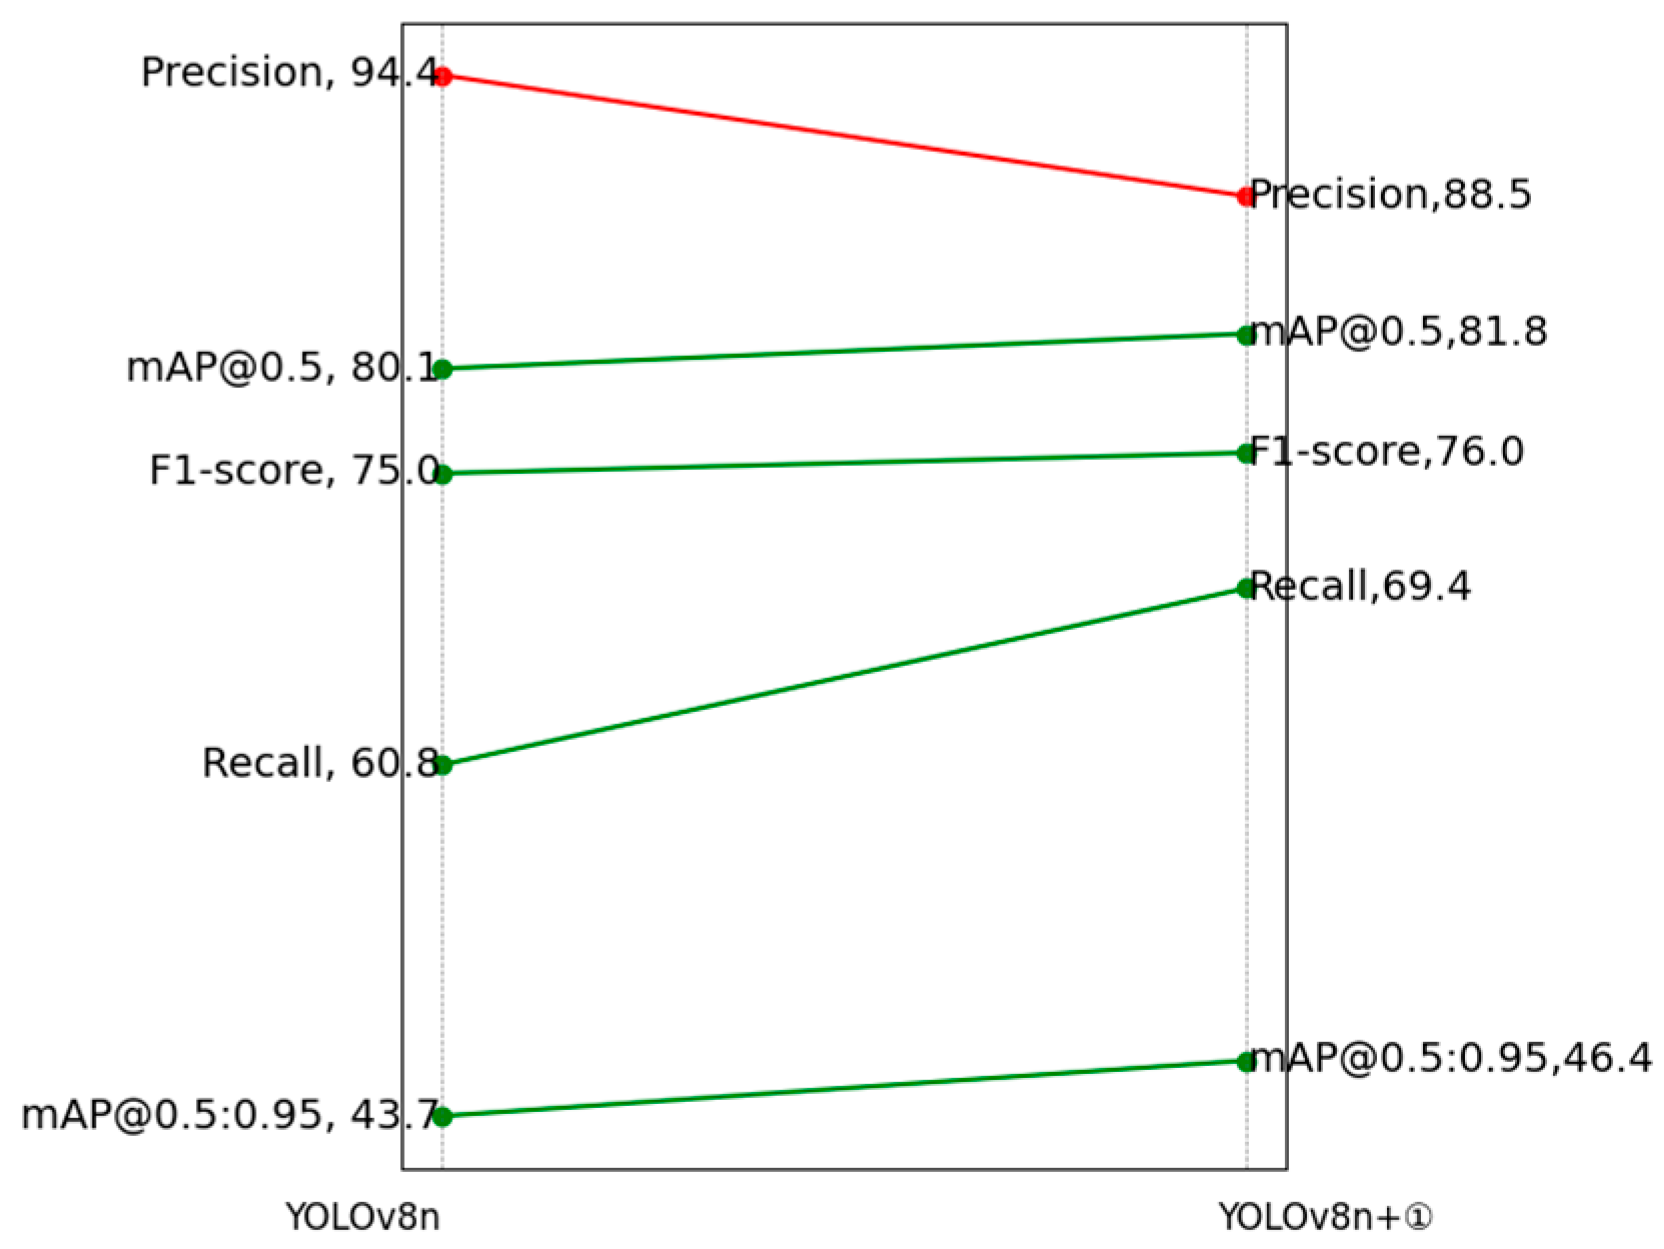
After integrating the CPCA module, all evaluation metrics improved except for precision(see Figure 10). Specifically, recall increased by 8.6%, reaching 69.4%; mAP@50 increased by 1.7% to 81.8%; mAP@50:95 improved by 0.4%; and the F1-score rose by 1%. These results demonstrate that the CPCA attention mechanism effectively enhances the overall detection performance of the model.

3.3.2. Analysis of the Effect of Replacing the MPDIoU Loss Function

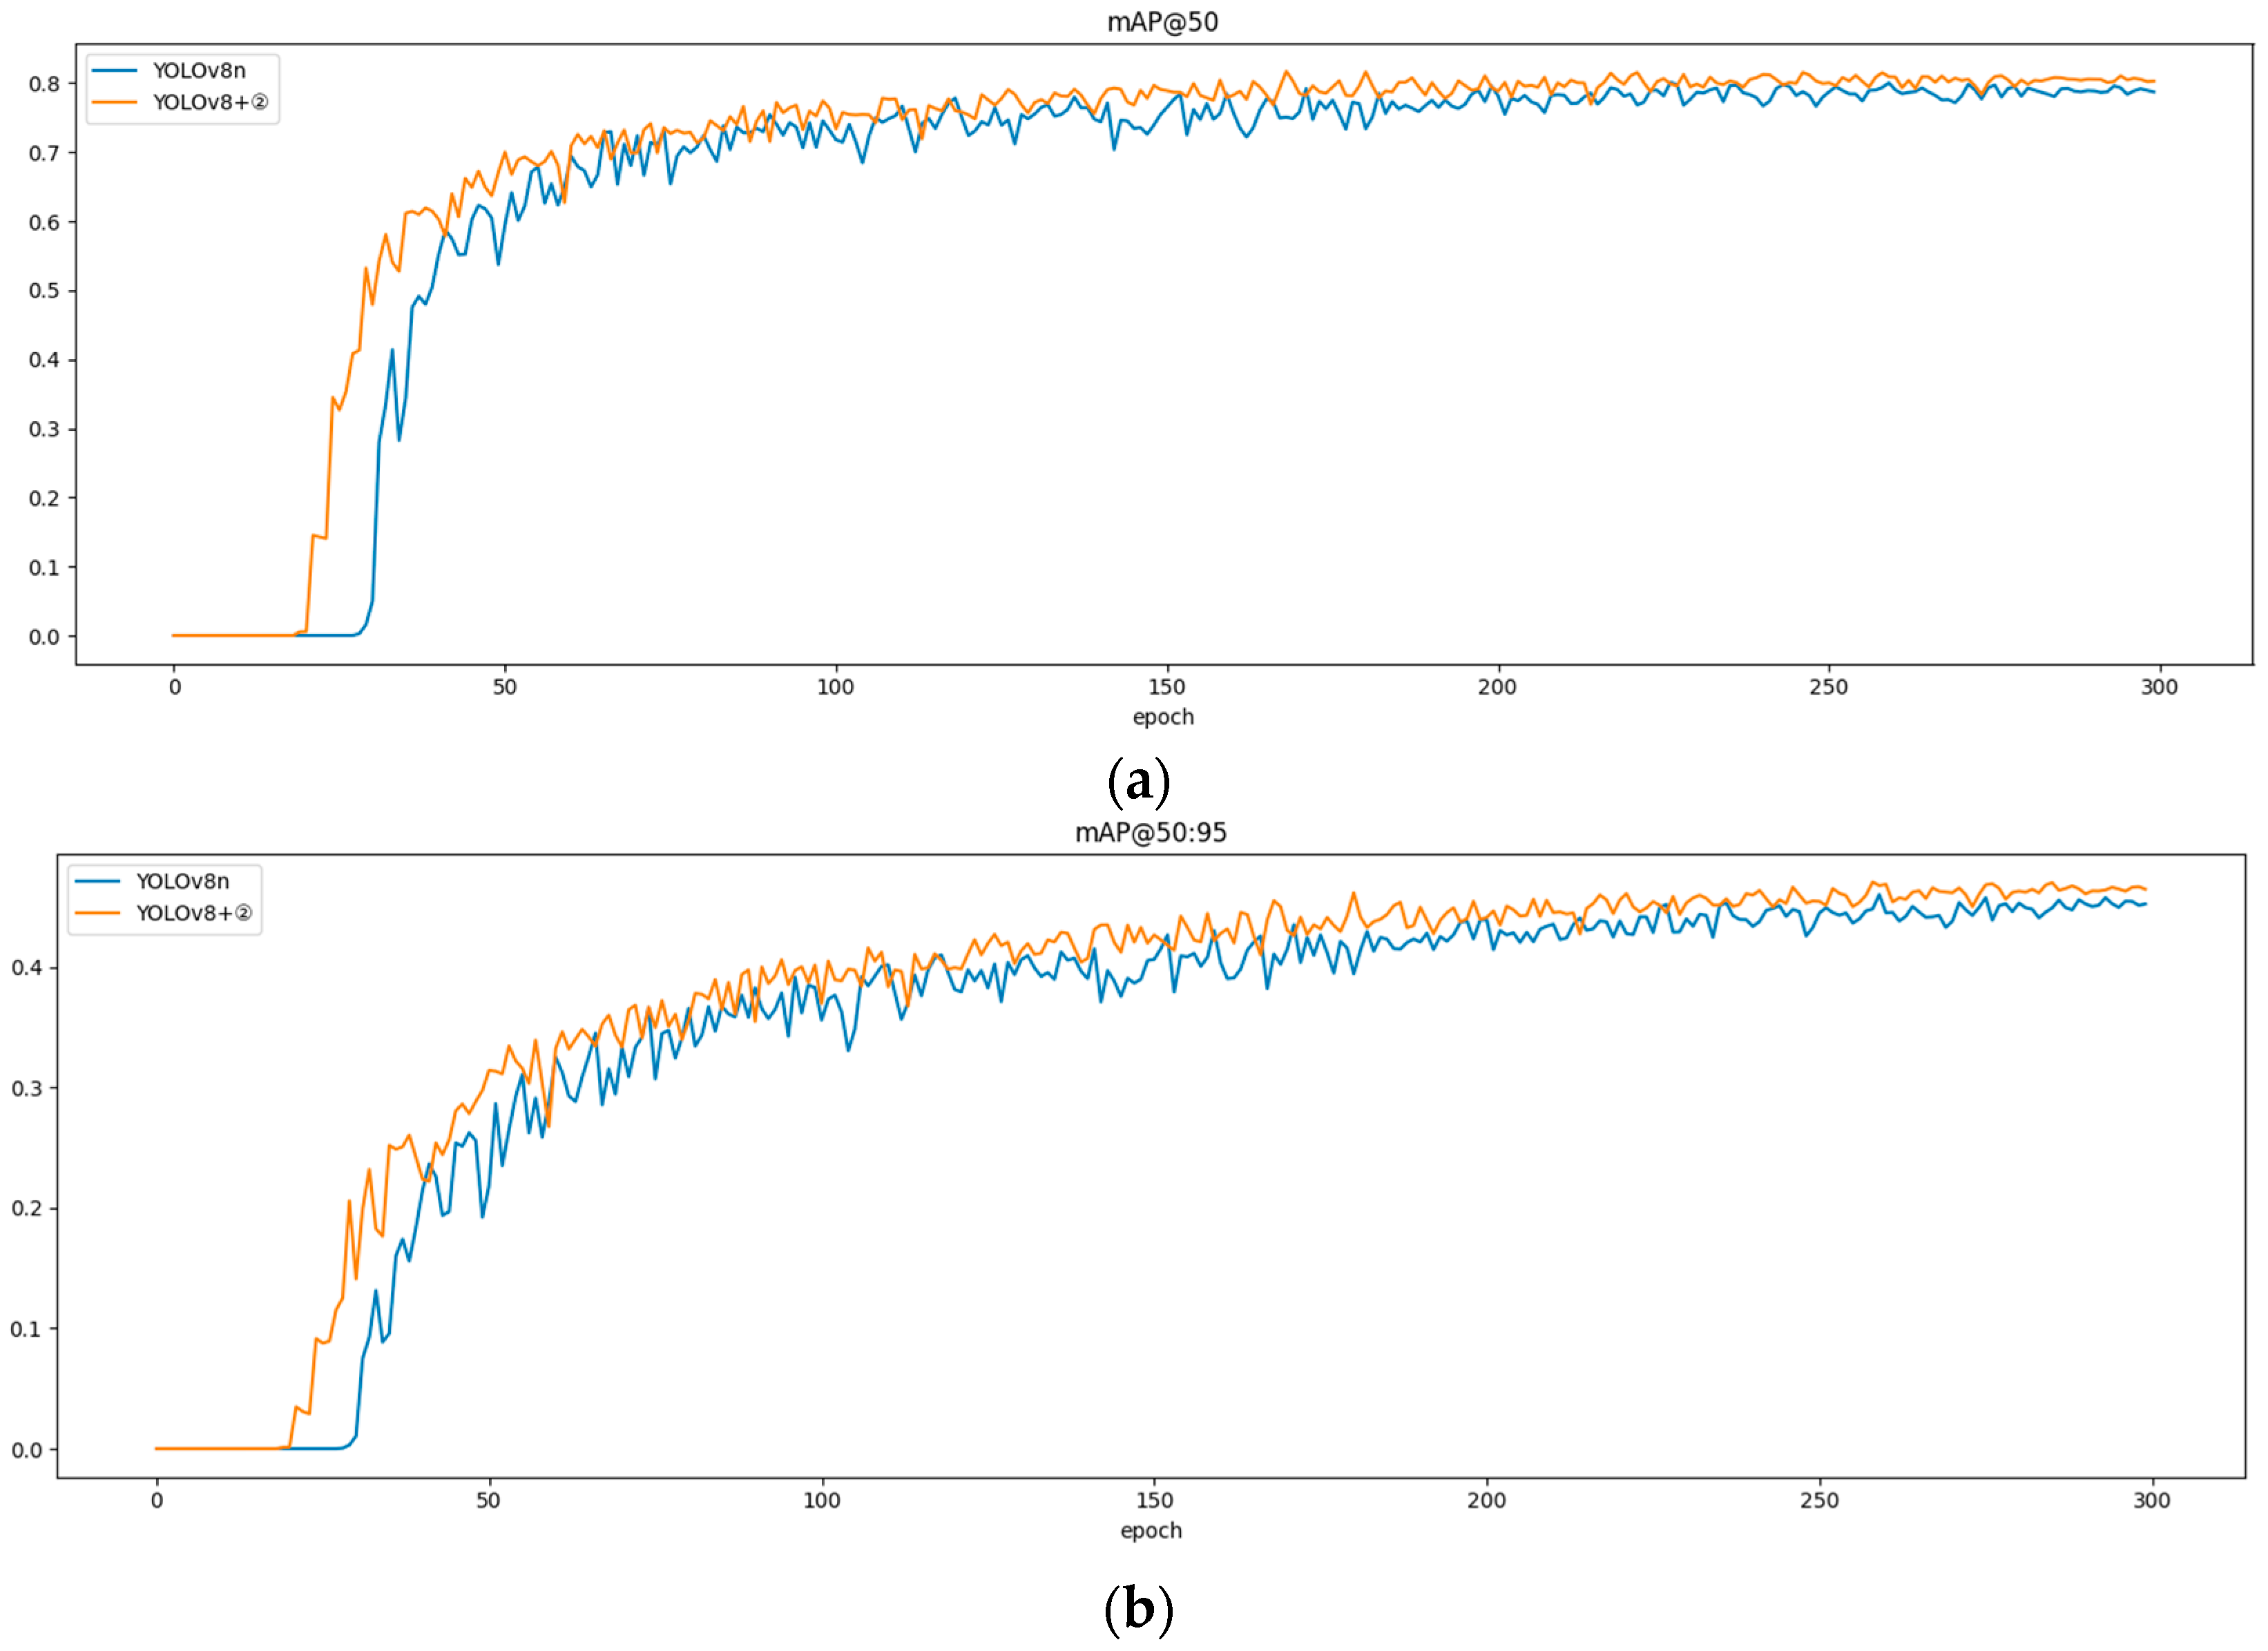
The introduction of the MPDIoU loss function improves the model’s localization accuracy for bait targets, thereby enhancing overall detection performance. As shown in Figure 11, comparing the effect of using the original loss function and MPDIoU loss, it can be seen from the results that the MPDIoU loss function is more suitable for the current bait residue detection task, and its effect is better than that of the original loss function in both the mAP@50 and mAP@50:95 metrics, which enhances the detection performance of the model. In addition to performance gains, MPDIoU has a more concise mathematical formulation, which accelerates the training process and allows the model to converge faster. As illustrated in Figure 11, the model using MPDIoU shows a noticeable increase in mAP starting from epoch 20, whereas the model using the original loss function does not show a similar rise until epoch 35.

3.3.3. Analysis of the Effect of Neck Network Optimization and Replacement of Small Target Detection Layers

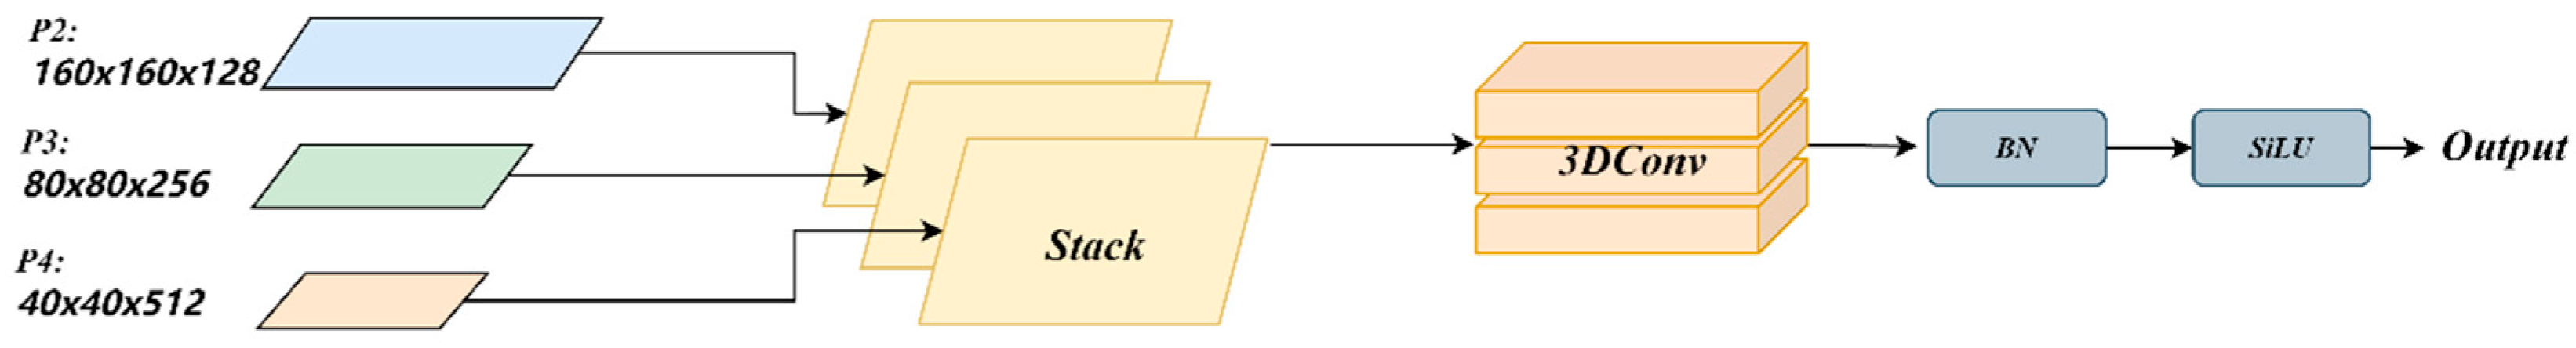
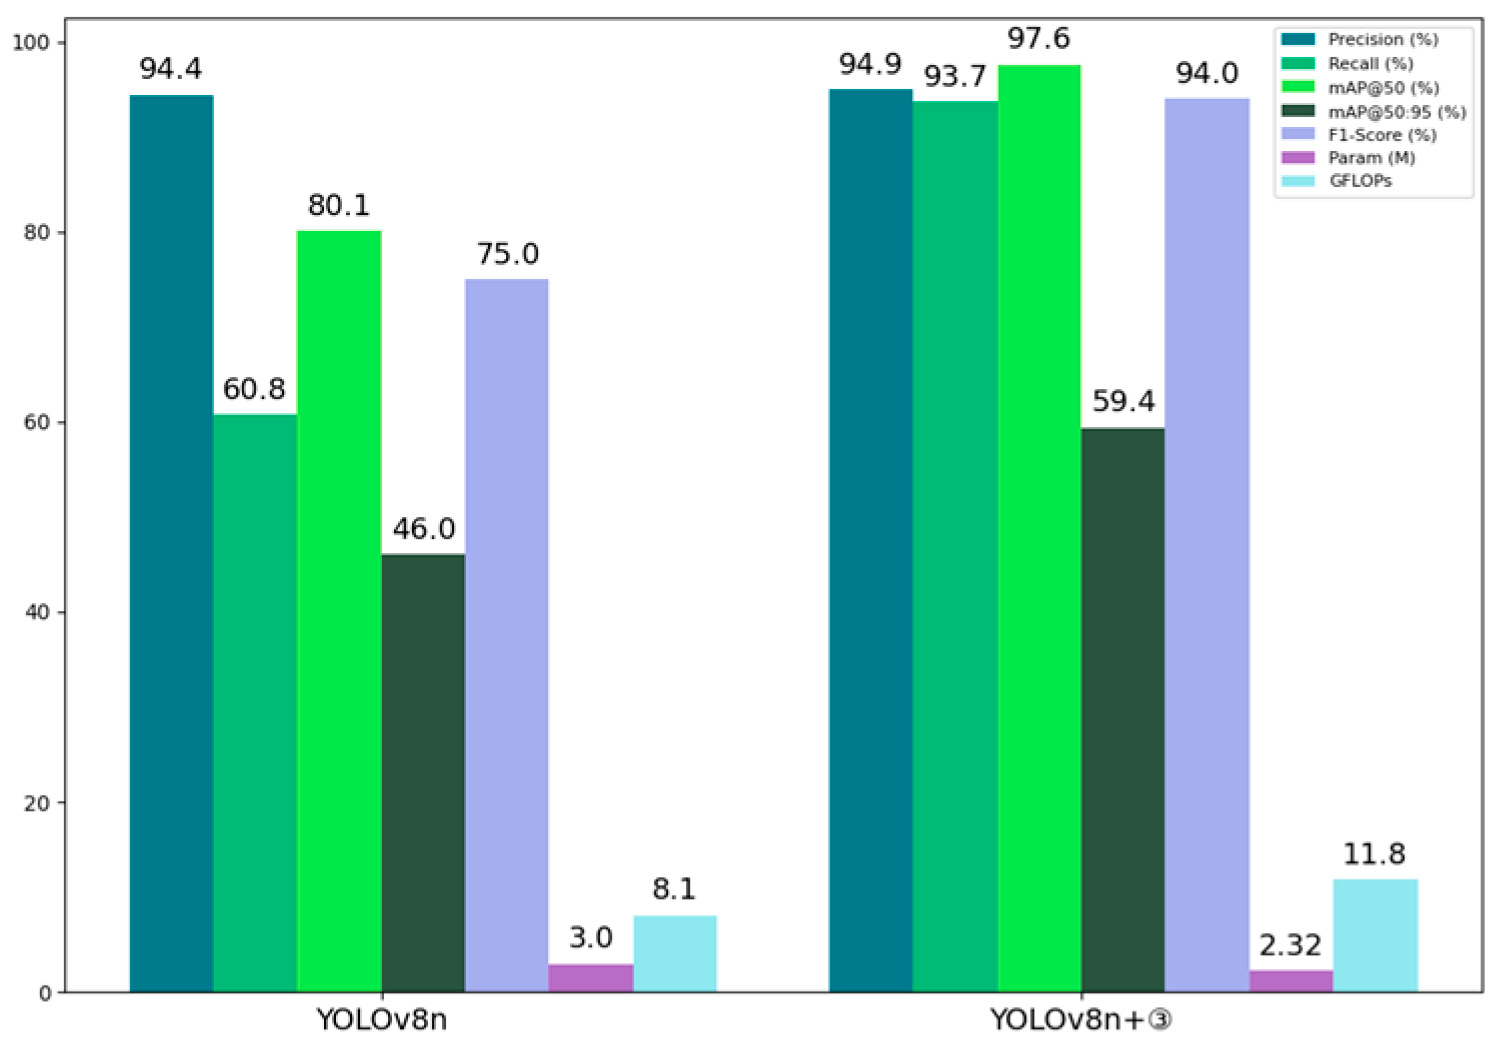
By redesigning the Neck part of the network, we enable the network to capture more feature information and reduce information loss during feature fusion. The bait detection accuracy is further improved by combining high-level information from deep feature maps with detailed information from shallow feature maps through the ScalSeq module, resulting in a multi-scale feature representation. In addition, by eliminating the redundant P5 large-target detection layer and adding the P2 small-target detection layer, the recall of long-range small baits is significantly improved, and thus the detection accuracy is significantly improved, with the recall increased to 93.7% and the mAP@50 increased to 97.6%. Figure 12 shows the comparison of the indexes between the original model and the Neck partially improved and replaced one detection layer. As can be seen from the results, all the indexes are significantly improved after the introduction of the Neck partially improved and the replacement of the P2 detection layer, but then it also brings a substantial increase in the amount of computation, and the GFLOPS increases from 8.1 to 11.8, which is a 31% increase in computation, and increases the burden of the model inference.

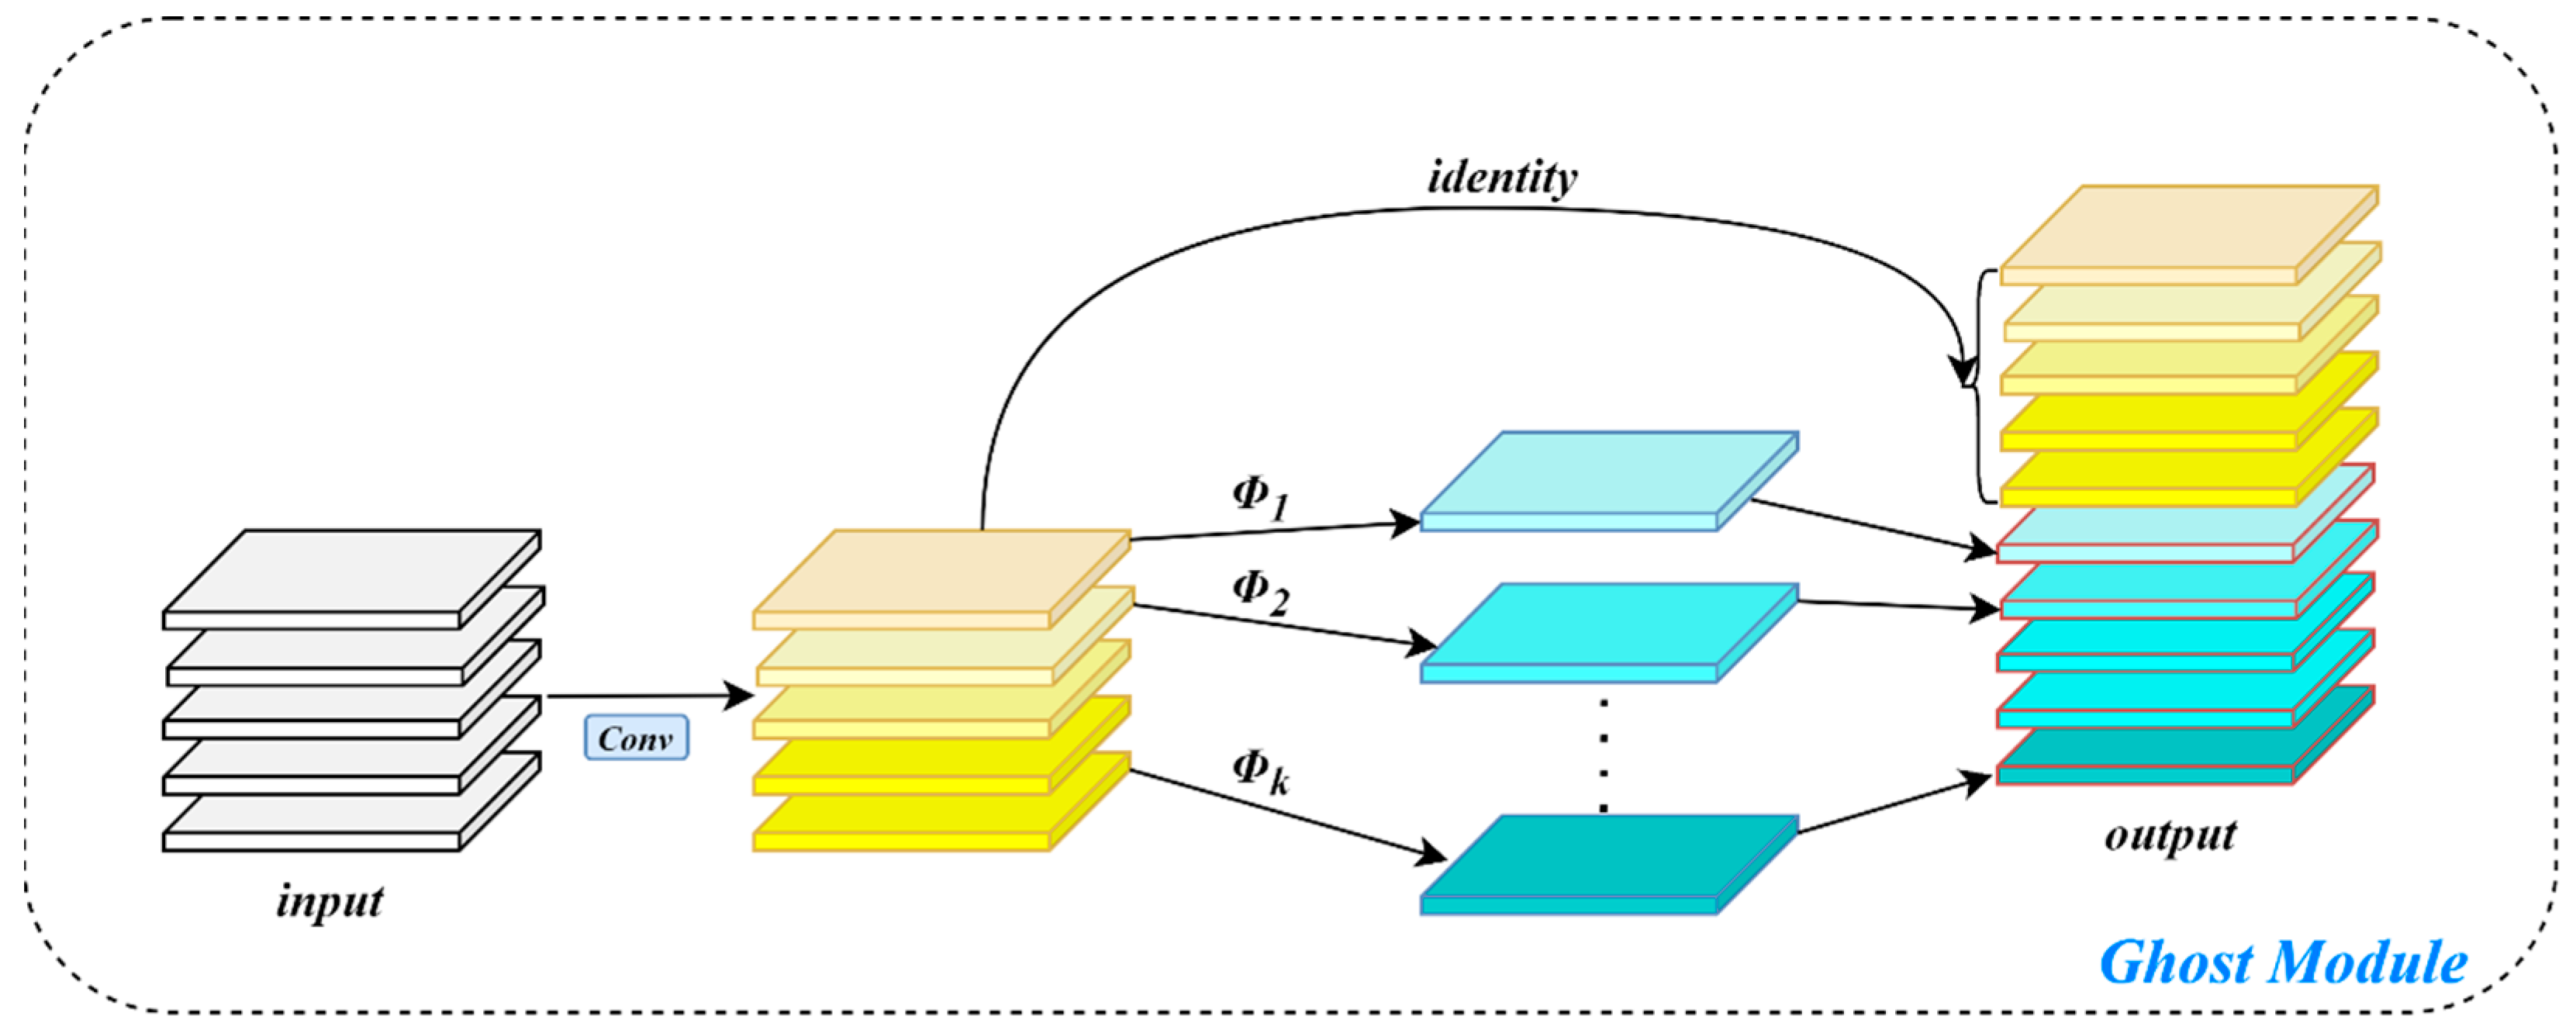
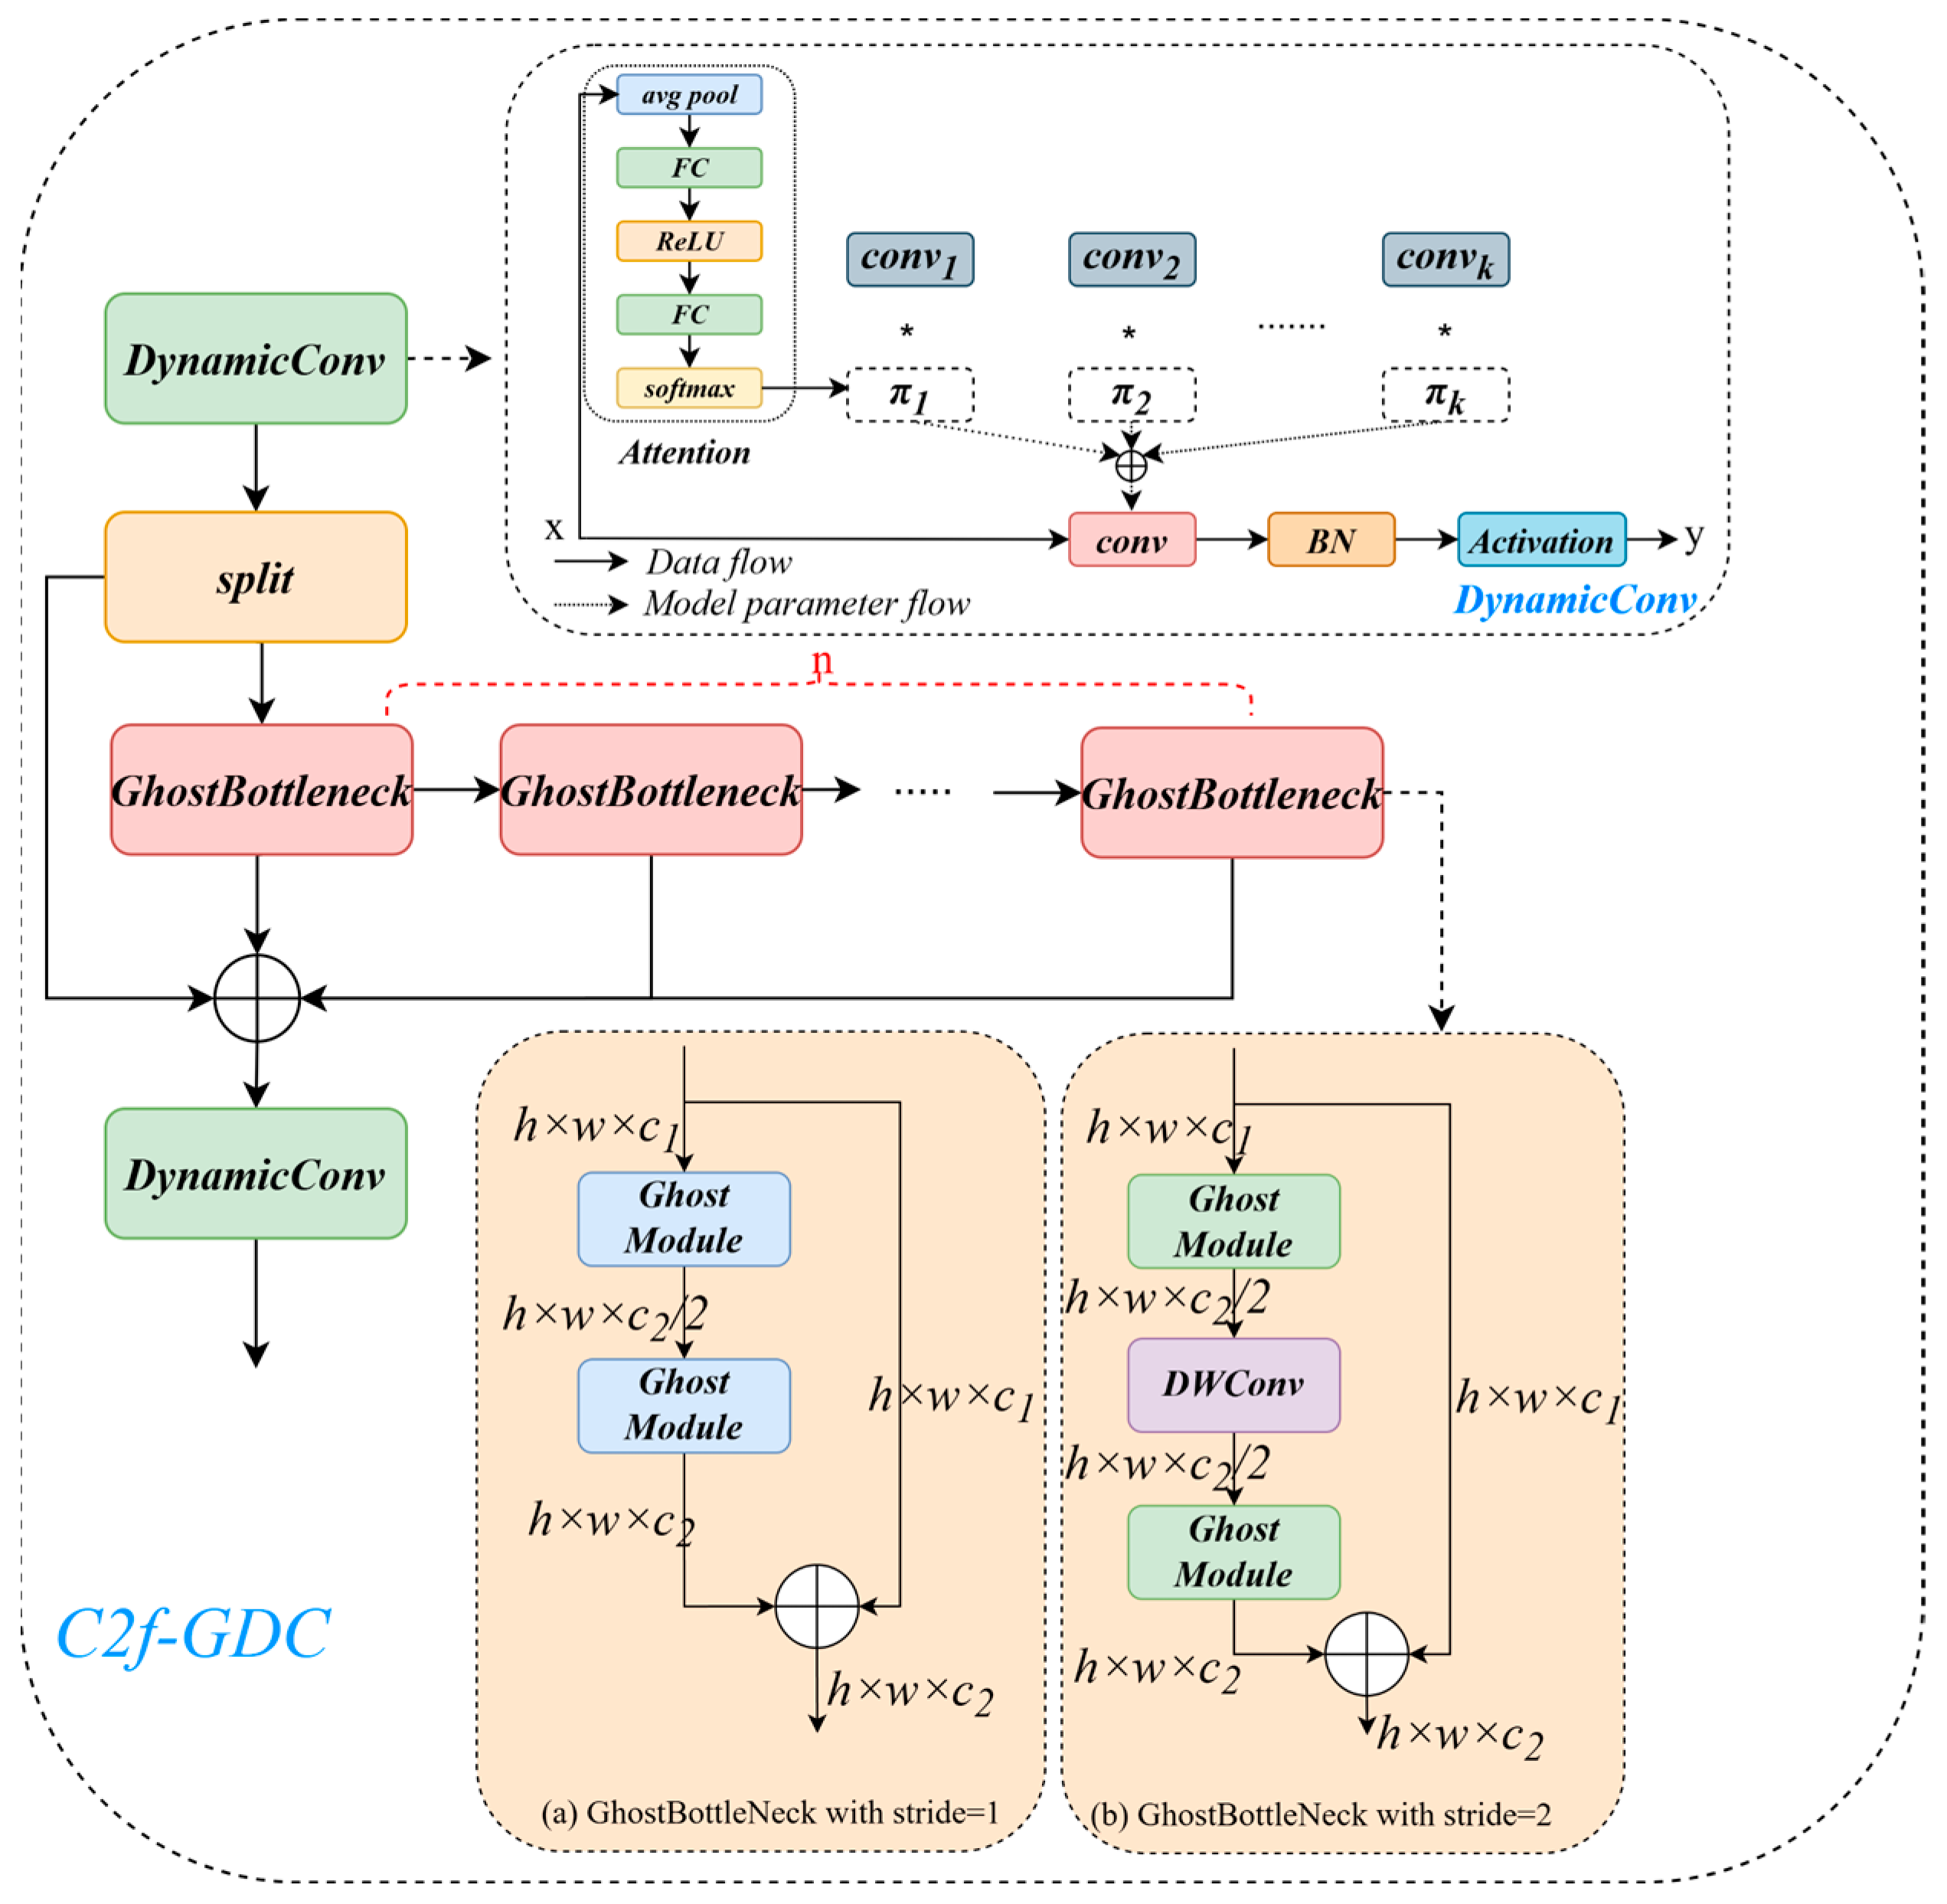
3.3.4. Analysis of the Effect of Introducing GhostConv, C2f-GDC Module, and Lightweight Detector Heads

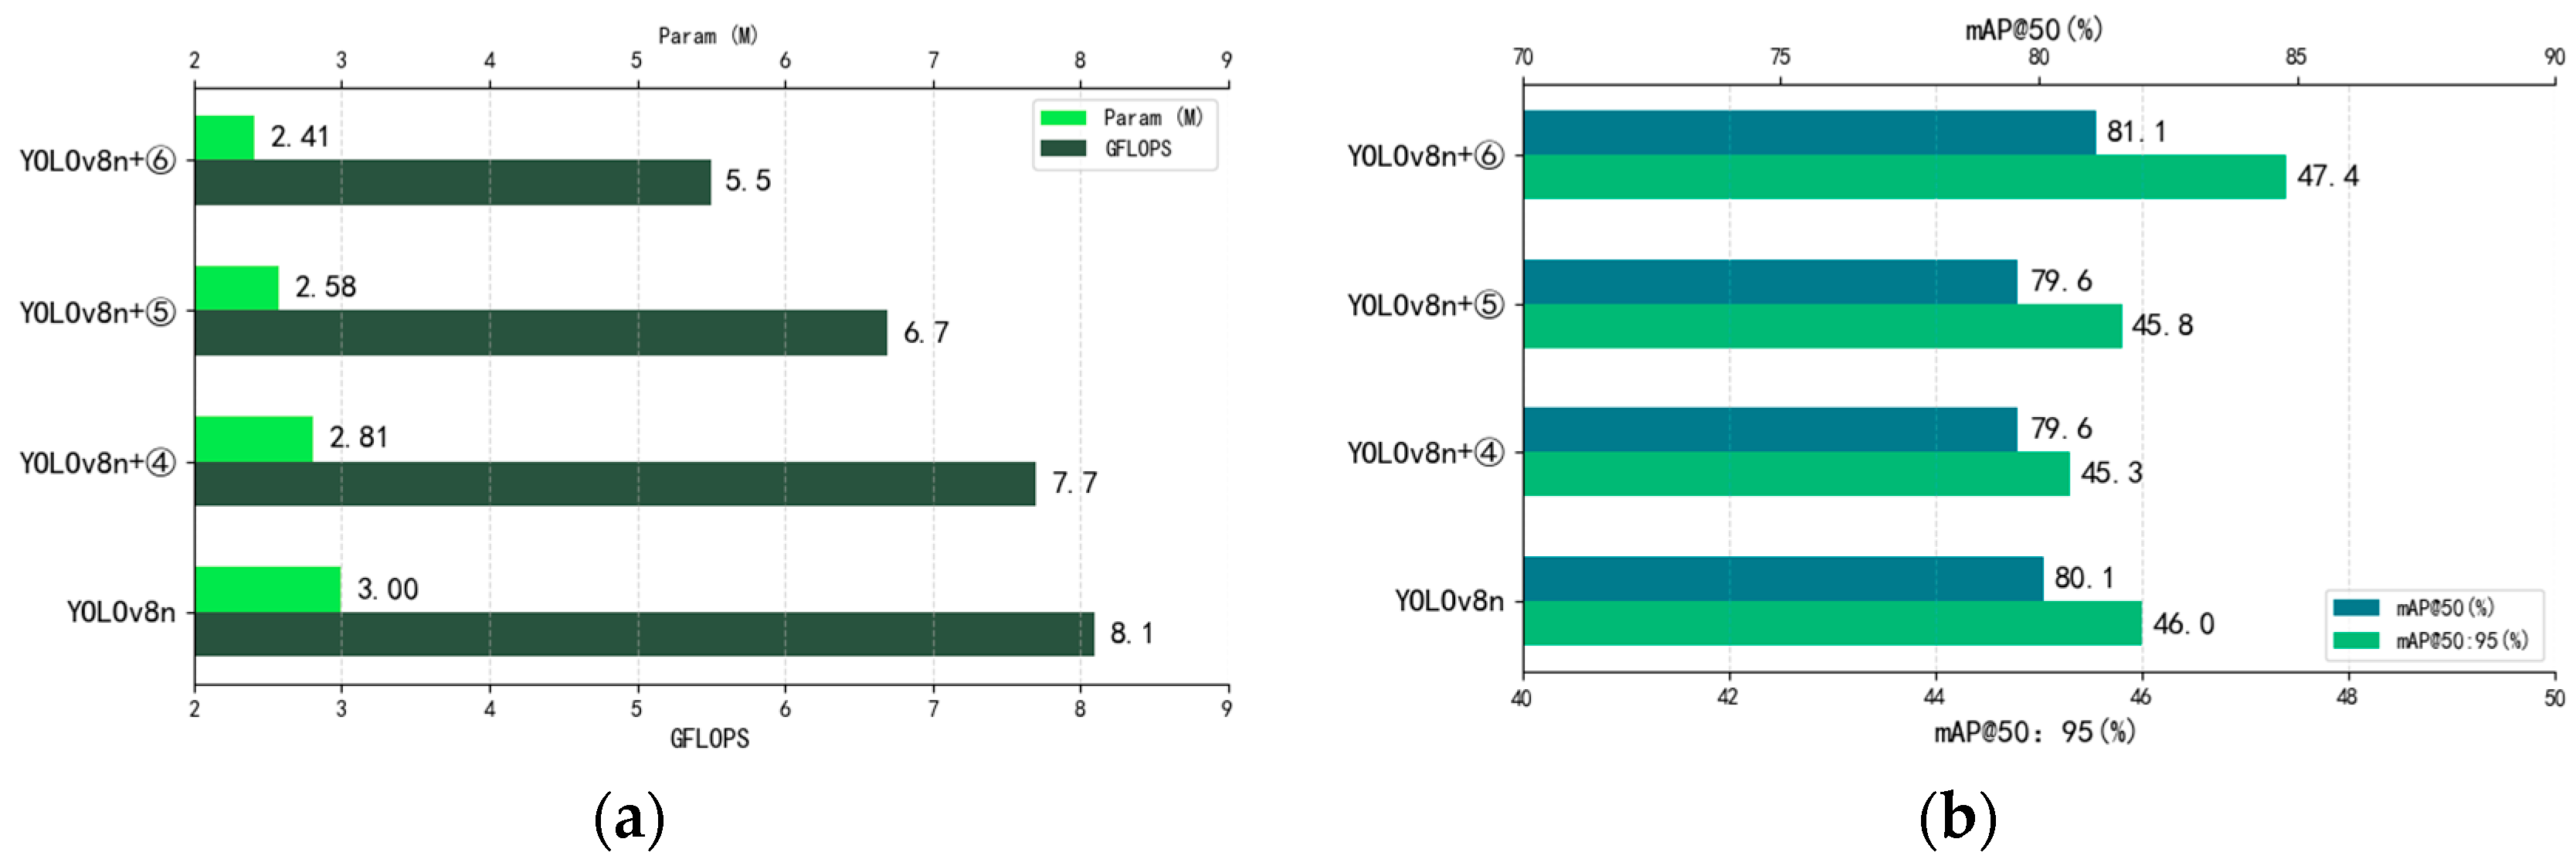
Figure 13a shows the comparison between the number of model parameters and computation amount and the original model after the introduction of GhostConv, C2f-GDC, and Detect-Efficient, and Figure 13b shows the comparison between the model detection accuracy and the original model after the introduction of GhostConv, C2f-GDC, and Detect-Efficient. It can be seen that all the above methods can reduce the overall computation and number of parameters of the model to different degrees. Meanwhile, GhostConv and C2f-GDC reduce the computation while keeping the mAP@50 down by only 0.5%, whereas Detect-Efficient significantly reduces the computation and number of parameters while increasing the mAP@50 by 1.0%, which proves that Detect-Efficient detection head is more suitable for bait residue detection tasks.

3.4. Comparison of Different Attention Mechanisms

In order to verify the efficiency of the CPCA attention mechanism in the bait detection task, this paper compares the common attention mechanisms: MLCA, DA, CAFM, and MPCA. Table 4 shows a comparison of the experimental results of different attention mechanisms.
Among the evaluated attention mechanisms, the integration of MLCA and DA resulted in a decrease in mAP@50, indicating that these mechanisms are not well-suited for bait detection tasks. In contrast, the incorporation of CAFM and MPCA led to modest improvements in mAP@50, with increases of only 0.3% and 0.7%, respectively. Notably, the CPCA attention mechanism demonstrated a more substantial enhancement, achieving a 1.7% increase in mAP@50. Based on these experimental results, this study adopts the CPCA attention mechanism within the backbone network of YOLOv8n to improve the detection performance for bait targets.

3.5. Comparison of Different Loss Functions

To investigate the impact of different loss functions on the performance of the YOLOv8-BaitScan model and to identify the most suitable loss function, the original CIoU loss was individually replaced with GIoU, SIoU, DIoU, and MPDIoU. The performance differences in bait target detection were then systematically evaluated. The experimental results are summarized in Table 5.
As presented in Table 5, the MPDIoU loss function demonstrates notable advantages. Compared to the original CIoU loss function, MPDIoU yields a 6.3% increase in recall and a 1.6% improvement in mAP@50. In contrast, the use of GIoU not only fails to enhance detection performance but also results in a 0.2% decrease in mAP@50. Although SIoU contributes a 0.5% increase in mAP@50, its impact remains relatively limited when compared to MPDIoU. DIoU achieves a 1.1% improvement in mAP@50; however, its performance gain is still inferior to that of MPDIoU.

3.6. Comparison of Different Models

To highlight the advantages of the proposed YOLOv8-BaitScan model, we conducted a comparative evaluation against Faster R-CNN, YOLOv7-tiny, YOLOv8n, and YOLOv10n. The experimental results are summarized in Table 6.
As shown in Table 6, YOLOv8-BaitScan achieves a mAP@50 of 97.1%, significantly outperforming the other detection models. Furthermore, it requires the least computational resources, with only 1.33 million parameters and a computational cost of 3.7 GFLOPS. Although YOLOv10n is also a lightweight model, its detection accuracy is substantially lower, reaching only 71.7% mAP@50. In terms of the F1-score, YOLOv8-BaitScan attains an outstanding 93.0%, which is 15%, 21%, 18%, and 20% higher than Faster R-CNN, YOLOv7-tiny, YOLOv8n, and YOLOv10n, respectively.

3.7. Visualization

To further validate the superiority of the YOLOv8-BaitScan model, we conducted a visual comparison of the detection results against ground truth annotations, aiming to comprehensively highlight the improvements introduced by the proposed algorithm.
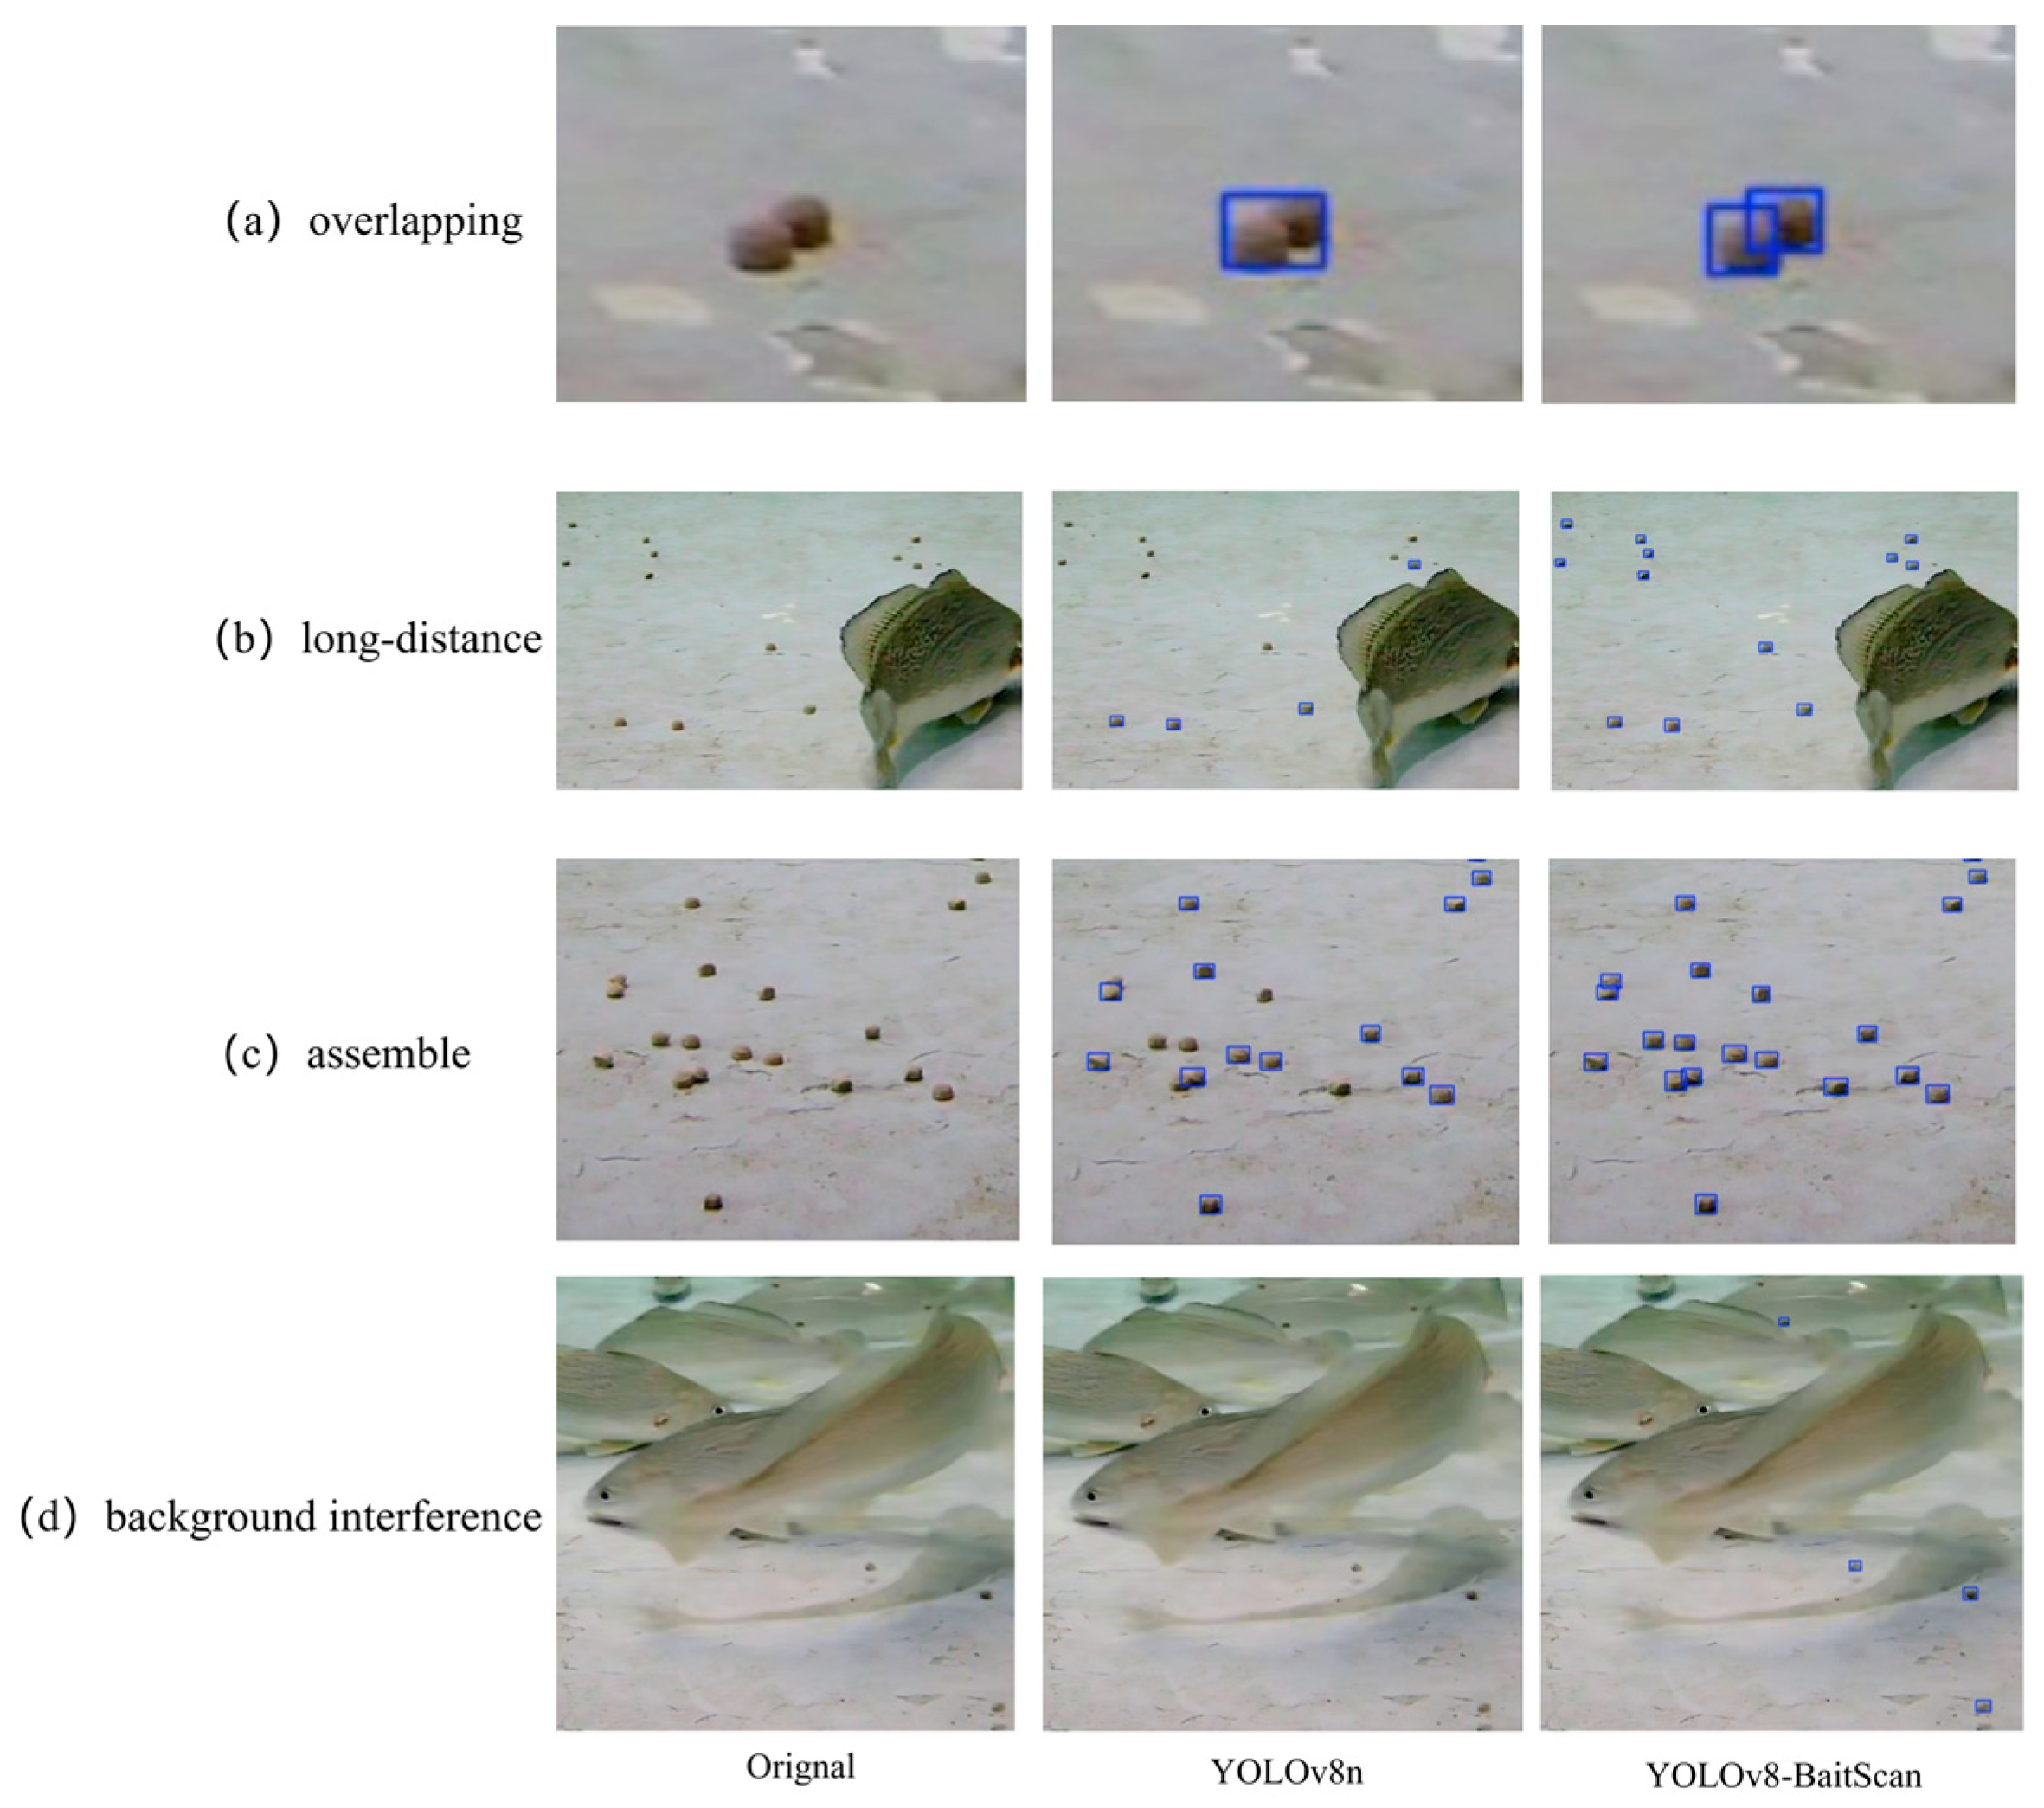
Figure 14 shows the detection performance of YOLOv8-BaitScan in different difficult recognition scenarios. (a) shows the detection results in the case of overlapping baits. The results show that YOLOv8-BaitScan can better identify overlapping baits, and (b) shows the detection results of long-distance bait. The optimized model greatly reduces the probability of missed detection of long-distance bait, and (c) shows the detection results under a large number of bait aggregation scenes. The results show that the optimized model has a better recognition effect for bait in aggregation scenes, and (d) shows the detection results in the case of background interference. The results show that YOLOv8-BaitScan can better complete the bait detection task in the case of background interference caused by fish swimming. The enhanced YOLOv8-BaitScan exhibits a marked improvement in prediction performance compared to the original YOLOv8n. It notably enhances the recall of long-range bait targets and achieves greater accuracy in bounding box localization. These advantages are particularly evident in challenging scenarios involving dense clustering, overlapping targets, and complex background interference. The results confirm the effectiveness and robustness of the proposed method.
Bait overlap, small targets at long-range bait, and background noise interference are great challenges in the bait residue counting task. Figure 15 shows the heat map of the YOLOv8n algorithm and the YOLOv8-BaitScan proposed in this paper in the bait prediction results in different cases, which can more intuitively show the degree of attention of the algorithm to different regions in the picture before and after the improvement. Compared with the original YOLOv8n model, YOLOv8-BaitScan reduces the probability of bait target miss detection by applying more attention weights to the long-distance small-target bait and adding a new tiny-target detection layer, which makes the model more sensitive to the long-distance small-target bait, and thus reduces the probability of bait target miss detection to a great extent. In addition, the use of the MPDIoU loss function enhances the localization precision of the predicted bounding boxes, particularly in cases involving dense aggregation and overlap. These improvements collectively contribute to the superior performance and robustness of YOLOv8-BaitScan in practical bait residue counting tasks.

4. Discussion

This study proposed YOLOv8-BaitScan to optimize the structure of the YOLOv8 network for bait detection tasks, aiming to achieve accurate and efficient detection of the number of bait in intensive aquaculture ponds and provide technical support for precision breeding. This model introduces the CPCA attention mechanism in the backbone part of the network, replaces the MPDIoU loss function, and optimizes the configuration of the detection layer. Finally, the computational load required by the model is reduced by the lightweight structure. Experimental results show that YOLOv8-BaitScan performs well in actual intensive aquaculture scenarios, and all indicators are significantly improved compared with the original benchmark model.
However, although the proposed YOLOv8-BaitScan performs well in the bait detection task, there are still some limitations of this model that need to be further solved to obtain better adaptability. Firstly, the required computational load will be limited on marginal computing power devices. Based on the current findings, there are several avenues for improving YOLOv8-BaitScan. One key area for future work is addressing the model’s computational load on resource-constrained devices. While the lightweight structure of YOLOv8-BaitScan offers some reduction in computational demands, further optimization techniques, such as pruning or quantization, could be explored to enable the model to run more efficiently on edge devices with limited computational power. Additionally, exploring hardware acceleration methods, such as the use of GPUs or specialized AI chips, may enhance real-time performance in practical deployment scenarios. Secondly, the baits fed in the process of intensive culture are diverse, so the performance of the model on different types of baits has not been further tested and verified, and the data set needs to be further expanded. Furthermore, the incorporation of domain-specific knowledge related to bait behavior and interaction with the surrounding environment could enhance the model’s performance. For instance, integrating temporal information, such as bait movement patterns or feeding frequency, could provide a more dynamic and accurate detection system. The combination of visual and temporal data might lead to more reliable predictions, especially in dynamic aquaculture settings. In addition, how to make the model automatically recognize other background interference such as algae as background is our further work. The interference such as algae was used as the background to make the model ignore its characteristics so as to realize the anti-interference of the model to the complex background.
In summary, while YOLOv8-BaitScan demonstrates promising results in bait detection for intensive aquaculture, there is still room for improvement in terms of computational efficiency, bait diversity handling, and model adaptability to real-world conditions. Future research should focus on these aspects to further enhance the model’s practical utility in precision aquaculture.

5. Conclusions

In this study, we introduce YOLOv8-BaitScan, an enhanced method for bait residue counting based on an improved version of YOLOv8n. This method addresses the challenges of detecting bait residues in complex aquaculture environments, where issues such as bait aggregation, target occlusion, long-distance detection of small targets, and background interference are common.
To assess the performance of the proposed algorithm, we conducted a series of ablation experiments. The results demonstrate that YOLOv8-BaitScan outperforms the YOLOv8n algorithm in several key metrics. Specifically, mAP@50 increased from 80.1% to 97.1%, and the F1-score improved from 75% to 93.0%. Additionally, to meet the real-time requirements of practical applications, YOLOv8-BaitScan is designed to be lightweight, reducing the model size to 1.33M parameters (a 55.7% reduction) and the computational complexity to 3.7 GFLOPS (a 54.3% reduction). These optimizations lead to significant improvements in the model’s efficiency and inference speed.
In conclusion, YOLOv8-BaitScan achieves a balance between high detection accuracy and computational efficiency, making it a promising solution for bait residue counting in aquaculture. It offers strong technical support for the development of scientific and effective feeding strategies, with potential applications in real-time monitoring systems for aquaculture.

Author Contributions

Conceptualization, T.W. and J.L.; methodology, J.L., Z.Z., and Y.W.; software, Z.Z.; validation, J.L.; formal analysis, Y.W.; investigation, Z.Z.; resources, J.L. and T.W.; data curation, J.L.; writing—original draft preparation, J.L. and Z.Z.; writing—review and editing, T.W.; supervision, T.W.; project administration, J.L.; funding acquisition, J.L. All authors have read and agreed to the published version of the manuscript.

Funding

This research was funded by Biological and Medical Sciences of Applied Summit Nurturing Disciplines in Anhui Province (Anhui Education Secretary Department [2023]13), the Key projects of natural science research projects in Anhui universities (Grant Number: 2022AH051345 and 2024AH050462), the Scientific research project of Fuyang Normal University (Project Number: 2023KYQD0013), the School-level Undergraduate Teaching Project of Fuyang Normal University (Project Number: 2024YLKC0018; 2024KCSZSF07), and the Technical Service Contract Between Shenzhen Mairuide Technology Co., Ltd. and Fuyang Normal University (Project Code: HX2023021000).

Institutional Review Board Statement

This study was conducted on picture data only, and no experiments were conducted directly on animals.

Informed Consent Statement

Not applicable.

Data Availability Statement

The code can be requested at the following link: https://github.com/ABCDZzz22/YOLOv8-BaitScan (accessed on 3 June 2025). The data are from public datasets, which are introduced in Section 2.1.

Acknowledgments

The authors thank all the editors and reviewers for their suggestions and comments. The authors are grateful for the datasets shared by National Innovation Center for Digital Fishery.

Conflicts of Interest

The authors declare no conflicts of interest.

References

  1. Asche, F.; Guttormsen, A.G.; Tveterås, R. Environmental problems, productivity and innovations in Norwegian salmon aquaculture. Aquac. Econ. Manag. 1999, 3, 19–29. [Google Scholar] [CrossRef]
  2. Hishamunda, N.; Ridler, N.B.; Bueno, P.; Yap, W.G. Commercial aquaculture in Southeast Asia: Some policy lessons. Food Policy 2009, 34, 102–107. [Google Scholar] [CrossRef]
  3. Chen, L.; Yang, X.T.; Sun, C.H.; Wang, Y.Z.; Xu, D.M.; Zhou, C. Feed intake prediction model for group fish using the MEA-BP neural network in intensive. Inf. Process. Agric. 2020, 7, 261–271. [Google Scholar] [CrossRef]
  4. Llorens, S.; Pérez-Arjona, I.; Soliveres, E.; Espinosa, V. Detection and target strength measurements of uneaten feed pellets with a single beam echosounder. Aquacult. Eng. 2017, 78, 216–220. [Google Scholar] [CrossRef]
  5. Simmonds, J.; MacLennan, D.N. Fisheries Acoustics: Theory and Practice; John Wiley & Sons: Hoboken, NJ, USA, 2008. [Google Scholar]
  6. Terayama, K.; Shin, K.; Mizuno, K.; Tsuda, K. Integration of sonar and optical camera images using deep neural network for fish monitoring. Aquacult. Eng. 2019, 86, 102000. [Google Scholar] [CrossRef]
  7. Foster, M.; Petrell, R.; Ito, M.R.; Ward, R. Detection and counting of uneaten feed pellets in a sea cage using image analysis. Aquac. Eng. 1995, 14, 251–269. [Google Scholar] [CrossRef]
  8. Parsonage, K.D.; Petrell, R.J. Accuracy of a machine-vision pellet detection system. Aquac. Eng. 2003, 29, 109–123. [Google Scholar] [CrossRef]
  9. Atoum, Y.; Srivastava, S.; Liu, X. Automatic Feeding Control for Dense Aquaculture Fish Tanks. IEEE Signal Process. Lett. 2015, 22, 1089–1093. [Google Scholar] [CrossRef]
  10. Li, D.W.; Xu, L.H.; Liu, H.Y. Detection of uneaten fish food pellets in underwater images for aquaculture. Aquacult. Eng. 2017, 78, 85–94. [Google Scholar] [CrossRef]
  11. LeCun, Y.; Bengio, Y.; Hinton, G. Deep learning. Nature 2015, 521, 436–444. [Google Scholar] [CrossRef]
  12. Yang, X.; Zhang, S.; Liu, J.; Gao, Q.; Dong, S.; Zhou, C. Deep learning for smart fish farming: Applications, opportunities and challenges. Rev. Aquac. 2021, 13, 66–90. [Google Scholar] [CrossRef]
  13. Rauf, H.T.; Lali, M.I.U.; Zahoor, S.; Shah, S.Z.H.; Rehman, A.U.; Bukhari, S.A.C. Visual features based automated identification of fish species using deep convolutional neural networks. Comput. Electron. Agric. 2019, 167, 105075. [Google Scholar] [CrossRef]
  14. Fernandes, A.F.A.; Turra, E.M.; de Alvarenga, É.R.; Passafaro, T.L.; Lopes, F.B.; Alves, G.F.O.; Singh, V.; Rosa, G.J.M. Deep Learning image segmentation for extraction of fish body measurements and prediction of body weight and carcass traits in Nile tilapia. Comput. Electron. Agric. 2020, 170, 105274. [Google Scholar] [CrossRef]
  15. Labao, A.B.; Naval, P.C. Cascaded deep network systems with linked ensemble components for underwater fish detection in the wild. Ecol. Inform. 2019, 52, 103–121. [Google Scholar] [CrossRef]
  16. Zhao, J.; Bao, W.; Zhang, F.; Zhu, S.; Liu, Y.; Lu, H.; Shen, M.; Ye, Z. Modified motion influence map and recurrent neural network-based monitoring of the local unusual behaviors for fish school in intensive aquaculture. Aquaculture 2018, 493, 165–175. [Google Scholar] [CrossRef]
  17. Xu, X.; Li, W.; Duan, Q. Transfer learning and SE-ResNet152 networks-based for small-scale unbalanced fish species identification. Comput. Electron. Agric. 2021, 180, 105878. [Google Scholar] [CrossRef]
  18. Zou, Z.X.; Shi, Z.W.; Guo, Y.H.; Ye, J.P. Object Detection in 20 Years: A Survey. arXiv 2019, arXiv:1905.05055. [Google Scholar] [CrossRef]
  19. Cai, K.; Miao, X.; Wang, W.; Pang, H.; Liu, Y.; Song, J. A modified YOLOv3 model for fish detection based on MobileNetv1 as backbone. Aquac. Eng. 2020, 91, 102117. [Google Scholar] [CrossRef]
  20. Hu, X.; Liu, Y.; Zhao, Z.; Liu, J.; Yang, X.; Sun, C.; Chen, S.; Li, B.; Zhou, C. Real-time detection of uneaten feed pellets in underwater images for aquaculture using an improved YOLO-V4 network. Comput. Electron. Agric. 2021, 185, 106135. [Google Scholar] [CrossRef]
  21. Chen, J.; Er, M.J. Dynamic YOLO for small underwater object detection. Artif. Intell. Rev. 2024, 57, 165. [Google Scholar] [CrossRef]
  22. Ge, L.; Singh, P.; Sadhu, A. Advanced deep learning framework for underwater object detection with multibeam forward-looking sonar. Struct. Health Monit. 2024, 14759217241235637. [Google Scholar] [CrossRef]
  23. Wang, Y.; Yu, X.; Liu, J.; Zhao, R.; Zhang, L.; An, D.; Wei, Y. Research on quantitative method of fish feeding activity with semi-supervised based on appearance-motion representation. Biosyst. Eng. 2023, 230, 409–423. [Google Scholar] [CrossRef]
  24. Acker, T.; Burczynski, J.; Hedgepeth, J.; Ebrahim, A. Digital Scanning Sonar for Fish Feeding Monitoring in Aquaculture. In Proceedings of the Sixth European Conference on Underwater Acoustics ECUA 2002, Gdansk, Poland, 24–27 June 2002. [Google Scholar]
  25. Xu, C.; Wang, Z.; Du, R.; Li, Y.; Li, D.; Chen, Y.; Li, W.; Liu, C. A method for detecting uneaten feed based on improved YOLOv5. Comput. Electron. Agric. 2023, 212, 108101. [Google Scholar] [CrossRef]
  26. Huang, H.; Chen, Z.; Zou, Y.; Lu, M.; Chen, C.; Song, Y.; Zhang, H.; Yan, F. Channel prior convolutional attention for medical image segmentation. Comput. Biol. Med. 2024, 178, 108784. [Google Scholar] [CrossRef]
  27. Girshick, R.; Donahue, J.; Darrell, T.; Malik, J. Rich feature hierarchies for accurate object detection and semantic segmentation. In Proceedings of the IEEE Conference on Computer Vision and Pattern Recognition, Columbus, OH, USA, 23–28 June 2014; pp. 580–587. [Google Scholar]
  28. Ma, S.; Xu, Y. Mpdiou: A loss for efficient and accurate bounding box regression. arXiv 2023, arXiv:2307.07662. [Google Scholar]
  29. Kang, M.; Ting, C.M.; Ting, F.F.; Phan, R.C.W. ASF-YOLO: A novel YOLO model with attentional scale sequence fusion for cell instance segmentation. Image Vis. Comput. 2024, 147, 105057. [Google Scholar] [CrossRef]
  30. Han, K.; Wang, Y.; Tian, Q.; Guo, J.; Xu, C.; Xu, C. Ghostnet: More features from cheap operations. In Proceedings of the IEEE/CVF Conference on Computer Vision and Pattern Recognition, Seattle, WA, USA, 13–19 June 2020; pp. 1580–1589. [Google Scholar]
  31. Han, K.; Wang, Y.; Guo, J.; Wu, E. ParameterNet: Parameters Are All You Need for Large-scale Visual Pretraining of Mobile Networks. In Proceedings of the IEEE/CVF Conference on Computer Vision and Pattern Recognition, Seattle, WA, USA, 17–21 June 2024; pp. 15751–15761. [Google Scholar]
  32. Chen, J.; Kao, S.H.; He, H.; Zhuo, W.; Wen, S.; Lee, C.H.; Chan, S.H.G. Run, don’t walk: Chasing higher FLOPS for faster neural networks. In Proceedings of the IEEE/CVF Conference on Computer Vision and Pattern Recognition, Vancouver, BC, Canada, 18–22 June 2023; pp. 12021–12031. [Google Scholar]
Figure 1. Data augmentation examples on pepper images: (a) original image, (b) random flipping, (c) cropping, and (d) other augmentation techniques.
Fishes 10 00294 g001
Figure 2. Structures comparison of YOLOv8 and YOLOv8-BaitScan structures.
Fishes 10 00294 g002
Figure 3. The structure of CPCA attention mechanism.
Fishes 10 00294 g003
Figure 4. MPDIoU related parameters.
Fishes 10 00294 g004
Figure 5. Structure of multi-scale sequence feature fusion module.
Fishes 10 00294 g005
Figure 6. GhostConv module structure.
Fishes 10 00294 g006
Figure 7. Structure of C2f-GDC.
Fishes 10 00294 g007
Figure 8. Comparison between Detect-Efficient and traditional Detect structure.
Fishes 10 00294 g008
Figure 9. PConv structure.
Fishes 10 00294 g009
Figure 10. The effect comparison of CPCA is introduced.
Fishes 10 00294 g010
Figure 11. (a) mAP@50 comparison and (b) mAP@50:95 comparison.
Fishes 10 00294 g011
Figure 12. The results of comparison after optimizing the Neck structure.
Fishes 10 00294 g012
Figure 13. (a) Comparison of computational load before and after improvement. (b) Comparison of detection accuracy before and after improvement.
Fishes 10 00294 g013
Figure 14. Visual comparison of bait detection results between ground truth, the baseline model, and YOLOv8-BaitScan under different scenarios: (a) overlapping, (b) long-distance, (c) assemble, and (d) background interference.
Fishes 10 00294 g014
Figure 15. Heat maps comparison of bait detection results.
Fishes 10 00294 g015
Table 1. Parameters of the experimental platform.
ConfigurationParameter
CPUIntel(R)Core(TM)i9-14900K
GPUNVIDIA GeForce RTX4090 24G
Operating SystemWin11
FrameworksPytorch 2.2.0
LanguagePython 3.10
CUDA12.1
Table 2. Hyperparameter settings.
Parameter NameSet-Up
Image size640 × 640
Batch size16
Learning rate0.01
OptimizerSGD
Momentum factor0.937
Epochs300
Table 3. The comparative results of ablation experiments.
ModelP(%)R(%)mAP@50
(%)
mAP@50:95
(%)
F1(%)Param
(M)
GFLOPS
YOLOv8n94.460.880.146.075.03.008.1
YOLOv8n+①88.569.481.846.476.03.138.3
YOLOv8n+②91.567.181.747.277.03.008.1
YOLOv8n+③94.993.797.659.494.02.3211.8
YOLOv8n+④93.062.379.645.375.02.817.7
YOLOv8n+⑤93.361.779.645.875.02.586.7
YOLOv8n+⑥93.163.881.147.476.02.415.5
YOLOv8-BaitScan93.094.497.156.693.01.333.7
①: CPCA Attention Module, ②: MPDIOU loss, ③: Neck improved and replaced detection layer, ④: GhostConv module, ⑤: C2f-GDC, and ⑥: Detect-Efficient.
Table 4. The comparative experimental results of different attention mechanisms.
ModelP(%)R(%)mAP@50(%)
YOLOv8n94.460.880.1
YOLOv8n-MLCA92.562.079.5
YOLOv8n-DA93.562.880.0
YOLOv8n-CAFM93.163.180.4
YOLOv8n-MPCA94.062.380.8
YOLOv8n-CPCA88.569.481.8
Table 5. The comparative experimental results of different loss functions.
ModelP(%)R(%)mAP@50(%)
CIOU94.460.880.1
GIoU93.961.179.9
SIoU94.162.280.6
DIOU94.463.281.2
MPDIoU91.567.181.7
Table 6. The comparative experimental results of different models.
ModelP(%)R(%)mAP@50
(%)
mAP@50:95
(%)
F1(%)Param(M)GFLOPS
Faster R-CNN83.976.883.843.778.041.3251.4
YOLOv7-tiny79.166.672.828.072.06.0013.0
YOLOv8n94.460.880.146.075.03.008.1
YOLOv10n89.162.171.738.273.02.266.5
YOLOv8-BaitScan93.094.497.156.693.01.333.7
Disclaimer/Publisher’s Note: The statements, opinions and data contained in all publications are solely those of the individual author(s) and contributor(s) and not of MDPI and/or the editor(s). MDPI and/or the editor(s) disclaim responsibility for any injury to people or property resulting from any ideas, methods, instructions or products referred to in the content.

