Article

Effects of Social Enrichment Induced by Different-Sized Groups and Live Bait on Growth, Aggressive Behavior, Physiology, and Neurogenesis in Juvenile Sebastes schlegelii

by
Zhen Zhang
1,2,
Xiaoming Yu
1,2,3,
Zhongxin Wu
1,2,3 and
Tao Tian
1,2,3,*
1
Center for Marine Ranching Engineering Science Research of Liaoning, Dalian Ocean University, Dalian 116023, China
2
College of Fisheries and Life Science, Dalian Ocean University, Dalian 116023, China
3
Industry Institute of Marine Ranching, Dalian Ocean University, Dalian 116023, China
*
Author to whom correspondence should be addressed.
Fishes 2025, 10(5), 242; https://doi.org/10.3390/fishes10050242
Submission received: 10 March 2025 / Revised: 16 May 2025 / Accepted: 20 May 2025 / Published: 21 May 2025

Abstract

This study examined the effects of stress and social enrichment on fish neuroplasticity and antioxidant capacity, addressing growing concerns about fish welfare in aquaculture. A 2 × 2 × 2 factorial design comprising eight treatment groups was implemented to investigate how bait type, group size (two distinct sizes tested), and stress level affected the expression of neurogenesis-related genes (PCNA, DCX, and NeuroD) and antioxidant parameters (MDA levels, CAT, GSH-Px, and SOD activity) in the fish. The findings demonstrated that social enrichment significantly reduced aggressive behavior and basal cortisol levels and enhanced the expression of neurogenesis-related gene. However, the optimal group-size augmentation (between the two group sizes tested) considerably increased the activity of antioxidant enzymes and decreased MDA levels. Acute stress further upregulated cortisol levels and the expression of genes related to neurogenesis. A scientific foundation for enhancing fish welfare in aquaculture is provided by the study’s confirmation that social enrichment reduces stress and fosters neuroplasticity.
Key Contribution: Using a 2 × 2 × 2 factorial design, we examined how stress and social enrichment affected fish neuroplasticity and antioxidant capacity. We discovered that social enrichment significantly decreased aggressive behavior and basal cortisol levels, while also promoting the expression of genes linked to neurogenesis and increasing the activity of antioxidant enzymes. The results provide a scientific foundation for enhancing fish welfare in aquaculture.

1. Introduction

Aquaculture’s explosive growth has made it a crucial link in the world’s food supply chain. According to a report by the Food and Agriculture Organization of the United Nations (FAO), aquaculture has emerged as a major source of food and today accounts for more than half of the world’s seafood supply, particularly in poor nations [1]. Public and scientific attention to fish welfare has increased alongside rapid aquaculture expansion [2,3]. With respect to the animals’ biological needs, there are three primary facets of animal welfare: functional, natural, and sensory [4]. Environmental enrichment (EE) techniques can be used to improve the quality of life of fish on farms by allowing them to experience positive aspects of their surroundings, such as new environmental stimuli (motor or sensory stimuli) that help captive fish meet their physiological, behavioral, and psychological needs [5,6]. Good welfare conditions also contribute to improved product quality and potential profitability. In aquaculture, aggressive behavior and growth performance are considered the two most significant markers of fish welfare [2,7].
While the majority of enrichment research to date has focused on physical enrichment [5,8,9], few studies have explored other forms, particularly social enrichment. An environment in which the fish can connect with or avoid other fish, whether of the same or different species, is also considered to constitute social enrichment, as are interactions with individuals [5]. One of the primary factors affecting fish well-being in intensive monospecies aquaculture is group size, and manipulation of group size is the most widely used technique to enhance fish well-being in that setting. Numerous studies have demonstrated that the stress response, growth rate, health, and condition of fish raised in intensive farming conditions are directly impacted by varying stocking levels. Lowering group size may enhance growth rates, reduce injuries, improve the stress response and size uniformity, and optimize space utilization [10,11]. Both low and high group sizes negatively impact the welfare of Atlantic salmon, whereas moderate group sizes result in the best overall welfare. The effects of group size are complicated and seem to be the result of numerous interrelated individual factors [12]. Each farmed species’ behavioral and physiological requirements, as well as its life stage, feeding method, food availability, and social connections, as well as other environmental factors (such as fluctuations and changes in water quality), all have a significant impact on appropriate group sizes [3,10,11,13,14]. In addition, keeping more than one species in the same environment has associated welfare implications. For example, cleaner fish, such as roundheads and a wide variety of wrasse, are kept in net pens with adult salmonids to feed on salmonid lice copepods to minimize their parasitic load [15], and more recently, it has been found that rearing juvenile fish (Sander lucioperca) in the recirculatory system (RAS) with other species (e.g., Acipenser ruthenus or Tinca tinca) =had a positive effect on growth parameters and behavioral changes [16]. Another example of social enrichment is mixed-species culture in Asian and African ponds; additionally, a variety of fish species, such as European eel (Anguilla anguilla), gray mullet (Liza spp.), and flounder (Solea spp.), which already coexist under natural conditions, can be co-housed in extensive and semi-intensive earthen ponds in the estuarine areas of Southern Europe [17,18]. The introduction of the fat greenling (Hexagrammos otakii) into black rockfish (Sebastes schlegelii) ponds has been shown to reduce intraspecific aggression in fish [19]; however, dominance hierarchies resulting from social interactions, particularly those associated with spatial utilization and competition for food, compromised the welfare of black rockfish, and competition for food resources was found to exacerbate intraspecific aggression [11,20], particularly when resources were scarce. Furthermore, territorial fishes typically focus their aggression on defending their territories rather than merely competing for food, so the study of aggression at different times under different social-enrichment treatments will be a new direction for research [21].
The preservation of health and the avoidance of chronic stress are very important aspects of fish welfare [3]. Aquaculture invariably exposes fish to a number of potential stressors, including noise, sorting, transportation, intraspecific aggression, and abnormal culture densities. Furthermore, fish that are released into the wild as a result of stock augmentation and stocking operations encounter erratic and diverse conditions (such as temperature fluctuations and predator stress) following their release [2]. Fish welfare may be negatively impacted by these acute and chronic stresses because they may result in decreased disease resistance, increased stress, and inhibited neuroplasticity [2,22,23]. It is unclear whether social enrichment can modulate stress-induced stimulatory/inhibitory effects, but environmental enrichment can decrease aggressive and anxiety-like behavior in fish [24,25], increase behavioral flexibility [26,27], improve spatial learning and memory [27,28,29], and enhance brain-cell proliferation and differentiation [27,30].
The shores of China, Korea, and Japan are home to a large population of black rockfish (S. schlegelii) [31]. Overfishing and habitat degradation have been the primary causes of the sharp reduction in wild black rockfish populations in recent years [32]. Since 2007, a number of population improvement initiatives have been put in place in the Bohai and Yellow Seas to stop the black rockfish populations from falling [33]. Released fry should be raised in hatcheries until they reach the juvenile stage in order to increase their survival rate [32]. However, severe aggressive behavior, physical damage, and subsequent growth inhibition are frequently observed during rearing [34,35]. Therefore, the question of how to effectively reduce aggression and enhance growth is an important issue to address from a fish-welfare perspective. Environmental enrichment (EE), as an important strategy for improving the welfare of captive fish, aims to meet their behavioral, physiological, morphological, and psychological needs by providing novel sensory and physical stimuli while effectively reducing the frequency of abnormal behaviors and stress responses [5]. Significant progress has been made in the study of environmental enrichment in S. schlegelii, with numerous studies exploring various environmental factors to investigate their effects on fish growth, physiology, and behavior. Exposure to green, blue, and white light significantly promoted growth performance, enhanced lipid deposition, and improved feed-conversion efficiency in juvenile S. schlegelii [36]. Exposure to low-salinity conditions (<23.9 psu) significantly decreased survival, modified oxygen-consumption rates, and induced changes in blood biochemistry in S. schlegelii, with notable reductions in plasma Na+ and Cl levels [37]. The study revealed that a water velocity of 1.5 body lengths per second (BL/s) maximized growth rates, increased protein-utilization efficiency, and enhanced immune responses in S. schlegelii [38]. An assessment of the effects of short-term pH reduction on the behavior and physiological responses of S. schlegelii revealed that a temporary decrease in pH may increase boldness in juvenile black rockfish and elevate energy expenditure, thereby resulting in higher metabolic costs [39]. Through identification of differentially expressed genes (DEGs) potentially underlying the stress-response mechanisms, the molecular responses of juvenile S. schlegelii to air exposure stress were revealed; that study uncovered molecular pathways potentially affected by water-related stress and identified specific molecular features associated with the stress response, such as alterations in peptidase activity and protein digestion [40]. In a study evaluating the effects of group size on juvenile S. schlegelii, it was found that although low and moderate group sizes did not affect stress levels, hematological indices, or growth, group size significantly influenced these variables overall, indicating the presence of allostatic load at higher densities [41]. When fat greenling were introduced into the same environment with S. schlegelii, intraspecific aggression within the S. schlegelii population decreased; however, they were subjected to aggression from fat greenling, and this negatively impacted their welfare [19]. However, research on the use of live bait as a form of social enrichment in aquaculture environments remains limited.
Based on the above background, we questioned whether live bait and different-size groups can be considered as social stimuli to promote the welfare of black rockfish in an aquaculture scenario. This study aimed to investigate whether different social enrichments are effective for black rockfish in modulating growth performance, aggression behavior, levels of cortisol (a stress hormone), and neurogenesis markers used for assessing fish welfare.

2. Materials and Methods

Before conducting this study, we read the policies relating to animal experiments and animal welfare and confirmed that this study complied with them (ARRIVE guidelines; EU Directive 2010/63/EU for animal experiments). All procedures performed in this study were approved by the Institutional Animal Care and Use Committee of the Ocean University of China (identification code 20180101).

2.1. Animals and Experimental Design

Black rockfish (S. schlegelii) juveniles, the test fish, were acquired from a fish farm located in Dalian, Liaoning Province, China. For 14 days, the fish were kept in a temporary culture in a 150 cm by 90 cm cylindrical polyethylene PE tank. Partial water exchange (50% volume/day) was performed after residual feed and feces were siphoned from the tank bottom using a vacuum pump. After 14 days, 96 healthy fish weighing 0.974 ± 0.47 g and measuring 2.45 ± 0.55 cm in length were chosen for the experiments. The fish were randomly allocated into 12 experimental groups comprising six replicates of ten-fish groups and six replicates of six-fish groups, mimicking the natural variances observed in the field [42,43]. After that, these fish were housed in open, rectangular, fiberglass-reinforced plastic (FRP) tanks with a water depth of 40 cm (L × W × H = 0.7 × 0.6 × 0.6 m). Each tank had one air stone (diameter: 43 mm; height: 43 mm; aperture: 8 mm) attached to it via a plastic hose that was linked to an aerator (ACO-007; wattage: 185 W; voltage: 220 V). To create a circulating water system, each tank was further connected to an 80-watt water pump via PVC pipes. The salinity was 25.85 ± 0.77%, and the water temperature was 20.41 ± 0.87 °C. During the trial period, three of the ten-fish groups were fed with pellet feed, and the remaining three groups were fed with live bait; three of the six-fish groups were fed with pellet feed, and the remaining three groups were fed with live bait. The pellet feed group was fed settled pellet bait (Φ2.0 mm) every day at 8:00 and 14:00 during the experimental period until apparent satiation. The live-bait group was fed 30 live Pacific white shrimp (10.1 ± 0.3 mm in TL and 6.8 ± 0.3 mg in BW), and shrimp were replenished (if dead) every three hours to the initial number. Aggressive behavior during feeding was captured on video for 30 min after each feeding, and aggressive conduct during a non-feeding time was captured for 30 min at 5:00 p.m. every day. During the 56-day experiment, feces and residual feed were siphoned twice a day at 9:00 and 15:00. Water was changed twice a week, each time to 50% of the water volume in each set of tanks. At the end of the trial, three fish were randomly selected from each tank for assays of cortisol level, MDA concentration, and levels of CAT, GSH-Px, and SOD activity and gene expression.
A standard stress test was performed on the second day. In this study, we used air exposure as a stressor; this exposure is used frequently in this type of test and does not physically harm the fish [25]. Three fish per tank were randomly selected, air-exposed for 1 min, and transferred to well-circulated recycled fish tanks (40 cm × 30 cm × 30 cm; water level maintained at 20 cm; 6 pebbles (3 cm diameter) and one air stone per tank). Thirty minutes later, the fish were sampled for gene expression and cortisol levels (as a stress marker). This stress duration was chosen because several fish species reach peak stress levels at this time point [25,44,45]. Based on the experimental design described above, a 2 × 2 × 2 factorial design was used with eight treatment groups: (i) basal stress level + live bait + small group (BLS), (ii) basal stress level + live bait + large group (BLT), (iii) basal stress level + pellet + small group (BPS), (iv) basal stress level + pellet + large group (BPT), (v) increased stress + live bait + small group (SLS), (vi) increased stress + live bait + large group (SLT), (vii) increased stress + pellet + small group (SPS), (viii) increased stress + pellet + large group (SPT).

2.2. Behavioral Observations

In this study, we did not measure locomotor activity; instead, we used the previously described methodology to identify aggressive behavior in the fish, as this is the most commonly tested behavioral trait [34]. Previous research has demonstrated that environmental abundance and barrenness have no significant effect on the frequency of locomotor activity in black rockfish [34] and that there are significant differences in aggression under different environmental enrichments [25,34]. During the first, third, and fifth weeks of the raising period, aggressive behavior was captured from above the tank. On Tuesdays, Thursdays, and Saturdays, two 30-min movies were captured every week. The videos showed hostility during feeding from 14:00–14:30 and aggressiveness when idling from 17:00–17:30. High-definition Internet protocol cameras (Hikvision, Hangzhou, China) were used to simultaneously position 12 cameras, one directly above each tank, at each recording time. The cameras were spaced about 0.5 m apart from the tanks. After each recording, the video was sent locally, with the cameras adjusted to have the least negative effect on the fish, and the behavioral data were input into a computer for further analysis. Only the middle 10 min (17:10–17:20) of each film was randomly picked for analysis to eliminate effects of possible disturbance to the fish. Aggressive behavior was evaluated by measuring the frequency of chases, nips, and bites between fish [34].

2.3. Taking Samples

All of the fish that were sampled were euthanized using an overdose of an anesthetic (tricaine methanesulfonate, MS-222, 100 mg/L), and measurements were made of their body length (precision 0.01 cm) and weight (precision 0.01 g). When the fish were too young for blood to be drawn, the entire brain was removed to measure the expression levels of the target genes (i.e., proliferating cell nuclear antigen, doublecortin, and neuronal differentiation factor; PCNA, DCX, and NeuroD, respectively), and the entire visceral mass was removed to measure the levels of cortisol [25,31]. The fish were then promptly dissected. Samples were flash-frozen in liquid nitrogen and stored at −80 °C until analysis. Every sampling procedure was finished within one minute. For the purpose of determining weight and length, the surviving fish in each tank were gently euthanized.

2.4. Cortisol, MDA, CAT, GSH-Px, and SOD Level Measurement

Samples of the visceral mass were homogenized in cold PBS (9× weight, pH 7.4) and centrifuged for 20 min at 3000 rpm in a cryo-centrifuge set at 4 °C. The supernatant was collected for analysis. A commercial ELISA kit (Nanjing Jianjian Bioengineering Institute, Nanjing, China) was used to quantify cortisol, MDA concentration, and levels of CAT, GSH-Px, and SOD activity in accordance with the manufacturer’s instructions. Prior validation of the ELISA kit has produced accurate results [25,35].

2.5. Genetic Examination

A prior investigation had identified the full-length cDNAs and primer sequences for the black rockfish PCNA, DCX, and NeuroD genes [25].
For RNA extraction, 30ml tissues that had been stored at −80 °C were ground in liquid nitrogen, after which 1 mL of Total RNA Extractor was added to each sample and the samples were homogenized with a homogenizer. Then, the lysed samples were held at room temperature for 5–10 min to fully separate the nuclear proteins and nucleic acids. Next, 0.2 mL of chloroform was added to each sample and the samples were shaken well for 15 s, held at room temperature for 3 min, and then centrifuged for 10 min at 12,000 rpm and 4 °C. The top (aqueous) phase of each sample was aspirated and transferred to a sterile centrifuge tube. An equal volume of isopropanol was added, and the samples were thoroughly mixed and allowed to sit at room temperature for 20 min, then centrifuged for 10 min at 12,000 rpm and 4 °C. The supernatant was discarded. To wash the precipitate, 1 mL of 75% ethanol was added to each sample and the samples were centrifuged for three minutes at 12,000 rpm at 4 °C; after the supernatant had been discarded, the samples were dried for five to ten minutes at room temperature. Next, 0.2 mL of chloroform was added to each sample and the samples were shaken thoroughly for 15 s, then held at room temperature for 5–10 min. Thirty to fifty microliters of RNase-free ddH2O were added to each sample to completely dissolve the RNA after 5 to 10 min. The resultant RNA solution could then be stored at −80 °C or used in further investigations.
The RNA concentration was determined via reverse transcription–amplification and, eventually, fluorescence quantitative PCR. RNA electrophoresis was used to detect the results of RNA amplification (1.5% agarose, 1× TAE electrophoresis buffer). The target gene’s expression level was normalized to 18S rRNA using final gene amplification, and the 2−(ΔΔCT) method was used to express the result as a fold change in comparison to the control expression level [46,47,48].

2.6. Calculations and Data Analysis

The primary calculations were as follows: weight gain = (BWf − BWi)/BWi; food-conversion efficiency = FI/(BWf-BWi); specific growth rate (%) = 100 × [ln(BWf) − ln(BWi)]/T; coefficient of variation for body weight (%) = 100 × SD/BWf; condition factor (%) = 100 × BWf/BLf3. In these calculations, BWf is mean final body weight (g); BWi is mean initial body weight (g); T (d) = number of feeding days; and FI is the amount of food taken per whole tank (g); BLf is mean final body length (cm); SD is the standard deviation of the final body-weight distribution.
To determine the main and interaction effects of cortisol levels and gene-expression levels, three-way ANOVA was performed with bait type, group size, and stress as fixed factors and rearing tank as a random factor and followed by Tukey’s post hoc test. To determine the main and interaction effects of aggressive behavior, growth performance, and antioxidant indicators (CAT, GSH-Px, SOD, and MDA), two-way ANOVA was performed with enrichment and stress as fixed factors and with rearing tank as a random factor and followed by Tukey’s post hoc test. Before ANOVA, the data’s chi-squareness was assessed using the Levene test, and its normality was assessed using the Shapiro–Wilk test. When the data did not match the ANOVA requirements (i.e., normality and homogeneity), extensive transformation (i.e., logarithmic transformation log10(1 + x) for DCX and NeuroD expression levels) was applied. A number of fitting techniques were developed based on the findings of Pearson correlation analyses that were conducted on the pooled data in order to elucidate the connections among behavioral, physiological, and genetic parameters. All statistical analyses were conducted using SPSS 22.0 for Windows. Differences were considered significant at p < 0.05. The transformed data were used only in statistical analysis, and all values in the text and figures are untransformed means ± S.E.

3. Results

The primary findings of this investigation demonstrated that (1) the live-bait type enhanced the coefficient of variation for body weight (28.06%) and the expression of the neurogenesis-related genes PCNA (182.75%), DCX (86.7%), and NeuroD (154.19%) and significantly reduced CAT activity (16.34%), GSH-Px activity (50.12%), SOD activity (12.55%), and the frequency of aggressive behavior during feeding (62.91%) and during rest (53.51%);
(2) The large group size significantly reduced MDA levels (27.4%), the frequency of aggressive behavior during feeding (31.91%) and during rest (32.09%), and basal cortisol levels (11.11%); it increased CAT activity (52.56%), GSH-Px activity (57.78%), and SOD activity (51.73%), as well as the basal expression of DCX (78.34%) and NeuroD (72.54%);
(3) Acute stress dramatically raised cortisol levels (5161.61%) and the expression of genes related to brain PCNA (347.88%), DCX (1859.94%), and NeuroD (144.75%) in analyses combining different-size groups;
Significant interactions were found between stress and group size and between stress and bait type, with effects on cortisol levels. Significant interactions were also found between bait type and stress, with effects on PCNA, DCX, and NeuroD expression. Under various baiting conditions and group sizes, the frequency of aggressive behavior during feeding and the frequency of aggressive behavior during rest were linearly regressed on basal cortisol levels.

3.1. Growth Performance

Two-way ANOVA showed a significant main effect of bait type on the coefficient of variation for body weight (CV) (bait types: F(1,24) = 20.410, p = 0.002; group size: F(1,24) ≈ 0.000, p = 0.996; interaction effect: F(1,24) = 0.221, p = 0.651) (Figure 1). However, there was no significant main effect or interaction effect on initial body length (bait types: F(1,24) = 0.034, p = 0.857; group size: F(1,24) = 0.215, p = 0.655; interaction effect: F(1,24) = 0.009, p = 0.928), initial body weight (bait types: F(1,24) = 1.948, p = 0.200; group size: F(1,24) = 0.079, p = 0.785; interaction effect: F(1,24) = 0.139, p = 0.719), weight gain (WG) (bait types: F(1,24) = 1.244, p = 0.297; group size: F(1,24) = 0.616, p = 0.455; interaction effect: F(1,24) = 0.014, p = 0.909), food-conversion rate (FCR) (bait types: F(1,24) = 5.164, p = 0.053; group size: F(1,24) = 0.767, p = 0.407; interaction effect: F(1,24) = 1.217, p = 0.302), condition factor (CF) (bait types: F(1,24) = 0.139, p = 0.719; group size: F(1,24) = 0.626, p = 0.452; interaction effect: F(1,24) = 0.026, p = 0.877), or standardized growth rate (SGR) (bait types: F(1,24) = 1.814, p = 0.215; group size: F(1,24) = 0.599, p = 0.461; interaction effect: F(1,24) = 0.778, p = 0.403) (Table 1).

3.2. Antioxidant Indicators

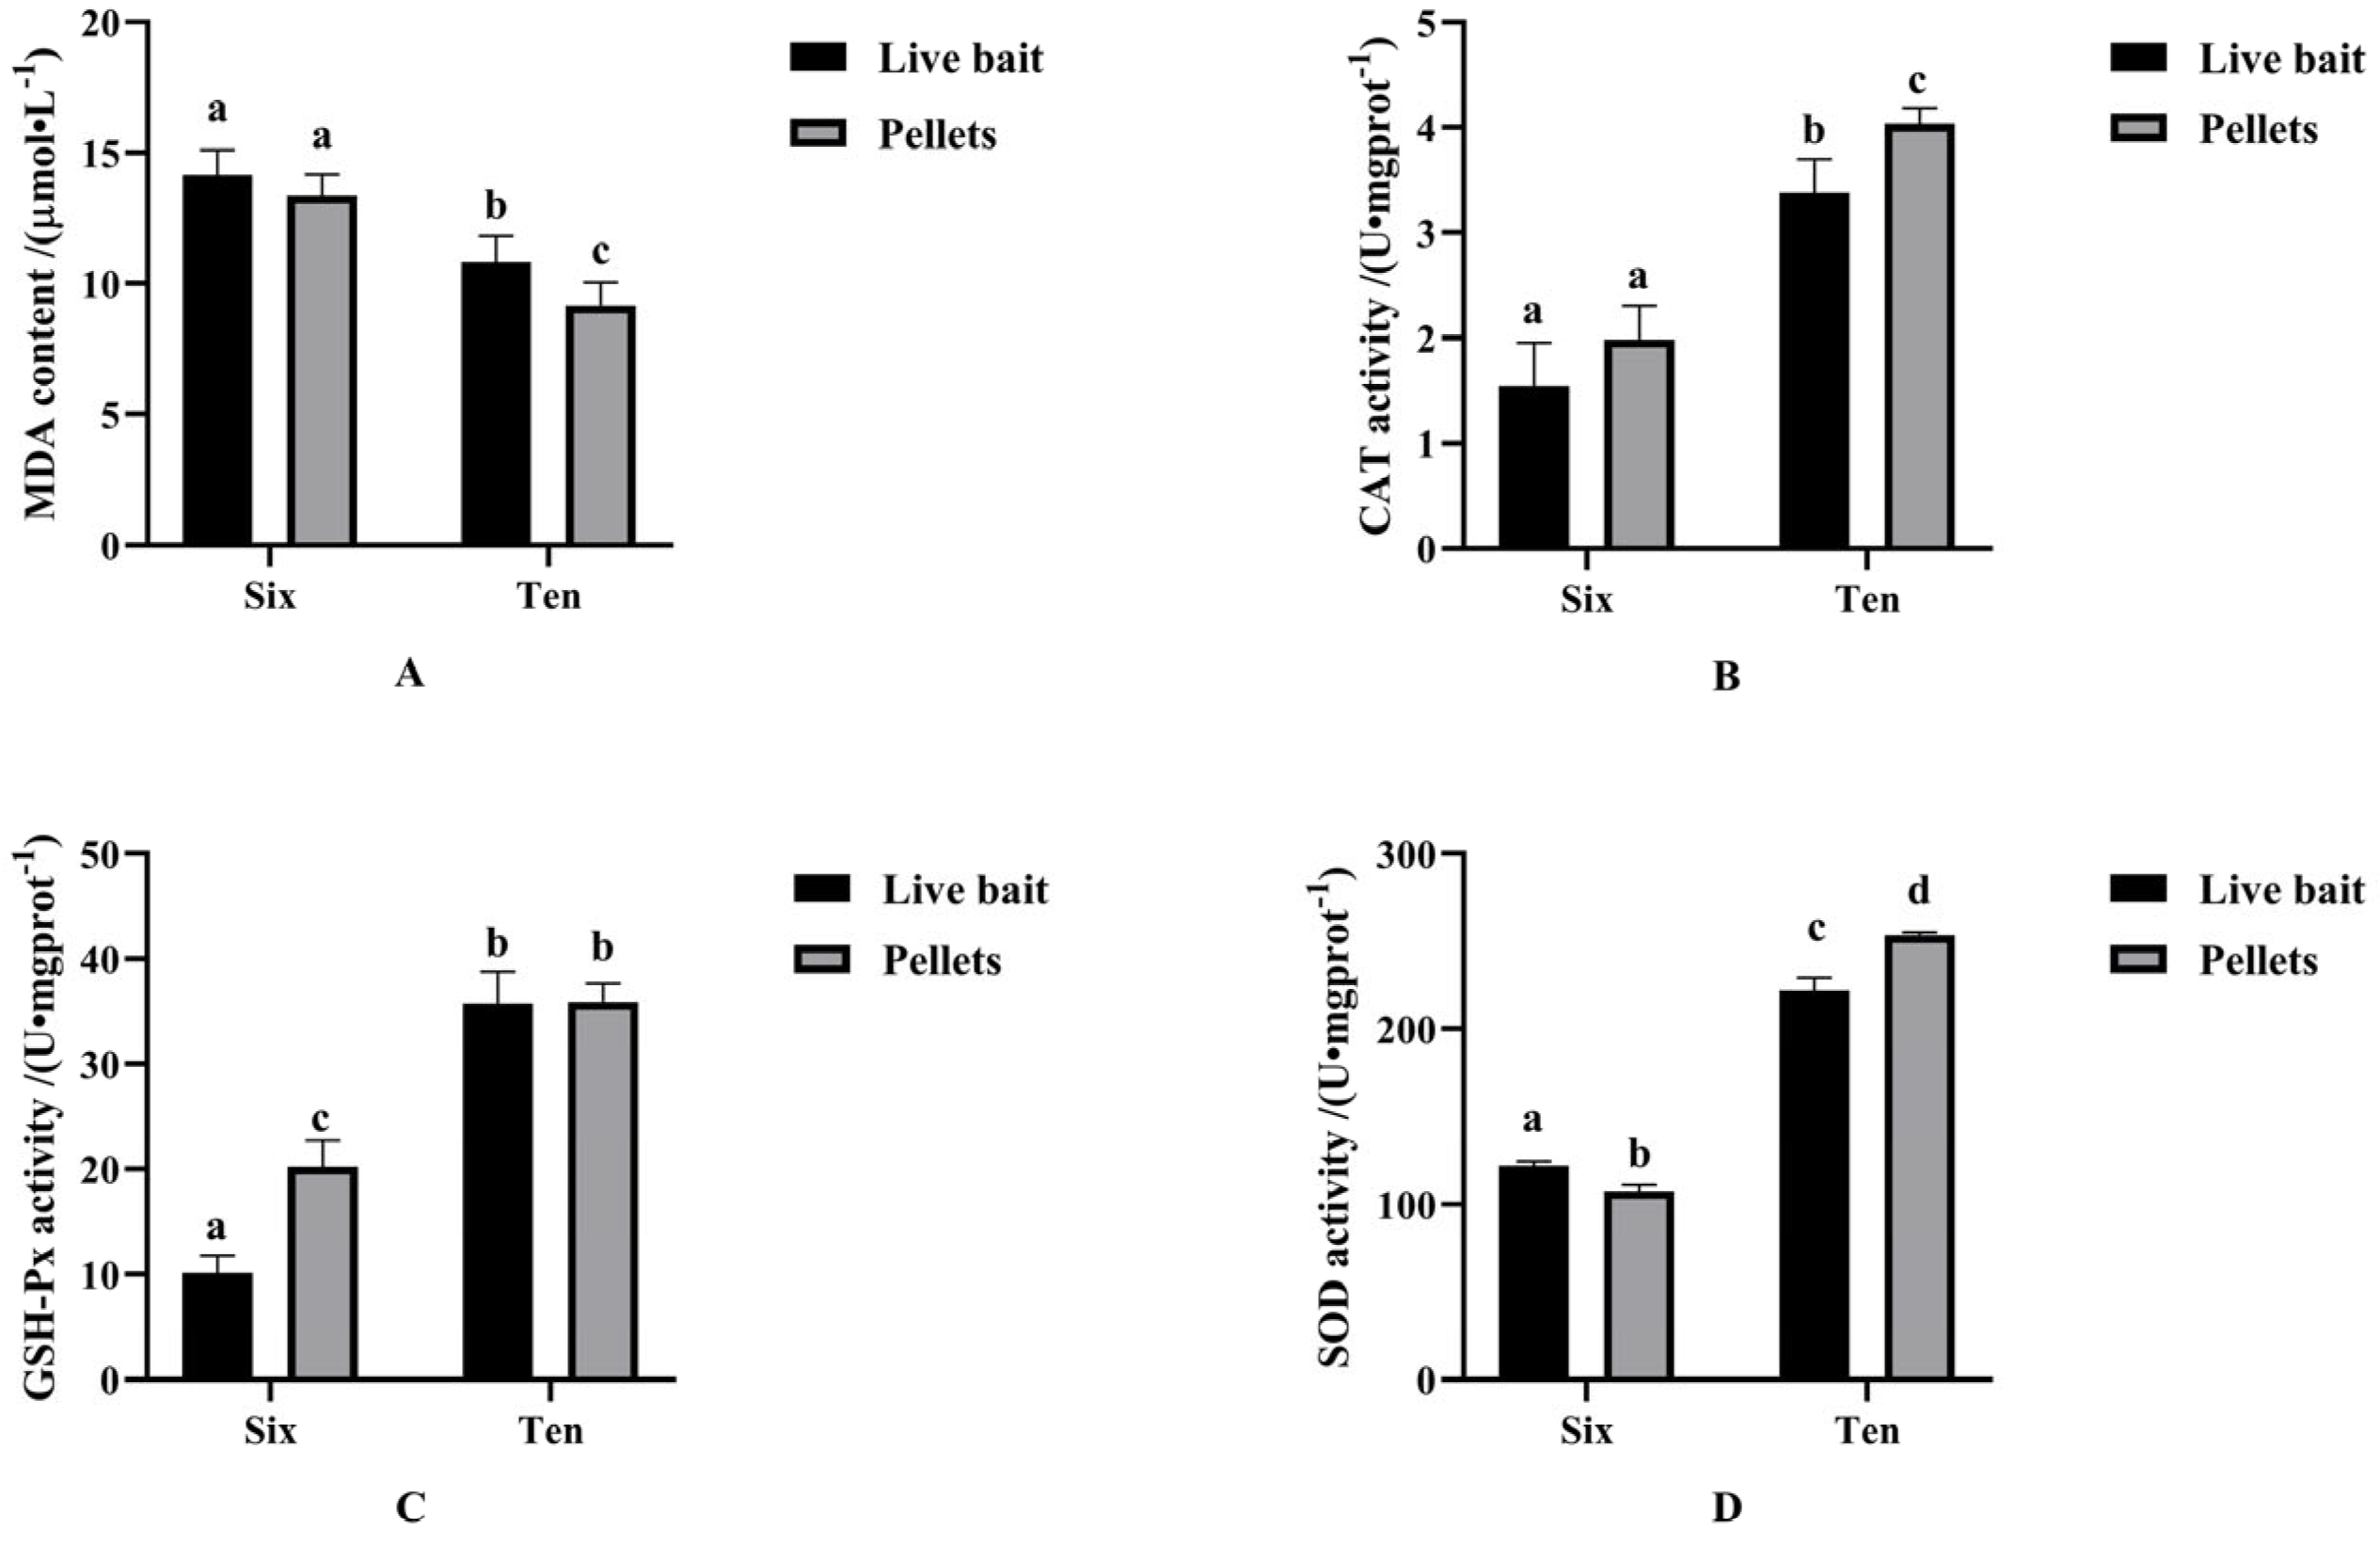
The antioxidant capacity of fish was significantly impacted by social enrichment via bait type and group size, and these treatments also had significant main effects on MDA levels, as well as on the activity of CAT, GSH-Px, and SOD. Fish housed in groups of ten had significantly higher levels of CAT, GSH-Px, and SOD activity than fish housed in groups of six, as well as significantly lower MDA levels. Within the six-fish groups, the group fed live bait had significantly lower GSH-Px activity than the group fed pellets. Moreover, the activity of SOD was significantly lower in the group fed pellets than in the group fed live bait. Within the ten-fish groups, the levels of CAT and SOD activity were significantly higher in the group fed pellets than in the group fed live bait and MDA levels was significantly higher in the fish fed live bait than in those fed pellets. Thus, bait type and group size had interactive effects on the levels of GSH-Px and SOD activity (Figure 2).

3.3. Attack Behavior

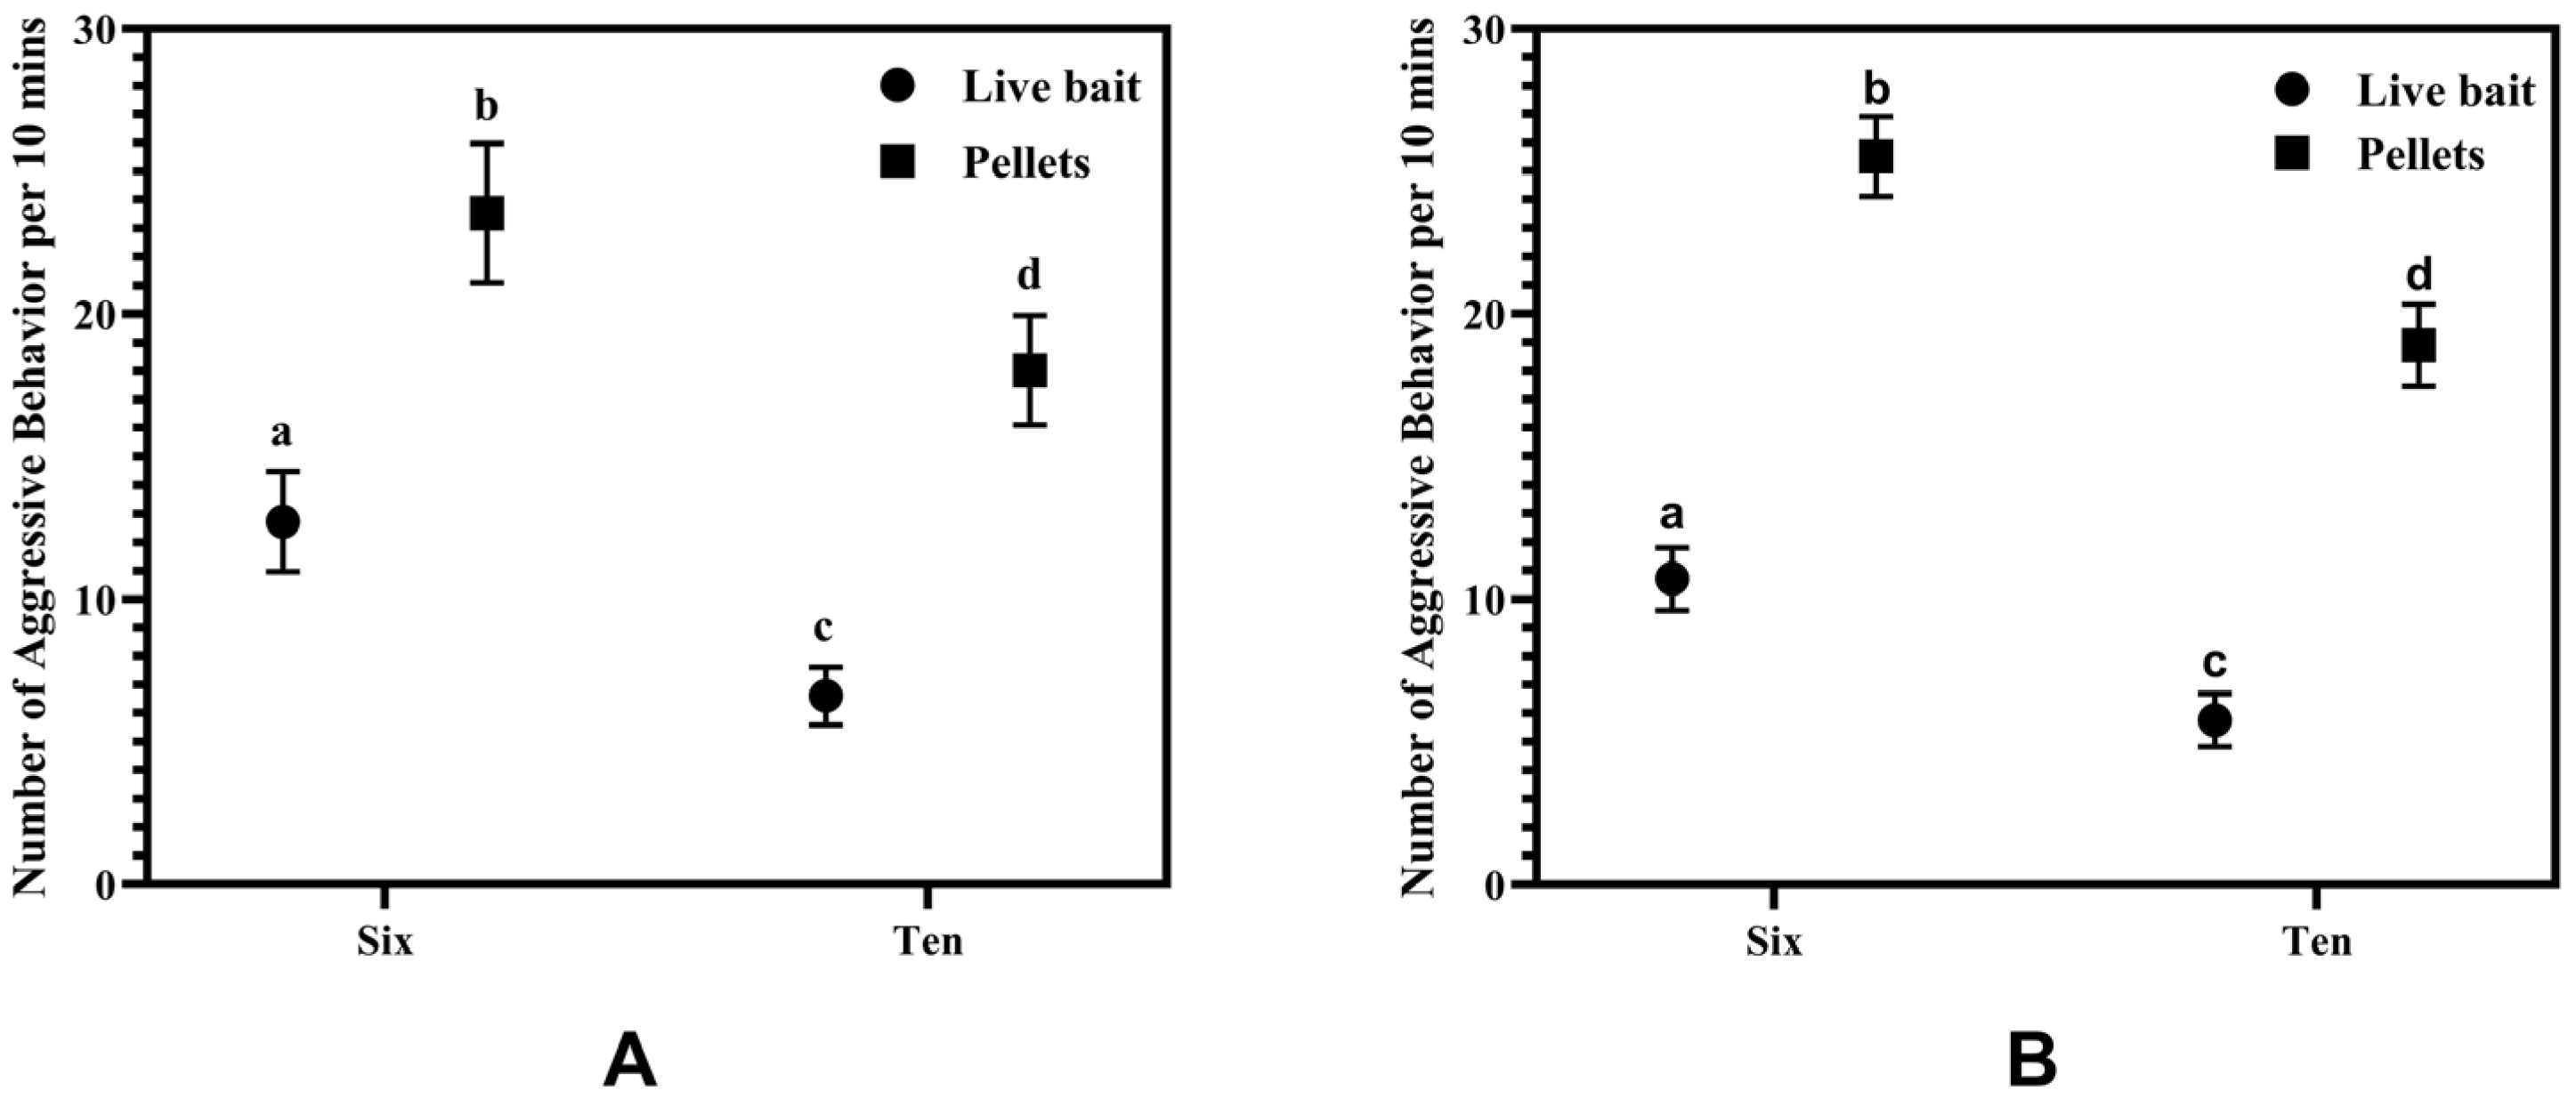
Fish in the pellet groups exhibited higher aggression during feeding; fish in the small groups exhibited higher aggression overall. For groups of the same size, fish in the pellet groups exhibited higher aggression during feeding, while for groups given the same food type, fish in the small groups exhibited higher aggression. These findings were consistent with the finding of significant differences between treatments in terms of aggression both during non-feeding times and during feeding throughout the testing period, with significant main effects of bait type and group size on aggression and no significant interaction between the two factors (Figure 3).

3.4. Cortisol

There were significant main effects of stress and group size on cortisol levels, and the interactions between stress and group size and between stress and bait type were also significant for cortisol levels. As expected, cortisol levels were significantly higher in the stressed condition compared to basal cortisol levels. No significant main effect of bait type was detected, and there was no significant interaction effect among these three factors (Figure 4).

3.5. Expression of Genes Linked to Neurogenesis

There was no significant main effect of group size on PCNA expression, but DCX and NeuroD expression levels were higher in the fish raised in the large groups than in the fish raised in the small groups. The relative abundance of PCNA/18S rRNA mRNA was significantly higher in fish raised on live bait than in fish raised on pellet feed. There was also a significant interaction between the two factors (bait types and stress), and PCNA expression was significantly lower in the basal condition than in the stress condition (Figure 5A).
Bait type, group size, and stress were the main factors that significantly influenced DCX expression; fish raised on live bait had a significantly higher relative abundance of DCX/18S rRNA mRNA than fish raised on pellet feed; fish raised in large groups had a significantly higher level of DCX expression than fish raised in small groups; and fish in the basal condition had a significantly lower level of DCX expression than fish in the stress condition. There was a significant interaction effect between bait type and stress. However, there was no significant interaction effect among the three factors (Figure 5B).
There were significant main effects of bait type, group size, and stress on NeuroD expression, and the relative abundance of NeuroD/18S rRNA mRNA was significantly higher in fish reared on live bait than in fish reared on pellet feed. The relative abundance of NeuroD/18S rRNA mRNA in fish reared in the large group was significantly higher than that in fish reared in the small group. Additionally, fish in the basal condition had significantly lower levels of NeuroD expression than did fish in the stress condition. There was a significant interaction effect between bait type and stress. There was no significant interaction effect among the three factors (Figure 5C).

3.6. Relationships Among Body-Weight Coefficients of Variation, Aggressive Behavior, Cortisol, and Neurogenic Gene Markers

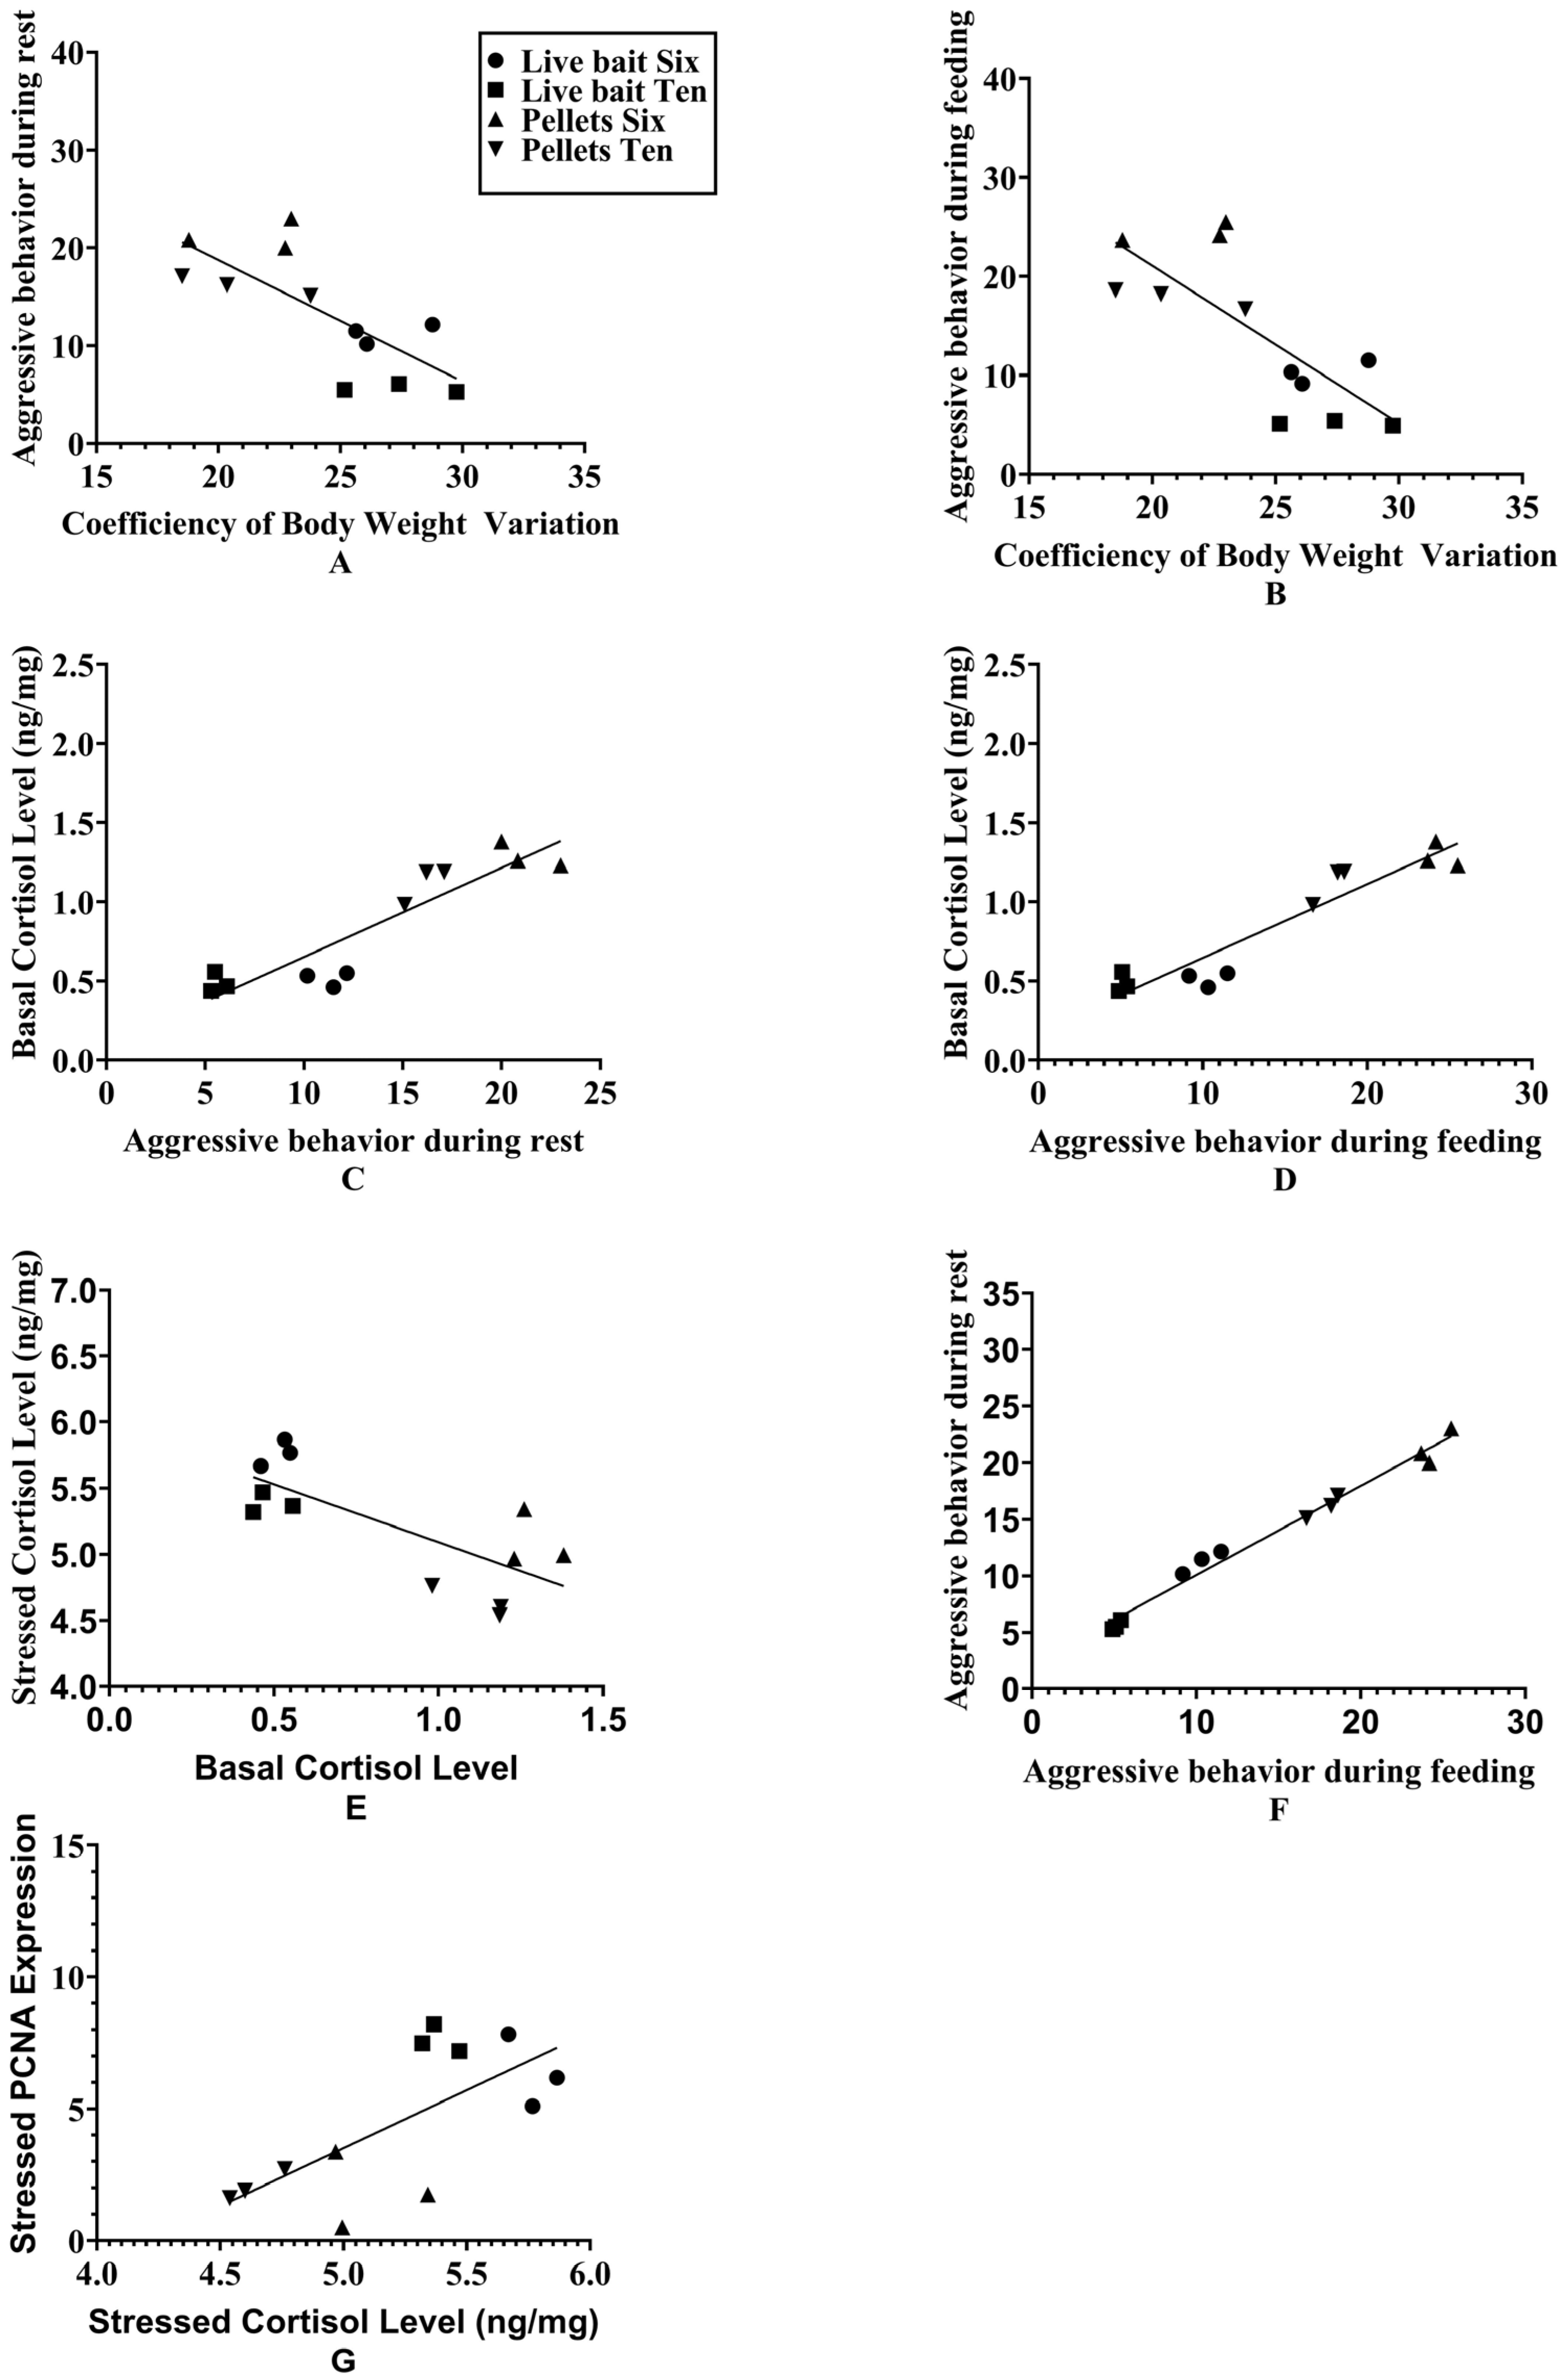
Significant associations (p < 0.05) were found in the experimental results between a number of behavioral factors and physiological and growth markers. In particular, there was a strong correlation between aggressive behavior during feeding and the coefficient of variation for body weight, as well as between aggressive behavior during rest and the coefficient of variation for body weight. Aggressive behavior during feeding and aggressive behavior during rest were also significantly correlated. As the coefficient of variation for body weight increased, both aggressive behavior during feeding and aggressive behavior during rest decreased. Basal cortisol levels and cortisol levels during stress were significantly correlated in terms of physiological indicators. Notably, the examination of the association between cortisol levels and aggression revealed a substantial link between basal cortisol levels and aggression during both eating and rest. In the meantime, there was a strong link between the expression of the stress-related gene PCNA and cortisol levels during stressful situations. These results show that behavioral characteristics and physiological markers interact in a complicated way (Figure 6).
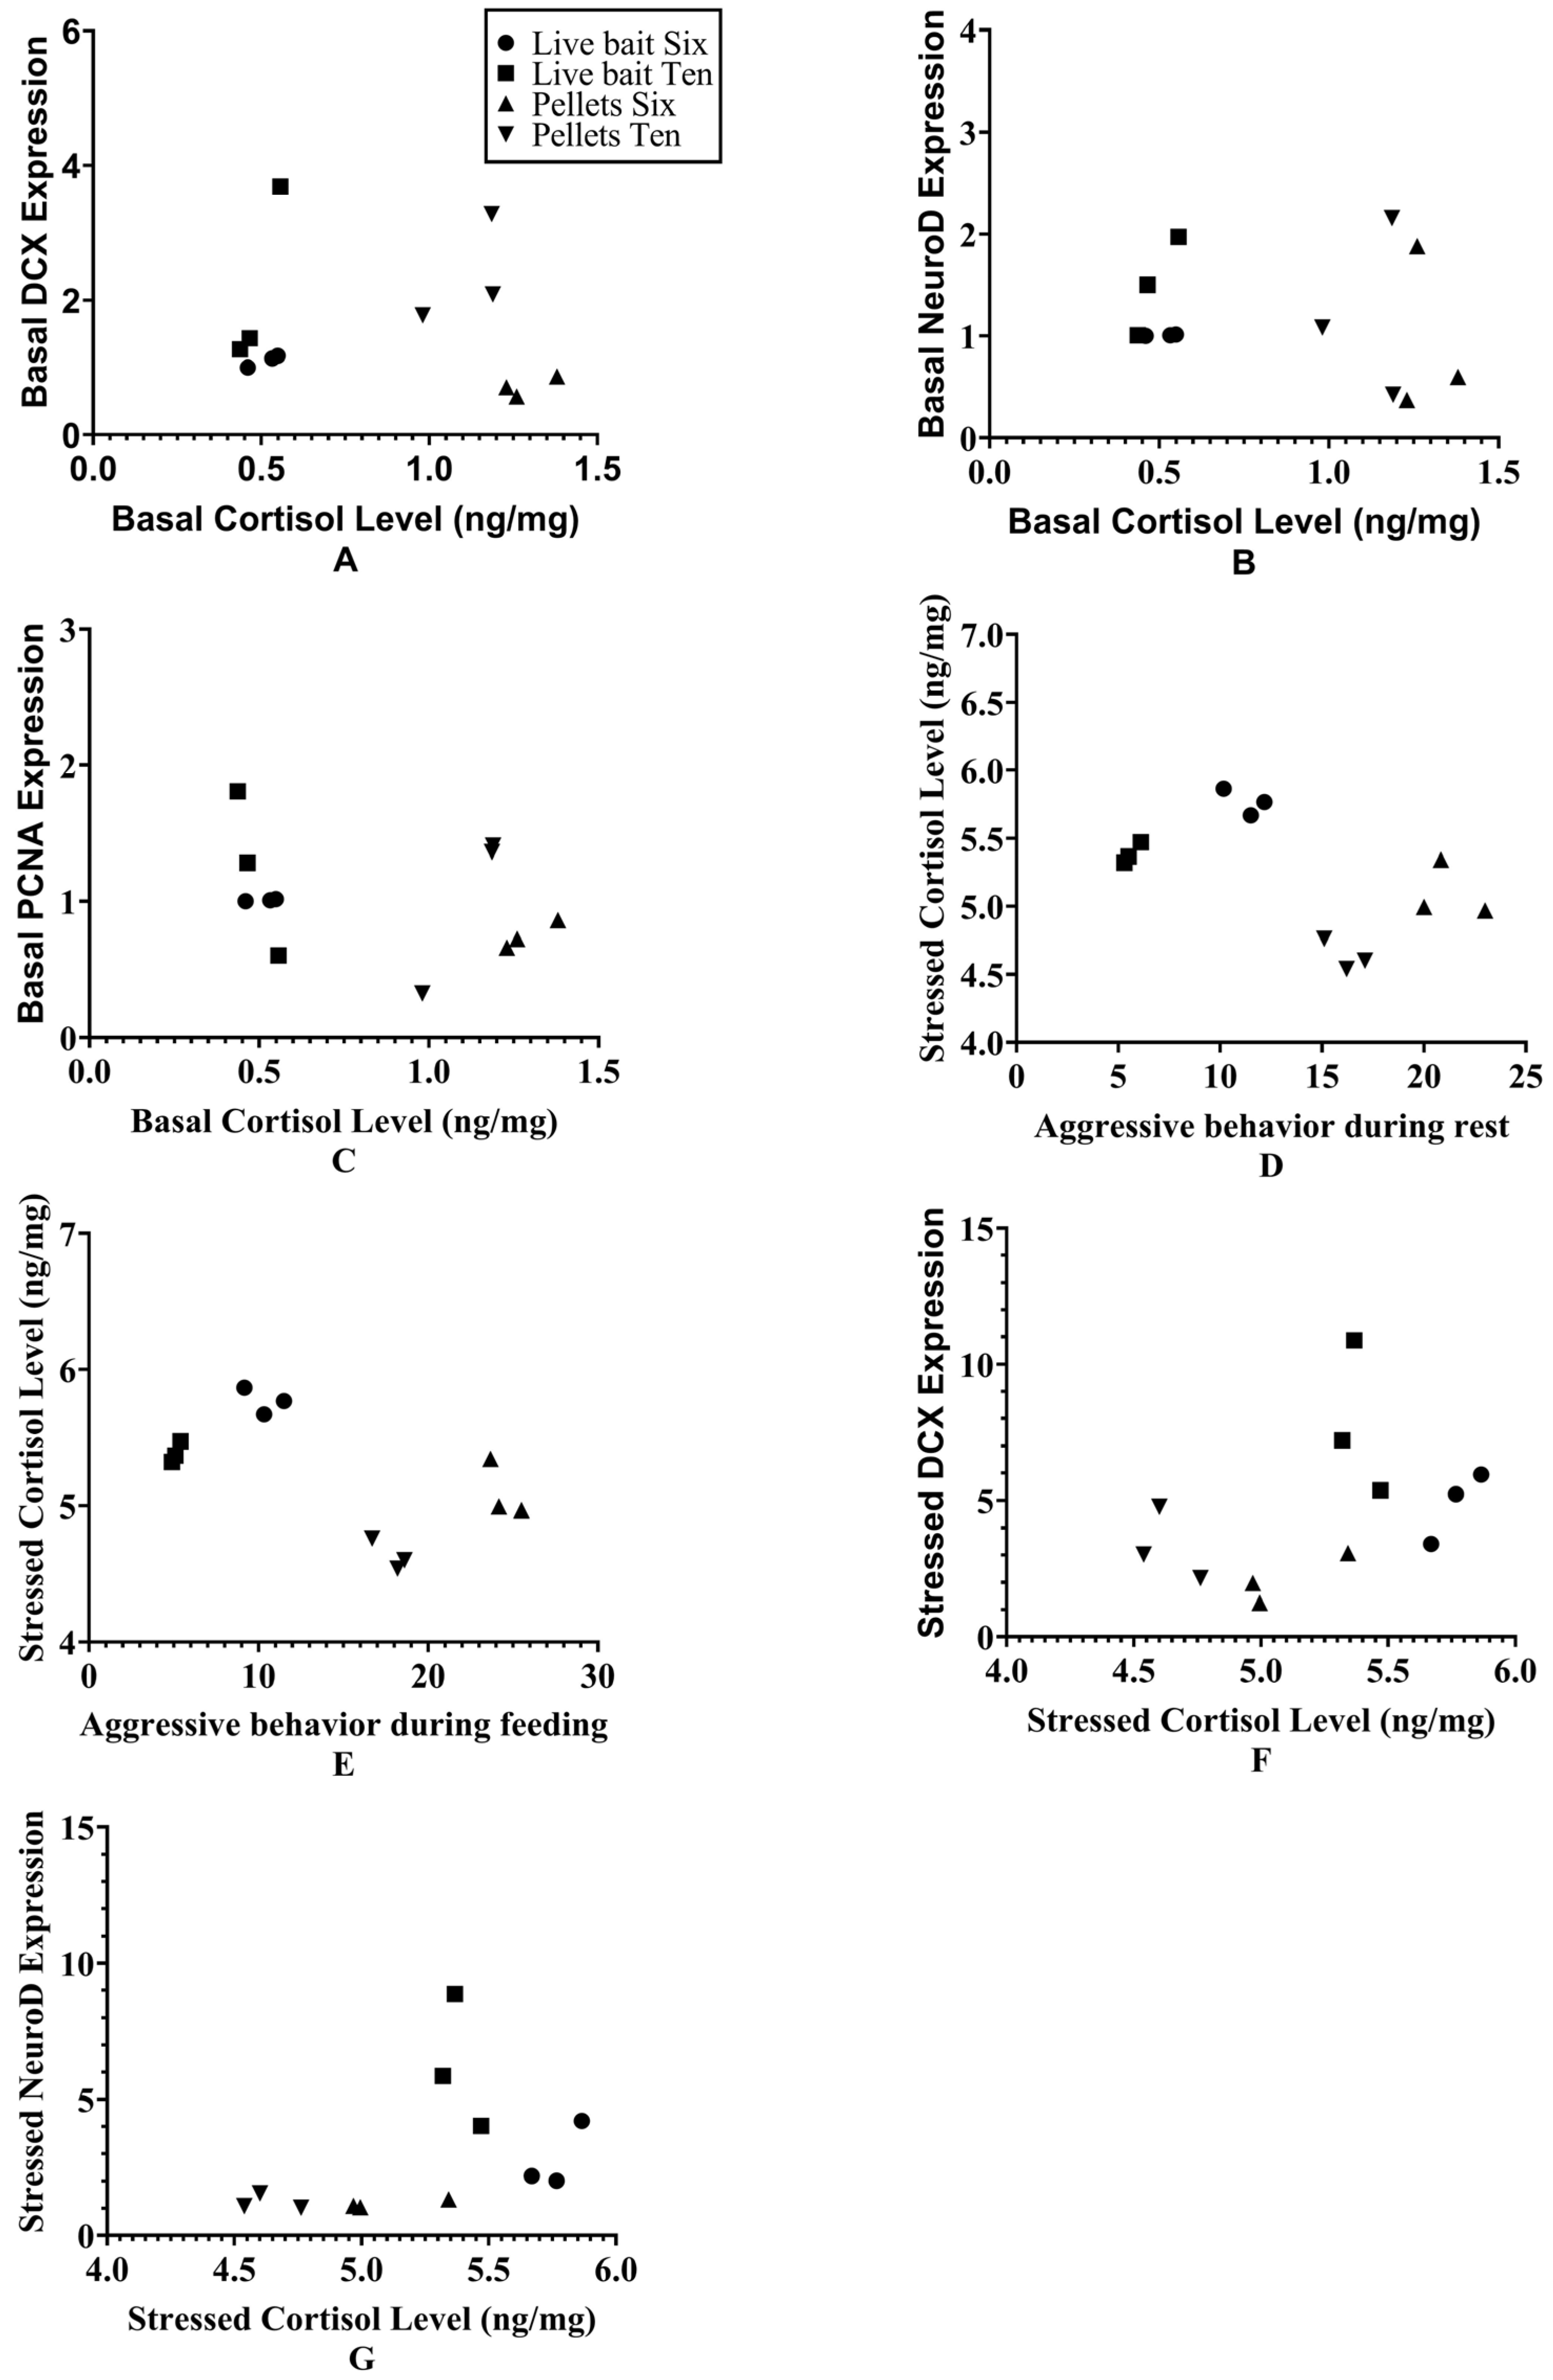
According to correlation analysis, there was no discernible relationship between the levels of baseline cortisol and the expression of basal PCNA, basal DCX, and basal NeuroD (p > 0.05). Likewise, stress-associated cortisol levels were not statistically significantly associated with aggressive behavior or the expression of DCX or NeuroD under stress conditions (p > 0.05). These findings imply that, under the circumstances examined, there is no discernible linear relationship between cortisol levels and the expression of DCX or NeuroD (Figure 7).

4. Discussion

4.1. The Importance of Growth Performance and Antioxidant Capacity to the Aquaculture Sector

According to earlier research, fish baseline growth performance is unaffected by the use of pellet feeds versus appropriate live bait [49,50]. Our results support these findings, but we also discovered that offering live bait increased the body-weight coefficient of variation in the fish, a phenomenon previously linked to the introduction of a new social class and thus in a high degree of inter-individual growth variability [5]. At lower population densities, the majority of cultured species can show improved fin condition and growth rates, decreased injury rates, better stress responses, and increased size uniformity, and there can possibly be positive effects on fish distribution and space utilization [5,10,51]. Additionally, growth is not greatly impacted by any increases in group size outside of a specific range [52].
Aquatic organisms face environmental stressors that induce overproduction of reactive oxygen species (ROS) [53,54]. Excessive ROS accumulation damages cellular structures and functions, triggering antioxidant defense mechanisms to mitigate oxidative damage [55]. Important antioxidant enzymes that control peroxide levels and shield living things from oxidative stress are CAT and SOD [56]. The degree of tissue damage can be determined by measuring the amount of MDA, a biomarker that indicates the degree of oxidative stress in vivo [57]; GPx catalyzes the conversion of glutathione hydroperoxide to H2O and is an essential part of the antioxidant enzyme system [58]. Prior research has demonstrated that in socially enriched O. bidens populations created by mixing different fish species, SOD activity was significantly higher (p < 0.05) and MDA levels were significantly lower (p < 0.05) than in the control group [20]. In contrast, after 7 days of feeding live bait, Siniperca chuatsi showed lower levels of CAT, SOD, and GPx activity than the artificial feed group, and their expression of genes linked to oxidative stress was generally up-regulated; However, after 14 days of domestication, Siniperca chuatsi’s antioxidant capacity was enhanced by increased expression of oxidative stress genes, as evidenced by higher levels of CAT, SOD, and GPx activity in comparison to the artificial-diet group, although the expression of oxidative stress-related genes was generally downregulated after 14 days [50]. This study’s findings, which are in line with those of other investigations, demonstrated that the live-bait treatment dramatically decreased CAT activity, GSH-Px activity, and SOD activity. One of the key elements influencing the growth index and feed efficiency of farmed fish is stocking-group size [59,60]. Previous studies have shown that high stocking-group size significantly impairs the antioxidant capacity of Lates calcarifer, as evidenced by reduced total antioxidant capacity and altered levels of activity in key enzymes such as SOD, GSH-Px, and CAT, alongside simultaneous triggering of physiological stress responses including elevated cortisol, glucose, liver enzymes, and lipid levels. These changes compromise oxidative balance and metabolic homeostasis [61]. Stocking densities below or above the recommended optimal levels negatively affect the behavior, survival, growth, performance, and immunity of animals [62]. In line with the findings of earlier research, this study’s findings demonstrated that optimal size group (between the two group sizes tested) raised CAT activity, GSH-Px activity, and SOD activity and decreased MDA levels. While live-bait feeding, which is more in line with natural feeding, lowers oxidative stress, pelleted feeds may increase antioxidant defenses by causing more oxidative stress.

4.2. The Impact of the Environment on Cortisol Levels and Aggressive Behavior

Fish aggression and stress in that context are closely linked to social enrichment [5]. A prior study found that introducing moderate numbers of fat greenling into a coenvironmental black rockfish population decreased intraspecific aggression in both species [19]. However, dominance hierarchies resulting from social interactions [20], primarily those related to space utilization and food competition [11], caused basal cortisol levels to rise among fish in both smaller and larger groups socially-enriched groups of a single species following the introduction of multiple populations of varying sizes of other species. When North and South American white shrimp were used for social enrichment, it was discovered that at lower population densities, black rockfish in groups given live bait exhibited considerably less hostile behavior than those in groups fed pelleted diets, both during feeding and during idle time. However, there was a negative correlation between intraspecific aggression and the coefficient of variation of fish body weight. This shows that appropriate weight variation within the species may also be responsible for the decrease in intraspecific hostile behavior, alongside the increasing complexity of the social enrichment [31]. Aggressive conduct was far less common in the ten-fish groups than in the six-fish groups, and the incidence of aggressive behavior was unaffected by group size or bait type. There was a significant effect of group size on cortisol levels, and the finding of a significant interaction between stress and group size affecting cortisol levels confirmed these findings. Because individuals who live in large groups are more resilient to instability [63], basal cortisol levels were lower in the ten-fish group than in the six-fish group and stress-associated cortisol levels remained lower in the ten-fish group than in the six-fish group. In summary, the pellet group exhibited lower cortisol levels under stress but higher basal cortisol levels than the live-bait group. Stress interacted with bait type. Fishes belong to different social classes; those in higher classes typically exhibited less aggression because they had easier access to food and territorial resources, whereas those in lower classes displayed more aggression to increase their chances of survival by competing for resources. Furthermore, research has demonstrated that a group’s social structure has a significant impact on individual behavior, with individuals in smaller groups often exhibiting less aggressive behavior [21,64]. To determine that hostility at these two times of day was substantially associated under varying conditions of social enrichment, we examined aggression at various times of day and discovered that aggression during rest was positively correlated with aggression during feeding. In black rockfish under high-density conditions, we observed that intraspecific aggression and basal cortisol levels were lower but stress-induced cortisol levels were higher. This phenomenon is known as desensitization, and it was found that basal cortisol levels and stress-associated cortisol levels were negatively correlated [65]. It is important to highlight this decrease in reactivity may result in functional impairment. In this regard, fish in enriched settings show improved response agility and higher levels of wellbeing in addition to reduced aggression and basal stress. Prior research showed that fish exposed to a small-group social enrichment exhibited higher cortisol levels and higher levels of PCNA expression under conditions of long-term stress than fish in the control group [25], while short-term stress-associated cortisol levels were highly correlated with PCNA expression and long-term stress-associated cortisol levels under physical enrichment were highly correlated with PCNA and DCX expression [20]. We investigated two stress levels in socially enriched fish and discovered a strong correlation between short-term stress and cortisol levels and PCNA expression. We think that a fascinating avenue for future research will involve examining the molecular mechanism of cortisol’s impacts on neurogenesis and other biological processes at varying levels of stress and social enrichment.

4.3. Effects of Stress and Social Enrichment on Brain Cell Proliferation and Neural Transmission

Previous research has demonstrated that stress has opposite effects on brain-cell proliferation, i.e., its effects are both positive [66] and negative [23,67]. The most important finding of the current study is that social enrichment and acute stress, in interaction with environmental enrichment in the form of live bait, have a significant effect on neurogenesis (as indicated by PCNA, DCX, and NeuroD mRNA expression). Compared to the unstressed basal group, the current study found that confinement (living environment) [24,44] and air exposure [68,69,70,71] dramatically increased levels of PCNA expression. Given these significant variations, it is possible to infer that the two forms of stress—acute and chronic—have a biphasic impact on neurogenesis, with acute stress stimulating neurogenesis and chronic stress inhibiting it [72,73,74]. Chronic stress is defined as a consistent sense of feeling pressured and overwhelmed over a long period of time [74]. Habituation to stress in early life is crucial, as studies have demonstrated that repeated early-life stress impacts regional and time-specific modalities of brain activity [72]. Prior research has demonstrated that both short- and long-term stress have a biphasic effect on brain-cell proliferation and neurogenesis and that the consequent changes are linked to heritable differences in coping strategies for stress [73]. For instance, both electric fish (Brachyhypopomus occidentalis) and rainbow trout (Oncorhynchus mykiss) that experience long-term social stress show decreased brain-cell proliferation [23,67]. Conversely, the telencephalon, hypothalamus, and optic parietal lobe in the rainbow trout all exhibit a considerable increase in the relative expression of PCNA in response to brief confinement stress [66]. These previous observations and theories are supported by our study’s discovery that fish under various social-enrichment treatments and subjected to stress exhibit increased expression of PCNA, DCX, and NeuroD. Additionally, according to measurements of PCNA, DCX, and NeuroD expression, bait type correlated with stress state. However, fish that received physical enrichment (with enriched tanks containing 20 plastic plants (10 cm height, 72 cm2 projected area each) providing approximately 50% basal area coverage) showed no discernible change in the expression of NeuroD and DCX [25].
While stress negatively affects brain-cell proliferation and neural transmission, social enrichment may counteract these effects by promoting neural plasticity and cell proliferation. It has been demonstrated that external environmental stimuli can cause an animal to experience stress, which results in an upregulation of PCNA gene expression [75]. The PCNA gene has also been linked to the proliferation of neuronal cells in the distal brain [30]. A microtubule-binding protein involved in neuron migration and synapse formation is encoded by the DCX gene [76]. This suggests that DCX is a suitable biomarker of neurogenesis. Mammalian studies have demonstrated that DCX is transiently expressed in proliferating progenitor cells and neonatal neuroblasts. As neonatal cells start to express mature neuronal markers, the immunoreactivity of DCX drops dramatically below detection levels and has remained undetectable ever since [77]. A basic helix–loop–helix (bHLH) transcription factor implicated in dendritic spine integrity, survival, and neuronal development is encoded by the NeuroD gene [78]. In contrast to physical richness, little is known about how social influences affect brain-cell migration and differentiation. We propose that the addition of a moderate number of appropriate species of appropriate size or live bait may increase brain-cell proliferation in fish. Our findings show that the expression of PCNA, DCX, and NeuroD was significantly higher in fish exposed to social enrichment via the use of live bait, while the expression levels of DCX and NeuroD were significantly higher in fish exposed to social enrichment via group size.
Our findings align with those of prior studies, suggesting that acute stress-induced neurogenesis may result from interactions between social enrichment and stress. For instance, in Atlantic salmon (Salmo salar), exercise training (as a form of environmental enrichment) lasting 3 or 8 weeks increased PCNA expression in the dorsal-lateral cortex, which is equivalent to the mammalian hippocampus [79]; in rats, physical enrichment for 5 weeks promoted cell proliferation and survival in the dentate gyrus of the hippocampus region [80]; and in zebrafish (Danio rerio), enrichment for just one week resulted more PCNA-positive nuclei in the forebrain [30]. However, from an ecological perspective, this biphasic effect can result from several stress-coping mechanisms that rely on the evaluation of environmental stressors [81]. According to earlier research [72], fish that face relatively minor environmental obstacles tend to enhance their observational appraisal of the environment, which increases neurogenesis and neurodevelopment. On the other hand, fish may adjust to harsher conditions, which in turn promotes other biological functions, such as somatic-cell proliferation and energy expenditure [73]. A promising avenue for future research is the investigation of the relationship between brain-cell proliferation and neurotransmission in S. schlegelii under varying social enrichment and stress conditions, as induced by the presence of multiple species and trophic levels.

5. Conclusions

The results of the present study have significant implications for aquaculture and fish welfare. Overall, the use of live bait led to a drop in antioxidant enzyme activity and aggressive behaviors, which are important in fish immune function and behavior adaptation, while it upregulated the expression of neurogenesis-related genes. Thus, optimal bait choice and minimizing the period of offering live feed are keys to ensuring good physiological fitness and behavioral balance in farmed fish. Secondly, the use of large group sizes significantly decreased aggressive activity and MDA levels but improved antioxidant enzyme activity. These findings indicate that moderate group sizes might affect antioxidant capacity and social stress positively but that large group sizes may also inhibit the expression of some neurogenesis genes; therefore, it is necessary to optimize group sizes to balance physiological fitness with neurodevelopmental health. Furthermore, acute stress significantly increased cortisol levels and the expression of genes related to neurogenesis, highlighting the importance of managing stress effectively. Currently, research on the effects of the interaction between bait types and group size on reproduction in marine carnivorous fish such as S. schlegelii remains limited. Given that sustainable aquaculture production relies on stable population structures, this issue warrants further in-depth investigation. In brief, the findings provide a scientific basis for optimizing group sizes, stress control, and bait selection in aquaculture, ultimately contributing to both the welfare and the sustainable production of fish.

Author Contributions

Conceptualization, Z.Z. and X.Y.; methodology, T.T.; software, Z.Z.; validation, Z.Z.; formal analysis, Z.W.; investigation, X.Y.; resources, Z.Z.; data curation, Z.Z.; writing—original draft preparation, T.T.; writing—review and editing, T.T.; supervision, T.T.; project administration, T.T.; visualization, Z.Z.; funding acquisition, T.T. All authors have read and agreed to the published version of the manuscript.

Funding

This research was supported by National Natural Science Foundation of China (No. 42030408) and the Science and Technology Innovation Fund of Dalian, China (No. 2021JJ11CG001).

Institutional Review Board Statement

This study was conducted according to the guidelines of ARRIVE and EU Directive 2010/63/EU for animal experiments. All procedures performed in this study were approved by the Institutional Animal Care and Use Committee of the Ocean University of China (identification code 20180101).

Informed Consent Statement

Not applicable.

Data Availability Statement

The partial data analyzed for this study are available from the corresponding author upon reasonable request.

Acknowledgments

We wish to express our sincerest thanks to the anonymous reviewers, as their valuable comments were very helpful in improving our manuscript.

Conflicts of Interest

The authors declare no conflicts of interest.

References

  1. Oladottir, A.D.; Einarsson, G. Fisheries and Aquaculture: The Food Security of the Future, 1st ed.; Academic Press: Cambridge, MA, USA, 2020; ISBN 9780128231920. [Google Scholar]
  2. Ashley, P.J. Fish welfare: Current issues in aquaculture. Appl. Anim. Behav. Sci. 2007, 104, 199–235. [Google Scholar] [CrossRef]
  3. Huntingford, F.A.; Adams, C.; Braithwaite, V.A.; Kadri, S.; Pottinger, T.G.; Sandøe, P.; Turnbull, J.F. Current issues in fish welfare. J. Fish. Biol. 2006, 70, 1311–1316. [Google Scholar] [CrossRef]
  4. Huntingford, F.A.; Kadri, S. Defining, assessing and promoting the welfare of farmed fish. Rev. Sci. Et Tech. Int. Off. Epizoot. 2014, 33, 233–244. [Google Scholar] [CrossRef]
  5. Arechavala-Lopez, P.; Cabrera-Lvarez, M.J.; Maia, C.M.; Saraiva, J.L. Environmental enrichment in fish aquaculture: A review of fundamental and practical aspects. Rev. Aquac. 2022, 14, 704–728. [Google Scholar] [CrossRef]
  6. Brydges, N.M.; Braithwaite, V.A. Does environmental enrichment affect the behaviour of fish commonly used in laboratory work? Appl. Anim. Behav. Sci. 2009, 118, 137–143. [Google Scholar] [CrossRef]
  7. Martins, C.I.; Galhardo, L.; Noble, C.; Damsgard, B.; Spedicato, M.T.; Zupa, W.; Beauchaud, M.; Kulczykowska, E.; Massabuau, J.C.; Carter, T.; et al. Behavioural indicators of welfare in farmed fish. Fish. Physiol. Biochem. 2012, 38, 17–41. [Google Scholar] [CrossRef] [PubMed]
  8. Jones, N.A.R.; Webster, M.M.; Salvanes, A.G.V. Physical enrichment research for captive fish: Time to focus on the DETAILS. J. Fish. Biol. 2021, 99, 704–725. [Google Scholar] [CrossRef]
  9. NäSlund, J.; Johnsson, J.R.I. Environmental enrichment for fish in captive environments: Effects of physical structures and substrates. Fish Fish. 2016, 17, 1–30. [Google Scholar] [CrossRef]
  10. Baldwin, L. The effects of stocking density on fish welfare. Plymouth Stud. Sci. 2011, 4, 372–383. [Google Scholar] [CrossRef]
  11. Turnbull, J.F.; North, B.P.; Ellis, T.; Adams, C.E.; Huntingford, F.A. Stocking Density and the Welfare of Farmed Salmonids. In Fish Welfare; John Wiley & Sons: Hoboken, NJ, USA, 2008; pp. 111–120. [Google Scholar] [CrossRef]
  12. Adams, C.E.; Turnbull, J.F.; Bell, A.; Bron, J.E.; Huntingford, F.A. Multiple determinants of welfare in farmed fish: Stocking density, disturbance, and aggression in Atlantic salmon (Salmo salar). Can. J. Fish. Aquat. Sci. 2007, 64, 336–344. [Google Scholar] [CrossRef]
  13. Ellis, T.; North, B.; Scott, A.P.; Bromage, N.R.; Porter, M.; Gadd, D. The relationships between stocking density and welfare in farmed rainbow trout. J. Fish Biol. 2002, 61, 493–531. [Google Scholar] [CrossRef]
  14. Ma, Z.; Li, H.; Hu, Y.; Fan, J.; Liu, Y. Growth performance, physiological, and feeding behavior effect of Dicentrarchus labrax under different culture scales. Aquaculture 2021, 534, 736291. [Google Scholar] [CrossRef]
  15. Haugland, G.T.; Imsland, A.K.D.; Reynolds, P.; Treasurer, J. Application of biological control: Use of cleaner fish. In Aquaculture Health Management; Academic Press: Cambridge, MA, USA, 2020; pp. 319–369. [Google Scholar] [CrossRef]
  16. Thomas, M.; Lecocq, T.; Abregal, C.; Nahon, S.; Pasquet, A. The effects of polyculture on behaviour and production of pikeperch in recirculation systems. Aquac. Rep. 2020, 17, 100333. [Google Scholar] [CrossRef]
  17. Anras, L.; Boglione, C.; Cataudella, S.; Dinis, M.; Makridis, P.; Marino, G.; Ramalho Ribeiro, A.; Yúfera, M. The current status of extensive and semi-intensive aquaculture practices in Southern Europe. Aquac. Eur. 2010, 35, 12–16. [Google Scholar]
  18. Yúfera, M.; Arias, A.M. Traditional polyculture in “Esteros” in the Bay of Cádiz (Spain). Hopes and expectancies for the prevalence of a unique activity in Europe. Aquac. Eur. 2010, 35, 22–25. [Google Scholar]
  19. Zhang, Z.; Fu, Y.; Zhao, H.; Zhang, X. Social enrichment affects fish growth and aggression depending on fish species: Applications for aquaculture. Front. Mar. Sci. 2022, 9, 1011780. [Google Scholar] [CrossRef]
  20. Lin, Y.; Li, Q.; Cai, Z.; Ye, J.; Tong, W.; Ren, S.; Wu, X.; Chen, H.; Lü, M.; Zheng, S. Effects of Environmental Enrichment on the Growth, Gonadal Development, and Welfare of the Chinese Hooksnout Carp (Opsariichthys bidens). Fishes 2024, 9, 339. [Google Scholar] [CrossRef]
  21. Grossman, G.D. Food, fights, and burrows: The adaptive significance of intraspecific aggression in the bay goby (Pisces: Gobiidae). Oecologia 1980, 45, 261–266. [Google Scholar] [CrossRef]
  22. SøRensen, C.; Bohlin, L.C.; Verli, Y.; Nilsson, G.R.E. Cortisol reduces cell proliferation in the telencephalon of rainbow trout (Oncorhynchus mykiss). Physiol. Behav. 2011, 102, 518–523. [Google Scholar] [CrossRef]
  23. SøRensen, C.; Nilsson, G.R.E.; Summers, C.H.; Verli, Y. Social stress reduces forebrain cell proliferation in rainbow trout (Oncorhynchus mykiss). Behav. Brain Res. 2012, 227, 311–318. [Google Scholar] [CrossRef]
  24. Marcon, M.; Mocelin, R.; Benvenutti, R.; Costa, T.; Piato, A. Environmental enrichment modulates the response to chronic stress in zebrafish. J. Exp. Biol. 2018, 221, jeb176735. [Google Scholar] [CrossRef] [PubMed]
  25. Zhang, Z.; Xu, X.; Wang, Y.; Zhang, X. Effects of environmental enrichment on growth performance, aggressive behavior and stress-induced changes in cortisol release and neurogenesis of black rockfish Sebastes schlegelii—ScienceDirect. Aquaculture 2020, 528, 735483. [Google Scholar] [CrossRef]
  26. Braithwaite, V.A.; Salvanes, A.G.V. Environmental variability in the early rearing environment generates behaviourally flexible cod: Implications for rehabilitating wild populations. Proc. R. Soc. B Biol. Sci. 2005, 272, 1107–1113. [Google Scholar] [CrossRef] [PubMed]
  27. Salvanes, A.G.V.; Moberg, O.; Ebbesson, L.O.E.; Nilsen, T.O.; Jensen, K.H.; Braithwaite, V.A. Environmental enrichment promotes neural plasticity and cognitive ability in fish. Proc. Biol. Sci. 2013, 280, 20131331. [Google Scholar] [CrossRef] [PubMed]
  28. Bergendahl, I.A.; Gro, V.S.A.; Victoria, A.B. Determining the effects of duration and recency of exposure to environmental enrichment. Appl. Anim. Behav. Sci. 2016, 176, 163–169. [Google Scholar] [CrossRef]
  29. Roy, T.; Bhat, A.; Herberstein, M. Learning and Memory in Juvenile Zebrafish: What makes the Difference—Population or Rearing Environment? Ethology 2016, 122, 308–318. [Google Scholar] [CrossRef]
  30. von Krogh, K.; Sørensen, C.; Nilsson, G.E.; Øverli, Ø. Forebrain cell proliferation, behavior, and physiology of zebrafish, Danio rerio, kept in enriched or barren environments. Physiol. Behav. 2010, 101, 32–39. [Google Scholar] [CrossRef]
  31. Guo, H.; Zhang, X.; Johnsson, J.R.I. Effects of size distribution on social interactions and growth of juvenile black rockfish (Sebastes schlegelii). Appl. Anim. Behav. Sci. 2017, 194, 135–142. [Google Scholar] [CrossRef]
  32. Xi, D.; Zhang, X.; Lü, H.; Zhang, Z. Cannibalism in juvenile black rockfish, Sebastes schlegelii (Hilgendorf, 1880), reared under controlled conditions. Aquaculture 2017, 479, 682–689. [Google Scholar] [CrossRef]
  33. Lü, H.; Zhang, X.; Fu, M.; Xi, D.; Gao, T. Use of tetracycline hydrochloride and alizarin complexone for immersion marking black rockfish Sebastes schlegelii. J. Oceanol. Limnol. 2014, 32, 810–820. [Google Scholar] [CrossRef]
  34. Zhang, Z.; Bai, Q.; Xu, X.; Guo, H.; Zhang, X. Effects of environmental enrichment on the welfare of juvenile black rockfish Sebastes schlegelii: Growth, behavior and physiology. Aquaculture 2020, 518, 734782. [Google Scholar] [CrossRef]
  35. Zhang, Z.; Zhang, X.; Li, Z.; Zhang, X. Effects of different levels of environmental enrichment on the sheltering behaviors, brain development and cortisol levels of black rockfish Sebastes schlegelii. Appl. Anim. Behav. Sci. 2019, 218, 104825. [Google Scholar] [CrossRef]
  36. Liu, S.; Cai, H.; Liu, Y.; Zhang, Y.; Fang, Y.; Sun, F.; Wu, Y.; Li, X.; Lv, L.; Zhang, Q. Effects of LED spectra on the growth and physiological mechanism of juvenile Sebastes schlegelii. Part I: Growth, feeding and digestion and metabolism. Aquaculture 2024, 580, 740295. [Google Scholar] [CrossRef]
  37. Oh, S.; Kim, C.; Jang, Y.; Choi, H.; Myoung, J. Effect of Salinity on Survival, Oxygen Consumption and Blood Physiology of Korean Rockfish Sebastes schlegelii. Ocean Polar Res. 2014, 36, 135–143. [Google Scholar] [CrossRef]
  38. Ma, Z.; Wang, J.; Zhang, J.; Ren, X.; Zhang, X.; Liu, Y.; Shi, X. Effect of water flow on growth and metabolism in Sebastes schlegelii. Aquaculture 2023, 571, 739485. [Google Scholar] [CrossRef]
  39. Li, H.; Zhang, J.; Ge, X.; Chen, S.; Ma, Z. The Effects of Short-Term Exposure to pH Reduction on the Behavioral and Physiological Parameters of Juvenile Black Rockfish (Sebastes schlegelii). Biology 2023, 12, 876. [Google Scholar] [CrossRef]
  40. Liu, C.; Zhang, Z.; Wei, S.; Xiao, W.; Zhao, C.; Wang, Y.; Yang, L. Transcriptome Analysis of Juvenile Black Rockfish Sebastes schlegelii under Air Exposure Stress. Fishes 2024, 9, 239. [Google Scholar] [CrossRef]
  41. Lee, J.W.; Min, B.H.; Lee, B.; Kim, K.; Yoon, M. Effects of Stocking Density on Stress, Hematological Responses, and Growth of Black Rockfish Sebastes schlegelii. J. Aquat. Anim. Health 2022, 34, 82–91. [Google Scholar] [CrossRef]
  42. Balshine, S.; Leach, B.; Neat, F.; Reid, H.; Taborsky, M.; Werner, N. Correlates of Group Size in a Cooperatively Breeding Cichlid Fish (Neolamprologus pulcher). Behav. Ecol. Sociobiol. 2001, 50, 134–140. [Google Scholar] [CrossRef]
  43. Dierkes, P.; Heg, D.; Taborsky, M.; Skubic, E.; Achmann, R. Genetic relatedness in groups is sex-specific and declines with age of helpers in a cooperatively breeding cichlid. Ecol. Lett. 2005, 8, 968–975. [Google Scholar] [CrossRef]
  44. Näslund, J.; Rosengren, M.; Del Villar, D.; Gansel, L.; Norrgard, J.R.; Persson, L.; Winkowski, J.J.; Kvingedal, E.; Sveriges, L. Hatchery tank enrichment affects cortisol levels and shelter-seeking in Atlantic salmon (Salmo salar). Can. J. Fish. Aquat. Sci. 2013, 70, 585–590. [Google Scholar] [CrossRef]
  45. Rosengren, M.; Kvingedal, E.; Näslund, J.; Johnsson, J.I.; Sundell, K. Born to be wild: Effects of rearing density and environmental enrichment on stress, welfare, and smolt migration in hatchery-reared Atlantic salmon. Can. J. Fish Aquat. Sci. 2017, 74, 396–405. [Google Scholar] [CrossRef]
  46. Livak, K.J.; Schmittgen, T.D. Analysis of Relative Gene Expression Data Using Real-Time Quantitative PCR and the 2−ΔΔCT Method. Methods 2001, 25, 402–408. [Google Scholar] [CrossRef] [PubMed]
  47. Pfaffl, M.W. A new mathematical model for relative quantification in real-time RT-PCR. Nucleic Acids Res. 2001, 29, e45. [Google Scholar] [CrossRef] [PubMed]
  48. Rao, M.S.; Shetty, A.K. Efficacy of doublecortin as a marker to analyse the absolute number anddendritic growth of newly generated neurons in the adult dentate gyrus. Eur. J. Neurosci. 2004, 19, 234–246. [Google Scholar] [CrossRef]
  49. Huang, Y.; Huang, Q.; Huang, Z.; Hong, Y. Effects of Formulated Pellet Feed or Live Fish Food on the Intestinal and Aquaculture Water Microbial Communities in Goldfish, Carassius auratus. Water 2024, 16, 2486. [Google Scholar] [CrossRef]
  50. Zhang, Z.; Yuan, X.; Wu, H.; Gao, J.; Wu, J.; Xiong, Z.; Feng, Z.; Xie, M.; Li, S.; Xie, Z.; et al. The Effect of Short-Term Artificial Feed Domestication on the Expression of Oxidative-Stress-Related Genes and Antioxidant Capacity in the Liver and Gill Tissues of Mandarin Fish (Siniperca chuatsi). Genes 2024, 15, 487. [Google Scholar] [CrossRef]
  51. Turnbull, J.; Bell, A.; Adams, C.; Bron, J.; Huntingford, F. Stocking density and welfare of cage farmed Atlantic salmon: Application of a multivariate analysis. Aquaculture 2005, 243, 121–132. [Google Scholar] [CrossRef]
  52. Roy, J.; Terrier, F.; Marchand, M.; Herman, A.; Heraud, C.; Surget, A.; Lanuque, A.; Sandres, F.; Marandel, L. Effects of Low Stocking Densities on Zootechnical Parameters and Physiological Responses of Rainbow Trout (Oncorhynchus mykiss) Juveniles. Biology 2021, 10, 1040. [Google Scholar] [CrossRef]
  53. Liu, F.; Li, S.; Yu, Y.; Sun, M.; Xiang, J.; Li, F. Effects of ammonia stress on the hemocytes of the Pacific white shrimp Litopenaeus vannamei. Chemosphere 2020, 239, 124759. [Google Scholar] [CrossRef]
  54. Lushchak, V.I. Environmentally induced oxidative stress in aquatic animals. Aquat. Toxicol. 2011, 101, 13–30. [Google Scholar] [CrossRef] [PubMed]
  55. Yang, H.Y.C.N.; Lee, T.H.C.N. Antioxidant enzymes as redox-based biomarkers: A brief review. BMB Rep. 2015, 48, 200–208. [Google Scholar] [CrossRef] [PubMed]
  56. Dai, J.; Zhang, L.; Du, X.; Zhang, P.; Li, W.; Guo, X.; Li, Y. Effect of Lead on Antioxidant Ability and Immune Responses of Crucian Carp. Biol. Trace Elem. Res. 2018, 186, 546–553. [Google Scholar] [CrossRef] [PubMed]
  57. Xu, L.; Ran, C.; He, S.; Zhang, J.; Hu, J.; Yang, Y.; Du, Z.; Yang, Y.; Zhou, Z. Effects of dietary yeast nucleotides on growth, non-specific immunity, intestine growth and intestinal microbiota of juvenile hybrid tilapia Oreochromis niloticus ♀ × Oreochromis aureus. Anim. Nutr. 2015, 1, 244–251. [Google Scholar] [CrossRef]
  58. Xiong, J.; Jin, M.; Yuan, Y.; Luo, J.X.; Lu, Y.; Zhou, Q.C.; Liang, C.; Tan, Z.L. Dietary nucleotide-rich yeast supplementation improves growth, innate immunity and intestinal morphology of Pacific white shrimp (Litopenaeus vannamei). Aquacult Nutr. 2018, 24, 1425–1435. [Google Scholar] [CrossRef]
  59. de Oliveira, E.G.; Pinheiro, A.B.; de Oliveira, V.Q.; Da Silva, A.R.M.; de Moraes, M.G.; Rocha, Í.R.C.B.; de Sousa, R.R.; Costa, F.H.F. Effects of stocking density on the performance of juvenile pirarucu (Arapaima gigas) in cages. Aquaculture 2012, 370–371, 96–101. [Google Scholar] [CrossRef]
  60. Farias, C.F.H. Preliminary Studies on the Optimum Feeding Rate for Pirarucu Arapaima gigas Juveniles Reared in Floating Cages. Int. J. Aquac. 2013, 3, 147–151. [Google Scholar] [CrossRef]
  61. Taheri, M.; Mousavi, S.M.; Zanguee, N.; Mozanzadeh, M.T. The interactive effects of stocking density and salinity on growth, immune response, antioxidant capacity, digestive enzyme activity, and plasma biochemical parameters in Asian seabass (Lates calcarifer) juveniles. Aquac. Int. 2025, 33, 146. [Google Scholar] [CrossRef]
  62. Mugwanya, M.; Dawood, M.A.O.; Kimera, F.; Sewilam, H. A review on recirculating aquaculture system: Influence of stocking density on fish and crustacean behavior, growth performance, and immunity. Ann. Anim. Sci. 2022, 22, 873. [Google Scholar] [CrossRef]
  63. Anderson, H.M.; Little, A.G.; Fisher, D.N.; McEwen, B.L.; Culbert, B.M.; Balshine, S.; Pruitt, J.N. Correction: Behavioral and physiological evidence that increasing group size ameliorates the impacts of social disturbance. J. Exp. Biol. 2024, 223, jeb217075. [Google Scholar] [CrossRef]
  64. Jordan, L.A.; Wong, M.Y.L.; Balshine, S.S. The effects of familiarity and social hierarchy on group membership decisions in a social fish. Biol. Lett. 2010, 6, 301–303. [Google Scholar] [CrossRef] [PubMed]
  65. Barton, B.A.; Ribas, L.; Acerete, L.; Tort, L. Effects of chronic confinement on physiological responses of juvenile gilthead sea bream, Sparus aurata L., to acute handling. Aquac. Res. 2005, 36, 172–179. [Google Scholar] [CrossRef]
  66. Johansen, I.B.; Sørensen, C.; Sandvik, G.K.; Nilsson, G.E.; Höglund, E.; Bakken, M.; Øverli, Ø. Neural plasticity is affected by stress and heritable variation in stress coping style. Comp. Biochem. Physiol. Part D Genom. Proteom. 2012, 7, 161–171. [Google Scholar] [CrossRef]
  67. Dunlap, K.D. Fish Neurogenesis in Context: Assessing Environmental Influences on Brain Plasticity within a Highly Labile Physiology and Morphology. Brain Behav. Evol. 2016, 87, 156–166. [Google Scholar] [CrossRef] [PubMed]
  68. Boerrigter, J.G.J.; van den Bos, R.; van de Vis, H.; Spanings, T.; Flik, G. Effects of density, PVC-tubes and feeding time on growth, stress and aggression in African catfish (Clarias gariepinus). Aquac. Res. 2016, 47, 2553–2568. [Google Scholar] [CrossRef]
  69. Madison, B.N.; Heath, J.W.; Heath, D.D.; Bernier, N.J. Effects of early rearing environment and breeding strategy on social interactions and the hormonal response to stressors in juvenile Chinook salmon. Can. J. Fish. Aquat. Sci. 2015, 72, 673–683. [Google Scholar] [CrossRef]
  70. Manuel, R.; Boerrigter, J.G.J.; Cloosterman, M.; Gorissen, M.; Flik, G.; van den Bos, R.; van de Vis, H. Effects of acute stress on aggression and the cortisol response in the African sharptooth catfish Clarias gariepinus: Differences between day and night. J. Fish. Biol. 2016, 88, 2175–2187. [Google Scholar] [CrossRef]
  71. Pounder, K.C.; Mitchell, J.L.; Thomson, J.S.; Pottinger, T.G.; Buckley, J.; Sneddon, L.U. Does environmental enrichment promote recovery from stress in rainbow trout? Appl. Anim. Behav. Sci. 2016, 176, 136–142. [Google Scholar] [CrossRef]
  72. Nishi, M.; Horii-Hayashi, N.; Sasagawa, T.; Matsunaga, W. Effects of early life stress on brain activity: Implications from maternal separation model in rodents. Gen. Comp. Endocr. 2013, 181, 306–309. [Google Scholar] [CrossRef]
  73. Øverli, Ø.; Sørensen, C. On the Role of Neurogenesis and Neural Plasticity in the Evolution of Animal Personalities and Stress Coping Styles. Brain Behav. Evol. 2016, 87, 167–174. [Google Scholar] [CrossRef]
  74. Van Weerd, J.H.; Komen, J. The effects of chronic stress on growth in fish: A critical appraisal. Comp. Biochem. Physiol. Part A Mol. Integr. Physiol. 1998, 120, 107–112. [Google Scholar] [CrossRef]
  75. Khan, A.; Dou, J.; Wang, Y.; Jiang, X.; Khan, M.Z.; Luo, H.; Usman, T.; Zhu, H. Evaluation of heat stress effects on cellular and transcriptional adaptation of bovine granulosa cells. J. Anim. Sci. Biotechnol. 2020, 11, 25. [Google Scholar] [CrossRef] [PubMed]
  76. Couillard-Despres, S.; Winner, B.; Schaubeck, S.; Aigner, R.; Vroemen, M.; Weidner, N.; Bogdahn, U.; Winkler, J.; Kuhn, H.; Aigner, L. Doublecortin expression levels in adult brain reflect neurogenesis. Eur. J. Neurosci. 2005, 21, 1–14. [Google Scholar] [CrossRef] [PubMed]
  77. Brown, J.P.; Couillard-Després, S.; Cooper-Kuhn, C.M.; Winkler, J.; Aigner, L.; Kuhn, H.G. Transient expression of doublecortin during adult neurogenesis. J. Comp. Neurol. 2003, 467, 1–10. [Google Scholar] [CrossRef] [PubMed]
  78. Lee, J.E.; Hollenberg, S.M.; Snider, L.; Turner, D.L.; Lipnick, N.; Weintraub, H. Conversion of Xenopus Ectoderm into Neurons by NeuroD, a Basic Helix-Loop- Helix Protein. Sci. Am. Assoc. Adv. Sci. 1995, 268, 836–844. [Google Scholar] [CrossRef]
  79. Mes, D.; Palstra, A.P.; Henkel, C.V.; Mayer, I.; Vindas, M.A. Swimming exercise enhances brain plasticity in fish. R. Soc. Open Sci. 2020, 7, 191640. [Google Scholar] [CrossRef]
  80. Brenes, J.C.; Lackinger, M.; Höglinger, G.U.; Schratt, G.; Schwarting, R.K.W.; Wöhr, M. Differential effects of social and physical environmental enrichment on brain plasticity, cognition, and ultrasonic communication in rats. J. Comp. Neurol. 2016, 524, 1586–1607. [Google Scholar] [CrossRef]
  81. Vindas, M.A.; Gorissen, M.; Höglund, E.; Flik, G.; Tronci, V.; Damsgård, B.; Thörnqvist, P.; Nilsen, T.O.; Winberg, S.; Øverli, Ø.; et al. How do individuals cope with stress? Behavioural, physiological and neuronal differences between proactive and reactive coping styles in fish. J. Exp. Biol. 2017, 220, 1524–1532. [Google Scholar] [CrossRef]
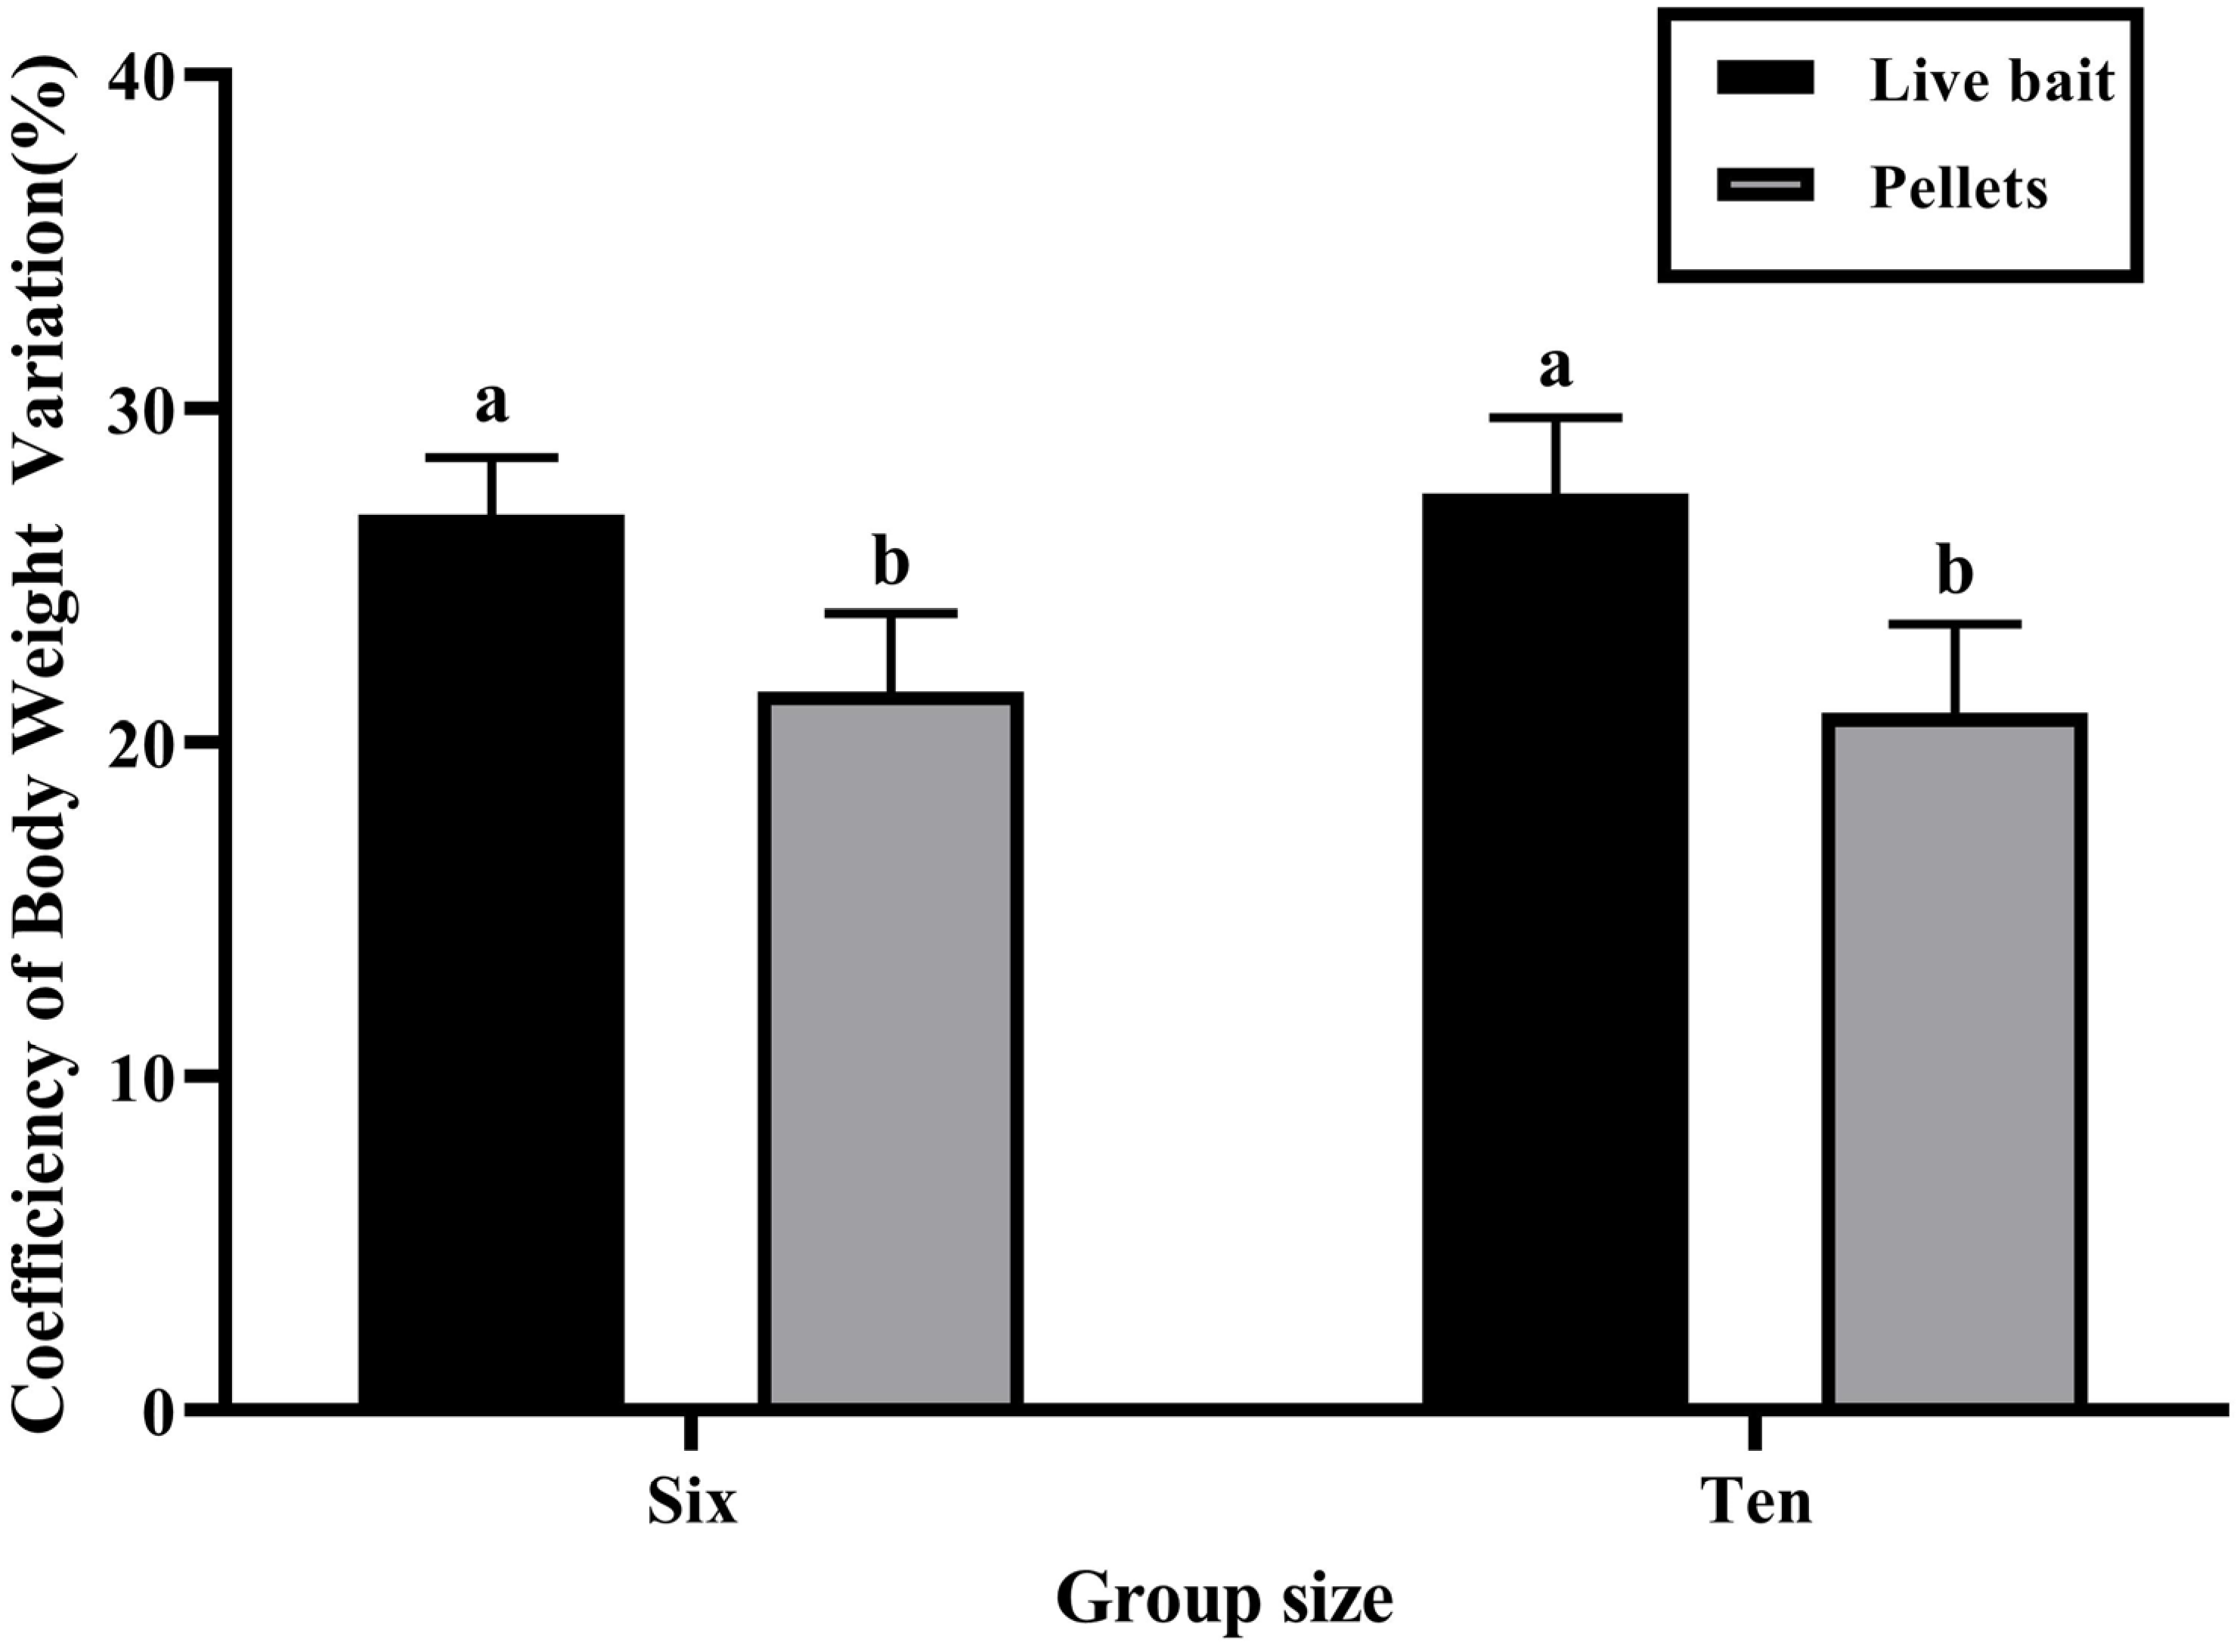
Figure 1. The coefficient of variation for body weight of black rockfish S. schlegelii reared in different environments for eight weeks. Live bait: During the test, the fish were fed with live North and South American white shrimp. Pellet: During the test, the fish were fed with pellets. Six: Each group consisted of six individuals. Ten: Each group consisted of ten individuals. Effect of bait type: F(1,24) = 20.41, p = 0.002. Effect of group size: F(1,24) ≈ 0, p = 0.096. Interaction effect: F(1,24) = 0.221, p = 0.651. Significant differences between groups, as determined by Tukey’s post-hoc test, are indicated by different lowercase letters.
Fishes 10 00242 g001
Figure 2. Measures of antioxidant capacity in black rockfish S. schlegelii throughout the experiment within specific treatment groups. (A) MDA levels, effect of bait type: F(1,24) = 5.387, p = 0.049; effect of group size: F(1,24) = 51.162, p < 0.001; interaction effect of bait type and group size: F(1,24) = 0.666, p = 0.438; (B) levels of CAT activity, effect of bait type: F(1,24) = 8.969, p = 0.017; effect of group size: F(1,24) = 112.842, p < 0.001; interaction effect of bait type and group size: F(1,24) = 0.350, p = 0.570; (C) levels of GSH-Px activity, effect of bait type: F(1,24) = 15.156, p = 0.005; effect of group size: F(1,24) = 245.567, p < 0.001; interaction effect of bait type and group size: F(1,24) = 14.322, p = 0.005; (D) levels of SOD activity, F(1,24) = 12.956, p = 0.007; effect of group size: F(1,24) = 2534.464, p < 0.001; interaction effect of bait type and group size: F(1,24) = 89.043, p < 0.001. Significant differences between groups, as determined by Tukey’s post-hoc test, are indicated by different lowercase letters.
Fishes 10 00242 g002
Figure 3. Levels of aggressive behavior in black rockfish S. schlegelii throughout the experiment within specific treatment groups. (A) Aggressive behavior outside of feeding times; effect of bait type: F(1,48) = 273.239, p < 0.001; effect of group size: F(1,48) = 75.721, p < 0.001; interaction effect: F(1,48) = 0.165, p = 0.695; (B) aggressive behavior during feeding, effect of bait type: F(1,48) = 649.945, p < 0.001; effect of group size: F(1,48) = 126.16, p < 0.001; interaction effect: F(1,48) = 1.806, p = 0.216. Significant differences between groups, as determined by Tukey’s post-hoc test, are indicated by different lowercase letters.
Fishes 10 00242 g003
Figure 4. Cortisol levels were measured in fish from different-sized groups (six and ten individuals) of S. schlegelii fed either live bait or pellets under both basal and stressed conditions. Live bait: During the test, the fish were fed with live North and South American white shrimp. Pellet: During the test, the fish were fed with pellets. Six: Each group consisted of six individuals. Ten: Each group consisted of ten individuals. Effect of bait type: F(1,48) = 0.03, p = 0.96; effect of group size: F(1,48) = 33.273, p < 0.001; effect of stress: F(1,48) = 9255.81, p < 0.001; interaction effect of bait type and group size: F(1,48) = 1.603, p = 0.224; interaction effect of bait type and stress: F(1,48) = 241.827, p < 0.001; interaction effect of group size and stress: F(1,48) = 12.826, p = 0.002; interaction effect: F(1,48) = 0.102, p = 0.754. Significant differences between groups, as determined by Tukey’s post-hoc test, are indicated by different lowercase letters.
Fishes 10 00242 g004
Figure 5. Levels of expression of genes linked to neurogenesis in black rockfish S. schlegelii throughout the experiment within specific treatment groups. (A) PCNA expression, effect of bait type: F(1,48) = 62.370, p < 0.001; effect of group size: F(1,48) = 2.181, p = 0.159; effect of stress: F(1,48) = 109.671, p < 0.001; interaction effect of bait type and group size: F(1,48) = 0.563, p = 0.464; interaction effect of bait type and stress: F(1,48) = 51.930, p < 0.001; interaction effect of group size and stress: F(1,48) = 0.512, p = 0.485; interaction effect: F(1,48) = 0.705, p = 0.413; (B) DCX expression, effect of bait type: F(1,48) = 11.340, p = 0.004; effect of group size: F(1,48) = 16.102, p = 0.001; effect of stress: F(1,48) = 44.185, p < 0.001; interaction effect of bait type and group size: F(1,48) = 0.365, p = 0.554; interaction effect of bait type and stress: F(1,48) = 8.726, p = 0.009; interaction effect of group size and stress: F(1,48) = 0.434, p = 0.520; interaction effect: F(1,48) = 0.800, p = 0.384; (C) NeuroD expression, effect of bait type: F(1,48) = 19.367, p < 0.001; effect of group size: F(1,48) = 5.223, p = 0.036; effect of stress: F(1,48) = 17.679, p = 0.001; interaction effect of bait type and group size: F(1,48) = 2.441, p = 0.138; interaction effect of bait type and stress: F(1,48) = 11.025, p = 0.004; interaction effect of group size and stress: F(1,48) = 0.571, p = 0.461; interaction effect: F(1,48) = 1.508, p = 0.237. Significant differences between groups, as indicated by Tukey’s post-hoc test, are indicated by different lowercase letters.
Fishes 10 00242 g005
Figure 6. Based on the combined data, correlation analysis revealed a strong relationship between cortisol levels, aggressive behavior, coefficient of variation for body weight, and neurogenic gene markers. (A) linear fit of coefficient of variation for body weight and aggressive behavior during rest: Pearson’s r = −0.7453; Adj.R2 = 0.5555; p = 0.0054; y = −1.241x + 43.56; (B) linear fit of coefficient of variation for body weight and aggressive behavior during feeding: Pearson’s r = −0.7610; Adj.R2 = 0.5791; p = 0.0040; y = −1.594x + 52.95; (C) linear fit of aggressive behavior during rest and basal cortisol level: Pearson’s r = 0.9801; Adj.R2 = 0.8246; p < 0.0001; y = 0.05634x + 0.08714; (D) linear fit of aggressive behavior during feeding and basal cortisol level: Pearson’s r = 0.9462; Adj.R2 = 0.8952; p < 0.0001; y = 0.04666x + 0.1788; (E) linear fit of basal cortisol level and level of cortisol under stress: Pearson’s r = −0.7439; Adj.R2 = 0.5534; p = 0.0055; y = −0.8759x + 5.969; (F) linear fit of aggressive behavior during feeding and aggressive behavior during rest: Pearson’s r = 0.9924; Adj.R2 = 0.9848; p < 0.0001; y = 0.7887x + 2.195; (G) linear fit of level of cortisol under stress and level of PCNA expression under stress: Pearson’s r = 0.6981; Adj.R2 = 0.4873; p = 0.0116; y = 4.397x − 18.47.
Fishes 10 00242 g006
Figure 7. Based on the combined data, correlation analysis revealed a correlation between cortisol levels, aggressive behavior, and neurogenic gene markers. (A) Pearson’s correlation between basal cortisol level and basal DCX expression: Pearson’s r = −0.07162; Adj.R2 = 0.005130; p = 0.8249; (B) Pearson’s correlation between basal cortisol level and basal NeuroD expression: Pearson’s r = −0.1521; Adj.R2 = 0.02314; p = 0.6370; (C) Pearson’s correlation between basal cortisol level and basal PCNA expression: Pearson’s r = −0.2782; Adj.R2 = 0.07740; p = 0.3813; (D) Pearson’s correlation between aggressive behavior during rest and level of cortisol under stress: Pearson’s r = −0.5114; Adj.R2 = 0.2616; p = 0.0892; (E) Pearson’s correlation between aggressive behavior during feeding and level of cortisol under stress: Pearson’s r = −0.5670; Adj.R2 = 0.3215; p = 0.0545; (F) Pearson’s correlation between level of cortisol under stress and DCX expression under stress: Pearson’s r = −0.4073; Adj.R2 = 0.1659; p = 0.1888; (G) Pearson’s correlation between level of cortisol under stress and expression of NeuroD under stress: Pearson’s r = 0.4230; Adj.R2 = 0.1789; p = 0.1707.
Fishes 10 00242 g007
Table 1. Effects of the different bait types and group size on the growth performance of black rockfish. The indicators in the table are as follows: WG = gain in body weight, FCR = food-conversion rate, CF = condition factor, SGR = standardized growth rate. Groups with different superscripts are not significantly different (p > 0.05). Data are presented as means ± S.E.
TreatmentIndicatorGroup Means ± SDFactorF Valuep Value
Bait TypeGroup Size
Live Bait SixWG1.862 ± 0.826Bait Type1.2440.297
Live Bait Ten2.145 ± 1.136
PelletSix2.286 ± 0.363Group Size0.6160.455
PelletTen2.669 ± 0.246
Interaction0.0140.909
Live Bait SixFCR1.240 ± 0.482Bait Type5.1640.053
Live Bait Ten1.174 ± 0.594
PelletSix1.578 ± 0.326Group Size0.7670.407
PelletTen2.149 ± 0.553
Interaction1.2170.302
Live Bait SixCF(%)2.297 ± 0.710Bait Type0.1390.719
Live Bait Ten2.001 ± 0.594
PelletSix2.364 ± 0.277Group Size0.6260.452
PelletTen2.166 ± 0.483
Interaction0.0260.877
Live Bait SixSGR(%)2.427 ± 0.768Bait Type1.8140.215
Live Bait Ten2.393 ± 0.725
PelletSix2.572 ± 0.198Group Size0.5990.461
PelletTen3.091 ± 0.158
Interaction0.7780.403
Disclaimer/Publisher’s Note: The statements, opinions and data contained in all publications are solely those of the individual author(s) and contributor(s) and not of MDPI and/or the editor(s). MDPI and/or the editor(s) disclaim responsibility for any injury to people or property resulting from any ideas, methods, instructions or products referred to in the content.